monthly portfolio disclosure - all · pdf filemonthly portfolio disclosure - all schemes...
TRANSCRIPT

Monthly Portfolio Disclosure - All Schemes
Scheme Name
HSBC Capital Protection Oriented Fund
HSBC Flexi Debt Fund
HSBC Floating Rate Fund - Long Term
HSBC Gilt Fund
HSBC Income Fund - Investment
HSBC MIP Fund - Regular Plan
HSBC MIP Fund - Savings Plan
HSBC Income Fund - Short Term
HSBC Ultra Short Term Bond Fund
HSBC Dynamic Fund
HSBC Equity Fund
HSBC India Opportunities Fund
HSBC Midcap Equity Fund
HSBC Progressive Themes Fund
HSBC Tax Saver Equity Fund
HSBC Dividend Yield Equity Fund
HSBC Fixed Term Series 100
HSBC Fixed Term Series 101
HSBC Fixed Term Series 102
HSBC Fixed Term Series 105
HSBC Fixed Term Series 106
HSBC Fixed Term Series 107
HSBC Fixed Term Series 109
HSBC Fixed Term Series 91
HSBC Fixed Term Series 94
HSBC Fixed Term Series 95
HSBC Fixed Term Series 96
HSBC Fixed Term Series 98
HSBC Fixed Term Series 99
HSBC Cash Fund
HSBC Asia Pacific (Ex Japan) Dividend Yield Fund
HSBC Brazil Fund
HSBC Emerging Markets Fund
HSBC Managed Solution India-Conservative
HSBC Managed Solutions India-Growth
HSBC Managed Solutions India-Moderate

Name of the Instrument ISIN Rating/Industries Quantity Market Value
(Rs in Lacs)
Percentage
to
Net AssetsDebt Instruments
Listed / Awaiting listing on Stock Exchanges
Power Finance Corporation Ltd.** INE134E08EQ4 CRISIL AAA 170 1,702.33 15.71
National Bank for Agriculture & Rural Development** INE261F09HL4 CRISIL AAA 150 1,504.22 13.88
Export Import Bank of India** INE514E08BC3 CRISIL AAA 148 1,483.75 13.69
LIC Housing Finance Ltd.** INE115A07CF0 CRISIL AAA 68 680.40 6.28
Power Grid Corporation of India Ltd.** INE752E07IA0 CRISIL AAA 40 501.65 4.63
Housing Development Finance Corporation Ltd.** INE001A07IL7 CRISIL AAA 50 501.46 4.63
Small Industries Development Bank of India** INE556F09353 CRISIL AAA 50 500.60 4.62
Power Grid Corporation of India Ltd.** INE752E07GR8 CRISIL AAA 40 499.82 4.61
Total 7,374.23 68.05
Privately Placed/Unlisted
Tata Sons Ltd.** INE895D08410 CRISIL AAA 50 500.71 4.62
Total 500.71 4.62
Money Market Instruments
Certificate of Deposit
Dena Bank** INE077A16CB2 CRISIL A1+ 490 472.40 4.36
Andhra Bank** INE434A16GU6 CARE A1+ 130 124.35 1.15
Syndicate Bank** INE667A16CU0 CARE A1+ 40 39.89 0.37
Total 636.64 5.88
Futures and Options
CALL NIFTY 25/06/2015 6100 1,915.18 17.67
Total 1,915.18 17.67
Reverse Repos / CBLOs 94.44 0.87
Total 94.44 0.87
Net Current Assets (including cash & bank balances) 316.91 2.91
Total Net Assets as on 31-Oct-2014 10,838.11 100.00
** Securities are classified as thinly traded / non traded on the date of valuation in accordance with SEBI Regulations and Guidelines.
This product is suitable for investors who are seeking*:
*Investors should consult their financial advisers if in doubt about whether the product is suitable for them.
Note: Risk may be represented as:
Mutual Fund investments are subject to market risks, read all scheme related documents carefully.
• Investment in Debt Instruments, Money Market Instruments and equities through Index Call Options
• Low risk (BLUE)
(BLUE) investors understand that their principal will be at low risk
(YELLOW) investors understand that their principal will be at medium risk
(BROWN) investors understand that their principal will be at high risk
Name of the Mutual Fund : HSBC Mutual Fund
Name of the Scheme : HSBC CAPITAL PROTECTION ORIENTED FUND (A close-ended Capital Protection Oriented Scheme)
Monthly Portfolio Statement as of October 31,2014
• Orientation towards Capital Protection over medium term

Name of the Instrument ISIN Rating/Industries Quantity Market Value
(Rs in Lacs)
Percentage
to
Net AssetsDebt Instruments
Listed / Awaiting listing on Stock Exchanges
Housing Development Finance Corporation Ltd.** INE001A07LJ5 CRISIL AAA 225 2,225.11 5.06
Rural Electrification Corporation Ltd.** INE020B08815 CARE AAA 150 1,498.06 3.41
Power Finance Corporation Ltd.** INE134E07406 CRISIL AAA 115 1,186.89 2.70
Total 4,910.06 11.17
Government Securities
8.60% GOVT OF INDIA RED 02-06-2028 IN0020140011 SOVEREIGN 8,170,000 8,322.17 18.94
8.40% GOVT OF INDIA RED 28-07-2024 IN0020140045 SOVEREIGN 8,110,000 8,173.29 18.60
9.20% GOVT OF INDIA RED 30-09-2030 IN0020130053 SOVEREIGN 6,030,000 6,468.51 14.72
8.35% GOVT OF INDIA RED 14-05-2022 IN0020020072 SOVEREIGN 3,005,000 2,996.56 6.82
8.30% GOVT OF INDIA RED 31-12-2042 IN0020120062 SOVEREIGN 2,955,000 2,938.74 6.69
8.27% GOVT OF INDIA RED- 09-06-2020 IN0020140029 SOVEREIGN 2,870,000 2,863.66 6.52
9.14% KARNATAKA SDL RED 28-05-2024 IN1920140010 SOVEREIGN 2,070,000 2,141.00 4.87
8.12% GOVT OF INDIA RED 10-12-2020 IN0020120054 SOVEREIGN 2,140,000 2,115.58 4.82
8.83% GOVT OF INDIA RED 25-11-2023 IN0020130061 SOVEREIGN 590,000 605.46 1.38
Total 36,624.96 83.36
Reverse Repos / CBLOs 1,450.48 3.30
Total 1,450.48 3.30
Net Current Assets (including cash & bank balances) 946.04 2.17
Total Net Assets as on 31-Oct-2014 43,931.54 100.00
** Securities are classified as thinly traded / non traded on the date of valuation in accordance with SEBI Regulations and Guidelines.
This product is suitable for investors who are seeking*:
*Investors should consult their financial advisers if in doubt about whether the product is suitable for them.
Note: Risk may be represented as:
Mutual Fund investments are subject to market risks, read all scheme related documents carefully.
• Investment in Debt/Money Market Instruments
• Low risk (BLUE)
(BLUE) investors understand that their principal will be at low risk
(YELLOW) investors understand that their principal will be at medium risk
(BROWN) investors understand that their principal will be at high risk
Name of the Mutual Fund : HSBC Mutual Fund
Name of the Scheme : HSBC FLEXI DEBT FUND (An open-ended Income Scheme)
Monthly Portfolio Statement as of October 31,2014
• Regular income over long term
Name of the Instrument ISIN Rating/Industries Quantity Market Value
(Rs in Lacs)
Percentage
to
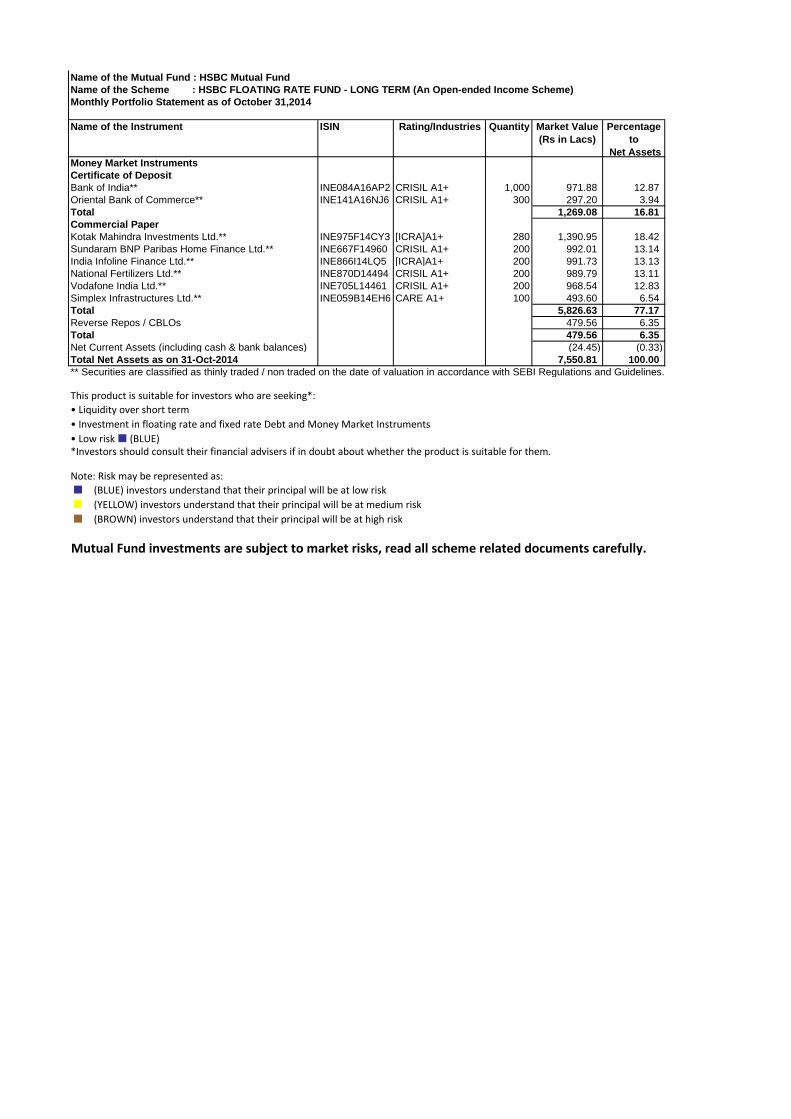
Net AssetsMoney Market Instruments
Certificate of Deposit
Bank of India** INE084A16AP2 CRISIL A1+ 1,000 971.88 12.87
Oriental Bank of Commerce** INE141A16NJ6 CRISIL A1+ 300 297.20 3.94
Total 1,269.08 16.81
Commercial Paper
Kotak Mahindra Investments Ltd.** INE975F14CY3 [ICRA]A1+ 280 1,390.95 18.42
Sundaram BNP Paribas Home Finance Ltd.** INE667F14960 CRISIL A1+ 200 992.01 13.14
India Infoline Finance Ltd.** INE866I14LQ5 [ICRA]A1+ 200 991.73 13.13
National Fertilizers Ltd.** INE870D14494 CRISIL A1+ 200 989.79 13.11
Vodafone India Ltd.** INE705L14461 CRISIL A1+ 200 968.54 12.83
Simplex Infrastructures Ltd.** INE059B14EH6 CARE A1+ 100 493.60 6.54
Total 5,826.63 77.17
Reverse Repos / CBLOs 479.56 6.35
Total 479.56 6.35
Net Current Assets (including cash & bank balances) (24.45) (0.33)
Total Net Assets as on 31-Oct-2014 7,550.81 100.00
** Securities are classified as thinly traded / non traded on the date of valuation in accordance with SEBI Regulations and Guidelines.
This product is suitable for investors who are seeking*:
*Investors should consult their financial advisers if in doubt about whether the product is suitable for them.
Note: Risk may be represented as:
Mutual Fund investments are subject to market risks, read all scheme related documents carefully.
• Investment in floating rate and fixed rate Debt and Money Market Instruments
• Low risk (BLUE)
(BLUE) investors understand that their principal will be at low risk
(YELLOW) investors understand that their principal will be at medium risk
(BROWN) investors understand that their principal will be at high risk
Name of the Mutual Fund : HSBC Mutual Fund
Name of the Scheme : HSBC FLOATING RATE FUND - LONG TERM (An Open-ended Income Scheme)
Monthly Portfolio Statement as of October 31,2014
• Liquidity over short term

Name of the Instrument ISIN Rating/Industries Quantity Market Value
(Rs in Lacs)
Percentage
to
Net AssetsGovernment Securities
8.60% GOVT OF INDIA RED 02-06-2028 IN0020140011 SOVEREIGN 71,667 73.00 24.82
8.40% GOVT OF INDIA RED 28-07-2024 IN0020140045 SOVEREIGN 70,000 70.55 23.99
8.30% GOVT OF INDIA RED 31-12-2042 IN0020120062 SOVEREIGN 55,000 54.70 18.60
9.20% GOVT OF INDIA RED 30-09-2030 IN0020130053 SOVEREIGN 30,000 32.18 10.94
9.14% KARNATAKA SDL RED 28-05-2024 IN1920140010 SOVEREIGN 20,000 20.69 7.03
8.83% GOVT OF INDIA RED 25-11-2023 IN0020130061 SOVEREIGN 5,000 5.13 1.74
Total 256.24 87.12
Reverse Repos / CBLOs 30.17 10.26
Total 30.17 10.26
Net Current Assets (including cash & bank balances) 7.67 2.62
Total Net Assets as on 31-Oct-2014 294.08 100.00
** Securities are classified as thinly traded / non traded on the date of valuation in accordance with SEBI Regulations and Guidelines.
This product is suitable for investors who are seeking*:
*Investors should consult their financial advisers if in doubt about whether the product is suitable for them.
Note: Risk may be represented as:
Mutual Fund investments are subject to market risks, read all scheme related documents carefully.
• Investment in Government Securities
• Low risk (BLUE)
(BLUE) investors understand that their principal will be at low risk
(YELLOW) investors understand that their principal will be at medium risk
(BROWN) investors understand that their principal will be at high risk
Name of the Mutual Fund : HSBC Mutual Fund
Name of the Scheme : HSBC GILT FUND (An open-ended Gilt Scheme)
Monthly Portfolio Statement as of October 31,2014
• Regular income over long term

Name of the Instrument ISIN Rating/Industries Quantity Market Value
(Rs in Lacs)
Percentage
to
Net AssetsDebt Instruments
Listed / Awaiting listing on Stock Exchanges
Export Import Bank of India** INE514E08DP1 CRISIL AAA 50 528.23 5.46
Rural Electrification Corporation Ltd.** INE020B07IA8 CRISIL AAA 50 514.55 5.32
Housing Development Finance Corporation Ltd.** INE001A07LJ5 CRISIL AAA 25 247.23 2.56
Power Finance Corporation Ltd.** INE134E07406 CRISIL AAA 8 82.57 0.85
Total 1,372.58 14.19
Government Securities
8.60% GOVT OF INDIA RED 02-06-2028 IN0020140011 SOVEREIGN 2,125,000 2,164.58 22.39
8.40% GOVT OF INDIA RED 28-07-2024 IN0020140045 SOVEREIGN 1,645,000 1,657.84 17.15
9.20% GOVT OF INDIA RED 30-09-2030 IN0020130053 SOVEREIGN 1,220,000 1,308.72 13.54
8.35% GOVT OF INDIA RED 14-05-2022 IN0020020072 SOVEREIGN 850,000 847.61 8.77
8.30% GOVT OF INDIA RED 31-12-2042 IN0020120062 SOVEREIGN 600,000 596.70 6.17
8.27% GOVT OF INDIA RED- 09-06-2020 IN0020140029 SOVEREIGN 430,000 429.05 4.44
9.14% KARNATAKA SDL RED 28-05-2024 IN1920140010 SOVEREIGN 310,000 320.63 3.32
8.12% GOVT OF INDIA RED 10-12-2020 IN0020120054 SOVEREIGN 205,000 202.66 2.10
8.83% GOVT OF INDIA RED 25-11-2023 IN0020130061 SOVEREIGN 90,000 92.36 0.96
5.59% GOVT OF INDIA RED 04-06-2016 IN0020040013 SOVEREIGN 400 0.38 -
Total 7,620.53 78.84
Securitised Debt
India MBS 2002 Series I** INE854F15045 CRISIL AAA (SO) 5 15.25 0.16
Total 15.25 0.16
Reverse Repos / CBLOs 382.79 3.96
Total 382.79 3.96
Net Current Assets (including cash & bank balances) 276.21 2.85
Total Net Assets as on 31-Oct-2014 9,667.36 100.00
** Securities are classified as thinly traded / non traded on the date of valuation in accordance with SEBI Regulations and Guidelines.
This product is suitable for investors who are seeking*:
*Investors should consult their financial advisers if in doubt about whether the product is suitable for them.
Note: Risk may be represented as:
Mutual Fund investments are subject to market risks, read all scheme related documents carefully.
• Investment in diversified portfolio of fixed income securities
• Low risk (BLUE)
(BLUE) investors understand that their principal will be at low risk
(YELLOW) investors understand that their principal will be at medium risk
(BROWN) investors understand that their principal will be at high risk
Name of the Mutual Fund : HSBC Mutual Fund
Name of the Scheme : HSBC INCOME FUND - INVESTMENT PLAN (An open-ended Income Scheme)
Monthly Portfolio Statement as of October 31,2014
• Regular income over long term

Name of the Instrument ISIN Rating/Industries Quantity Market Value
(Rs in Lacs)
Percentage
to
Net AssetsEquity & Equity Related Instruments
Listed / Awaiting listing on Stock Exchanges
Maruti Suzuki India Ltd. INE585B01010 AUTO 2,967 99.02 1.12
ICICI Bank Ltd. INE090A01013 BANKS 5,850 95.16 1.07
Shree Cements Ltd. INE070A01015 CEMENT 1,035 94.08 1.06
Tech Mahindra Ltd. INE669C01028 SOFTWARE 3,550 89.38 1.01
Axis Bank Ltd. INE238A01034 BANKS 20,000 87.88 0.99
Larsen & Toubro Ltd. INE018A01030 CONSTRUCTION PROJECT 5,300 87.74 0.99
Motherson Sumi Systems Ltd. INE775A01035 AUTO ANCILLARIES 17,237 72.47 0.82
Mcleod Russel India Ltd. INE942G01012 CONSUMER NON DURABLES 27,599 71.77 0.81
Karur Vysya Bank Ltd. INE036D01010 BANKS 10,450 56.99 0.64
ITC Ltd. INE154A01025 CONSUMER NON DURABLES 15,999 56.83 0.64
IPCA Laboratories Ltd. INE571A01020 PHARMACEUTICALS 6,700 49.00 0.55
MRF Ltd. INE883A01011 AUTO ANCILLARIES 150 46.97 0.53
Grasim Industries Ltd. INE047A01013 CEMENT 1,300 45.60 0.51
Supreme Industries Ltd. INE195A01028 INDUSTRIAL PRODUCTS 7,586 45.50 0.51
Arvind Ltd. INE034A01011 TEXTILE PRODUCTS 15,000 44.74 0.51
LIC Housing Finance Ltd. INE115A01026 FINANCE 12,000 43.45 0.49
Amara Raja Batteries Ltd. INE885A01032 AUTO ANCILLARIES 6,616 43.31 0.49
The Jammu & Kashmir Bank Ltd. INE168A01041 BANKS 28,000 38.88 0.44
Crompton Greaves Ltd. INE067A01029 INDUSTRIAL CAPITAL GOODS 20,000 37.70 0.43
Oil & Natural Gas Corporation Ltd. INE213A01029 OIL 8,500 34.44 0.39
Orient Refractories Ltd. INE743M01012 INDUSTRIAL PRODUCTS 34,355 33.79 0.38
CESC Ltd. INE486A01013 POWER 4,000 27.12 0.31
Finolex Industries Ltd. INE183A01016 INDUSTRIAL PRODUCTS 8,000 25.67 0.29
Jaiprakash Associates Ltd. INE455F01025 CONSTRUCTION 50,000 15.58 0.18
Hindustan Dorr-Oliver Ltd. INE551A01022 ENGINEERING SERVICES 67,500 9.55 0.11
Total 1,352.61 15.27
Debt Instruments
Listed / Awaiting listing on Stock Exchanges
Rural Electrification Corporation Ltd.** INE020B07IA8 CRISIL AAA 50 514.55 5.81
Power Finance Corporation Ltd.** INE134E08EW2 CRISIL AAA 50 505.80 5.71
LIC Housing Finance Ltd.** INE115A07DR3 CRISIL AAA 50 501.68 5.66
Power Finance Corporation Ltd.** INE134E07406 CRISIL AAA 5 51.60 0.58
Total 1,573.63 17.76
Government Securities
8.40% GOVT OF INDIA RED 28-07-2024 IN0020140045 SOVEREIGN 1,100,000 1,108.58 12.52
9.20% GOVT OF INDIA RED 30-09-2030 IN0020130053 SOVEREIGN 955,000 1,024.45 11.57
8.60% GOVT OF INDIA RED 02-06-2028 IN0020140011 SOVEREIGN 880,000 896.39 10.12
8.35% GOVT OF INDIA RED 14-05-2022 IN0020020072 SOVEREIGN 740,000 737.92 8.33
8.30% GOVT OF INDIA RED 31-12-2042 IN0020120062 SOVEREIGN 470,000 467.41 5.28
8.27% GOVT OF INDIA RED- 09-06-2020 IN0020140029 SOVEREIGN 445,000 444.02 5.01
9.14% KARNATAKA SDL RED 28-05-2024 IN1920140010 SOVEREIGN 350,000 362.01 4.09
8.12% GOVT OF INDIA RED 10-12-2020 IN0020120054 SOVEREIGN 235,000 232.32 2.62
8.83% GOVT OF INDIA RED 25-11-2023 IN0020130061 SOVEREIGN 115,000 118.01 1.33
Total 5,391.11 60.87
Reverse Repos / CBLOs 464.13 5.24
Total 464.13 5.24
Net Current Assets (including cash & bank balances) 74.81 0.86
Total Net Assets as on 31-Oct-2014 8,856.30 100.00
** Securities are classified as thinly traded / non traded on the date of valuation in accordance with SEBI Regulations and Guidelines.
This product is suitable for investors who are seeking*:
*Investors should consult their financial advisers if in doubt about whether the product is suitable for them.
Note: Risk may be represented as:
Mutual Fund investments are subject to market risks, read all scheme related documents carefully.
• Investment in fixed income (debt and money market instruments) as well as equity and equity related securities
• Medium risk (YELLOW)
(BLUE) investors understand that their principal will be at low risk
(YELLOW) investors understand that their principal will be at medium risk
(BROWN) investors understand that their principal will be at high risk
Name of the Mutual Fund : HSBC Mutual Fund
Name of the Scheme : HSBC MIP - REGULAR PLAN (An open-ended Scheme)
Monthly Portfolio Statement as of October 31,2014
• Regular income over medium term
Name of the Instrument ISIN Rating/Industries Quantity Market Value
(Rs in Lacs)
Percentage
to
Net AssetsEquity & Equity Related Instruments
Listed / Awaiting listing on Stock Exchanges
ICICI Bank Ltd. INE090A01013 BANKS 18,450 300.12 1.64
Shree Cements Ltd. INE070A01015 CEMENT 3,132 284.69 1.55
Larsen & Toubro Ltd. INE018A01030 CONSTRUCTION PROJECT 16,500 273.15 1.49
Maruti Suzuki India Ltd. INE585B01010 AUTO 7,750 258.64 1.41
Axis Bank Ltd. INE238A01034 BANKS 56,000 246.06 1.34
IndusInd Bank Ltd. INE095A01012 BANKS 30,500 219.63 1.20
Mcleod Russel India Ltd. INE942G01012 CONSUMER NON DURABLES 81,840 212.82 1.16
LIC Housing Finance Ltd. INE115A01026 FINANCE 57,000 206.37 1.12
Motherson Sumi Systems Ltd. INE775A01035 AUTO ANCILLARIES 48,773 205.07 1.12
ITC Ltd. INE154A01025 CONSUMER NON DURABLES 52,500 186.48 1.02
Crompton Greaves Ltd. INE067A01029 INDUSTRIAL CAPITAL GOODS 97,000 182.85 1.00
Supreme Industries Ltd. INE195A01028 INDUSTRIAL PRODUCTS 28,683 172.04 0.94
Tech Mahindra Ltd. INE669C01028 SOFTWARE 6,300 158.62 0.86
The Ramco Cements Ltd. INE331A01037 CEMENT 44,112 152.08 0.83
Grasim Industries Ltd. INE047A01013 CEMENT 4,050 142.08 0.77
HDFC Bank Ltd. INE040A01026 BANKS 15,500 141.34 0.77
IPCA Laboratories Ltd. INE571A01020 PHARMACEUTICALS 18,700 136.75 0.75
Amara Raja Batteries Ltd. INE885A01032 AUTO ANCILLARIES 20,604 134.88 0.74
MRF Ltd. INE883A01011 AUTO ANCILLARIES 410 128.39 0.70
Oil & Natural Gas Corporation Ltd. INE213A01029 OIL 27,500 111.42 0.61
CESC Ltd. INE486A01013 POWER 16,000 108.49 0.59
Arvind Ltd. INE034A01011 TEXTILE PRODUCTS 35,000 104.39 0.57
Lupin Ltd. INE326A01037 PHARMACEUTICALS 7,500 102.68 0.56
Karur Vysya Bank Ltd. INE036D01010 BANKS 18,550 101.17 0.55
Finolex Industries Ltd. INE183A01016 INDUSTRIAL PRODUCTS 26,000 83.43 0.45
The Jammu & Kashmir Bank Ltd. INE168A01041 BANKS 60,000 83.31 0.45
Orient Refractories Ltd. INE743M01012 INDUSTRIAL PRODUCTS 73,797 72.58 0.40
Jaiprakash Associates Ltd. INE455F01025 CONSTRUCTION 140,000 43.61 0.24
Hindustan Dorr-Oliver Ltd. INE551A01022 ENGINEERING SERVICES 225,000 31.84 0.17
Total 4,584.96 25.00
Debt Instruments
Listed / Awaiting listing on Stock Exchanges
Rural Electrification Corporation Ltd.** INE020B07IA8 CRISIL AAA 50 514.55 2.80
Power Finance Corporation Ltd.** INE134E08EW2 CRISIL AAA 50 505.80 2.76
LIC Housing Finance Ltd.** INE115A07DR3 CRISIL AAA 50 501.68 2.73
Power Finance Corporation Ltd.** INE134E07406 CRISIL AAA 22 227.06 1.24
Total 1,749.08 9.53
Government Securities
8.40% GOVT OF INDIA RED 28-07-2024 IN0020140045 SOVEREIGN 2,575,000 2,595.10 14.14
9.20% GOVT OF INDIA RED 30-09-2030 IN0020130053 SOVEREIGN 2,265,000 2,429.71 13.24
8.60% GOVT OF INDIA RED 02-06-2028 IN0020140011 SOVEREIGN 2,253,333 2,295.30 12.51
8.35% GOVT OF INDIA RED 14-05-2022 IN0020020072 SOVEREIGN 905,000 902.46 4.92
9.14% KARNATAKA SDL RED 28-05-2024 IN1920140010 SOVEREIGN 750,000 775.73 4.23
8.27% GOVT OF INDIA RED- 09-06-2020 IN0020140029 SOVEREIGN 755,000 753.33 4.11
8.30% GOVT OF INDIA RED 31-12-2042 IN0020120062 SOVEREIGN 420,000 417.69 2.28
8.12% GOVT OF INDIA RED 10-12-2020 IN0020120054 SOVEREIGN 420,000 415.21 2.26
8.83% GOVT OF INDIA RED 25-11-2023 IN0020130061 SOVEREIGN 200,000 205.24 1.12
Total 10,789.76 58.81
Reverse Repos / CBLOs 948.71 5.17
Total 948.71 5.17
Net Current Assets (including cash & bank balances) 276.18 1.49
Total Net Assets as on 31-Oct-2014 18,348.69 100.00
** Securities are classified as thinly traded / non traded on the date of valuation in accordance with SEBI Regulations and Guidelines.
This product is suitable for investors who are seeking*:
*Investors should consult their financial advisers if in doubt about whether the product is suitable for them.
Note: Risk may be represented as:
Mutual Fund investments are subject to market risks, read all scheme related documents carefully.
• Investment in fixed income (debt and money market instruments) as well as equity and equity related securities
• Medium risk (YELLOW)
(BLUE) investors understand that their principal will be at low risk
(YELLOW) investors understand that their principal will be at medium risk
(BROWN) investors understand that their principal will be at high risk
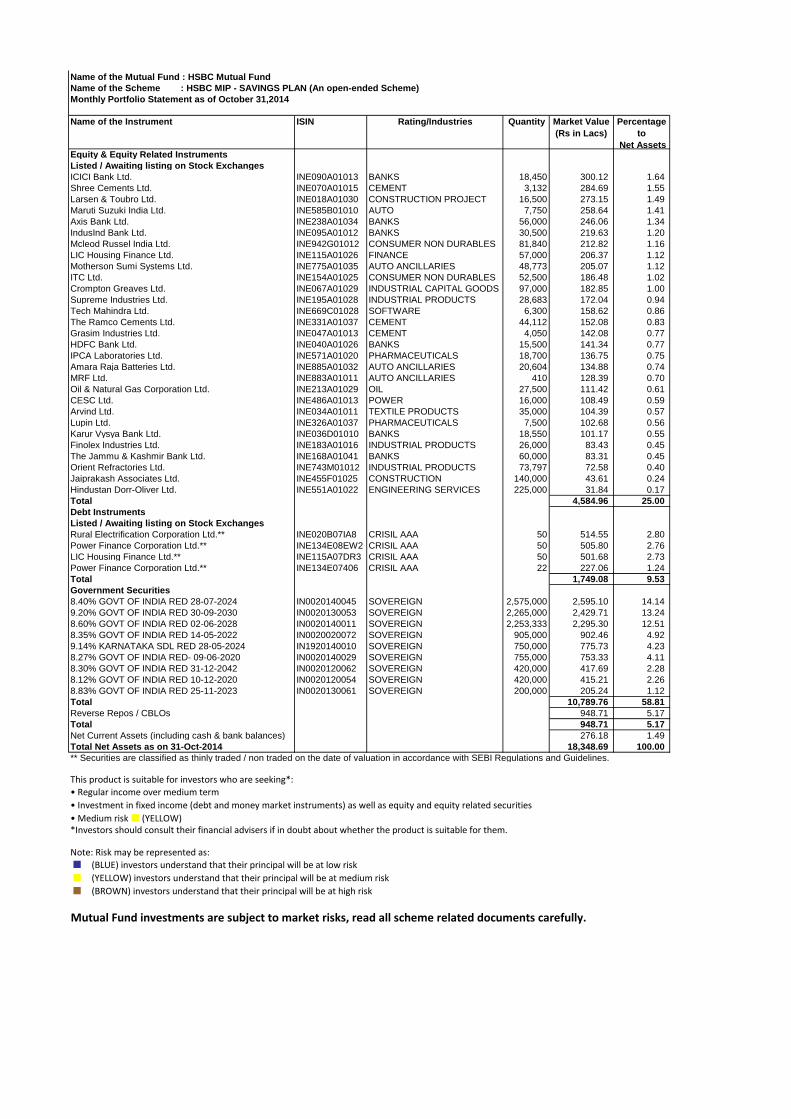
Name of the Mutual Fund : HSBC Mutual Fund
Name of the Scheme : HSBC MIP - SAVINGS PLAN (An open-ended Scheme)
Monthly Portfolio Statement as of October 31,2014
• Regular income over medium term

Name of the Instrument ISIN Rating/Industries Quantity Market Value
(Rs in Lacs)
Percentage
to
Net AssetsDebt Instruments
Listed / Awaiting listing on Stock Exchanges
Shriram Transport Finance Company Ltd.** INE721A07HH0 CRISIL AA 500,000 5,015.16 5.92
Export Import Bank of India** INE514E08DD7 CRISIL AAA 400 4,136.32 4.88
Rural Electrification Corporation Ltd.^ INE020B08773 CRISIL AAA 400 4,060.12 4.79
Power Finance Corporation Ltd.** INE134E08EW2 CRISIL AAA 400 4,046.40 4.77
Kotak Mahindra Prime Ltd.** INE916DA7DV4 [ICRA]AAA 350 3,520.59 4.15
LIC Housing Finance Ltd.** INE115A07EH2 CRISIL AAA 250 2,566.37 3.03
Housing Development Finance Corporation Ltd.** INE001A07MG9 CRISIL AAA 250 2,560.53 3.02
Kotak Mahindra Prime Ltd.** INE916DA7DI1 [ICRA]AAA 250 2,525.25 2.98
Power Finance Corporation Ltd.** INE134E08FY5 CRISIL AAA 250 2,519.51 2.97
Housing Development Finance Corporation Ltd.** INE001A07GM9 CRISIL AAA 250 2,519.28 2.97
Kotak Mahindra Prime Ltd.** INE916DA7EC2 [ICRA]AAA 250 2,509.91 2.96
SRF Ltd.** INE647A07025 Fitch AA 250 2,505.93 2.96
Rural Electrification Corporation Ltd.** INE020B07IA8 CRISIL AAA 150 1,543.65 1.82
Kotak Mahindra Prime Ltd.** INE916DA7865 CRISIL AAA 150 1,527.02 1.80
LIC Housing Finance Ltd.** INE115A07FG1 CRISIL AAA 150 1,522.19 1.80
Power Grid Corporation of India Ltd.** INE752E07GH9 CRISIL AAA 120 1,510.69 1.78
Power Finance Corporation Ltd.** INE134E08GB1 CRISIL AAA 150 1,509.85 1.78
Power Grid Corporation of India Ltd.** INE752E07LA4 CRISIL AAA 150 1,499.56 1.77
LIC Housing Finance Ltd.** INE115A07CX3 CRISIL AAA 100 1,014.98 1.20
Power Grid Corporation of India Ltd.** INE752E07KC2 CRISIL AAA 80 1,008.48 1.19
Rural Electrification Corporation Ltd.** INE020B08815 CARE AAA 100 998.71 1.18
Power Finance Corporation Ltd.** INE134E07398 CRISIL AAA 60 611.01 0.72
Rural Electrification Corporation Ltd.** INE020B07II1 CRISIL AAA 50 509.07 0.60
LIC Housing Finance Ltd.** INE115A07BO4 CRISIL AAA 50 507.22 0.60
Power Grid Corporation of India Ltd.** INE752E07JP6 CRISIL AAA 40 505.62 0.60
National Bank for Agriculture & Rural Development** INE261F09HF6 CRISIL AAA 36 361.50 0.43
Power Finance Corporation Ltd.** INE134E08EQ4 CRISIL AAA 30 300.41 0.35
Shriram Transport Finance Company Ltd.** INE721A07GR1 CRISIL AA 27,000 275.05 0.32
Rural Electrification Corporation Ltd.** INE020B07HW4 CRISIL AAA 17 171.42 0.20
LIC Housing Finance Ltd.** INE115A07CV7 CRISIL AAA 14 140.39 0.17
Export Import Bank of India** INE514E08BC3 CRISIL AAA 12 120.30 0.14
Rural Electrification Corporation Ltd.** INE020B08609 CRISIL AAA 10 101.32 0.12
Housing Development Finance Corporation Ltd.** INE001A07LU2 CRISIL AAA 9 91.25 0.11
LIC Housing Finance Ltd.** INE115A07EM2 CARE AAA 9 90.77 0.11
National Bank for Agriculture & Rural Development** INE261F09GP7 CRISIL AAA 5 50.79 0.06
Total 54,456.58 64.25
Privately Placed/Unlisted
Tata Sons Ltd.** INE895D07362 CRISIL AAA 200 2,023.83 2.39
Total 2,023.83 2.39
Government Securities
8.27% GOVT OF INDIA RED- 09-06-2020 IN0020140029 SOVEREIGN 2,000,000 1,995.58 2.35
8.35% GOVT OF INDIA RED 14-05-2022 IN0020020072 SOVEREIGN 1,000,000 997.19 1.18
8.12% GOVT OF INDIA RED 10-12-2020 IN0020120054 SOVEREIGN 1,000,000 988.59 1.17
Total 3,981.36 4.70
Money Market Instruments
Certificate of Deposit
State Bank of Patiala** INE652A16IO2 [ICRA]A1+ 2,500 2,475.23 2.92
Corporation Bank** INE112A16FE4 CRISIL A1+ 2,500 2,430.24 2.87
Corporation Bank** INE112A16FF1 CRISIL A1+ 2,500 2,428.05 2.86
Punjab National Bank^ INE160A16JT3 Fitch A1+ 2,100 2,042.84 2.41
Bank of Baroda** INE028A16AE3 [ICRA]A1+ 1,500 1,458.80 1.72
Canara Bank** INE476A16MX9 CRISIL A1+ 1,100 1,067.60 1.26
Indian Overseas Bank** INE565A16962 [ICRA]A1+ 1,000 970.18 1.14
Axis Bank Ltd.** INE238A16VM7 CRISIL A1+ 240 235.61 0.28
Corporation Bank** INE112A16FZ9 CRISIL A1+ 220 210.48 0.25
State Bank of Patiala** INE652A16IH6 [ICRA]A1+ 130 129.12 0.15
Oriental Bank of Commerce** INE141A16NC1 CRISIL A1+ 130 129.11 0.15
Yes Bank Ltd.** INE528G16XY9 [ICRA]A1+ 100 95.59 0.11
Yes Bank Ltd.** INE528G16XF8 CARE A1+ 25 24.22 0.03
Total 13,697.06 16.15
Commercial Paper
National Fertilizers Ltd.** INE870D14502 CRISIL A1+ 500 2,468.11 2.91
Vodafone India Ltd.** INE705L14461 CRISIL A1+ 500 2,421.35 2.86
Fullerton India Credit Co. Ltd.** INE535H14EV3 [ICRA]A1+ 500 2,304.19 2.72
Kotak Mahindra Investments Ltd.** INE975F14CW7 [ICRA]A1+ 140 692.69 0.82
Total 7,886.34 9.31
Reverse Repos / CBLOs 1,018.77 1.20
Total 1,018.77 1.20
Net Current Assets (including cash & bank balances) 1,703.89 2.00
Total Net Assets as on 31-Oct-2014 84,767.84 100.00
** Securities are classified as thinly traded / non traded on the date of valuation in accordance with SEBI Regulations and Guidelines.
^ Traded has been classified on the basis of Traded data provided by CRISIL and ICRA.
This product is suitable for investors who are seeking*:
*Investors should consult their financial advisers if in doubt about whether the product is suitable for them.
Note: Risk may be represented as:
Mutual Fund investments are subject to market risks, read all scheme related documents carefully.
• Investment in diversified portfolio of fixed income securities
• Low risk (BLUE)
(BLUE) investors understand that their principal will be at low risk
(YELLOW) investors understand that their principal will be at medium risk
(BROWN) investors understand that their principal will be at high risk
Name of the Mutual Fund : HSBC Mutual Fund
Name of the Scheme : HSBC INCOME FUND - SHORT TERM PLAN (An Open-ended Income Scheme)
Monthly Portfolio Statement as of October 31,2014
• Regular income over medium term
Name of the Instrument ISIN Rating/Industries Quantity Market Value
(Rs in Lacs)
Percentage
to
Net AssetsDebt Instruments
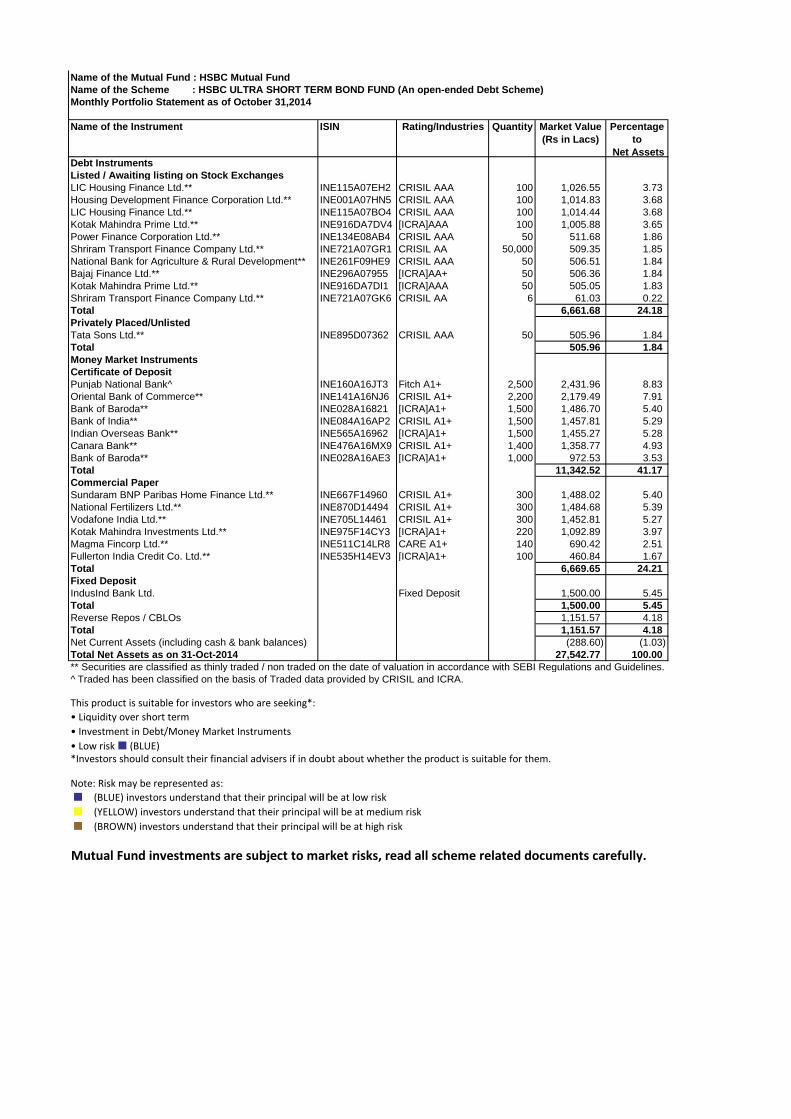
Listed / Awaiting listing on Stock Exchanges
LIC Housing Finance Ltd.** INE115A07EH2 CRISIL AAA 100 1,026.55 3.73
Housing Development Finance Corporation Ltd.** INE001A07HN5 CRISIL AAA 100 1,014.83 3.68
LIC Housing Finance Ltd.** INE115A07BO4 CRISIL AAA 100 1,014.44 3.68
Kotak Mahindra Prime Ltd.** INE916DA7DV4 [ICRA]AAA 100 1,005.88 3.65
Power Finance Corporation Ltd.** INE134E08AB4 CRISIL AAA 50 511.68 1.86
Shriram Transport Finance Company Ltd.** INE721A07GR1 CRISIL AA 50,000 509.35 1.85
National Bank for Agriculture & Rural Development** INE261F09HE9 CRISIL AAA 50 506.51 1.84
Bajaj Finance Ltd.** INE296A07955 [ICRA]AA+ 50 506.36 1.84
Kotak Mahindra Prime Ltd.** INE916DA7DI1 [ICRA]AAA 50 505.05 1.83
Shriram Transport Finance Company Ltd.** INE721A07GK6 CRISIL AA 6 61.03 0.22
Total 6,661.68 24.18
Privately Placed/Unlisted
Tata Sons Ltd.** INE895D07362 CRISIL AAA 50 505.96 1.84
Total 505.96 1.84
Money Market Instruments
Certificate of Deposit
Punjab National Bank^ INE160A16JT3 Fitch A1+ 2,500 2,431.96 8.83
Oriental Bank of Commerce** INE141A16NJ6 CRISIL A1+ 2,200 2,179.49 7.91
Bank of Baroda** INE028A16821 [ICRA]A1+ 1,500 1,486.70 5.40
Bank of India** INE084A16AP2 CRISIL A1+ 1,500 1,457.81 5.29
Indian Overseas Bank** INE565A16962 [ICRA]A1+ 1,500 1,455.27 5.28
Canara Bank** INE476A16MX9 CRISIL A1+ 1,400 1,358.77 4.93
Bank of Baroda** INE028A16AE3 [ICRA]A1+ 1,000 972.53 3.53
Total 11,342.52 41.17
Commercial Paper
Sundaram BNP Paribas Home Finance Ltd.** INE667F14960 CRISIL A1+ 300 1,488.02 5.40
National Fertilizers Ltd.** INE870D14494 CRISIL A1+ 300 1,484.68 5.39
Vodafone India Ltd.** INE705L14461 CRISIL A1+ 300 1,452.81 5.27
Kotak Mahindra Investments Ltd.** INE975F14CY3 [ICRA]A1+ 220 1,092.89 3.97
Magma Fincorp Ltd.** INE511C14LR8 CARE A1+ 140 690.42 2.51
Fullerton India Credit Co. Ltd.** INE535H14EV3 [ICRA]A1+ 100 460.84 1.67
Total 6,669.65 24.21
Fixed Deposit
IndusInd Bank Ltd. Fixed Deposit 1,500.00 5.45
Total 1,500.00 5.45
Reverse Repos / CBLOs 1,151.57 4.18
Total 1,151.57 4.18
Net Current Assets (including cash & bank balances) (288.60) (1.03)
Total Net Assets as on 31-Oct-2014 27,542.77 100.00
** Securities are classified as thinly traded / non traded on the date of valuation in accordance with SEBI Regulations and Guidelines.
^ Traded has been classified on the basis of Traded data provided by CRISIL and ICRA.
This product is suitable for investors who are seeking*:
*Investors should consult their financial advisers if in doubt about whether the product is suitable for them.
Note: Risk may be represented as:
Mutual Fund investments are subject to market risks, read all scheme related documents carefully.
• Investment in Debt/Money Market Instruments
• Low risk (BLUE)
(BLUE) investors understand that their principal will be at low risk
(YELLOW) investors understand that their principal will be at medium risk
(BROWN) investors understand that their principal will be at high risk
Name of the Mutual Fund : HSBC Mutual Fund
Name of the Scheme : HSBC ULTRA SHORT TERM BOND FUND (An open-ended Debt Scheme)
Monthly Portfolio Statement as of October 31,2014
• Liquidity over short term

Name of the Instrument ISIN Rating/Industries Quantity Market Value
(Rs in Lacs)
Percentage
to
Net AssetsEquity & Equity Related Instruments
Listed / Awaiting listing on Stock Exchanges
ICICI Bank Ltd. INE090A01013 BANKS 32,000 520.53 7.58
Axis Bank Ltd. INE238A01034 BANKS 85,000 373.49 5.44
ITC Ltd. INE154A01025 CONSUMER NON DURABLES 95,000 337.44 4.92
HDFC Bank Ltd. INE040A01026 BANKS 35,000 319.15 4.65
Dr. Reddy's Laboratories Ltd. INE089A01023 PHARMACEUTICALS 10,000 316.83 4.62
Tata Motors Ltd. INE155A01022 AUTO 55,000 294.72 4.29
Tata Consultancy Services Ltd. INE467B01029 SOFTWARE 11,000 286.86 4.18
HCL Technologies Ltd. INE860A01027 SOFTWARE 17,500 281.47 4.10
Larsen & Toubro Ltd. INE018A01030 CONSTRUCTION PROJECT 15,000 248.32 3.62
Oil & Natural Gas Corporation Ltd. INE213A01029 OIL 60,000 243.09 3.54
Maruti Suzuki India Ltd. INE585B01010 AUTO 6,500 216.92 3.16
Bharat Petroleum Corporation Ltd. INE029A01011 PETROLEUM PRODUCTS 25,000 181.19 2.64
Power Grid Corporation of India Ltd. INE752E01010 POWER 120,000 174.96 2.55
Sesa Sterlite Ltd. INE205A01025 MINERALS/MINING 50,000 127.98 1.86
ACC Ltd. INE012A01025 CEMENT 8,000 119.94 1.75
Yes Bank Ltd. INE528G01019 BANKS 17,000 116.37 1.70
Adani Ports & Special Economic Zone Ltd. INE742F01042 TRANSPORTATION 40,000 114.26 1.66
Bharti Airtel Ltd. INE397D01024 TELECOM - SERVICES 27,000 107.70 1.57
Jindal Steel & Power Ltd. INE749A01030 FERROUS METALS 60,000 97.08 1.41
Hindustan Unilever Ltd. INE030A01027 CONSUMER NON DURABLES 10,000 73.84 1.08
Total 4,552.12 66.32
Reverse Repos / CBLOs 2,354.84 34.31
Total 2,354.84 34.31
Net Current Assets (including cash & bank balances) (43.14) (0.63)
Total Net Assets as on 31-Oct-2014 6,863.83 100.00
** Securities are classified as thinly traded / non traded on the date of valuation in accordance with SEBI Regulations and Guidelines.
This product is suitable for investors who are seeking*:
*Investors should consult their financial advisers if in doubt about whether the product is suitable for them.
Note: Risk may be represented as:
Mutual Fund investments are subject to market risks, read all scheme related documents carefully.
• Investment in equity and equity related securities and in debt instruments when view on equity markets is negative
• High risk (BROWN)
(BLUE) investors understand that their principal will be at low risk
(YELLOW) investors understand that their principal will be at medium risk
(BROWN) investors understand that their principal will be at high risk
Name of the Mutual Fund : HSBC Mutual Fund
Name of the Scheme : HSBC DYNAMIC FUND (An open-ended Scheme)
Monthly Portfolio Statement as of October 31,2014
• To create wealth over long term

Name of the Instrument ISIN Rating/Industries Quantity Market Value
(Rs in Lacs)
Percentage
to
Net AssetsEquity & Equity Related Instruments
Listed / Awaiting listing on Stock Exchanges
ICICI Bank Ltd. INE090A01013 BANKS 325,000 5,286.61 8.21
Axis Bank Ltd. INE238A01034 BANKS 875,000 3,844.75 5.97
Tata Motors Ltd. INE155A01022 AUTO 600,000 3,215.10 4.99
ITC Ltd. INE154A01025 CONSUMER NON DURABLES 900,000 3,196.80 4.96
Oil & Natural Gas Corporation Ltd. INE213A01029 OIL 750,000 3,038.63 4.72
HCL Technologies Ltd. INE860A01027 SOFTWARE 180,000 2,895.12 4.49
Maruti Suzuki India Ltd. INE585B01010 AUTO 85,000 2,836.66 4.40
HDFC Bank Ltd. INE040A01026 BANKS 300,000 2,735.55 4.25
Tech Mahindra Ltd. INE669C01028 SOFTWARE 100,000 2,517.70 3.91
Larsen & Toubro Ltd. INE018A01030 CONSTRUCTION PROJECT 150,000 2,483.18 3.85
Yes Bank Ltd. INE528G01019 BANKS 350,000 2,395.75 3.72
Infosys Ltd. INE009A01021 SOFTWARE 50,000 2,025.63 3.14
Sesa Sterlite Ltd. INE205A01025 MINERALS/MINING 750,000 1,919.63 2.98
Wipro Ltd. INE075A01022 SOFTWARE 300,000 1,691.10 2.62
Motherson Sumi Systems Ltd. INE775A01035 AUTO ANCILLARIES 400,000 1,681.80 2.61
State Bank of India INE062A01012 BANKS 60,000 1,621.68 2.52
Dr. Reddy's Laboratories Ltd. INE089A01023 PHARMACEUTICALS 50,000 1,584.15 2.46
Adani Ports & Special Economic Zone Ltd. INE742F01042 TRANSPORTATION 550,000 1,571.08 2.44
ACC Ltd. INE012A01025 CEMENT 100,000 1,499.25 2.33
LIC Housing Finance Ltd. INE115A01026 FINANCE 400,000 1,448.20 2.25
Glenmark Pharmaceuticals Ltd. INE935A01035 PHARMACEUTICALS 200,000 1,436.10 2.23
IRB Infrastructure Developers Ltd. INE821I01014 CONSTRUCTION 550,000 1,386.83 2.15
Punjab National Bank INE160A01014 BANKS 125,000 1,163.56 1.81
Bank of Baroda INE028A01013 BANKS 125,000 1,161.88 1.80
Jindal Steel & Power Ltd. INE749A01030 FERROUS METALS 640,000 1,035.52 1.61
Lupin Ltd. INE326A01037 PHARMACEUTICALS 75,000 1,026.79 1.59
Bharat Petroleum Corporation Ltd. INE029A01011 PETROLEUM PRODUCTS 125,000 905.94 1.41
Tata Steel Ltd. INE081A01012 FERROUS METALS 175,000 857.50 1.33
Cairn India Ltd. INE910H01017 OIL 300,000 855.45 1.33
Rural Electrification Corporation Ltd. INE020B01018 FINANCE 250,000 755.00 1.17
Power Grid Corporation of India Ltd. INE752E01010 POWER 500,000 729.00 1.13
Tata Consultancy Services Ltd. INE467B01029 SOFTWARE 25,000 651.96 1.01
NTPC Ltd. INE733E01010 POWER 400,000 600.40 0.93
Reliance Industries Ltd. INE002A01018 PETROLEUM PRODUCTS 50,000 500.28 0.78
Sun TV Network Ltd. INE424H01027 MEDIA & ENTERTAINMENT 150,000 489.83 0.76
Crompton Greaves Ltd. INE067A01029 INDUSTRIAL CAPITAL GOODS 150,000 282.75 0.44
Housing Development Finance Corporation Ltd. INE001A01036 FINANCE 25,000 276.48 0.43
Jaiprakash Associates Ltd. INE455F01025 CONSTRUCTION 750,000 233.63 0.36
Total 63,837.22 99.09
Reverse Repos / CBLOs 854.49 1.33
Total 854.49 1.33
Net Current Assets (including cash & bank balances) (264.72) (0.42)
Total Net Assets as on 31-Oct-2014 64,427.00 100.00
** Securities are classified as thinly traded / non traded on the date of valuation in accordance with SEBI Regulations and Guidelines.
This product is suitable for investors who are seeking*:
*Investors should consult their financial advisers if in doubt about whether the product is suitable for them.
Note: Risk may be represented as:
Mutual Fund investments are subject to market risks, read all scheme related documents carefully.
• Investment in equity and equity related securities
• High risk (BROWN)
(BLUE) investors understand that their principal will be at low risk
(YELLOW) investors understand that their principal will be at medium risk
(BROWN) investors understand that their principal will be at high risk
Name of the Mutual Fund : HSBC Mutual Fund
Name of the Scheme : HSBC EQUITY FUND (An open-ended diversified equity Scheme)
Monthly Portfolio Statement as of October 31,2014
• To create wealth over long term

Name of the Instrument ISIN Rating/Industries Quantity Market Value
(Rs in Lacs)
Percentage
to
Net AssetsEquity & Equity Related Instruments
Listed / Awaiting listing on Stock Exchanges
ICICI Bank Ltd. INE090A01013 BANKS 150,000 2,439.98 6.62
Axis Bank Ltd. INE238A01034 BANKS 450,000 1,977.30 5.37
HDFC Bank Ltd. INE040A01026 BANKS 160,000 1,458.96 3.96
Yes Bank Ltd. INE528G01019 BANKS 210,000 1,437.45 3.90
HCL Technologies Ltd. INE860A01027 SOFTWARE 85,000 1,367.14 3.71
Tata Motors Ltd. INE155A01022 AUTO 250,000 1,339.63 3.64
ITC Ltd. INE154A01025 CONSUMER NON DURABLES 375,000 1,332.00 3.62
Tech Mahindra Ltd. INE669C01028 SOFTWARE 50,000 1,258.85 3.42
Larsen & Toubro Ltd. INE018A01030 CONSTRUCTION PROJECT 70,000 1,158.82 3.15
Eicher Motors Ltd. INE066A01013 AUTO 9,000 1,149.55 3.12
Dr. Reddy's Laboratories Ltd. INE089A01023 PHARMACEUTICALS 35,000 1,108.91 3.01
Shree Cements Ltd. INE070A01015 CEMENT 12,000 1,090.75 2.96
Infosys Ltd. INE009A01021 SOFTWARE 22,000 891.28 2.42
CESC Ltd. INE486A01013 POWER 125,000 847.56 2.30
IRB Infrastructure Developers Ltd. INE821I01014 CONSTRUCTION 325,000 819.49 2.22
Oil & Natural Gas Corporation Ltd. INE213A01029 OIL 200,000 810.30 2.20
IndusInd Bank Ltd. INE095A01012 BANKS 110,000 792.11 2.15
Arvind Ltd. INE034A01011 TEXTILE PRODUCTS 250,000 745.63 2.02
Aurobindo Pharma Ltd. INE406A01037 PHARMACEUTICALS 75,000 726.34 1.97
Glenmark Pharmaceuticals Ltd. INE935A01035 PHARMACEUTICALS 100,000 718.05 1.95
Gateway Distriparks Ltd. INE852F01015 TRANSPORTATION 250,000 716.25 1.94
D. B. Corporation Ltd. INE950I01011 MEDIA & ENTERTAINMENT 200,000 712.30 1.93
Prestige Estates Projects Ltd. INE811K01011 CONSTRUCTION 300,000 674.85 1.83
Finolex Industries Ltd. INE183A01016 INDUSTRIAL PRODUCTS 200,000 641.80 1.74
Supreme Industries Ltd. INE195A01028 INDUSTRIAL PRODUCTS 100,000 599.80 1.63
MindTree Ltd. INE018I01017 SOFTWARE 50,000 546.80 1.48
LIC Housing Finance Ltd. INE115A01026 FINANCE 150,000 543.08 1.47
State Bank of India INE062A01012 BANKS 20,000 540.56 1.47
Hindustan Petroleum Corporation Ltd. INE094A01015 PETROLEUM PRODUCTS 100,000 530.40 1.44
Sesa Sterlite Ltd. INE205A01025 MINERALS/MINING 200,000 511.90 1.39
Tata Steel Ltd. INE081A01012 FERROUS METALS 100,000 490.00 1.33
Punjab National Bank INE160A01014 BANKS 50,000 465.43 1.26
Prism Cement Ltd. INE010A01011 CEMENT 600,000 451.50 1.23
Vinati Organics Ltd. INE410B01029 CHEMICALS 90,000 385.43 1.05
Aban Offshore Ltd. INE421A01028 OIL 60,000 374.40 1.02
Corporation Bank INE112A01015 BANKS 110,000 372.41 1.01
Hindustan Unilever Ltd. INE030A01027 CONSUMER NON DURABLES 50,000 369.18 1.00
Sundram Fasteners Ltd. INE387A01021 AUTO ANCILLARIES 240,000 368.76 1.00
Tata Consultancy Services Ltd. INE467B01029 SOFTWARE 14,000 365.10 0.99
Gujarat Pipavav Port Ltd. INE517F01014 TRANSPORTATION 200,000 331.50 0.90
Gulf Oil Lubricants Ltd. INE635Q01029 PETROLEUM PRODUCTS 100,000 330.65 0.90
ECLERX SERVICES LTD. INE738I01010 SOFTWARE 25,000 324.79 0.88
Atul Ltd. INE100A01010 CHEMICALS 25,000 318.94 0.87
Syndicate Bank INE667A01018 BANKS 250,000 315.25 0.86
Rural Electrification Corporation Ltd. INE020B01018 FINANCE 100,000 302.00 0.82
Wipro Ltd. INE075A01022 SOFTWARE 35,000 197.30 0.54
Total 35,250.41 95.69
Reverse Repos / CBLOs 1,994.01 5.41
Total 1,994.01 5.41
Net Current Assets (including cash & bank balances) (404.38) (1.10)
Total Net Assets as on 31-Oct-2014 36,840.05 100.00
** Securities are classified as thinly traded / non traded on the date of valuation in accordance with SEBI Regulations and Guidelines.
This product is suitable for investors who are seeking*:
*Investors should consult their financial advisers if in doubt about whether the product is suitable for them.
Note: Risk may be represented as:
Mutual Fund investments are subject to market risks, read all scheme related documents carefully.
• Investment in equity and equity related securities across market capitalisations
• High risk (BROWN)
(BLUE) investors understand that their principal will be at low risk
(YELLOW) investors understand that their principal will be at medium risk
(BROWN) investors understand that their principal will be at high risk
Name of the Mutual Fund : HSBC Mutual Fund
Name of the Scheme : HSBC INDIA OPPORTUNITIES FUND (An open-ended flexi-cap equity Scheme)
Monthly Portfolio Statement as of October 31,2014
• To create wealth over long term

Name of the Instrument ISIN Rating/Industries Quantity Market Value
(Rs in Lacs)
Percentage
to
Net AssetsEquity & Equity Related Instruments
Listed / Awaiting listing on Stock Exchanges
CCL PRODUCTS INDIA LTD. INE421D01022 CONSUMER NON DURABLES 792,000 1,033.16 3.86
UPL Ltd. INE628A01036 PESTICIDES 281,000 979.43 3.66
Aurobindo Pharma Ltd. INE406A01037 PHARMACEUTICALS 86,500 837.71 3.13
Sundram Fasteners Ltd. INE387A01021 AUTO ANCILLARIES 541,748 832.40 3.11
Atul Ltd. INE100A01010 CHEMICALS 63,316 807.75 3.02
Indiabulls Housing Finance Ltd. INE148I01020 FINANCE 179,500 750.85 2.80
DCB Bank Ltd. INE503A01015 BANKS 819,042 749.01 2.80
Balkrishna Industries Ltd. INE787D01026 AUTO ANCILLARIES 96,787 745.36 2.78
Gulf Oil Lubricants Ltd. INE635Q01029 PETROLEUM PRODUCTS 211,865 700.53 2.62
National Buildings Construction Corporation Ltd. INE095N01015 CONSTRUCTION 83,000 699.94 2.61
Cholamandalam Investment & Finance Co Ltd. INE121A01016 FINANCE 143,817 697.44 2.60
Apollo Tyres Ltd. INE438A01022 AUTO ANCILLARIES 313,000 685.78 2.56
BEML Ltd. INE258A01016 INDUSTRIAL CAPITAL GOODS 99,375 673.22 2.51
Syndicate Bank INE667A01018 BANKS 530,000 668.33 2.50
Gujarat Pipavav Port Ltd. INE517F01014 TRANSPORTATION 399,000 661.34 2.47
Arvind Ltd. INE034A01011 TEXTILE PRODUCTS 220,000 656.15 2.45
PI INDUSTRIES LIMITED INE603J01030 PESTICIDES 142,775 637.06 2.38
Persistent Systems Ltd. INE262H01013 SOFTWARE 47,500 617.33 2.30
Lupin Ltd. INE326A01037 PHARMACEUTICALS 43,500 595.54 2.22
Tech Mahindra Ltd. INE669C01028 SOFTWARE 23,400 589.14 2.20
Suprajit Engineering Ltd. INE399C01030 AUTO ANCILLARIES 500,478 583.31 2.18
Finolex Industries Ltd. INE183A01016 INDUSTRIAL PRODUCTS 179,694 576.64 2.15
Gateway Distriparks Ltd. INE852F01015 TRANSPORTATION 187,076 535.97 2.00
CESC Ltd. INE486A01013 POWER 78,500 532.27 1.99
Hindustan Petroleum Corporation Ltd. INE094A01015 PETROLEUM PRODUCTS 100,000 530.40 1.98
HT Media Ltd. INE501G01024 MEDIA & ENTERTAINMENT 450,470 522.32 1.95
Motilal Oswal Financial Services Ltd. INE338I01027 FINANCE 238,393 512.43 1.91
The Jammu & Kashmir Bank Ltd. INE168A01041 BANKS 360,000 499.86 1.87
The Federal Bank Ltd. INE171A01029 BANKS 345,000 490.07 1.83
IRB Infrastructure Developers Ltd. INE821I01014 CONSTRUCTION 189,000 476.56 1.78
V.S.T Tillers Tractors Ltd. INE764D01017 AUTO 30,600 450.00 1.68
Gujarat Mineral Development Corporation Ltd. INE131A01031 MINERALS/MINING 267,048 407.11 1.52
Vinati Organics Ltd. INE410B01029 CHEMICALS 92,397 395.69 1.48
Torrent Pharmaceuticals Ltd. INE685A01028 PHARMACEUTICALS 44,000 388.04 1.45
The South Indian Bank Ltd. INE683A01023 BANKS 1,320,000 366.30 1.37
Alembic Pharmaceuticals Ltd. INE901L01018 PHARMACEUTICALS 89,000 364.37 1.36
Everest Industries Ltd. INE295A01018 CEMENT 132,308 354.78 1.32
Prism Cement Ltd. INE010A01011 CEMENT 470,861 354.32 1.32
Godfrey Phillips India Ltd. INE260B01010 CONSUMER NON DURABLES 10,824 322.44 1.20
Adani Ports & Special Economic Zone Ltd. INE742F01042 TRANSPORTATION 105,000 299.93 1.12
IPCA Laboratories Ltd. INE571A01020 PHARMACEUTICALS 40,800 298.37 1.11
Gulf Oil Corporation Ltd. INE077F01035 PETROLEUM PRODUCTS 165,092 284.70 1.06
Aban Offshore Ltd. INE421A01028 OIL 40,000 249.60 0.93
Nucleus Software Exports Ltd. INE096B01018 SOFTWARE 113,624 249.23 0.93
KEC International Ltd. INE389H01022 CONSTRUCTION PROJECT 207,527 227.86 0.85
Karur Vysya Bank Ltd. INE036D01010 BANKS 40,000 218.16 0.81
Jagran Prakashan Ltd. INE199G01027 MEDIA & ENTERTAINMENT 150,000 194.85 0.73
BF Utilities Ltd. INE243D01012 CONSTRUCTION 28,650 191.38 0.71
JK Lakshmi Cement Ltd. INE786A01032 CEMENT 45,000 165.20 0.62
Dena Bank INE077A01010 BANKS 240,500 153.80 0.57
Indiabulls Real Estate Ltd. INE069I01010 CONSTRUCTION 185,000 131.63 0.49
Commercial Engineers & Body Builders Co Ltd. INE209L01016 INDUSTRIAL CAPITAL GOODS 655,000 125.11 0.47
ECLERX SERVICES LTD. INE738I01010 SOFTWARE 7,000 90.94 0.34
Kaveri Seed Company Ltd. INE455I01029 CONSUMER NON DURABLES 9,671 89.19 0.33
Majestic Auto Ltd. INE201B01022 AUTO ANCILLARIES 84,606 83.29 0.31
Total 26,333.61 98.30
Reverse Repos / CBLOs 818.91 3.06
Total 818.91 3.06
Net Current Assets (including cash & bank balances) (366.06) (1.36)
Total Net Assets as on 31-Oct-2014 26,786.45 100.00
** Securities are classified as thinly traded / non traded on the date of valuation in accordance with SEBI Regulations and Guidelines.
This product is suitable for investors who are seeking*:
*Investors should consult their financial advisers if in doubt about whether the product is suitable for them.
Note: Risk may be represented as:
Mutual Fund investments are subject to market risks, read all scheme related documents carefully.
• Investment in predominantly mid cap equity and equity related securities
• High risk (BROWN)
(BLUE) investors understand that their principal will be at low risk
(YELLOW) investors understand that their principal will be at medium risk
(BROWN) investors understand that their principal will be at high risk
Name of the Mutual Fund : HSBC Mutual Fund
Name of the Scheme : HSBC MIDCAP EQUITY FUND (An open-ended diversified equity Scheme)
Monthly Portfolio Statement as of October 31,2014
• To create wealth over long term

Name of the Instrument ISIN Rating/Industries Quantity Market Value
(Rs in Lacs)
Percentage
to
Net AssetsEquity & Equity Related Instruments
Listed / Awaiting listing on Stock Exchanges
National Buildings Construction Corporation Ltd. INE095N01015 CONSTRUCTION 150,000 1,264.95 8.26
Gateway Distriparks Ltd. INE852F01015 TRANSPORTATION 404,949 1,160.18 7.57
Hindustan Petroleum Corporation Ltd. INE094A01015 PETROLEUM PRODUCTS 192,000 1,018.37 6.65
Fag Bearings India Ltd. INE513A01014 INDUSTRIAL PRODUCTS 28,276 883.58 5.77
Gujarat Pipavav Port Ltd. INE517F01014 TRANSPORTATION 495,000 820.46 5.36
Rural Electrification Corporation Ltd. INE020B01018 FINANCE 240,000 724.80 4.73
ICICI Bank Ltd. INE090A01013 BANKS 44,500 723.86 4.73
IRB Infrastructure Developers Ltd. INE821I01014 CONSTRUCTION 250,000 630.38 4.12
BEML Ltd. INE258A01016 INDUSTRIAL CAPITAL GOODS 86,834 588.26 3.84
Adani Ports & Special Economic Zone Ltd. INE742F01042 TRANSPORTATION 203,000 579.87 3.79
The Jammu & Kashmir Bank Ltd. INE168A01041 BANKS 404,200 561.23 3.66
Tata Motors Ltd. IN9155A01020 AUTO 161,000 539.83 3.52
Everest Industries Ltd. INE295A01018 CEMENT 196,500 526.91 3.44
JSW Energy Ltd. INE121E01018 POWER 650,000 521.95 3.41
Apollo Tyres Ltd. INE438A01022 AUTO ANCILLARIES 216,000 473.26 3.09
Gujarat Mineral Development Corporation Ltd. INE131A01031 MINERALS/MINING 265,612 404.93 2.64
Reliance Infrastructure Ltd. INE036A01016 POWER 63,500 404.62 2.64
Power Grid Corporation of India Ltd. INE752E01010 POWER 275,000 400.95 2.62
Karnataka Bank Ltd. INE614B01018 BANKS 285,000 353.54 2.31
Dena Bank INE077A01010 BANKS 490,000 313.36 2.05
HIL Ltd. INE557A01011 CEMENT 45,000 302.22 1.97
PTC India Ltd. INE877F01012 POWER 320,886 293.93 1.92
CESC Ltd. INE486A01013 POWER 42,000 284.78 1.86
Indian Oil Corporation Ltd. INE242A01010 PETROLEUM PRODUCTS 67,200 244.71 1.60
Gammon Infrastructure Projects Ltd. INE181G01025 CONSTRUCTION PROJECT 1,495,836 218.39 1.43
Larsen & Toubro Ltd. INE018A01030 CONSTRUCTION PROJECT 12,500 206.93 1.35
Gujarat State Petronet Ltd. INE246F01010 GAS 200,000 193.90 1.27
United Bank of India INE695A01019 BANKS 336,000 141.79 0.93
PTC India Financial Services Ltd. INE560K01014 FINANCE 250,000 126.88 0.83
Commercial Engineers & Body Builders Co Ltd. INE209L01016 INDUSTRIAL CAPITAL GOODS 456,592 87.21 0.57
Gammon India Ltd. INE259B01020 CONSTRUCTION PROJECT 219,107 77.56 0.51
Aban Offshore Ltd. INE421A01028 OIL 6,500 40.56 0.26
KEC International Ltd. INE389H01022 CONSTRUCTION PROJECT 30,000 32.94 0.22
Total 15,147.09 98.92
Reverse Repos / CBLOs 303.96 1.98
Total 303.96 1.98
Net Current Assets (including cash & bank balances) (133.46) (0.90)
Total Net Assets as on 31-Oct-2014 15,317.59 100.00
** Securities are classified as thinly traded / non traded on the date of valuation in accordance with SEBI Regulations and Guidelines.
This product is suitable for investors who are seeking*:
*Investors should consult their financial advisers if in doubt about whether the product is suitable for them.
Note: Risk may be represented as:
Mutual Fund investments are subject to market risks, read all scheme related documents carefully.
• Investment in equity and equity related securities, primarily in themes that play an important role in India's economic development
• High risk (BROWN)
(BLUE) investors understand that their principal will be at low risk
(YELLOW) investors understand that their principal will be at medium risk
(BROWN) investors understand that their principal will be at high risk
Name of the Mutual Fund : HSBC Mutual Fund
Name of the Scheme : HSBC PROGRESSIVE THEMES FUND (An open-ended flexi-theme equity Scheme)
Monthly Portfolio Statement as of October 31,2014
• To create wealth over long term

Name of the Instrument ISIN Rating/Industries Quantity Market Value
(Rs in Lacs)
Percentage
to
Net AssetsEquity & Equity Related Instruments
Listed / Awaiting listing on Stock Exchanges
ICICI Bank Ltd. INE090A01013 BANKS 88,100 1,433.08 7.11
Larsen & Toubro Ltd. INE018A01030 CONSTRUCTION PROJECT 52,700 872.42 4.33
Shree Cements Ltd. INE070A01015 CEMENT 9,397 854.15 4.24
IndusInd Bank Ltd. INE095A01012 BANKS 116,000 835.32 4.14
Infosys Ltd. INE009A01021 SOFTWARE 20,200 818.35 4.06
Maruti Suzuki India Ltd. INE585B01010 AUTO 24,233 808.72 4.01
Tech Mahindra Ltd. INE669C01028 SOFTWARE 30,700 772.93 3.83
IPCA Laboratories Ltd. INE571A01020 PHARMACEUTICALS 103,874 759.63 3.77
Axis Bank Ltd. INE238A01034 BANKS 163,500 718.42 3.56
LIC Housing Finance Ltd. INE115A01026 FINANCE 175,428 635.14 3.15
The Federal Bank Ltd. INE171A01029 BANKS 408,560 580.36 2.88
The Jammu & Kashmir Bank Ltd. INE168A01041 BANKS 395,000 548.46 2.72
HDFC Bank Ltd. INE040A01026 BANKS 56,000 510.64 2.53
Motherson Sumi Systems Ltd. INE775A01035 AUTO ANCILLARIES 120,862 508.16 2.52
Arvind Ltd. INE034A01011 TEXTILE PRODUCTS 164,000 489.13 2.43
ITC Ltd. INE154A01025 CONSUMER NON DURABLES 136,098 483.42 2.40
Oil & Natural Gas Corporation Ltd. INE213A01029 OIL 118,000 478.08 2.37
Britannia Industries Ltd. INE216A01022 CONSUMER NON DURABLES 31,089 475.91 2.36
CESC Ltd. INE486A01013 POWER 69,000 467.85 2.32
Mcleod Russel India Ltd. INE942G01012 CONSUMER NON DURABLES 174,808 454.59 2.25
Crompton Greaves Ltd. INE067A01029 INDUSTRIAL CAPITAL GOODS 232,000 437.32 2.17
The Ramco Cements Ltd. INE331A01037 CEMENT 124,405 428.89 2.13
Gateway Distriparks Ltd. INE852F01015 TRANSPORTATION 147,000 421.16 2.09
MindTree Ltd. INE018I01017 SOFTWARE 37,500 410.10 2.03
Amara Raja Batteries Ltd. INE885A01032 AUTO ANCILLARIES 62,536 409.39 2.03
Supreme Industries Ltd. INE195A01028 INDUSTRIAL PRODUCTS 68,054 408.19 2.02
Sundaram Finance Ltd. INE660A01013 FINANCE 29,623 403.84 2.00
Orient Refractories Ltd. INE743M01012 INDUSTRIAL PRODUCTS 397,517 390.96 1.94
MRF Ltd. INE883A01011 AUTO ANCILLARIES 1,248 390.82 1.94
Finolex Industries Ltd. INE183A01016 INDUSTRIAL PRODUCTS 116,000 372.24 1.85
Lupin Ltd. INE326A01037 PHARMACEUTICALS 26,500 362.80 1.80
The South Indian Bank Ltd. INE683A01023 BANKS 1,270,000 352.43 1.75
HCL Technologies Ltd. INE860A01027 SOFTWARE 20,000 321.68 1.60
Reliance Industries Ltd. INE002A01018 PETROLEUM PRODUCTS 30,000 300.17 1.49
Sun TV Network Ltd. INE424H01027 MEDIA & ENTERTAINMENT 90,000 293.90 1.46
Bajaj Electricals Ltd. INE193E01025 CONSUMER DURABLES 98,863 280.52 1.39
Tata Motors Ltd. INE155A01022 AUTO 41,000 219.70 1.09
Jindal Steel & Power Ltd. INE749A01030 FERROUS METALS 109,000 176.36 0.87
Jaiprakash Associates Ltd. INE455F01025 CONSTRUCTION 410,000 127.72 0.63
Total 20,012.91 99.26
Reverse Repos / CBLOs 213.33 1.06
Total 213.33 1.06
Net Current Assets (including cash & bank balances) (58.26) (0.32)
Total Net Assets as on 31-Oct-2014 20,167.98 100.00
** Securities are classified as thinly traded / non traded on the date of valuation in accordance with SEBI Regulations and Guidelines.
This product is suitable for investors who are seeking*:
*Investors should consult their financial advisers if in doubt about whether the product is suitable for them.
Note: Risk may be represented as:
Mutual Fund investments are subject to market risks, read all scheme related documents carefully.
• Investment in equity and equity related securities with no capitalisation bias
• High risk (BROWN)
(BLUE) investors understand that their principal will be at low risk
(YELLOW) investors understand that their principal will be at medium risk
(BROWN) investors understand that their principal will be at high risk
Name of the Mutual Fund : HSBC Mutual Fund
Name of the Scheme : HSBC TAX SAVER EQUITY FUND (An open-ended Equity Linked Savings Scheme)
Monthly Portfolio Statement as of October 31,2014
• To create wealth over long term

Name of the Instrument ISIN Rating/Industries Quantity Market Value
(Rs in Lacs)
Percentage
to
Net AssetsEquity & Equity Related Instruments
Listed / Awaiting listing on Stock Exchanges
ICICI Bank Ltd. INE090A01013 BANKS 24,620 400.48 7.98
Infosys Ltd. INE009A01021 SOFTWARE 8,815 357.12 7.12
ITC Ltd. INE154A01025 CONSUMER NON DURABLES 77,112 273.90 5.46
Oil & Natural Gas Corporation Ltd. INE213A01029 OIL 62,500 253.22 5.05
Karur Vysya Bank Ltd. INE036D01010 BANKS 33,106 180.56 3.60
Axis Bank Ltd. INE238A01034 BANKS 39,500 173.56 3.46
Larsen & Toubro Ltd. INE018A01030 CONSTRUCTION PROJECT 10,325 170.93 3.41
Bharat Petroleum Corporation Ltd. INE029A01011 PETROLEUM PRODUCTS 22,500 163.07 3.25
The Federal Bank Ltd. INE171A01029 BANKS 110,000 156.26 3.12
Lupin Ltd. INE326A01037 PHARMACEUTICALS 10,826 148.21 2.96
Bank of Baroda INE028A01013 BANKS 15,150 140.82 2.81
Maruti Suzuki India Ltd. INE585B01010 AUTO 4,185 139.66 2.78
Wipro Ltd. INE075A01022 SOFTWARE 21,900 123.45 2.46
Hindustan Zinc Ltd. INE267A01025 NON - FERROUS METALS 70,100 120.19 2.40
Gateway Distriparks Ltd. INE852F01015 TRANSPORTATION 40,468 115.94 2.31
Motherson Sumi Systems Ltd. INE775A01035 AUTO ANCILLARIES 26,800 112.68 2.25
Amara Raja Batteries Ltd. INE885A01032 AUTO ANCILLARIES 16,200 106.05 2.11
Indiabulls Housing Finance Ltd. INE148I01020 FINANCE 24,000 100.39 2.00
IRB Infrastructure Developers Ltd. INE821I01014 CONSTRUCTION 39,800 100.36 2.00
The Jammu & Kashmir Bank Ltd. INE168A01041 BANKS 72,150 100.18 2.00
Shree Cements Ltd. INE070A01015 CEMENT 1,100 99.99 1.99
Hero MotoCorp Ltd. INE158A01026 AUTO 3,200 98.06 1.96
MRF Ltd. INE883A01011 AUTO ANCILLARIES 308 96.45 1.92
Mcleod Russel India Ltd. INE942G01012 CONSUMER NON DURABLES 34,863 90.66 1.81
Tata Motors Ltd. INE155A01022 AUTO 15,593 83.56 1.67
HCL Technologies Ltd. INE860A01027 SOFTWARE 5,085 81.79 1.63
Finolex Industries Ltd. INE183A01016 INDUSTRIAL PRODUCTS 25,000 80.23 1.60
ECLERX SERVICES LTD. INE738I01010 SOFTWARE 6,000 77.95 1.55
NMDC Ltd. INE584A01023 MINERALS/MINING 45,000 76.91 1.53
ACC Ltd. INE012A01025 CEMENT 5,050 75.71 1.51
Hindustan Unilever Ltd. INE030A01027 CONSUMER NON DURABLES 10,203 75.33 1.50
Tata Steel Ltd. INE081A01012 FERROUS METALS 15,175 74.36 1.48
Power Grid Corporation of India Ltd. INE752E01010 POWER 50,000 72.90 1.45
Tech Mahindra Ltd. INE669C01028 SOFTWARE 2,830 71.25 1.42
NTPC Ltd. INE733E01010 POWER 46,800 70.25 1.40
Supreme Industries Ltd. INE195A01028 INDUSTRIAL PRODUCTS 11,421 68.50 1.37
Sun TV Network Ltd. INE424H01027 MEDIA & ENTERTAINMENT 20,975 68.49 1.37
HDFC Bank Ltd. INE040A01026 BANKS 6,920 63.10 1.26
Reliance Industries Ltd. INE002A01018 PETROLEUM PRODUCTS 5,000 50.03 1.00
IPCA Laboratories Ltd. INE571A01020 PHARMACEUTICALS 4,500 32.91 0.66
Orient Refractories Ltd. INE743M01012 INDUSTRIAL PRODUCTS 11,220 11.03 0.22
Total 4,956.47 98.83
Reverse Repos / CBLOs 60.88 1.21
Total 60.88 1.21
Net Current Assets (including cash & bank balances) (1.92) (0.04)
Total Net Assets as on 31-Oct-2014 5,015.44 100.00
** Securities are classified as thinly traded / non traded on the date of valuation in accordance with SEBI Regulations and Guidelines.
This product is suitable for investors who are seeking*:
*Investors should consult their financial advisers if in doubt about whether the product is suitable for them.
Note: Risk may be represented as:
Mutual Fund investments are subject to market risks, read all scheme related documents carefully.
• Investment in equity & equity related securities
• High risk (BROWN)
(BLUE) investors understand that their principal will be at low risk
(YELLOW) investors understand that their principal will be at medium risk
(BROWN) investors understand that their principal will be at high risk
Name of the Mutual Fund : HSBC Mutual Fund
Name of the Scheme : HSBC DIVIDEND YIELD EQUITY FUND (An open ended equity Scheme)
Monthly Portfolio Statement as of October 31,2014
• To create long term capital growth

Name of the Instrument ISIN Rating/Industries Quantity Market Value
(Rs in Lacs)
Percentage
to
Net AssetsDebt Instruments
Listed / Awaiting listing on Stock Exchanges
Housing Development Finance Corporation Ltd.** INE001A07LX6 CRISIL AAA 50 500.10 7.36
LIC Housing Finance Ltd.** INE115A07BN6 CRISIL AAA 50 500.06 7.36
Total 1,000.17 14.72
Money Market Instruments
Certificate of Deposit
State Bank of Patiala** INE652A16IH6 [ICRA]A1+ 1,370 1,360.69 20.03
Oriental Bank of Commerce** INE141A16NC1 CRISIL A1+ 1,370 1,360.66 20.03
Vijaya Bank** INE705A16HY9 CARE A1+ 1,000 993.16 14.62
Kotak Mahindra Bank Ltd.** INE237A16XH5 CRISIL A1+ 1,000 992.70 14.61
Axis Bank Ltd.** INE238A16UO5 CRISIL A1+ 1,000 992.67 14.61
Total 5,699.88 83.90
Reverse Repos / CBLOs 10.23 0.15
Total 10.23 0.15
Net Current Assets (including cash & bank balances) 84.31 1.23
Total Net Assets as on 31-Oct-2014 6,794.59 100.00
** Securities are classified as thinly traded / non traded on the date of valuation in accordance with SEBI Regulations and Guidelines.
This product is suitable for investors who are seeking*:
*Investors should consult their financial advisers if in doubt about whether the product is suitable for them.
Note: Risk may be represented as:
Mutual Fund investments are subject to market risks, read all scheme related documents carefully.
• Investment in Debt/Money Market Instruments
• Low risk (BLUE)
(BLUE) investors understand that their principal will be at low risk
(YELLOW) investors understand that their principal will be at medium risk
(BROWN) investors understand that their principal will be at high risk
Name of the Mutual Fund : HSBC Mutual Fund
Name of the Scheme : HSBC FIXED TERM SERIES 100 (A close-ended Scheme)
Monthly Portfolio Statement as of October 31,2014
• Regular fixed income over short term

Name of the Instrument ISIN Rating/Industries Quantity Market Value
(Rs in Lacs)
Percentage
to
Net AssetsDebt Instruments
Listed / Awaiting listing on Stock Exchanges
LIC Housing Finance Ltd.** INE115A07BT3 CRISIL AAA 200 2,001.21 10.33
Housing Development Finance Corporation Ltd.** INE001A07MD6 CRISIL AAA 200 2,001.20 10.33
National Bank for Agriculture & Rural Development** INE261F09HB5 CRISIL AAA 50 500.17 2.58
Total 4,502.58 23.24
Money Market Instruments
Certificate of Deposit
Canara Bank** INE476A16LK8 CRISIL A1+ 3,800 3,731.75 19.26
ICICI Bank Ltd.** INE090A16K02 [ICRA]A1+ 2,900 2,846.28 14.69
Yes Bank Ltd.** INE528G16WH6 [ICRA]A1+ 2,900 2,846.06 14.69
Axis Bank Ltd.** INE238A16VM7 CRISIL A1+ 2,660 2,611.29 13.48
Central Bank of India** INE483A16HS5 CARE A1+ 2,500 2,454.79 12.67
Total 14,490.17 74.79
Reverse Repos / CBLOs 42.37 0.22
Total 42.37 0.22
Net Current Assets (including cash & bank balances) 339.20 1.75
Total Net Assets as on 31-Oct-2014 19,374.32 100.00
** Securities are classified as thinly traded / non traded on the date of valuation in accordance with SEBI Regulations and Guidelines.
This product is suitable for investors who are seeking*:
*Investors should consult their financial advisers if in doubt about whether the product is suitable for them.
Note: Risk may be represented as:
Mutual Fund investments are subject to market risks, read all scheme related documents carefully.
• Investment in Debt/Money Market Instruments
• Low risk (BLUE)
(BLUE) investors understand that their principal will be at low risk
(YELLOW) investors understand that their principal will be at medium risk
(BROWN) investors understand that their principal will be at high risk
Name of the Mutual Fund : HSBC Mutual Fund
Name of the Scheme : HSBC FIXED TERM SERIES 101 (A close-ended Scheme)
Monthly Portfolio Statement as of October 31,2014
• Regular fixed income over short term

Name of the Instrument ISIN Rating/Industries Quantity Market Value
(Rs in Lacs)
Percentage
to
Net AssetsMoney Market Instruments
Certificate of Deposit
Andhra Bank** INE434A16GU6 CARE A1+ 1,870 1,788.78 19.94
Corporation Bank** INE112A16FZ9 CRISIL A1+ 1,780 1,703.00 18.99
Punjab National Bank** INE160A16KJ2 CARE A1+ 1,500 1,434.79 16.00
Dena Bank** INE077A16BW0 CRISIL A1+ 1,500 1,434.39 15.99
Yes Bank Ltd.** INE528G16XY9 [ICRA]A1+ 1,400 1,338.23 14.92
The Jammu & Kashmir Bank Ltd.** INE168A16JP4 CRISIL A1+ 1,300 1,242.54 13.85
Total 8,941.74 99.69
Reverse Repos / CBLOs 36.85 0.41
Total 36.85 0.41
Net Current Assets (including cash & bank balances) (8.75) (0.10)
Total Net Assets as on 31-Oct-2014 8,969.84 100.00
** Securities are classified as thinly traded / non traded on the date of valuation in accordance with SEBI Regulations and Guidelines.
This product is suitable for investors who are seeking*:
*Investors should consult their financial advisers if in doubt about whether the product is suitable for them.
Note: Risk may be represented as:
Mutual Fund investments are subject to market risks, read all scheme related documents carefully.
• Investment in Debt/Money Market Instruments
• Low risk (BLUE)
(BLUE) investors understand that their principal will be at low risk
(YELLOW) investors understand that their principal will be at medium risk
(BROWN) investors understand that their principal will be at high risk
Name of the Mutual Fund : HSBC Mutual Fund
Name of the Scheme : HSBC FIXED TERM SERIES 102 (A close-ended Scheme)
Monthly Portfolio Statement as of October 31,2014
• Regular fixed income over short term
Name of the Instrument ISIN Rating/Industries Quantity Market Value
(Rs in Lacs)
Percentage
to
Net AssetsDebt Instruments
Listed / Awaiting listing on Stock Exchanges
Tata Capital Financial Services Ltd.** INE306N07AV9 CRISIL AA+ 290 2,903.68 10.42
Bajaj Finance Ltd.** INE296A07989 [ICRA]AA+ 250 2,679.86 9.62
Housing Development Finance Corporation Ltd.** INE001A07MI5 CRISIL AAA 250 2,504.87 8.99
Kotak Mahindra Prime Ltd.** INE916DA7BY2 [ICRA]AAA 230 2,303.39 8.27
Total 10,391.79 37.30
Money Market Instruments
Certificate of Deposit
Indian Bank** INE562A16GR0 Fitch A1+ 5,000 4,821.45 17.30
Allahabad Bank** INE428A16NH1 [ICRA]A1+ 5,000 4,820.75 17.30
Andhra Bank** INE434A16HP4 CARE A1+ 4,940 4,765.99 17.10
Vijaya Bank** INE705A16KM8 CARE A1+ 2,500 2,409.67 8.65
Dena Bank** INE077A16CB2 CRISIL A1+ 60 57.85 0.21
Total 16,875.70 60.56
Reverse Repos / CBLOs 63.06 0.23
Total 63.06 0.23
Net Current Assets (including cash & bank balances) 534.29 1.91
Total Net Assets as on 31-Oct-2014 27,864.85 100.00
** Securities are classified as thinly traded / non traded on the date of valuation in accordance with SEBI Regulations and Guidelines.
This product is suitable for investors who are seeking*:
*Investors should consult their financial advisers if in doubt about whether the product is suitable for them.
Note: Risk may be represented as:
Mutual Fund investments are subject to market risks, read all scheme related documents carefully.
• Investment in Debt/Money Market Instruments
• Low risk (BLUE)
(BLUE) investors understand that their principal will be at low risk
(YELLOW) investors understand that their principal will be at medium risk
(BROWN) investors understand that their principal will be at high risk
Name of the Mutual Fund : HSBC Mutual Fund
Name of the Scheme : HSBC FIXED TERM SERIES 105 (A close-ended Scheme)
Monthly Portfolio Statement as of October 31,2014
• Regular fixed income over short term

Name of the Instrument ISIN Rating/Industries Quantity Market Value
(Rs in Lacs)
Percentage
to
Net AssetsDebt Instruments
Listed / Awaiting listing on Stock Exchanges
Kotak Mahindra Prime Ltd.** INE916DA7CJ1 [ICRA]AAA 145 1,452.41 11.21
Bajaj Finance Ltd.** INE296A07AE5 [ICRA]AA+ 100 1,068.31 8.25
Tata Capital Financial Services Ltd.** INE306N07BI4 [ICRA]AA+ 100 1,001.25 7.73
Total 3,521.97 27.19
Money Market Instruments
Certificate of Deposit
Dena Bank** INE077A16CB2 CRISIL A1+ 2,550 2,458.43 18.98
Punjab National Bank** INE160A16KC7 CARE A1+ 2,500 2,419.89 18.68
Vijaya Bank** INE705A16KN6 CARE A1+ 2,500 2,410.23 18.61
Oriental Bank of Commerce** INE141A16OW7 CRISIL A1+ 2,000 1,944.02 15.01
Total 9,232.57 71.28
Reverse Repos / CBLOs 45.41 0.35
Total 45.41 0.35
Net Current Assets (including cash & bank balances) 152.68 1.18
Total Net Assets as on 31-Oct-2014 12,952.63 100.00
** Securities are classified as thinly traded / non traded on the date of valuation in accordance with SEBI Regulations and Guidelines.
This product is suitable for investors who are seeking*:
*Investors should consult their financial advisers if in doubt about whether the product is suitable for them.
Note: Risk may be represented as:
Mutual Fund investments are subject to market risks, read all scheme related documents carefully.
• Investment in Debt/Money Market Instruments
• Low risk (BLUE)
(BLUE) investors understand that their principal will be at low risk
(YELLOW) investors understand that their principal will be at medium risk
(BROWN) investors understand that their principal will be at high risk
Name of the Mutual Fund : HSBC Mutual Fund
Name of the Scheme : HSBC FIXED TERM SERIES 106 (A close-ended Scheme)
Monthly Portfolio Statement as of October 31,2014
• Regular fixed income over short term

Name of the Instrument ISIN Rating/Industries Quantity Market Value
(Rs in Lacs)
Percentage
to
Net AssetsDebt Instruments
Listed / Awaiting listing on Stock Exchanges
Kotak Mahindra Prime Ltd.** INE916DA7CP8 [ICRA]AAA 180 1,802.55 11.27
L&T Infrastructure Finance Co. Ltd.** INE691I07489 [ICRA]AA+ 64 1,601.30 10.02
Housing Development Finance Corporation Ltd.** INE001A07MI5 CRISIL AAA 150 1,502.92 9.40
Tata Capital Financial Services Ltd.** INE306N07BS3 CRISIL AA+ 100 1,001.11 6.26
Total 5,907.88 36.95
Money Market Instruments
Certificate of Deposit
Punjab National Bank** INE160A16JX5 CARE A1+ 2,500 2,423.69 15.16
Andhra Bank** INE434A16GB6 CARE A1+ 2,500 2,423.25 15.16
Vijaya Bank** INE705A16JU3 CARE A1+ 2,500 2,422.58 15.15
Yes Bank Ltd.** INE528G16XF8 CARE A1+ 2,475 2,397.59 15.00
Total 9,667.10 60.47
Reverse Repos / CBLOs 36.05 0.23
Total 36.05 0.23
Net Current Assets (including cash & bank balances) 377.16 2.35
Total Net Assets as on 31-Oct-2014 15,988.19 100.00
** Securities are classified as thinly traded / non traded on the date of valuation in accordance with SEBI Regulations and Guidelines.
This product is suitable for investors who are seeking*:
*Investors should consult their financial advisers if in doubt about whether the product is suitable for them.
Note: Risk may be represented as:
Mutual Fund investments are subject to market risks, read all scheme related documents carefully.
• Investment in Debt/Money Market Instruments
• Low risk (BLUE)
(BLUE) investors understand that their principal will be at low risk
(YELLOW) investors understand that their principal will be at medium risk
(BROWN) investors understand that their principal will be at high risk
Name of the Mutual Fund : HSBC Mutual Fund
Name of the Scheme : HSBC FIXED TERM SERIES 107 (A close-ended Scheme)
Monthly Portfolio Statement as of October 31,2014
• Regular fixed income over short term

Name of the Instrument ISIN Rating/Industries Quantity Market Value
(Rs in Lacs)
Percentage
to
Net AssetsMoney Market Instruments
Certificate of Deposit
Bank of India** INE084A16AW8 CRISIL A1+ 5,000 4,840.87 14.76
Andhra Bank** INE434A16GP6 CARE A1+ 5,000 4,836.68 14.75
Punjab & Sind Bank** INE608A16FT9 [ICRA]A1+ 2,500 2,422.01 7.38
ICICI Bank Ltd.** INE090A16N82 [ICRA]A1+ 2,500 2,421.41 7.38
Canara Bank** INE476A16NA5 CRISIL A1+ 2,500 2,420.39 7.38
Punjab & Sind Bank** INE608A16GC3 [ICRA]A1+ 2,500 2,419.82 7.38
Indian Bank** INE562A16FV4 Fitch A1+ 2,500 2,418.76 7.37
HDFC Bank Ltd.** INE040A16AE8 CARE A1+ 2,500 2,418.34 7.37
UCO Bank** INE691A16HS3 CRISIL A1+ 2,500 2,417.94 7.37
Vijaya Bank** INE705A16KF2 CARE A1+ 2,500 2,417.66 7.37
Yes Bank Ltd.** INE528G16XL6 [ICRA]A1+ 2,500 2,417.42 7.37
Yes Bank Ltd.** INE528G16XN2 [ICRA]A1+ 1,340 1,295.45 3.95
Total 32,746.72 99.83
Reverse Repos / CBLOs 76.50 0.23
Total 76.50 0.23
Net Current Assets (including cash & bank balances) (24.38) (0.06)
Total Net Assets as on 31-Oct-2014 32,798.85 100.00
** Securities are classified as thinly traded / non traded on the date of valuation in accordance with SEBI Regulations and Guidelines.
This product is suitable for investors who are seeking*:
*Investors should consult their financial advisers if in doubt about whether the product is suitable for them.
Note: Risk may be represented as:
Mutual Fund investments are subject to market risks, read all scheme related documents carefully.
• Investment in Debt/Money Market Instruments
• Low risk (BLUE)
(BLUE) investors understand that their principal will be at low risk
(YELLOW) investors understand that their principal will be at medium risk
(BROWN) investors understand that their principal will be at high risk
Name of the Mutual Fund : HSBC Mutual Fund
Name of the Scheme : HSBC FIXED TERM SERIES 109 (A close-ended Scheme)
Monthly Portfolio Statement as of October 31,2014
• Regular fixed income over short term
Name of the Instrument ISIN Rating/Industries Quantity Market Value
(Rs in Lacs)
Percentage
to
Net AssetsDebt Instruments
Listed / Awaiting listing on Stock Exchanges
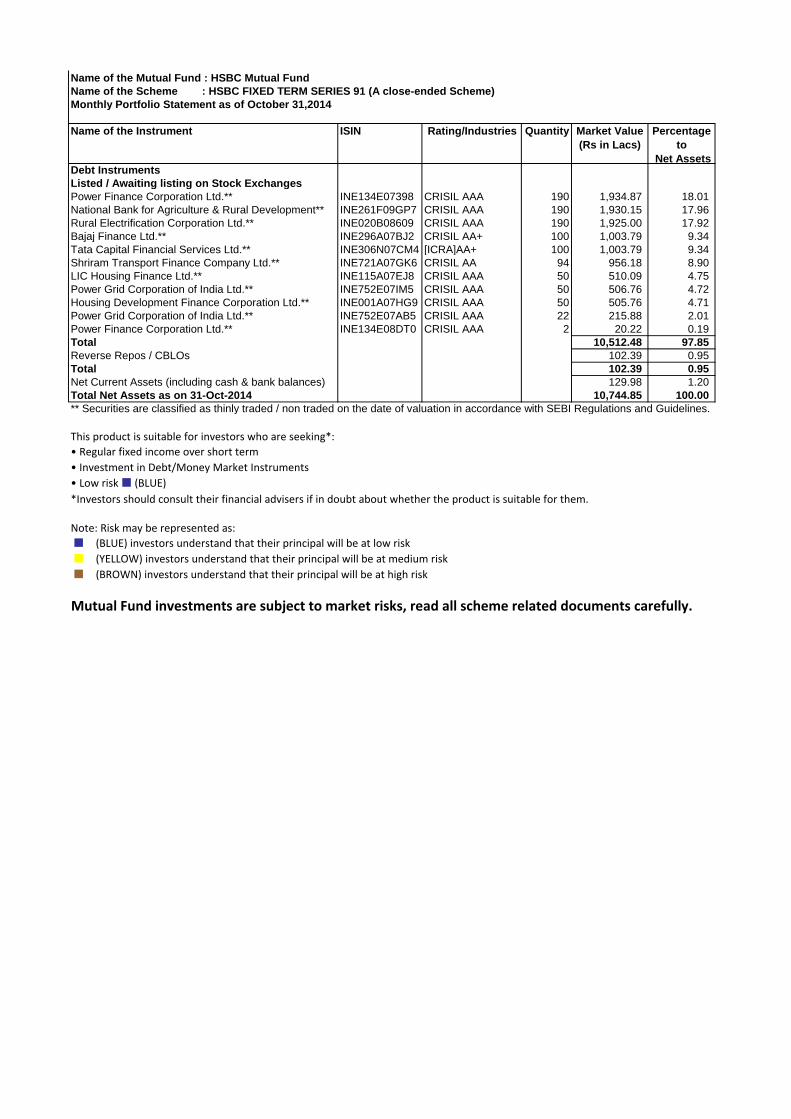
Power Finance Corporation Ltd.** INE134E07398 CRISIL AAA 190 1,934.87 18.01
National Bank for Agriculture & Rural Development** INE261F09GP7 CRISIL AAA 190 1,930.15 17.96
Rural Electrification Corporation Ltd.** INE020B08609 CRISIL AAA 190 1,925.00 17.92
Bajaj Finance Ltd.** INE296A07BJ2 CRISIL AA+ 100 1,003.79 9.34
Tata Capital Financial Services Ltd.** INE306N07CM4 [ICRA]AA+ 100 1,003.79 9.34
Shriram Transport Finance Company Ltd.** INE721A07GK6 CRISIL AA 94 956.18 8.90
LIC Housing Finance Ltd.** INE115A07EJ8 CRISIL AAA 50 510.09 4.75
Power Grid Corporation of India Ltd.** INE752E07IM5 CRISIL AAA 50 506.76 4.72
Housing Development Finance Corporation Ltd.** INE001A07HG9 CRISIL AAA 50 505.76 4.71
Power Grid Corporation of India Ltd.** INE752E07AB5 CRISIL AAA 22 215.88 2.01
Power Finance Corporation Ltd.** INE134E08DT0 CRISIL AAA 2 20.22 0.19
Total 10,512.48 97.85
Reverse Repos / CBLOs 102.39 0.95
Total 102.39 0.95
Net Current Assets (including cash & bank balances) 129.98 1.20
Total Net Assets as on 31-Oct-2014 10,744.85 100.00
** Securities are classified as thinly traded / non traded on the date of valuation in accordance with SEBI Regulations and Guidelines.
This product is suitable for investors who are seeking*:
*Investors should consult their financial advisers if in doubt about whether the product is suitable for them.
Note: Risk may be represented as:
Mutual Fund investments are subject to market risks, read all scheme related documents carefully.
• Investment in Debt/Money Market Instruments
• Low risk (BLUE)
(BLUE) investors understand that their principal will be at low risk
(YELLOW) investors understand that their principal will be at medium risk
(BROWN) investors understand that their principal will be at high risk
Name of the Mutual Fund : HSBC Mutual Fund
Name of the Scheme : HSBC FIXED TERM SERIES 91 (A close-ended Scheme)
Monthly Portfolio Statement as of October 31,2014
• Regular fixed income over short term

Name of the Instrument ISIN Rating/Industries Quantity Market Value
(Rs in Lacs)
Percentage
to
Net AssetsDebt Instruments
Listed / Awaiting listing on Stock Exchanges
Power Finance Corporation Ltd.** INE134E07398 CRISIL AAA 150 1,527.53 17.25
Rural Electrification Corporation Ltd.** INE020B08609 CRISIL AAA 150 1,519.74 17.16
Power Grid Corporation of India Ltd.** INE752E07HQ8 CRISIL AAA 120 1,509.11 17.04
Tata Capital Financial Services Ltd.** INE306N07CQ5 [ICRA]AA+ 85 854.06 9.65
Shriram Transport Finance Company Ltd.** INE721A07GR1 CRISIL AA 81,000 825.15 9.32
Bajaj Finance Ltd.** INE296A07CM4 CRISIL AA+ 67 683.47 7.72
National Bank for Agriculture & Rural Development** INE261F09GP7 CRISIL AAA 50 507.93 5.74
Housing Development Finance Corporation Ltd.** INE001A07LU2 CRISIL AAA 50 506.96 5.73
LIC Housing Finance Ltd.** INE115A07EM2 CARE AAA 50 504.28 5.70
Rural Electrification Corporation Ltd.** INE020B07HW4 CRISIL AAA 16 161.34 1.82
Power Grid Corporation of India Ltd.** INE752E07KB4 CRISIL AAA 9 113.20 1.28
Total 8,712.77 98.41
Reverse Repos / CBLOs 39.29 0.44
Total 39.29 0.44
Net Current Assets (including cash & bank balances) 102.27 1.15
Total Net Assets as on 31-Oct-2014 8,854.32 100.00
** Securities are classified as thinly traded / non traded on the date of valuation in accordance with SEBI Regulations and Guidelines.
This product is suitable for investors who are seeking*:
*Investors should consult their financial advisers if in doubt about whether the product is suitable for them.
Note: Risk may be represented as:
Mutual Fund investments are subject to market risks, read all scheme related documents carefully.
• Investment in Debt/Money Market Instruments
• Low risk (BLUE)
(BLUE) investors understand that their principal will be at low risk
(YELLOW) investors understand that their principal will be at medium risk
(BROWN) investors understand that their principal will be at high risk
Name of the Mutual Fund : HSBC Mutual Fund
Name of the Scheme : HSBC FIXED TERM SERIES 94 (A close-ended Scheme)
Monthly Portfolio Statement as of October 31,2014
• Regular fixed income over short term

Name of the Instrument ISIN Rating/Industries Quantity Market Value
(Rs in Lacs)
Percentage
to
Net AssetsDebt Instruments
Listed / Awaiting listing on Stock Exchanges
National Bank for Agriculture & Rural Development** INE261F09HF6 CRISIL AAA 164 1,646.83 17.01
Power Finance Corporation Ltd.** INE134E08FU3 CRISIL AAA 150 1,493.36 15.42
Export Import Bank of India** INE514E08738 CRISIL AAA 150 1,492.35 15.41
Tata Capital Financial Services Ltd.** INE306N07021 [ICRA]AA+ 90 1,142.58 11.80
Kotak Mahindra Prime Ltd.** INE916DA7758 [ICRA]AAA 100 1,012.82 10.46
LIC Housing Finance Ltd.** INE115A07CV7 CRISIL AAA 86 862.37 8.91
Housing Development Finance Corporation Ltd.** INE001A07JB6 CRISIL AAA 50 501.35 5.18
National Housing Bank** INE557F08ED1 Fitch AAA (ind) 50 500.36 5.17
Total 8,652.01 89.36
Money Market Instruments
Certificate of Deposit
Punjab National Bank^ INE160A16JT3 Fitch A1+ 400 389.11 4.02
Yes Bank Ltd.** INE528G16XN2 [ICRA]A1+ 160 154.68 1.60
Andhra Bank** INE434A16HP4 CARE A1+ 60 57.89 0.60
Total 601.68 6.22
Reverse Repos / CBLOs 50.58 0.52
Total 50.58 0.52
Net Current Assets (including cash & bank balances) 377.35 3.90
Total Net Assets as on 31-Oct-2014 9,681.62 100.00
** Securities are classified as thinly traded / non traded on the date of valuation in accordance with SEBI Regulations and Guidelines.
^ Traded has been classified on the basis of Traded data provided by CRISIL and ICRA.
This product is suitable for investors who are seeking*:
*Investors should consult their financial advisers if in doubt about whether the product is suitable for them.
Note: Risk may be represented as:
Mutual Fund investments are subject to market risks, read all scheme related documents carefully.
• Investment in Debt/Money Market Instruments
• Low risk (BLUE)
(BLUE) investors understand that their principal will be at low risk
(YELLOW) investors understand that their principal will be at medium risk
(BROWN) investors understand that their principal will be at high risk
Name of the Mutual Fund : HSBC Mutual Fund
Name of the Scheme : HSBC FIXED TERM SERIES 95 (A close-ended Scheme)
Monthly Portfolio Statement as of October 31,2014
• Regular fixed income over short term

Name of the Instrument ISIN Rating/Industries Quantity Market Value
(Rs in Lacs)
Percentage
to
Net AssetsDebt Instruments
Listed / Awaiting listing on Stock Exchanges
Rural Electrification Corporation Ltd.** INE020B07HW4 CRISIL AAA 88 887.36 19.12
Power Grid Corporation of India Ltd.** INE752E07AB5 CRISIL AAA 78 765.39 16.49
Power Finance Corporation Ltd.** INE134E07398 CRISIL AAA 50 509.18 10.97
National Bank for Agriculture & Rural Development** INE261F09GO0 CRISIL AAA 50 507.92 10.95
Bajaj Finance Ltd.** INE296A07CM4 CRISIL AA+ 45 459.05 9.89
Shriram Transport Finance Company Ltd.** INE721A07GR1 CRISIL AA 42,000 427.85 9.22
Housing Development Finance Corporation Ltd.** INE001A07LU2 CRISIL AAA 42 425.84 9.18
LIC Housing Finance Ltd.** INE115A07EM2 CARE AAA 41 413.51 8.91
Power Grid Corporation of India Ltd.** INE752E07KB4 CRISIL AAA 11 138.35 2.98
Total 4,534.45 97.71
Reverse Repos / CBLOs 60.76 1.31
Total 60.76 1.31
Net Current Assets (including cash & bank balances) 45.14 0.98
Total Net Assets as on 31-Oct-2014 4,640.36 100.00
** Securities are classified as thinly traded / non traded on the date of valuation in accordance with SEBI Regulations and Guidelines.
This product is suitable for investors who are seeking*:
*Investors should consult their financial advisers if in doubt about whether the product is suitable for them.
Note: Risk may be represented as:
Mutual Fund investments are subject to market risks, read all scheme related documents carefully.
• Investment in Debt/Money Market Instruments
• Low risk (BLUE)
(BLUE) investors understand that their principal will be at low risk
(YELLOW) investors understand that their principal will be at medium risk
(BROWN) investors understand that their principal will be at high risk
Name of the Mutual Fund : HSBC Mutual Fund
Name of the Scheme : HSBC FIXED TERM SERIES 96 (A close-ended Scheme)
Monthly Portfolio Statement as of October 31,2014
• Regular fixed income over short term
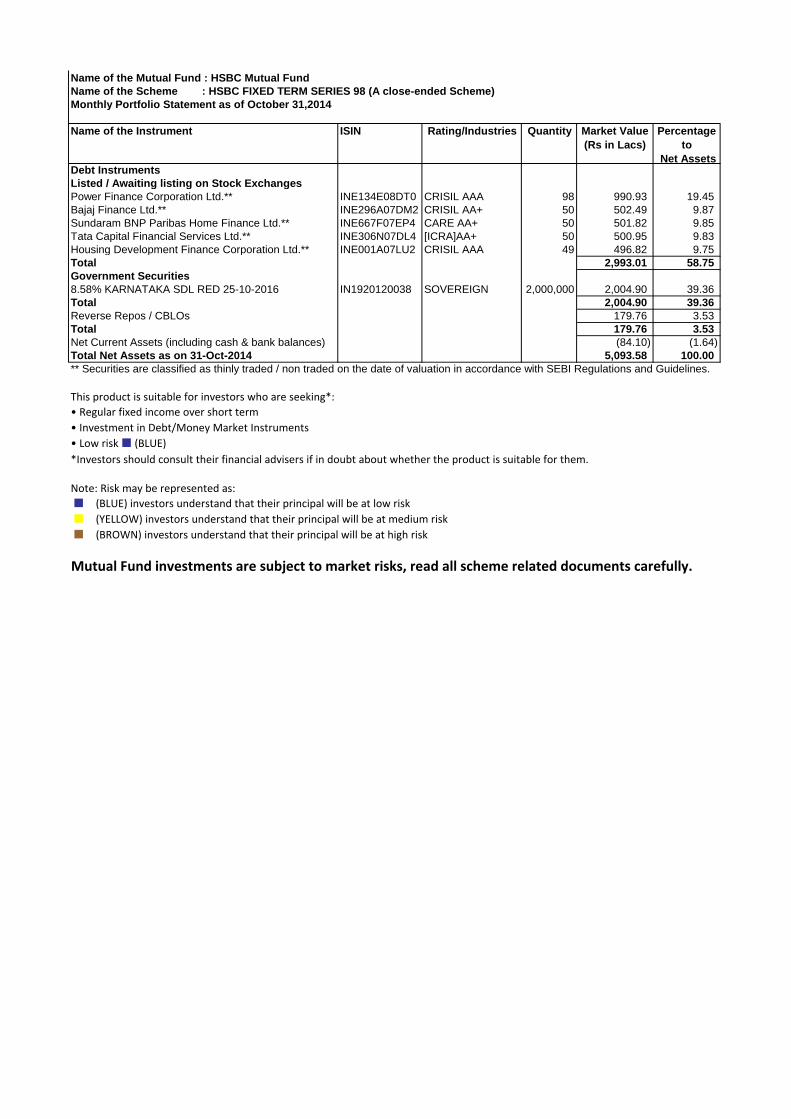
Name of the Instrument ISIN Rating/Industries Quantity Market Value
(Rs in Lacs)
Percentage
to
Net AssetsDebt Instruments
Listed / Awaiting listing on Stock Exchanges
Power Finance Corporation Ltd.** INE134E08DT0 CRISIL AAA 98 990.93 19.45
Bajaj Finance Ltd.** INE296A07DM2 CRISIL AA+ 50 502.49 9.87
Sundaram BNP Paribas Home Finance Ltd.** INE667F07EP4 CARE AA+ 50 501.82 9.85
Tata Capital Financial Services Ltd.** INE306N07DL4 [ICRA]AA+ 50 500.95 9.83
Housing Development Finance Corporation Ltd.** INE001A07LU2 CRISIL AAA 49 496.82 9.75
Total 2,993.01 58.75
Government Securities
8.58% KARNATAKA SDL RED 25-10-2016 IN1920120038 SOVEREIGN 2,000,000 2,004.90 39.36
Total 2,004.90 39.36
Reverse Repos / CBLOs 179.76 3.53
Total 179.76 3.53
Net Current Assets (including cash & bank balances) (84.10) (1.64)
Total Net Assets as on 31-Oct-2014 5,093.58 100.00
** Securities are classified as thinly traded / non traded on the date of valuation in accordance with SEBI Regulations and Guidelines.
This product is suitable for investors who are seeking*:
*Investors should consult their financial advisers if in doubt about whether the product is suitable for them.
Note: Risk may be represented as:
Mutual Fund investments are subject to market risks, read all scheme related documents carefully.
• Investment in Debt/Money Market Instruments
• Low risk (BLUE)
(BLUE) investors understand that their principal will be at low risk
(YELLOW) investors understand that their principal will be at medium risk
(BROWN) investors understand that their principal will be at high risk
Name of the Mutual Fund : HSBC Mutual Fund
Name of the Scheme : HSBC FIXED TERM SERIES 98 (A close-ended Scheme)
Monthly Portfolio Statement as of October 31,2014
• Regular fixed income over short term

Name of the Instrument ISIN Rating/Industries Quantity Market Value
(Rs in Lacs)
Percentage
to
Net AssetsDebt Instruments
Listed / Awaiting listing on Stock Exchanges
National Bank for Agriculture & Rural Development** INE261F09GU7 CRISIL AAA 100 1,000.02 12.30
LIC Housing Finance Ltd.** INE115A07DB7 CARE AAA 50 499.98 6.15
Total 1,500.00 18.45
Money Market Instruments
Certificate of Deposit
IDBI Bank Ltd.** INE008A16SQ1 CRISIL A1+ 1,500 1,495.76 18.39
Yes Bank Ltd.** INE528G16VT3 [ICRA]A1+ 1,200 1,196.59 14.71
Syndicate Bank** INE667A16CU0 CARE A1+ 1,160 1,156.72 14.22
ICICI Bank Ltd.** INE090A16G57 [ICRA]A1+ 1,000 997.40 12.26
Total 4,846.46 59.58
Reverse Repos / CBLOs 1,653.65 20.33
Total 1,653.65 20.33
Net Current Assets (including cash & bank balances) 132.75 1.64
Total Net Assets as on 31-Oct-2014 8,132.87 100.00
** Securities are classified as thinly traded / non traded on the date of valuation in accordance with SEBI Regulations and Guidelines.
This product is suitable for investors who are seeking*:
*Investors should consult their financial advisers if in doubt about whether the product is suitable for them.
Note: Risk may be represented as:
Mutual Fund investments are subject to market risks, read all scheme related documents carefully.
• Investment in Debt/Money Market Instruments
• Low risk (BLUE)
(BLUE) investors understand that their principal will be at low risk
(YELLOW) investors understand that their principal will be at medium risk
(BROWN) investors understand that their principal will be at high risk
Name of the Mutual Fund : HSBC Mutual Fund
Name of the Scheme : HSBC FIXED TERM SERIES 99 (A close-ended Scheme)
Monthly Portfolio Statement as of October 31,2014
• Regular fixed income over short term

Name of the Instrument ISIN Rating/Industries Quantity Market Value
(Rs in Lacs)
Percentage
to
Net AssetsMoney Market Instruments
Certificate of Deposit
Canara Bank** INE476A16OT3 CRISIL A1+ 10,000 9,990.64 2.92
Oriental Bank of Commerce** INE141A16RD0 CRISIL A1+ 10,000 9,938.46 2.90
Oriental Bank of Commerce** INE141A16RG3 CRISIL A1+ 10,000 9,924.75 2.90
State Bank of Patiala** INE652A16IO2 [ICRA]A1+ 7,500 7,425.70 2.17
UCO Bank** INE691A16IP7 CRISIL A1+ 5,000 4,997.69 1.46
IDBI Bank Ltd.** INE008A16WM2 CRISIL A1+ 5,000 4,992.91 1.46
UCO Bank** INE691A16IV5 CRISIL A1+ 5,000 4,981.79 1.45
The South Indian Bank Ltd.** INE683A16EM0 CARE A1+ 5,000 4,971.94 1.45
The South Indian Bank Ltd.** INE683A16EO6 CARE A1+ 5,000 4,965.41 1.45
Canara Bank** INE476A16LB7 CRISIL A1+ 5,000 4,964.82 1.45
UCO Bank** INE691A16IY9 CRISIL A1+ 5,000 4,964.66 1.45
Punjab & Sind Bank** INE608A16GZ4 [ICRA]A1+ 5,000 4,958.05 1.45
IDBI Bank Ltd.** INE008A16XA5 CRISIL A1+ 5,000 4,957.88 1.45
Punjab & Sind Bank** INE608A16HA5 [ICRA]A1+ 5,000 4,953.66 1.45
Indian Bank** INE562A16GY6 Fitch A1+ 5,000 4,953.55 1.45
Allahabad Bank** INE428A16OC0 [ICRA]A1+ 2,500 2,494.66 0.73
Allahabad Bank** INE428A16OE6 [ICRA]A1+ 2,500 2,490.80 0.73
Kotak Mahindra Bank Ltd.** INE237A16A08 CRISIL A1+ 2,500 2,490.59 0.73
State Bank of Mysore** INE651A16GW1 [ICRA]A1+ 2,500 2,490.10 0.73
Syndicate Bank** INE667A16EM3 CRISIL A1+ 2,500 2,486.91 0.73
Indian Bank** INE562A16GW0 Fitch A1+ 2,500 2,482.37 0.72
Canara Bank** INE476A16OS5 CRISIL A1+ 2,500 2,481.85 0.72
State Bank of Patiala** INE652A16IK0 [ICRA]A1+ 2,500 2,478.48 0.72
Punjab & Sind Bank** INE608A16GX9 [ICRA]A1+ 2,500 2,478.08 0.72
Union Bank of India** INE692A16DS0 CRISIL A1+ 2,500 2,477.91 0.72
Bank of Maharashtra** INE457A16FR5 CRISIL A1+ 2,500 2,477.73 0.72
Indian Bank** INE562A16EM6 Fitch A1+ 2,500 2,477.41 0.72
State Bank of Travancore** INE654A16EV2 CRISIL A1+ 2,500 2,476.91 0.72
Total 124,225.72 36.27
Commercial Paper
SREI Equipment Finance Ltd.** INE881J14HP2 [ICRA]A1+ 3,000 14,798.44 4.32
India Infoline Finance Ltd.** INE866I14LQ5 [ICRA]A1+ 2,800 13,884.28 4.05
Kalpataru Power Transmission Ltd.** INE220B14702 CRISIL A1+ 2,000 9,928.63 2.90
Indiabulls Housing Finance Ltd.** INE148I14FP2 CRISIL A1+ 2,000 9,904.39 2.89
Simplex Infrastructures Ltd.** INE059B14EG8 CARE A1+ 2,000 9,880.80 2.88
Magma Fincorp Ltd.** INE511C14LR8 CARE A1+ 1,860 9,172.67 2.68
Reliance Capital Ltd.** INE013A14SP8 CRISIL A1+ 1,500 7,476.28 2.18
Mahindra & Mahindra Financial Services Ltd** INE774D14GX8 CRISIL A1+ 1,500 7,471.22 2.18
Chambal Fertilizers & Chemicals Ltd.** INE085A14701 CRISIL A1+ 1,500 7,452.82 2.18
L&T Finance Ltd.** INE523E14MQ9 CARE A1+ 1,500 7,451.71 2.17
National Fertilizers Ltd.** INE870D14478 CRISIL A1+ 1,100 5,473.35 1.60
Magma Fincorp Ltd.** INE511C14LN7 CARE A1+ 1,000 4,987.78 1.46
Indiabulls Housing Finance Ltd.** INE148I14FQ0 CRISIL A1+ 1,000 4,979.37 1.45
Godrej Properties Ltd.** INE484J14277 [ICRA]A1+ 1,000 4,960.03 1.45
Magma Fincorp Ltd.** INE511C14LO5 CARE A1+ 1,000 4,956.53 1.45
Redington (India) Ltd.** INE891D14IV0 [ICRA]A1+ 1,000 4,952.99 1.45
Redington (India) Ltd.** INE891D14IW8 [ICRA]A1+ 1,000 4,951.92 1.45
Raymond Ltd.** INE301A14AT7 CARE A1+ 900 4,471.11 1.30
India Infoline Finance Ltd.** INE866I14LU7 [ICRA]A1+ 700 3,463.47 1.01
Kotak Mahindra Investments Ltd.** INE975F14DE3 CRISIL A1+ 500 2,488.66 0.73
Indiabulls Housing Finance Ltd.** INE148I14FS6 CRISIL A1+ 500 2,487.86 0.73
National Fertilizers Ltd.** INE870D14486 CRISIL A1+ 500 2,486.12 0.73
SREI Equipment Finance Ltd.** INE881J14HQ0 [ICRA]A1+ 500 2,463.96 0.72
Simplex Infrastructures Ltd.** INE059B14EH6 CARE A1+ 400 1,974.42 0.58
Total 152,518.83 44.54
Fixed Deposit
Andhra Bank Fixed Deposit 15,000.00 4.38
IndusInd Bank Ltd. Fixed Deposit 13,000.00 3.79
Karur Vysya Bank Ltd. Fixed Deposit 13,000.00 3.79
Allahabad Bank Fixed Deposit 3,000.00 0.88
Total 44,000.00 12.84
Treasury Bill
91 DAYS TREASURY BILL RED 20-11-2014 INT091201114 SOVEREIGN 10,000,000 9,956.33 2.91
91 DAYS TREASURY BILL RED 13-11-2014 INT091131114 SOVEREIGN 5,000,000 4,986.31 1.46
182 DAYS TREASURY BILL RED 04-12-2014 INT182041214 SOVEREIGN 2,500,000 2,481.39 0.72
Total 17,424.03 5.09
Reverse Repos / CBLOs 4,201.12 1.23
Total 4,201.12 1.23
Net Current Assets (including cash & bank balances) 282.00 0.03
Total Net Assets as on 31-Oct-2014 342,651.70 100.00
** Securities are classified as thinly traded / non traded on the date of valuation in accordance with SEBI Regulations and Guidelines.
This product is suitable for investors who are seeking*:
*Investors should consult their financial advisers if in doubt about whether the product is suitable for them.
Note: Risk may be represented as:
Mutual Fund investments are subject to market risks, read all scheme related documents carefully.
• Investment in Money Market Instruments
• Low risk (BLUE)
(BLUE) investors understand that their principal will be at low risk
(YELLOW) investors understand that their principal will be at medium risk
(BROWN) investors understand that their principal will be at high risk
Name of the Mutual Fund : HSBC Mutual Fund
Name of the Scheme : HSBC CASH FUND (An open-ended Liquid Scheme)
Monthly Portfolio Statement as of October 31,2014
• Overnight liquidity over short term

Name of the Instrument ISIN Rating/Industries Quantity Market Value
(Rs in Lacs)
Percentage
to
Net AssetsMutual Fund Units
Overseas Mutual Fund
HSBC GIF ASIA PACIFIC EX JAPAN EQ HD-S9D LU0955568414 OVERSEAS MUTUAL FUND 733,373 4,796.86 98.70
Total 4,796.86 98.70
Reverse Repos / CBLOs 100.08 2.06
Total 100.08 2.06
Net Current Assets (including cash & bank balances) (37.13) (0.76)
Total Net Assets as on 31-Oct-2014 4,859.81 100.00
** Securities are classified as thinly traded / non traded on the date of valuation in accordance with SEBI Regulations and Guidelines.
This product is suitable for investors who are seeking*:
*Investors should consult their financial advisers if in doubt about whether the product is suitable for them.
Note: Risk may be represented as:
Mutual Fund investments are subject to market risks, read all scheme related documents carefully.
• Investment in equity and equity related securities of Asia Pacific countries (excluding Japan) through fund of funds route
• High risk (BROWN)
(BLUE) investors understand that their principal will be at low risk
(YELLOW) investors understand that their principal will be at medium risk
(BROWN) investors understand that their principal will be at high risk
Name of the Mutual Fund : HSBC Mutual Fund
Name of the Scheme : HSBC ASIA PACIFIC (EX JAPAN) DIVIDEND YIELD FUND (An open-ended fund of funds Scheme)
Monthly Portfolio Statement as of October 31,2014
• Regular income and wealth over the long-term

Name of the Instrument ISIN Rating/Industries Quantity Market Value
(Rs in Lacs)
Percentage
to
Net AssetsMutual Fund Units
Overseas Mutual Fund
HSBC GIF BRAZIL EQUITY S3D LU0518041040 OVERSEAS MUTUAL FUND 379,184 5,805.92 99.50
Total 5,805.92 99.50
Reverse Repos / CBLOs 117.18 2.01
Total 117.18 2.01
Net Current Assets (including cash & bank balances) (88.30) (1.51)
Total Net Assets as on 31-Oct-2014 5,834.81 100.00
** Securities are classified as thinly traded / non traded on the date of valuation in accordance with SEBI Regulations and Guidelines.
This product is suitable for investors who are seeking*:
*Investors should consult their financial advisers if in doubt about whether the product is suitable for them.
Note: Risk may be represented as:
Mutual Fund investments are subject to market risks, read all scheme related documents carefully.
• Investment in equity and equity related securities through feeder route in Brazilian markets
• High risk (BROWN)
(BLUE) investors understand that their principal will be at low risk
(YELLOW) investors understand that their principal will be at medium risk
(BROWN) investors understand that their principal will be at high risk
Name of the Mutual Fund : HSBC Mutual Fund
Name of the Scheme : HSBC BRAZIL FUND (An open-ended fund of funds Scheme)
Monthly Portfolio Statement as of October 31,2014
• To create wealth over long term

Name of the Instrument ISIN Rating/Industries Quantity Market Value
(Rs in Lacs)
Percentage
to
Net AssetsMutual Fund Units
Overseas Mutual Fund
HSBC GIF Glob Emerg Mkts Eq S1 Dis LU0307789528 OVERSEAS MUTUAL FUND 262,867 1,163.03 98.74
Total 1,163.03 98.74
Reverse Repos / CBLOs 21.42 1.82
Total 21.42 1.82
Net Current Assets (including cash & bank balances) (6.61) (0.56)
Total Net Assets as on 31-Oct-2014 1,177.85 100.00
** Securities are classified as thinly traded / non traded on the date of valuation in accordance with SEBI Regulations and Guidelines.
This product is suitable for investors who are seeking*:
*Investors should consult their financial advisers if in doubt about whether the product is suitable for them.
Note: Risk may be represented as:
Mutual Fund investments are subject to market risks, read all scheme related documents carefully.
• Investment in equity and equity related securities of Emerging economies
• High risk (BROWN)
(BLUE) investors understand that their principal will be at low risk
(YELLOW) investors understand that their principal will be at medium risk
(BROWN) investors understand that their principal will be at high risk
Name of the Mutual Fund : HSBC Mutual Fund
Name of the Scheme : HSBC EMERGING MARKETS FUND (An open-ended fund of funds Scheme)
Monthly Portfolio Statement as of October 31,2014
• To create wealth over long term

Name of the Instrument ISIN Rating/Industries Quantity Market Value
(Rs in Lacs)
Percentage
to
Net AssetsMutual Fund Units
Domestic Mutual Fund Unit
HSBC INC FUND SHORT TERM - GROWTH DIRECT INF336L01DL7 Mutual Fund 54,667,290 12,349.34 42.55
HSBC FLEXI DEBT FUND GROWTH DIRECT INF336L01CO3 Mutual Fund 43,048,523 7,917.83 27.28
HSBC Equity Fund - Growth Direct INF336L01CM7 Mutual Fund 2,322,586 3,438.14 11.85
HDFC Income Fund Direct Plan - Growth INF179K01WL3 Mutual Fund 8,612,696 2,623.55 9.04
HSBC INCOME FUND INV PLAN GROWTH DIRECT INF336L01DE2 Mutual Fund 7,888,056 1,793.50 6.18
HSBC MIDCAP EQUITY FUND - GROWTH DIRECT INF336L01DQ6 Mutual Fund 2,787,887 959.02 3.30
Total 29,081.37 100.20
Reverse Repos / CBLOs 238.22 0.82
Total 238.22 0.82
Net Current Assets (including cash & bank balances) (294.94) (1.02)
Total Net Assets as on 31-Oct-2014 29,024.66 100.00
** Securities are classified as thinly traded / non traded on the date of valuation in accordance with SEBI Regulations and Guidelines.
This product is suitable for investors who are seeking*:
*Investors should consult their financial advisers if in doubt about whether the product is suitable for them.
Note: Risk may be represented as:
Mutual Fund investments are subject to market risks, read all scheme related documents carefully.
• Investing predominantly in units of debt mutual funds as well as in a basket of equity mutual funds, gold & other exchange traded
• Medium risk (YELLOW)
(BLUE) investors understand that their principal will be at low risk
(YELLOW) investors understand that their principal will be at medium risk
(BROWN) investors understand that their principal will be at high risk
Name of the Mutual Fund : HSBC Mutual Fund
Name of the Scheme : HSBC MANAGED SOLUTION INDIA-CONSERVATIVE (An open-ended fund of funds Scheme)
Monthly Portfolio Statement as of October 31,2014
• To provide income over the long-term

Name of the Instrument ISIN Rating/Industries Quantity Market Value
(Rs in Lacs)
Percentage
to
Net AssetsMutual Fund Units
Domestic Mutual Fund Unit
HSBC Equity Fund - Growth Direct INF336L01CM7 Mutual Fund 3,906,345 5,782.59 58.43
HSBC MIDCAP EQUITY FUND - GROWTH DIRECT INF336L01DQ6 Mutual Fund 4,220,641 1,451.88 14.67
HSBC INCOME FUND INV PLAN GROWTH DIRECT INF336L01DE2 Mutual Fund 4,532,937 1,030.65 10.41
HSBC FLEXI DEBT FUND GROWTH DIRECT INF336L01CO3 Mutual Fund 3,123,727 574.54 5.81
Total 8,839.66 89.32
Mutual Fund Units
Overseas Mutual Fund
HSBC MSCI WORLD UCITS ETF IE00B4X9L533 OVERSEAS MUTUAL FUND 88,200 926.30 9.36
Total 926.30 9.36
Reverse Repos / CBLOs 172.89 1.75
Total 172.89 1.75
Net Current Assets (including cash & bank balances) (42.20) (0.43)
Total Net Assets as on 31-Oct-2014 9,896.64 100.00
** Securities are classified as thinly traded / non traded on the date of valuation in accordance with SEBI Regulations and Guidelines.
This product is suitable for investors who are seeking*:
*Investors should consult their financial advisers if in doubt about whether the product is suitable for them.
Note: Risk may be represented as:
Mutual Fund investments are subject to market risks, read all scheme related documents carefully.
• Investing predominantly in units of equity mutual funds as well as in a basket of debt mutual funds, gold & exchange traded funds, offshore
• High risk (BROWN)
(BLUE) investors understand that their principal will be at low risk
(YELLOW) investors understand that their principal will be at medium risk
(BROWN) investors understand that their principal will be at high risk
Name of the Mutual Fund : HSBC Mutual Fund
Name of the Scheme : HSBC MANAGED SOLUTIONS INDIA-GROWTH (An open-ended fund of funds Scheme)
Monthly Portfolio Statement as of October 31,2014
• To create wealth over the long-term

Name of the Instrument ISIN Rating/Industries Quantity Market Value
(Rs in Lacs)
Percentage
to
Net AssetsMutual Fund Units
Domestic Mutual Fund Unit
HSBC Equity Fund - Growth Direct INF336L01CM7 Mutual Fund 4,408,909 6,526.54 39.01
HSBC FLEXI DEBT FUND GROWTH DIRECT INF336L01CO3 Mutual Fund 24,386,188 4,485.30 26.81
HSBC INCOME FUND INV PLAN GROWTH DIRECT INF336L01DE2 Mutual Fund 8,228,010 1,870.79 11.18
HSBC MIDCAP EQUITY FUND - GROWTH DIRECT INF336L01DQ6 Mutual Fund 5,044,526 1,735.29 10.37
HSBC INC FUND SHORT TERM - GROWTH DIRECT INF336L01DL7 Mutual Fund 2,142,001 483.88 2.89
Total 15,101.80 90.26
Mutual Fund Units
Overseas Mutual Fund
HSBC MSCI WORLD UCITS ETF IE00B4X9L533 OVERSEAS MUTUAL FUND 114,900 1,206.71 7.21
Total 1,206.71 7.21
Reverse Repos / CBLOs 738.23 4.41
Total 738.23 4.41
Net Current Assets (including cash & bank balances) (316.90) (1.88)
Total Net Assets as on 31-Oct-2014 16,729.84 100.00
** Securities are classified as thinly traded / non traded on the date of valuation in accordance with SEBI Regulations and Guidelines.
This product is suitable for investors who are seeking*:
*Investors should consult their financial advisers if in doubt about whether the product is suitable for them.
Note: Risk may be represented as:
Mutual Fund investments are subject to market risks, read all scheme related documents carefully.
• Investments in a basket of debt mutual funds, equity mutual funds, gold & exchange traded funds, offshore mutual funds and money market
• Medium risk (YELLOW)
(BLUE) investors understand that their principal will be at low risk
(YELLOW) investors understand that their principal will be at medium risk
(BROWN) investors understand that their principal will be at high risk
Name of the Mutual Fund : HSBC Mutual Fund
Name of the Scheme : HSBC MANAGED SOLUTIONS INDIA-MODERATE (An open-ended fund of funds Scheme)
Monthly Portfolio Statement as of October 31,2014
• To create wealth and provide income over the long-term