more on rfm and logistic: lifts and gains - oakton.edu · we are using rfm for tuscan lifestyles to...
TRANSCRIPT
More on RFM and Logistic: Lifts and Gains
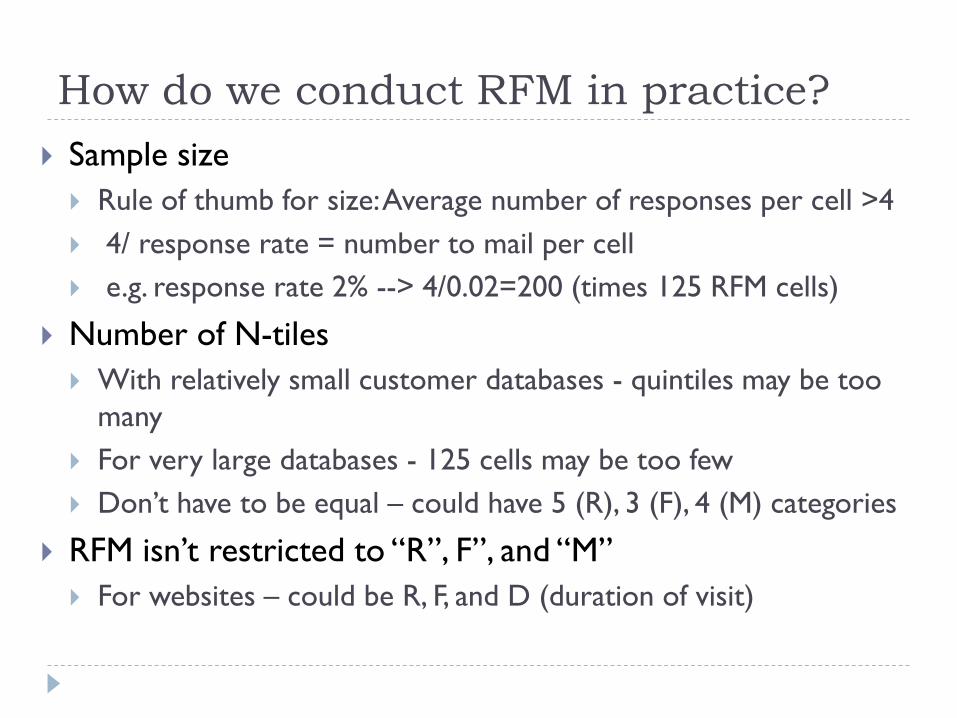
How do we conduct RFM in practice? Sample size Rule of thumb for size: Average number of responses per cell >4 4/ response rate = number to mail per cell e.g. response rate 2% --> 4/0.02=200 (times 125 RFM cells)
Number of N-tiles With relatively small customer databases - quintiles may be too
many For very large databases - 125 cells may be too few Don’t have to be equal – could have 5 (R), 3 (F), 4 (M) categories
RFM isn’t restricted to “R”, F”, and “M” For websites – could be R, F, and D (duration of visit)
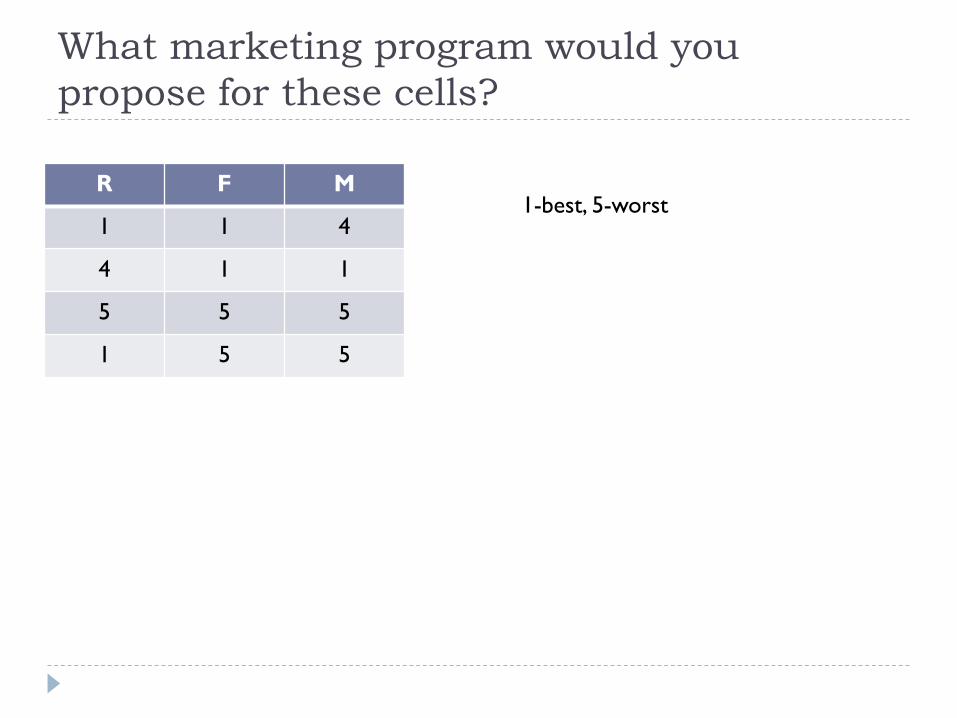
What marketing program would you propose for these cells?
R F M
1 1 4
4 1 1
5 5 5
1 5 5
1-best, 5-worst
Lessons about RFM RFM analysis is Effective Simple Intuitive Flexible
Does not require sophisticated software or analytics Anyone can do it
RFM can handle only few predictive variables There may be much more predictive information (logistic is
solution)

How do we assess model’s performance and compare it to that of different models? Model performance measures General approach
We are generally interested in models that predict or classify Use model to rank/score customers Calculate improvement in response over no targeting
Lifts “Expected number of customers relative to random targeting”
Gains “Percentage of total buyers we expect from targeting X% of
customers”

We are using RFM for Tuscan Lifestyles to estimate lifts Approach for calculation of lifts Perform RFM Organize cells in deciles by response rate (variable buyer) Estimate lifts by comparing response rates in deciles and base
response rate
Dataset tuscan_lg Contains independent and sequential RFM indices
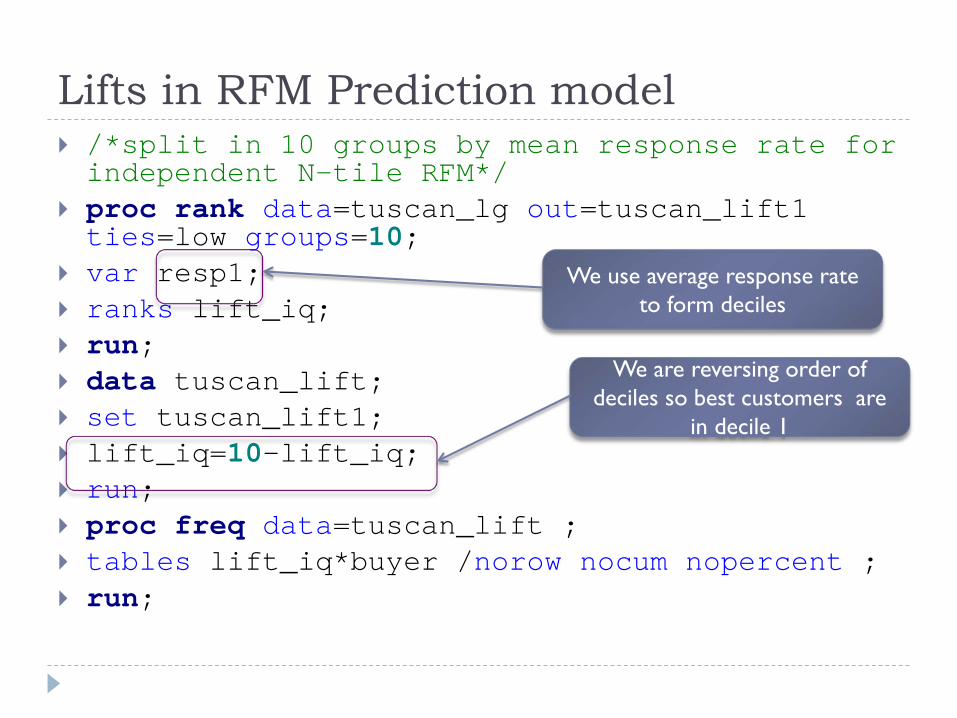
Lifts in RFM Prediction model /*split in 10 groups by mean response rate for independent N-tile RFM*/
proc rank data=tuscan_lg out=tuscan_lift1 ties=low groups=10;
var resp1; ranks lift_iq; run; data tuscan_lift; set tuscan_lift1; lift_iq=10-lift_iq; run; proc freq data=tuscan_lift ; tables lift_iq*buyer /norow nocum nopercent ; run;
We use average response rate to form deciles
We are reversing order of deciles so best customers are
in decile 1
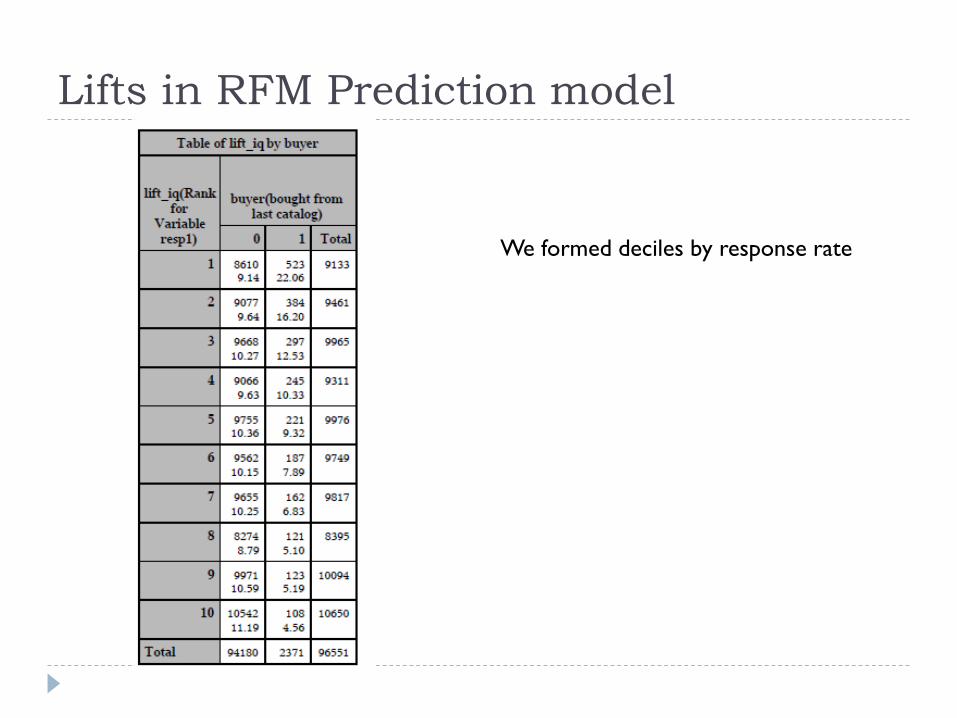
Lifts in RFM Prediction model
We formed deciles by response rate

Calculation of Lift: Independent N-tile RFMScore Decile # Customers Cum # Cum % # Buyers Cum # Response Lift Cum. Resp. Cum. Lift
Customers Customers Buyers Rate Rate1 9133 9133 9.5% 523 523 5.73% 2.33 5.73% 2.332 9461 18594 19.3% 384 907 4.06% 1.65 4.88% 1.983 9965 28559 29.6% 297 1204 2.98% 1.21 4.22% 1.714 9311 37870 39.2% 245 1449 2.63% 1.07 3.83% 1.565 9976 47846 49.6% 221 1670 2.22% 0.90 3.49% 1.426 9749 57595 59.7% 187 1857 1.92% 0.78 3.22% 1.317 9817 67412 69.8% 162 2019 1.65% 0.67 3.00% 1.228 8395 75807 78.5% 121 2140 1.44% 0.59 2.82% 1.159 10094 85901 89.0% 123 2263 1.22% 0.50 2.63% 1.07
10 10650 96551 100.0% 108 2371 1.01% 0.41 2.46% 1.00Total 96551 2371 2.46%
• Cumulative # customers: the number of total customers up to and including that decile• Cumulative % customers: the percent of total customers up to and including that decile• Cumulative # Buyers: the number of buyers up to and including that decile• Response Rate: the actual response rate for each decile, computed by the number of
buyers divided by the number of customers for each decile• Lift: (response rate for each decile) / (overall response rate)• Cumulative Response Rate: cumulative # buyers / cumulative # customers• Cum(ulative) Lift: (cumulative response rate) / (overall response rate) *100
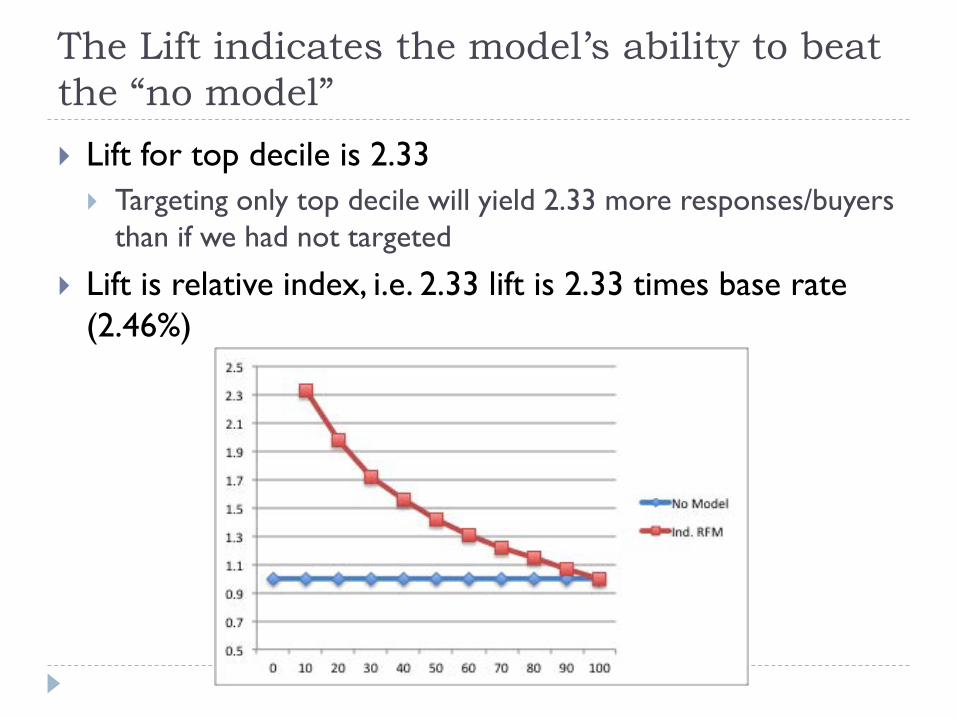
The Lift indicates the model’s ability to beat the “no model” Lift for top decile is 2.33 Targeting only top decile will yield 2.33 more responses/buyers
than if we had not targeted
Lift is relative index, i.e. 2.33 lift is 2.33 times base rate (2.46%)
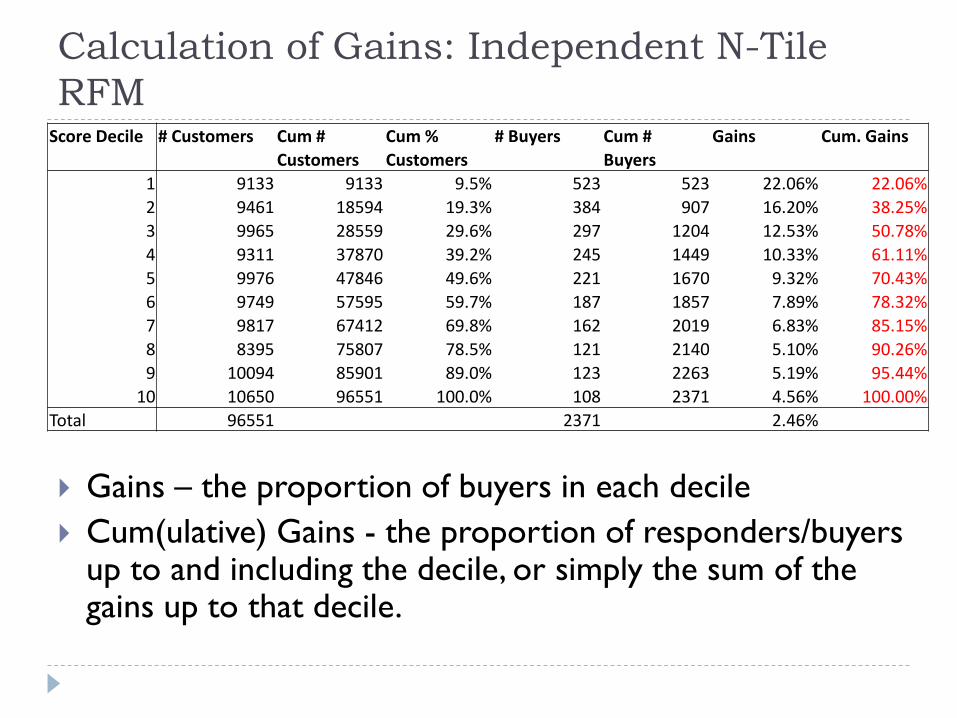
Calculation of Gains: Independent N-Tile RFM
Gains – the proportion of buyers in each decile Cum(ulative) Gains - the proportion of responders/buyers
up to and including the decile, or simply the sum of the gains up to that decile.
Score Decile # Customers Cum # Cum % # Buyers Cum # Gains Cum. GainsCustomers Customers Buyers
1 9133 9133 9.5% 523 523 22.06% 22.06%2 9461 18594 19.3% 384 907 16.20% 38.25%3 9965 28559 29.6% 297 1204 12.53% 50.78%4 9311 37870 39.2% 245 1449 10.33% 61.11%5 9976 47846 49.6% 221 1670 9.32% 70.43%6 9749 57595 59.7% 187 1857 7.89% 78.32%7 9817 67412 69.8% 162 2019 6.83% 85.15%8 8395 75807 78.5% 121 2140 5.10% 90.26%9 10094 85901 89.0% 123 2263 5.19% 95.44%
10 10650 96551 100.0% 108 2371 4.56% 100.00%Total 96551 2371 2.46%

Gains Chart The Gains chart reveals what proportion of responders we can
expect to gain from targeting a specific percent of customers using the model
By using the RFM model to target only top decile we can get 22.06% buyers
We can get 50.78% customers by targeting three top deciles

Lifts and gains for sequential RFM /*split in 10 groups by mean response rate for sequential N-tile RFM*/
proc rank data=tuscan_lg out=tuscan_lift1 ties=low groups=10;
var resp2; ranks lift_sq; run; data tuscan_lift; set tuscan_lift1; lift_sq=10-lift_sq; run; proc freq data=tuscan_lift ; tables lift_sq*buyer /norow nocum nopercent ; run;
We use average response rate to form deciles
We are reversing order of deciles so best customers are
in decile 1
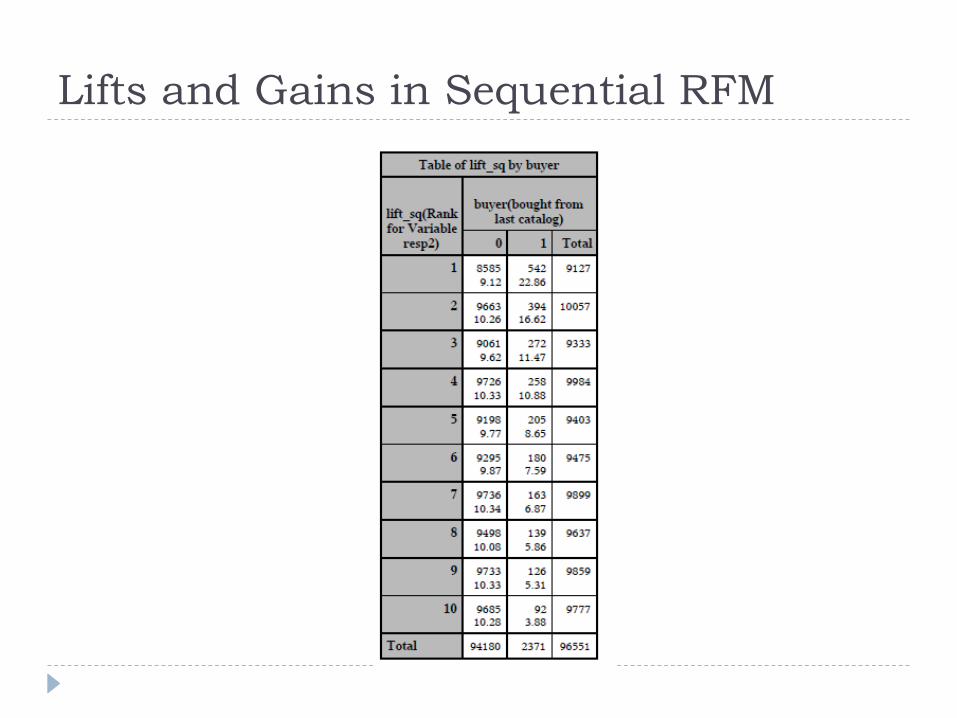
Lifts and Gains in Sequential RFM
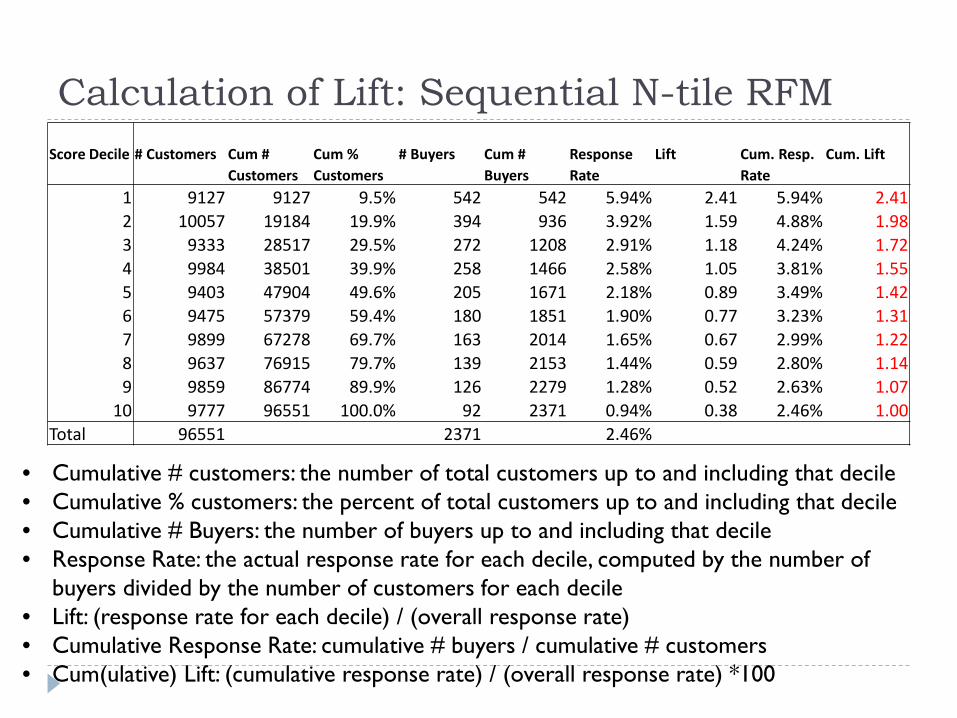
Calculation of Lift: Sequential N-tile RFM
• Cumulative # customers: the number of total customers up to and including that decile• Cumulative % customers: the percent of total customers up to and including that decile• Cumulative # Buyers: the number of buyers up to and including that decile• Response Rate: the actual response rate for each decile, computed by the number of
buyers divided by the number of customers for each decile• Lift: (response rate for each decile) / (overall response rate)• Cumulative Response Rate: cumulative # buyers / cumulative # customers• Cum(ulative) Lift: (cumulative response rate) / (overall response rate) *100
Score Decile # Customers Cum # Cum % # Buyers Cum # Response Lift Cum. Resp. Cum. LiftCustomers Customers Buyers Rate Rate
1 9127 9127 9.5% 542 542 5.94% 2.41 5.94% 2.412 10057 19184 19.9% 394 936 3.92% 1.59 4.88% 1.983 9333 28517 29.5% 272 1208 2.91% 1.18 4.24% 1.724 9984 38501 39.9% 258 1466 2.58% 1.05 3.81% 1.555 9403 47904 49.6% 205 1671 2.18% 0.89 3.49% 1.426 9475 57379 59.4% 180 1851 1.90% 0.77 3.23% 1.317 9899 67278 69.7% 163 2014 1.65% 0.67 2.99% 1.228 9637 76915 79.7% 139 2153 1.44% 0.59 2.80% 1.149 9859 86774 89.9% 126 2279 1.28% 0.52 2.63% 1.07
10 9777 96551 100.0% 92 2371 0.94% 0.38 2.46% 1.00Total 96551 2371 2.46%
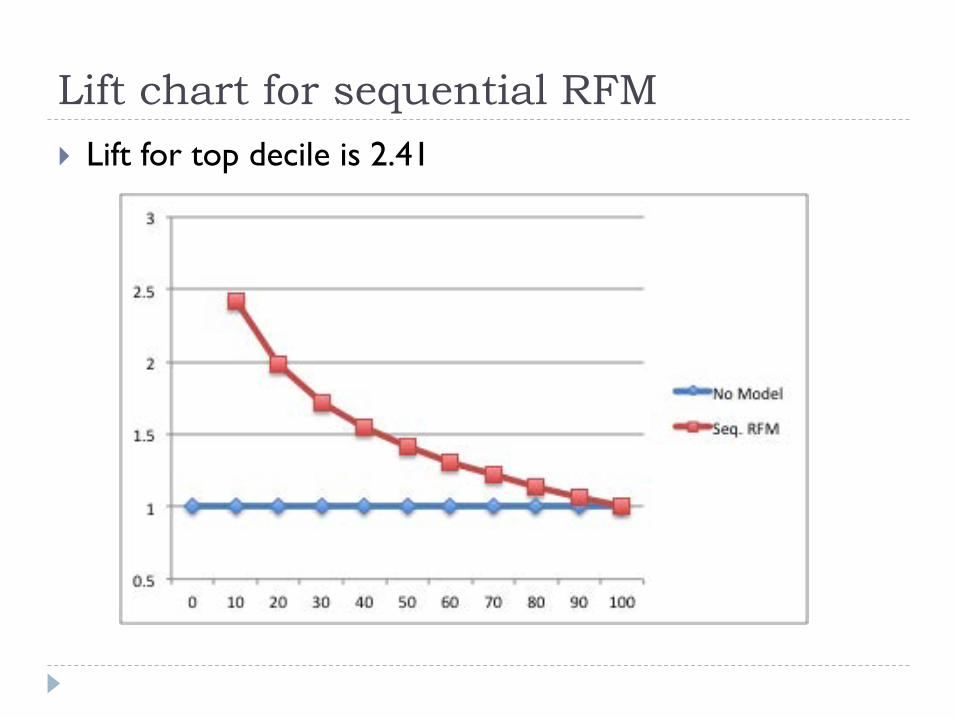
Lift chart for sequential RFM Lift for top decile is 2.41
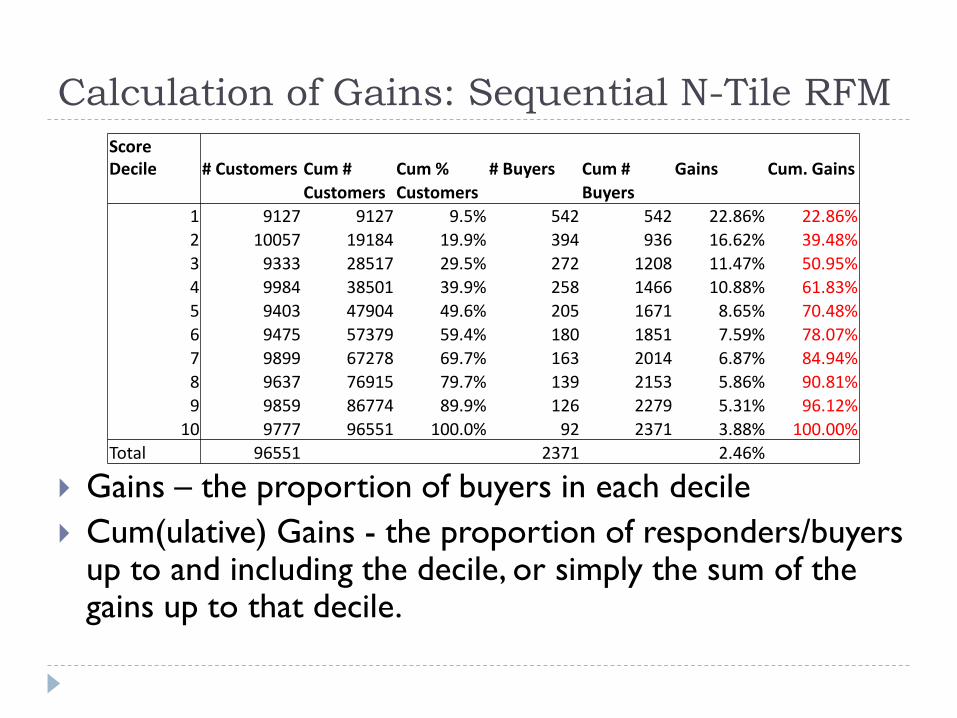
Calculation of Gains: Sequential N-Tile RFM
Gains – the proportion of buyers in each decile Cum(ulative) Gains - the proportion of responders/buyers
up to and including the decile, or simply the sum of the gains up to that decile.
Score Decile # Customers Cum # Cum % # Buyers Cum # Gains Cum. Gains
Customers Customers Buyers1 9127 9127 9.5% 542 542 22.86% 22.86%2 10057 19184 19.9% 394 936 16.62% 39.48%3 9333 28517 29.5% 272 1208 11.47% 50.95%4 9984 38501 39.9% 258 1466 10.88% 61.83%5 9403 47904 49.6% 205 1671 8.65% 70.48%6 9475 57379 59.4% 180 1851 7.59% 78.07%7 9899 67278 69.7% 163 2014 6.87% 84.94%8 9637 76915 79.7% 139 2153 5.86% 90.81%9 9859 86774 89.9% 126 2279 5.31% 96.12%
10 9777 96551 100.0% 92 2371 3.88% 100.00%Total 96551 2371 2.46%
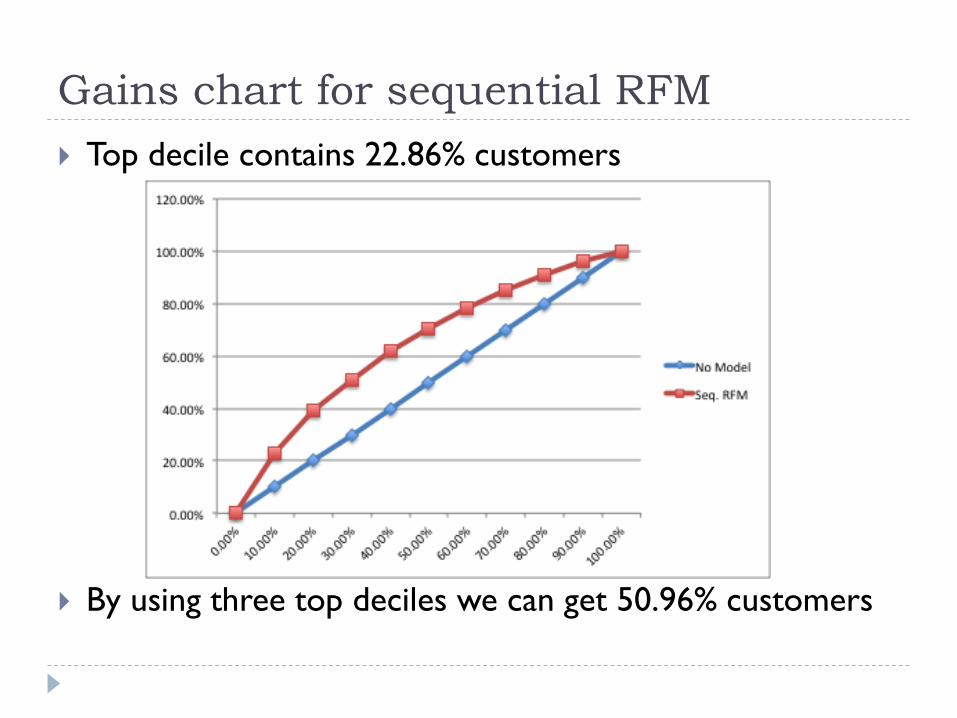
Gains chart for sequential RFM Top decile contains 22.86% customers
By using three top deciles we can get 50.96% customers

Logistic Regressionproc logistic data=tuscan_lgdescending plots=none;model buyer=last totdol numords;output out=tuscan_pr p=resp_pr;run;
Let’s see whether logistic regression provides better results.
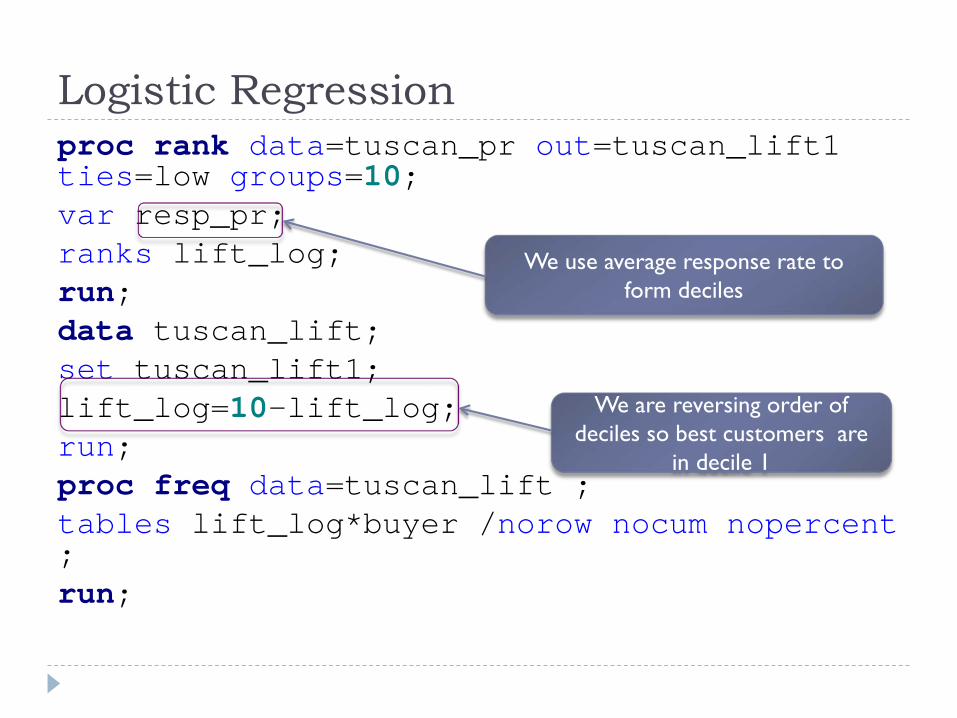
Logistic Regressionproc rank data=tuscan_pr out=tuscan_lift1 ties=low groups=10;var resp_pr;ranks lift_log;run;data tuscan_lift;set tuscan_lift1;lift_log=10-lift_log; run;proc freq data=tuscan_lift ;tables lift_log*buyer /norow nocum nopercent;run;
We use average response rate to form deciles
We are reversing order of deciles so best customers are
in decile 1
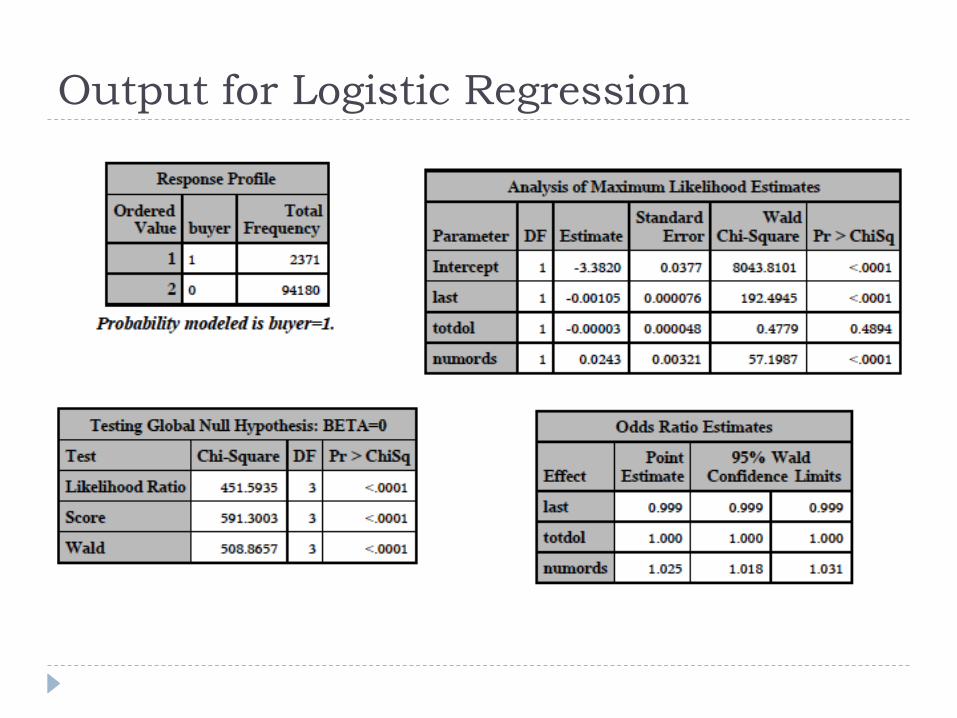
Output for Logistic Regression

Lifts and Gains for Logistic Regression
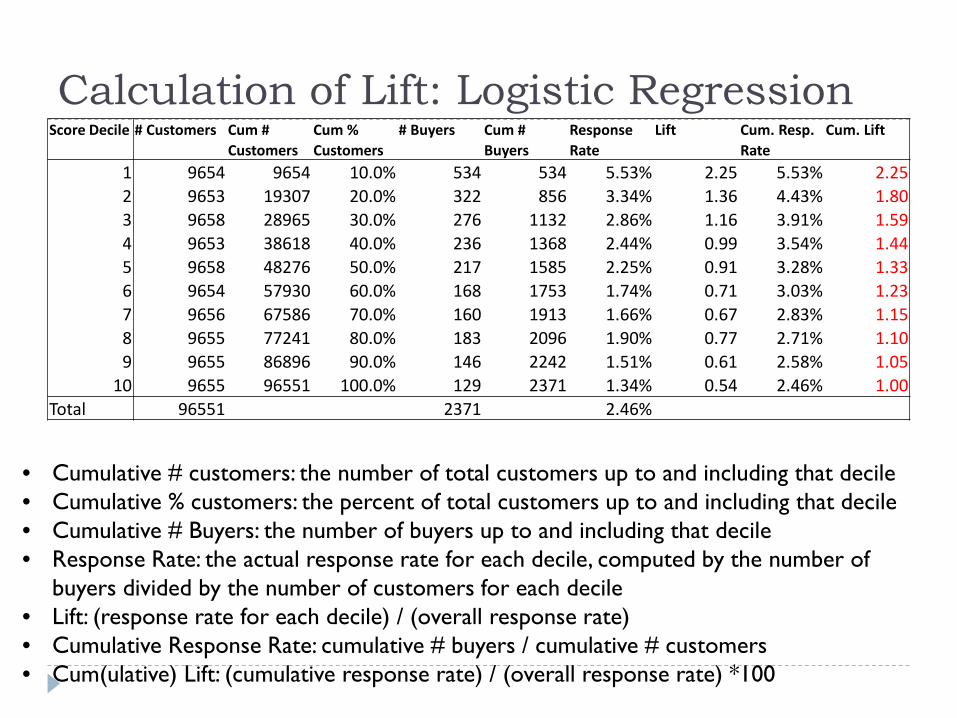
Calculation of Lift: Logistic Regression
• Cumulative # customers: the number of total customers up to and including that decile• Cumulative % customers: the percent of total customers up to and including that decile• Cumulative # Buyers: the number of buyers up to and including that decile• Response Rate: the actual response rate for each decile, computed by the number of
buyers divided by the number of customers for each decile• Lift: (response rate for each decile) / (overall response rate)• Cumulative Response Rate: cumulative # buyers / cumulative # customers• Cum(ulative) Lift: (cumulative response rate) / (overall response rate) *100
Score Decile # Customers Cum # Cum % # Buyers Cum # Response Lift Cum. Resp. Cum. LiftCustomers Customers Buyers Rate Rate
1 9654 9654 10.0% 534 534 5.53% 2.25 5.53% 2.252 9653 19307 20.0% 322 856 3.34% 1.36 4.43% 1.803 9658 28965 30.0% 276 1132 2.86% 1.16 3.91% 1.594 9653 38618 40.0% 236 1368 2.44% 0.99 3.54% 1.445 9658 48276 50.0% 217 1585 2.25% 0.91 3.28% 1.336 9654 57930 60.0% 168 1753 1.74% 0.71 3.03% 1.237 9656 67586 70.0% 160 1913 1.66% 0.67 2.83% 1.158 9655 77241 80.0% 183 2096 1.90% 0.77 2.71% 1.109 9655 86896 90.0% 146 2242 1.51% 0.61 2.58% 1.05
10 9655 96551 100.0% 129 2371 1.34% 0.54 2.46% 1.00Total 96551 2371 2.46%

Calculation of Gains: Logistic Regression
Gains – the proportion of buyers in each decile Cum(ulative) Gains - the proportion of responders/buyers
up to and including the decile, or simply the sum of the gains up to that decile.
Score Decile # Customers Cum # Cum % # Buyers Cum # Gains Cum. GainsCustomers Customers Buyers
1 9654 9654 10.0% 534 534 22.52% 22.52%2 9653 19307 20.0% 322 856 13.58% 36.10%3 9658 28965 30.0% 276 1132 11.64% 47.74%4 9653 38618 40.0% 236 1368 9.95% 57.70%5 9658 48276 50.0% 217 1585 9.15% 66.85%6 9654 57930 60.0% 168 1753 7.09% 73.94%7 9656 67586 70.0% 160 1913 6.75% 80.68%8 9655 77241 80.0% 183 2096 7.72% 88.40%9 9655 86896 90.0% 146 2242 6.16% 94.56%
10 9655 96551 100.0% 129 2371 5.44% 100.00%Total 96551 2371 2.46%

Lift chart for Logistic regression Lift for top decile is 2.25
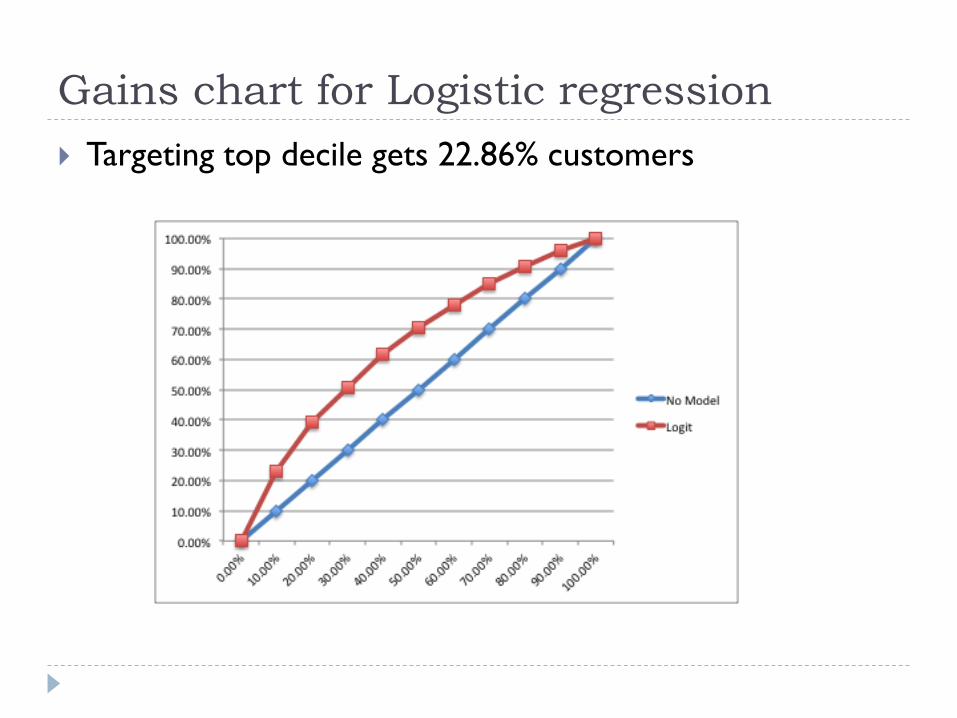
Gains chart for Logistic regression Targeting top decile gets 22.86% customers
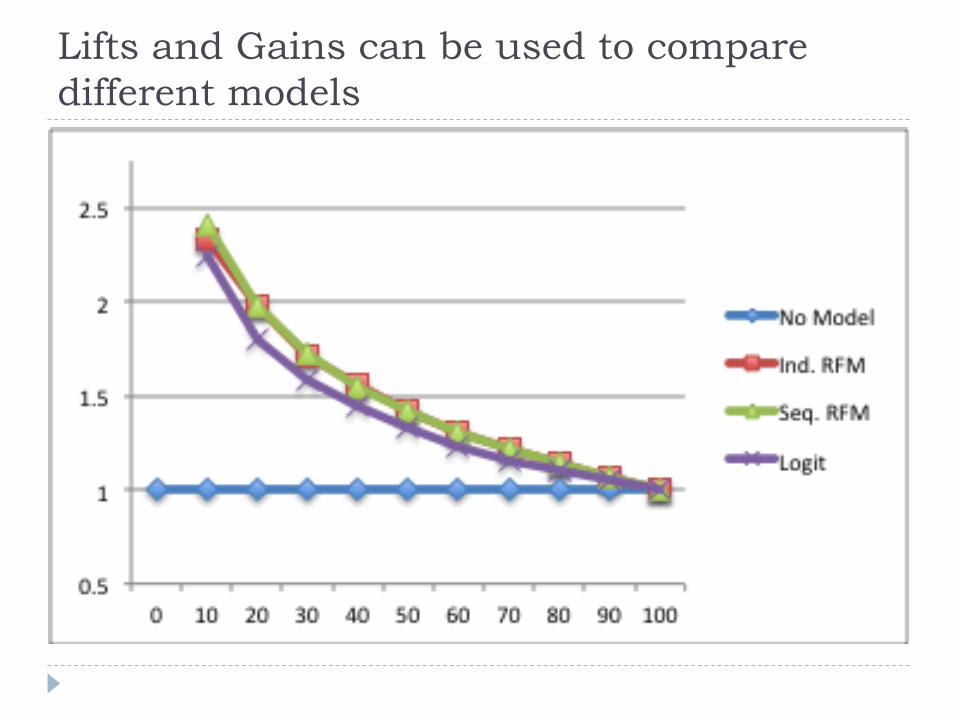
Lifts and Gains can be used to compare different models
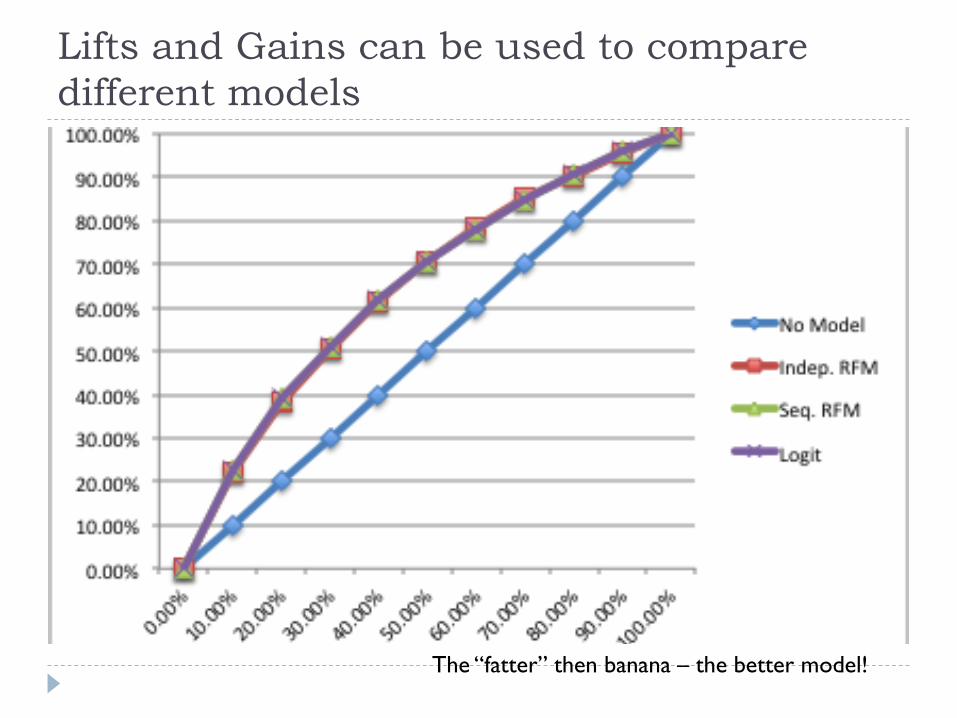
Lifts and Gains can be used to compare different models
The “fatter” then banana – the better model!

Concordance vs. Lifts for Logistic Regression Concordance – proportion of observations that may be
correctly predicted (buyer=0 or buyer=1) by logistic regression
The highest lift is 2.25, which corresponds to 5.53% response rate for top decile.
Interpretation?
59.4% cases may be correctly classified