moscow 2004 21cm cosmology collaborators: collaborators: rennan barkana, stuart wyithe, matias...
TRANSCRIPT

Moscow 2004
21cm Cosmology
Collaborators:Collaborators: Rennan Barkana, Stuart Wyithe, Matias Zaldarriaga
Avi Loeb
Harvard University


Ionization History of Hydrogen
REDSHIFT
TIME
10006
Million years
Billion years

Emergence of the First Star Clusters
molecular hydrogen
Yoshida et al. 2003

Hydrogen
spin
e-
p
p
p
e-
e-
Ground level
21cm= (1:4GHz)à1
0s1=2
1s1=2
n0n1= g0
g1expfà Ts0:068Kg (g1=g0) = 3Spin Temperature
excitation rate= (atomic collisions)+(radiative coupling to CMB)Couple to Couples to Ts TsTk Tí
PredictedPredicted by Van de Hulst in 1944; ObservedObserved by Ewen &Purcell in 1951 at Harvard

21 cm Absorption by Hydrogen Prior to Structure Formation21 cm Absorption by Hydrogen Prior to Structure Formation
Loeb & Zaldarriaga, Phys. Rev. Lett., 2004; Loeb & Zaldarriaga, Phys. Rev. Lett., 2004; Scott & Rees, MNRAS, 1990Scott & Rees, MNRAS, 1990
Observed wavelength=21cm (1+z) 3D tomography (slicing the universe in redshift )
Tb= ü 1+zTsà Tí
ð ñTb= 28mK 10
1+zà á1=2Ts
TsàTíð ñ
Fluctuations in Fluctuations in 21cm brightness are 21cm brightness are sourced by sourced by fluctuations in gas fluctuations in gas densitydensity

Largest Data Set on the SkyLargest Data Set on the Sky
Loeb & Zaldarriaga, Phys. Rev. Lett., 2004; astro-ph/0312134Loeb & Zaldarriaga, Phys. Rev. Lett., 2004; astro-ph/0312134
Number of independent patches:
ø 1016 106lmax
ð ñ3÷É÷à á
while Silk damping limits the primary CMB anisotropies to only ø 107
Noise due to foreground sky brightness:

Line-of-Sight Anisotropy of 21cm Flux Fluctuations
ü/ dvr=drnHI
1+ î
vr
î v(k~) = à cos2òk â î (k~)
PTb= [cos2òkî (k~) + î iso(k~)]2
î iso= ì î + î xHI + î T+ :::
cos4òk;cos2òk;cos
0òk terms allow separation of powers
Barkana & Loeb, astro-ph/0409572; see also Bharadwaj & Ali, astro-ph/0401206
Peculiar velocity changes
Power spectrum is not isotropic (“Kaiser effect”)
Tb= ü 1+zTsà Tí
ð ñ
= nö(1+ î )ø Hö(1à 3
1î )
k~observer
òk
drdvr !
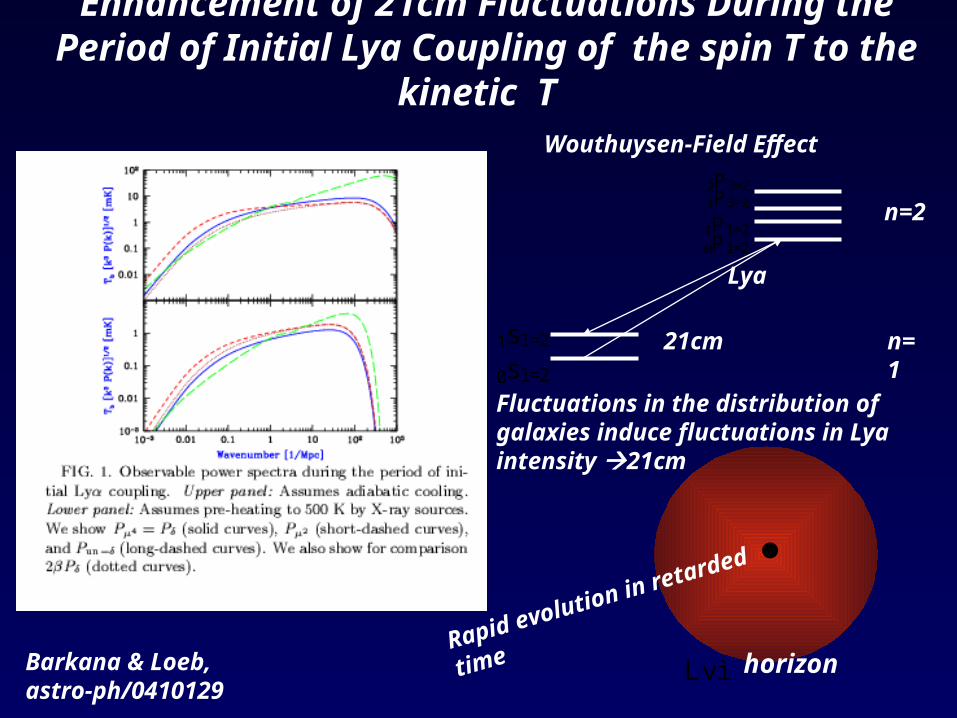
Enhancement of 21cm Fluctuations During the Period of Initial Lya Coupling of the spin T to the kinetic T
Fluctuations in the distribution of galaxies induce fluctuations in Lya intensity 21cm
21cm1s1=20s1=2
0P1=21P1=2
1P3=22P3=2
Lya
Wouthuysen-Field Effect
horizonLyìRapid evolution in retarded time
Barkana & Loeb, astro-ph/0410129
n=1
n=2Tb= 28mK 101+zà á1=2
TsTsàTí
ð ñ
Ts ý Tí ! Tb saturated

Enhancement of 21cm Fluctuations During the Enhancement of 21cm Fluctuations During the Epoch of Initial Lya CouplingEpoch of Initial Lya Coupling
Sourced by fluctuations in Lya intensity from galaxies
Power spectrum of 21cm brightness fluctuations
Poisson fluctuations in Poisson fluctuations in the number of galaxiesthe number of galaxies
Biased fluctuations in Biased fluctuations in the density of galaxiesthe density of galaxies

redshiftz=200z=30
Tí
Tk
Ts
Temperature
Thermal HistoryThermal History
atomic collisions
Radiative coupling to CMB
Wouthuysen-Field Effect
X-ray heating
Sources of 21cm fluctuationsSources of 21cm fluctuations Density inhomogeneties (Loeb & Zaldarriaga 04) and peculiar velocities (Barkana & Loeb 04) Ionized bubbles (Madau,Meiksin &Rees 1997;Furlanetto et al. 2004; Gnedin & Shaver 2003) Emision from mini-halos (Iliev, Shapiro, et al. 2002) Fluctuations in Lya flux, and gas temperature (Barkana & Loeb 2004)

History of 21cm Brightness FluctuationsHistory of 21cm Brightness Fluctuations
•
•
•
Tk < Tcmbwith Tk < Ts < Tcmb
HI appears in absorption against the CMBHI appears in absorption against the CMB30< z < 200
20< z < 30X-ray heating to Tk > Tcmb= 2â 10à 3eV[(1+ z)=10]
Lya coupling of spin temperature to kinetic temperature TkTs
6< z < 20
Reionization: HI gradually disappears
HI appears in emission against the CMBHI appears in emission against the CMB

21cm Tomography of Ionized Bubbles During Reionization is like Slicing Swiss CheeseSlicing Swiss Cheese
Observed wavelength distance
H IIH II H IH I
21cmâ (1+z)

ExperimentsExperiments
*MWA (Mileura Wide-Field Array)MWA (Mileura Wide-Field Array)
MIT/ATNF/CfA
*LOFAR (Low-frequency Array)LOFAR (Low-frequency Array)
Netherlands
*PAST (Primeval Structure Telescope)PAST (Primeval Structure Telescope)
China/CITA
*SKA (Square Kilometer Array)SKA (Square Kilometer Array)
*Enhanced VLAEnhanced VLA
CfA/NRAO

Mileura Wide-Field Array
A very radio quiet site
Antenna design
MIT, ATNF, U. Melbourne, CfA

Characteristics of MWA demonstrator
• 500 16-element antennas in a compact 1.5km array
• Wide 80-300 MHz frequency range
• Digital receiver and filter chain, 32 MHz at 16 kHz resolution
• Full cross-correlation of all 500 antennas, 20-30 degrees field of view

Primary challenge: foregroundsPrimary challenge: foregrounds• Terrestrial: radio broadcasting
• Galactic synchrotron emission • Extragalactic: radio sources
(Di-Matteo et al. 2004)
Although the sky brightness (>10K) is much larger than the 21cm Although the sky brightness (>10K) is much larger than the 21cm signal (<10mK), the foregrounds have a smooth frequency dependence signal (<10mK), the foregrounds have a smooth frequency dependence while the signal fluctuates rapidly across small shifts in frequency while the signal fluctuates rapidly across small shifts in frequency (=redshift). Preliminary estimates indicate that the 21cm signal is (=redshift). Preliminary estimates indicate that the 21cm signal is detectable with the forthcoming generation of low-frequency arrays detectable with the forthcoming generation of low-frequency arrays ((Zaldarriaga et al. astro-ph/0311514; Morales & Hewitt astro-ph/0312437Zaldarriaga et al. astro-ph/0311514; Morales & Hewitt astro-ph/0312437))

When was the Universe Reionized?When was the Universe Reionized?

Empirical HintsEmpirical Hints

First Year Data from WMAPFirst Year Data from WMAP
Polarization/temperature correlation implies an electron-scattering optical depth after cosmological recombination at z=1088 of:
ü= 0:17æ0:04
Implying that the universe was reionized at z = 17æ5Only 200 million years after the big bang
Kogut et al. 2003

Cosmic Hydrogen was significantly Neutral at z~6.3Cosmic Hydrogen was significantly Neutral at z~6.3
Wyithe & Loeb, Nature, 2004; astro-ph/0401188
Size of HII region depends on neutral fraction of IGM prior to quasar activity and quasar age
Ionization(Stromgren) sphere of quasar
line of sight
R(t)

The Earliest Quasar Detected:The Earliest Quasar Detected: zz=6.4=6.4
Fan et al. 2002

Likelihood for Neutral Fraction at z~6.3Likelihood for Neutral Fraction at z~6.3
quasar lifetime= 4â 107f lt 0:1ïà á
yearsM 5=3
1 +M 5=32
(M 1+M 2)5=3
xHISDSS J1148+5251
Wyithe & Loeb, astro-ph/0401188; Wyithe, Loeb, & Carilli, astro-ph/0411625

Imaging the Neutral Fraction in 21cm
21 cm absorption of CMB 21 cm absorption of CMB if IGM is cold or or 21 cm emission21 cm emission due to heating by X-ray background or quasar X-rays (but no Lyman-alpha heating by the quasar)
Lyë
21 cm
Wyithe and Loeb 2004; astro-ph/0401554 Tozzi, Madau, Meiksin, & Rees 2000
quasar
CMB
Bri
ghtn
ess
wavelength
Warm HI
X-ray heated by quasar
reionization
Cold HI
Warm HI
~100x relic shells per known quasar

Emission from an X-ray Heated IGM
Wyithe & Loeb 2004; astro-ph/0401554

The Characteristic Size of Ionized
Bubbles at the End of Reionization
Wyithe & Loeb, Nature, 2004
Fig. 1
SBO: Surface of Bubble Overlap
SLT: Surface of Lya Transmission
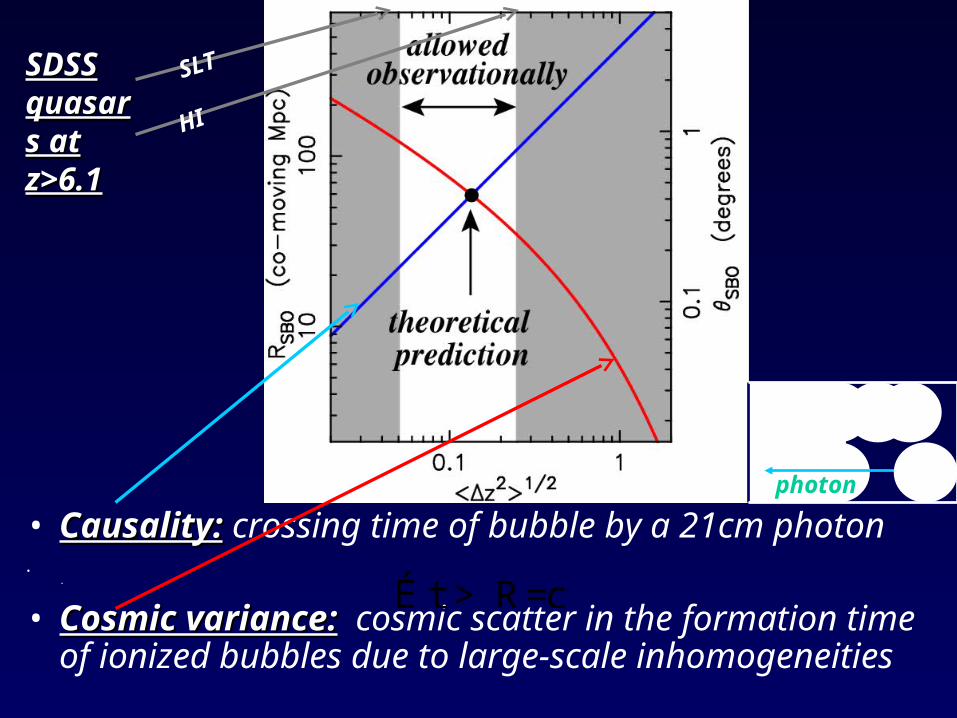
• Causality:Causality: crossing time of bubble by a 21cm photon•
. • Cosmic variance:Cosmic variance: cosmic scatter in the formation time of
ionized bubbles due to large-scale inhomogeneities
É t > R=c
SDSS SDSS quasars quasars at z>6.1at z>6.1
SLT
HI
photon

(i) Should we trust numerical (i) Should we trust numerical simulations or analytic models?simulations or analytic models?

Cooling Rate of Primordial Gas
n=0.045 cm^-3
Atomic cooling
H_2 cooling

Virial Temperature of Halos
1-sigma 2-sigma
3-sigma
Atomic cooling
H_2 cooling

Unusually Large Fluctuations in the Statistics of Galaxy Formation at High Redshifts
Barkana & Loeb, ApJ, 2003; Barkana & Loeb, ApJ, 2003; astro-ph/0310338astro-ph/0310338
Assumption : î L = 0
L
Bias in numerical simulations:


Summary
• Redshifted 21cm from 30<z<200 provides the largest data set on the initial conditions of the universe
• Peculiar velocities provide additional power and a test for the cosmological origin of the 21cm signal
• The size of the ionized bubbles at the end of reionization was ~10 Mpc
• Foreground removal is very challenging