mseg 803 equilibria in material systems 12: solution theory prof. juejun (jj) hu [email protected]
TRANSCRIPT
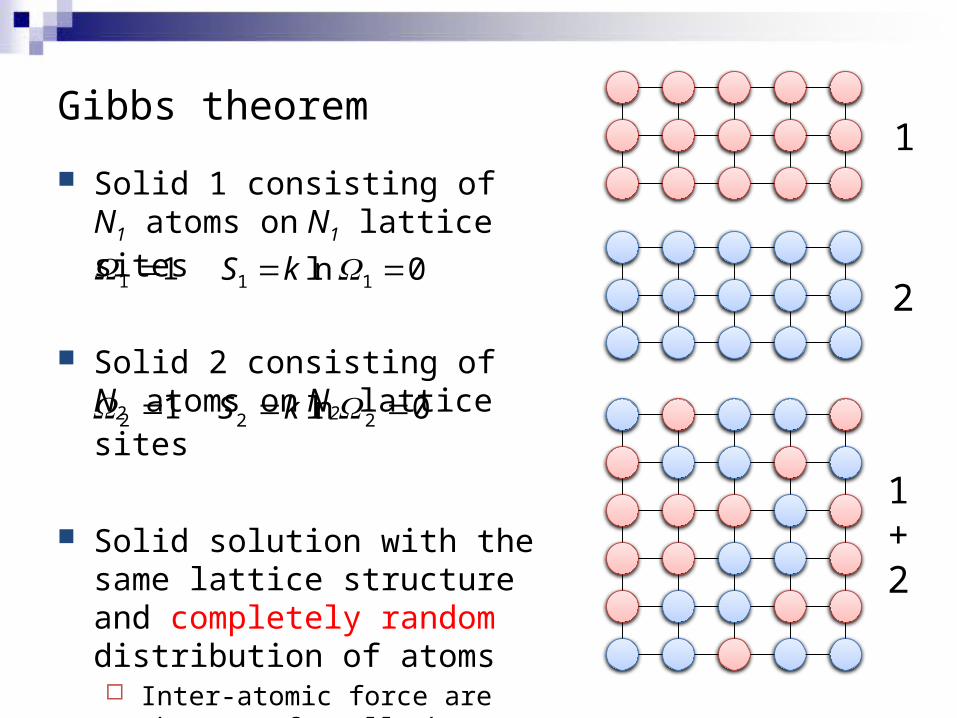
Gibbs theorem
Solid 1 consisting of N1 atoms on N1 lattice sites
Solid 2 consisting of N2 atoms on N2 lattice sites
Solid solution with the same lattice structure and completely random distribution of atoms Inter-atomic force are the same
for all three types of atomic pairs: 1-1, 2-2, and 1-2
1
2
1+2
1 1 1 1ln 0S k
2 1 2 2ln 0S k
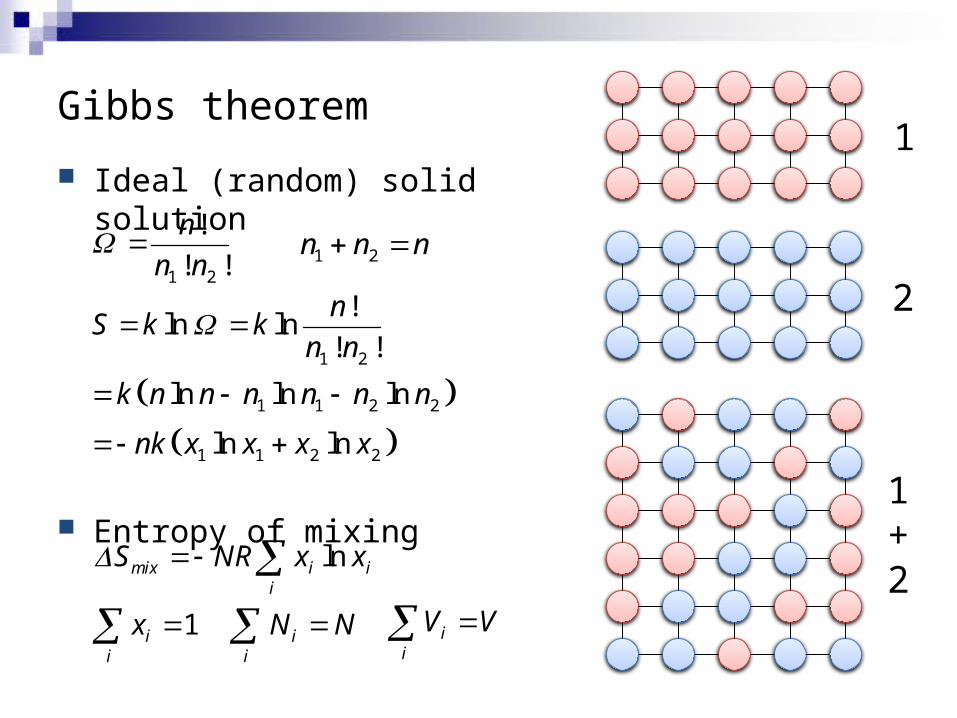
Gibbs theorem
Ideal (random) solid solution
Entropy of mixing
1
2
1+2
1 2
!
! !
n
n n
1 2
1 1 2 2
1 1 2 2
!ln ln
! !
ln ln ln
ln ln
nS k k
n n
k n n n n n n
nk x x x x
1 2n n n
lnmix i ii
S NR x x 1i
i
x ii
N N ii
V V
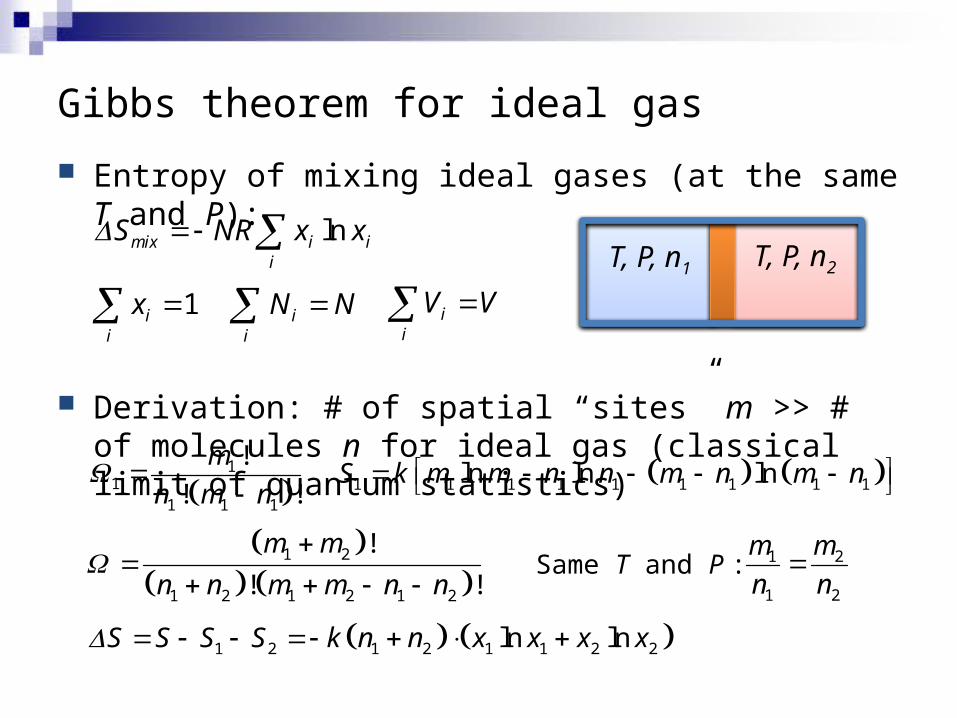
Gibbs theorem for ideal gas
Entropy of mixing ideal gases (at the same T and P):
Derivation: # of spatial “sites” m >> # of molecules n for ideal gas (classical limit of quantum statistics)
lnmix i ii
S NR x x 1i
i
x ii
N N ii
V VT, P, n1
1
11 1 1
!
! !
m
n m n
1 1 1 1 1 1 1 1 1ln ln lnS k m m n n m n m n
1 2
1 2 1 2 1 2
!
! !
m m
n n m m n n
1 2 1 2 1 1 2 2ln lnS S S S k n n x x x x
T, P, n2
1 2
1 2
m m
n nSame T and P :
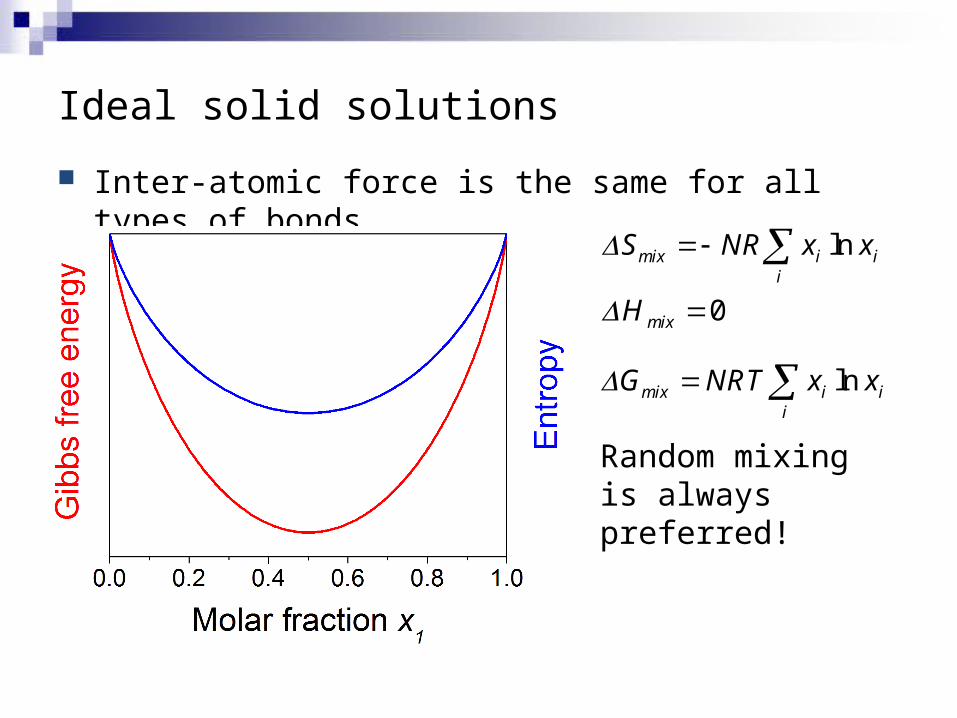
Ideal solid solutions
Inter-atomic force is the same for all types of bonds
lnmix i ii
S NR x x 0mixH
lnmix i ii
G NRT x x
Random mixing is always preferred!
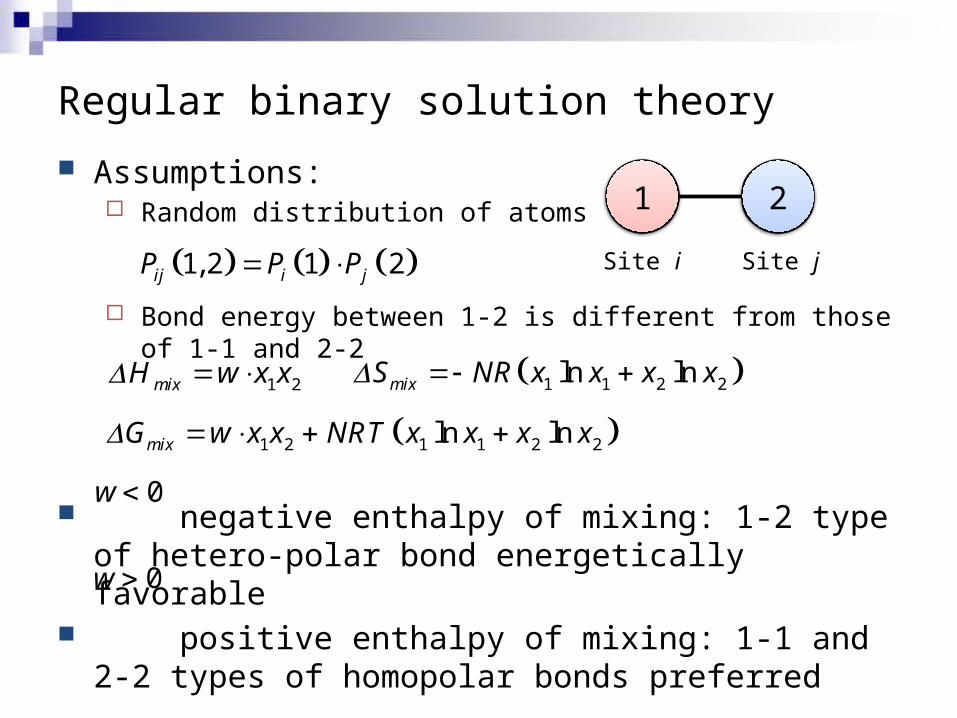
Regular binary solution theory
Assumptions: Random distribution of atoms
Bond energy between 1-2 is different from those of 1-1 and 2-2
negative enthalpy of mixing: 1-2 type of hetero-polar bond energetically favorable
positive enthalpy of mixing: 1-1 and 2-2 types of homopolar bonds preferred
1 2 1 1 2 2ln lnmixG w x x NRT x x x x
1 2mixH w x x 1 1 2 2ln lnmixS NR x x x x
0w
1,2 1 2ij i jP P P Site i Site j
1 2
0w
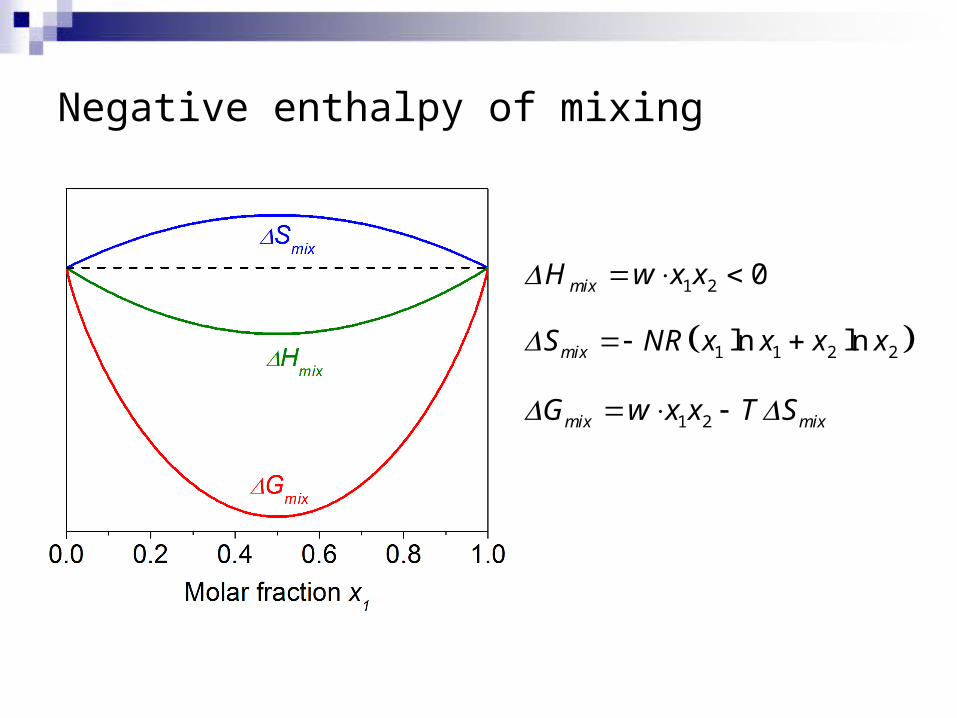
Negative enthalpy of mixing
1 2mix mixG w x x T S
1 2 0mixH w x x
1 1 2 2ln lnmixS NR x x x x
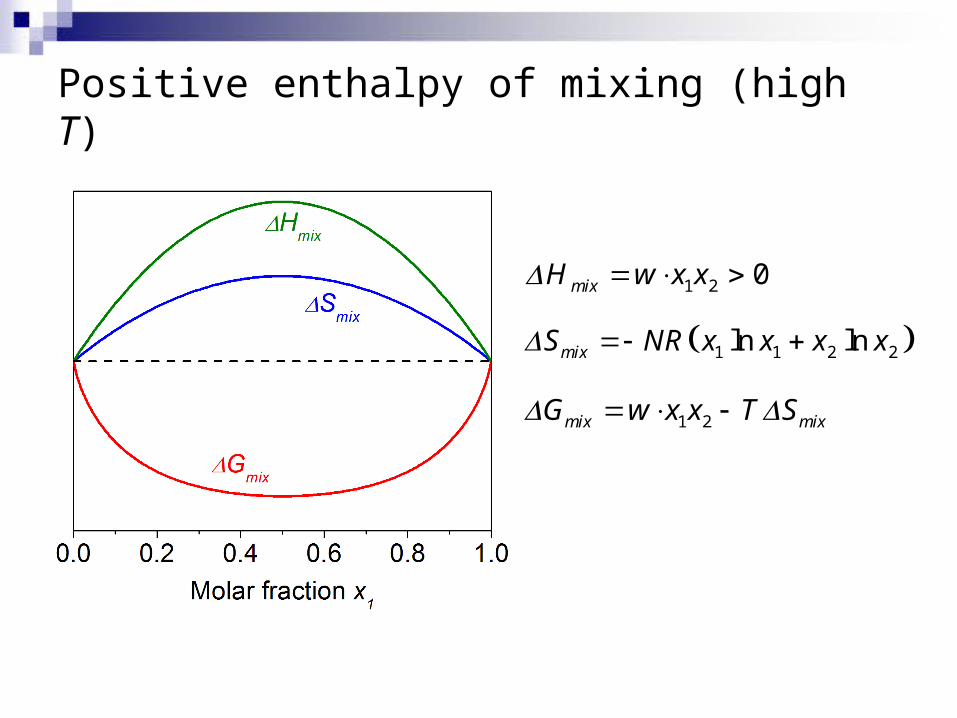
Positive enthalpy of mixing (high T)
1 2mix mixG w x x T S
1 2 0mixH w x x
1 1 2 2ln lnmixS NR x x x x
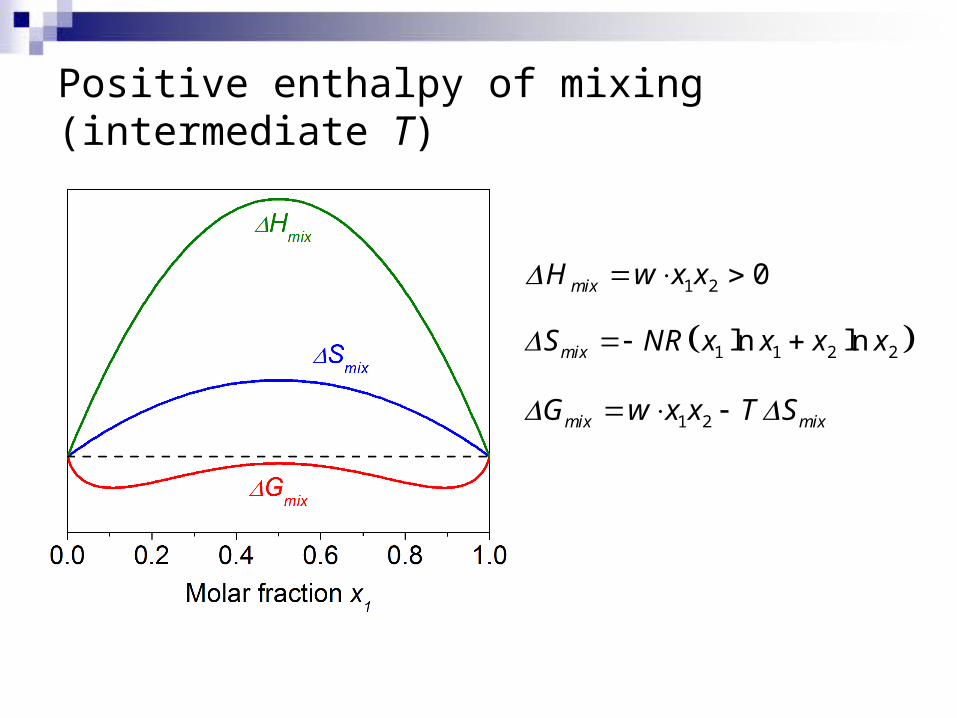
Positive enthalpy of mixing (intermediate T)
1 2mix mixG w x x T S
1 1 2 2ln lnmixS NR x x x x
1 2 0mixH w x x
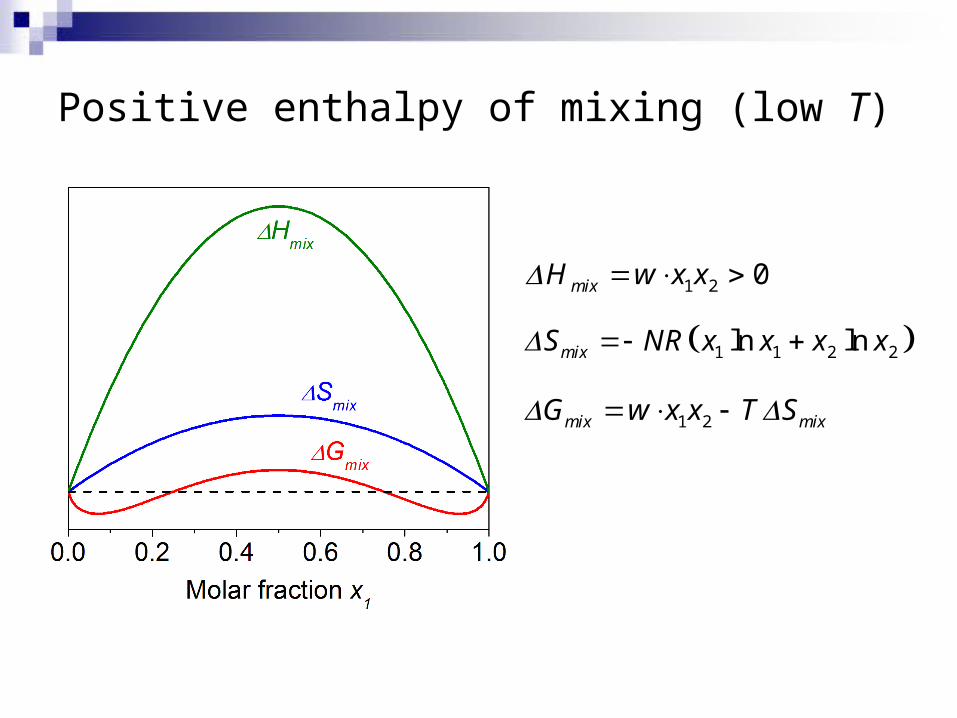
Positive enthalpy of mixing (low T)
1 2mix mixG w x x T S
1 1 2 2ln lnmixS NR x x x x
1 2 0mixH w x x
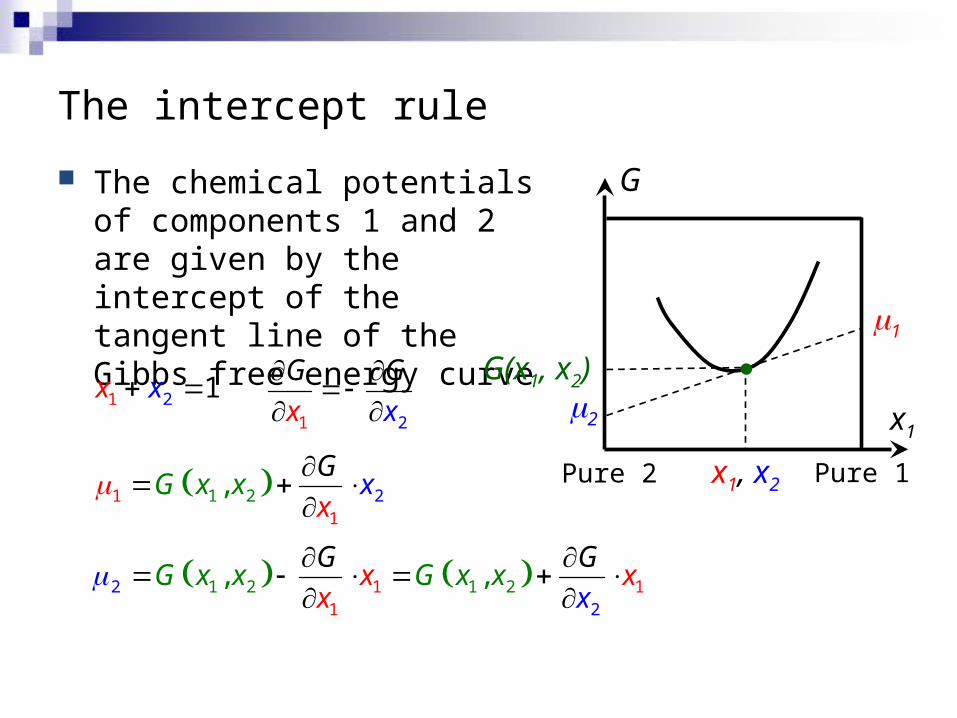
The intercept rule
The chemical potentials of components 1 and 2 are given by the intercept of the tangent line of the Gibbs free energy curve
x1
G
x1, x2
m1
m2
211
1 2,G x x xx
G
Pure 1Pure 2
G(x1, x2)21 1x x
12 12
1 11
2 2, ,x
x xG x x xG
G xx
G
1 2
G
x x
G
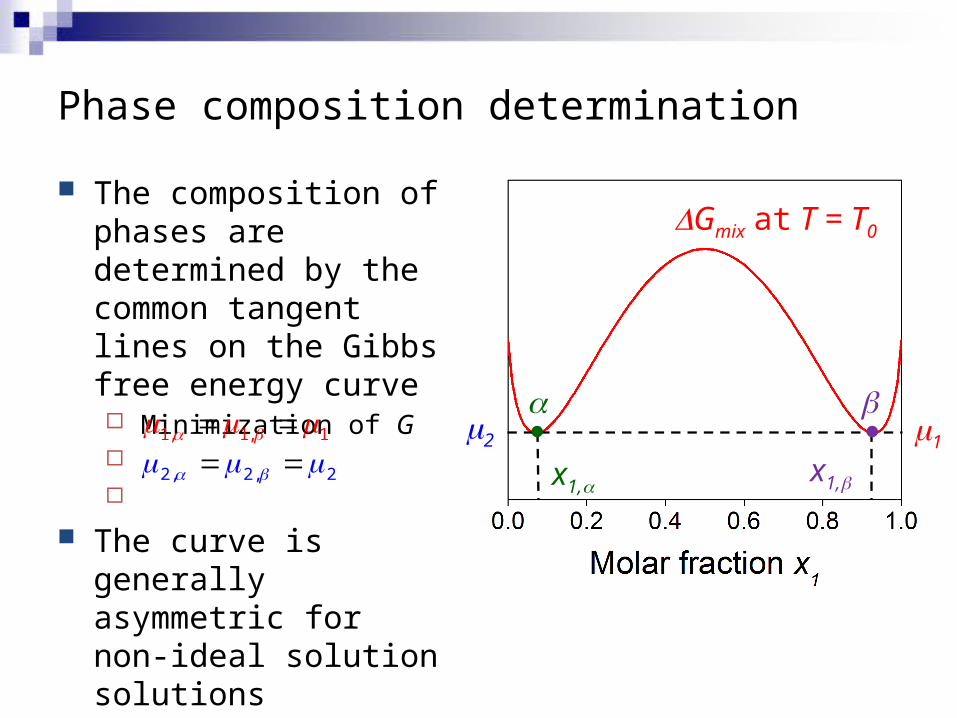
Phase composition determination
The composition of phases are determined by the common tangent lines on the Gibbs free energy curve Minimization of G
The curve is generally asymmetric for non-ideal solution solutions
x1,ax1,b
DGmix at T = T0
1, 1, 1 m1m2
a b
2, 2, 2
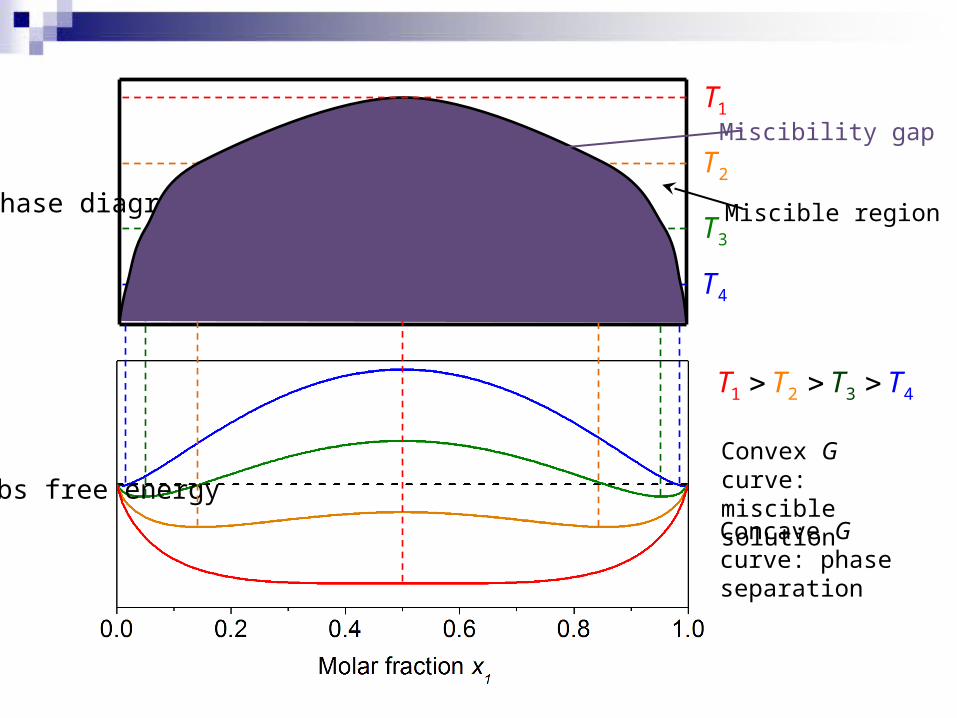
21 43T TT T
Gib
bs fr
ee e
ne
rgy
4T
3T
2T
1TP
has
e d
iag
ram Miscibility gap
Miscible region
Convex G curve: miscible solution
Concave G curve: phase separation
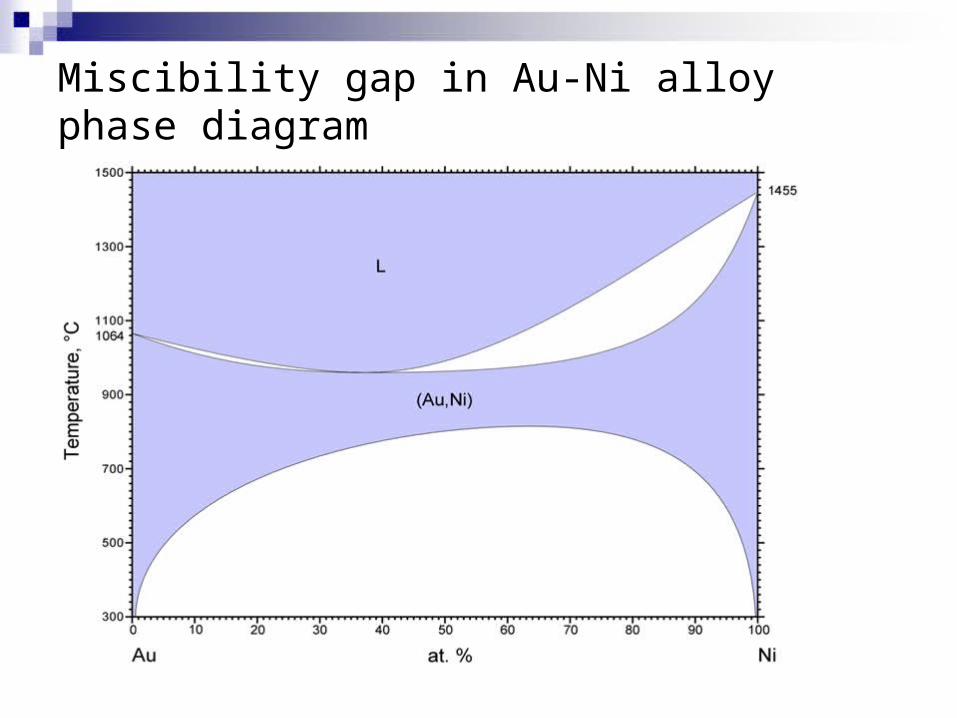
Miscibility gap in Au-Ni alloy phase diagram
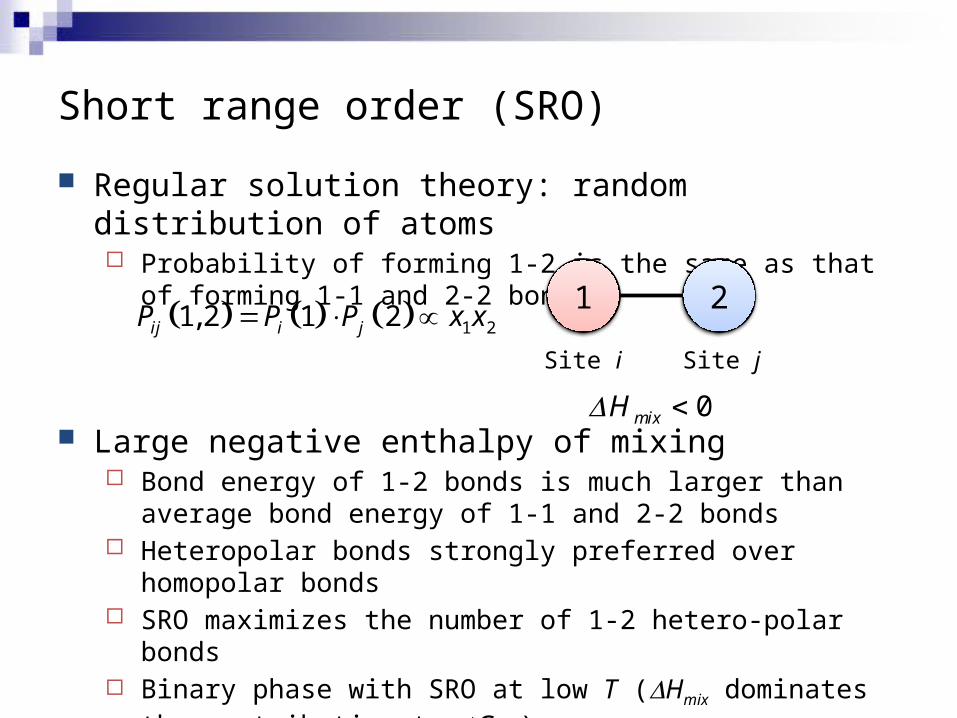
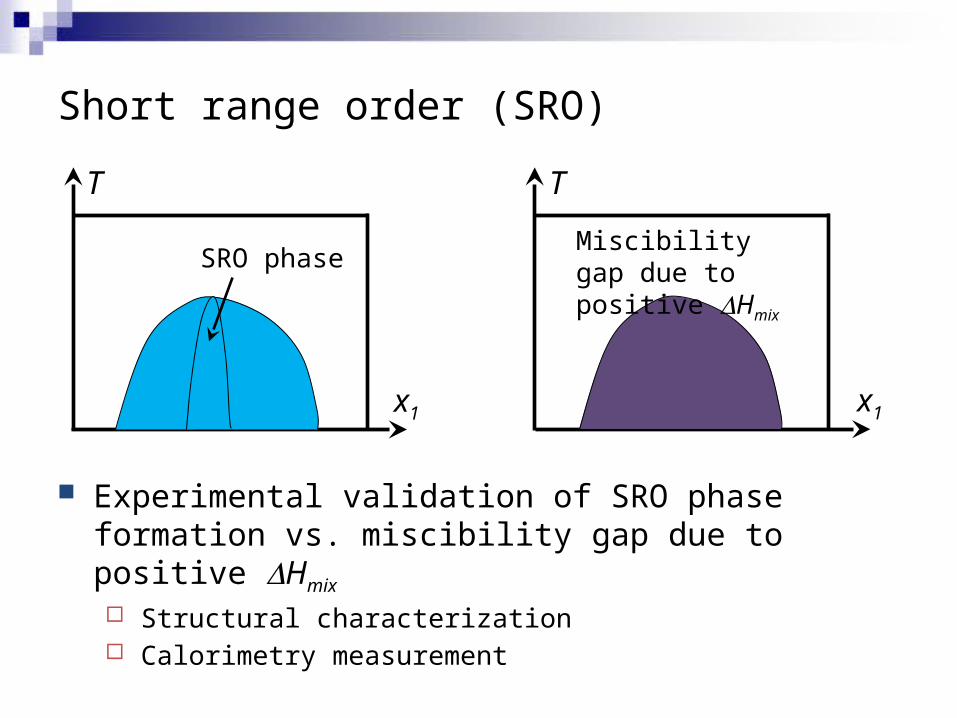
Short range order (SRO)
Regular solution theory: random distribution of atoms Probability of forming 1-2 is the same as that of forming 1-1
and 2-2 bonds
Large negative enthalpy of mixing Bond energy of 1-2 bonds is much larger than average bond
energy of 1-1 and 2-2 bonds Heteropolar bonds strongly preferred over homopolar bonds SRO maximizes the number of 1-2 hetero-polar bonds Binary phase with SRO at low T (DHmix dominates the
contribution to DGmix)
1 21,2 1 2ij i jP P P x x Site i Site j
1 2
0mixH
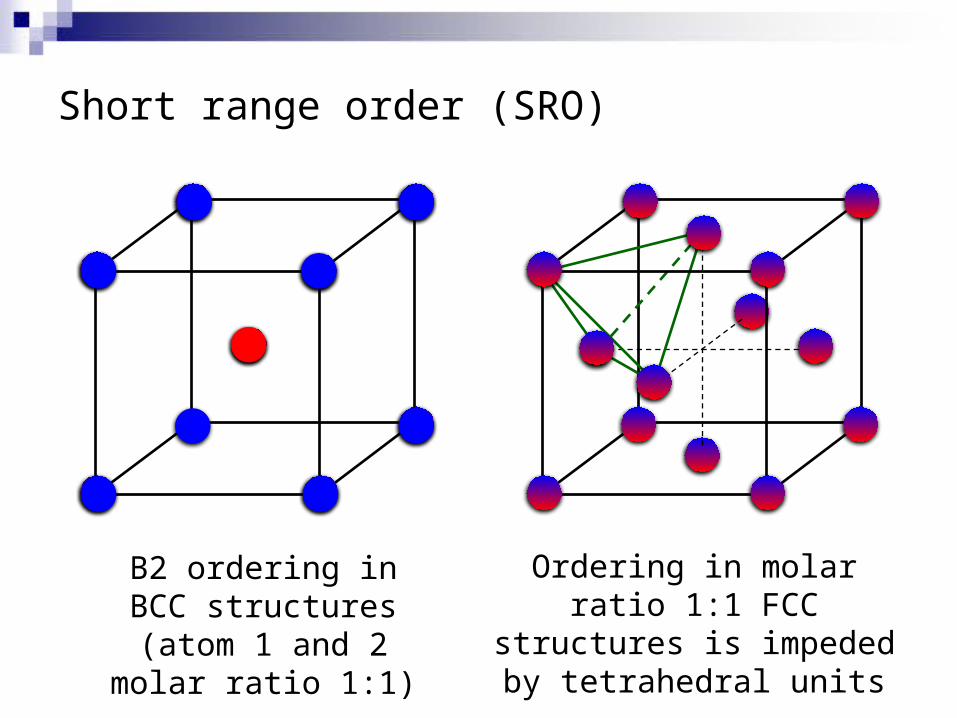
Short range order (SRO)
B2 ordering in BCC structures (atom 1 and
2 molar ratio 1:1)
Ordering in molar ratio 1:1 FCC structures is impeded
by tetrahedral units
Short range order (SRO)
Experimental validation of SRO phase formation vs. miscibility gap due to positive DHmix
Structural characterization Calorimetry measurement
x1
T
SRO phase
x1
Miscibility gap due to positive DHmix
T
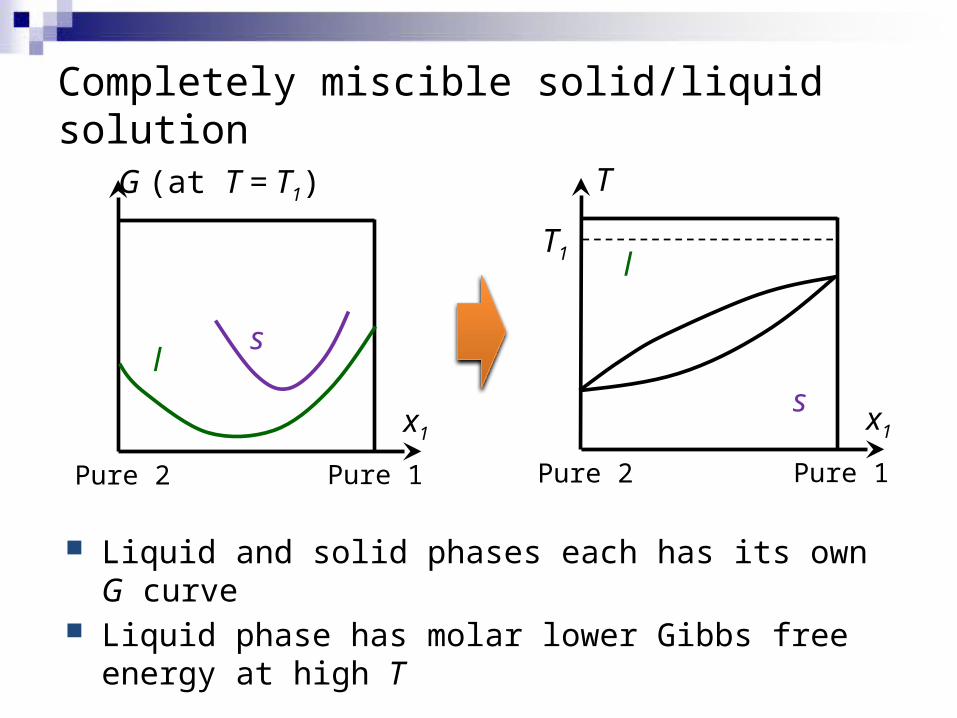
Liquid and solid phases each has its own G curve Liquid phase has molar lower Gibbs free energy at
high T
x1
T
Pure 1Pure 2
l
sx1
G (at T = T1)
Pure 1Pure 2
ls
T1
Completely miscible solid/liquid solution
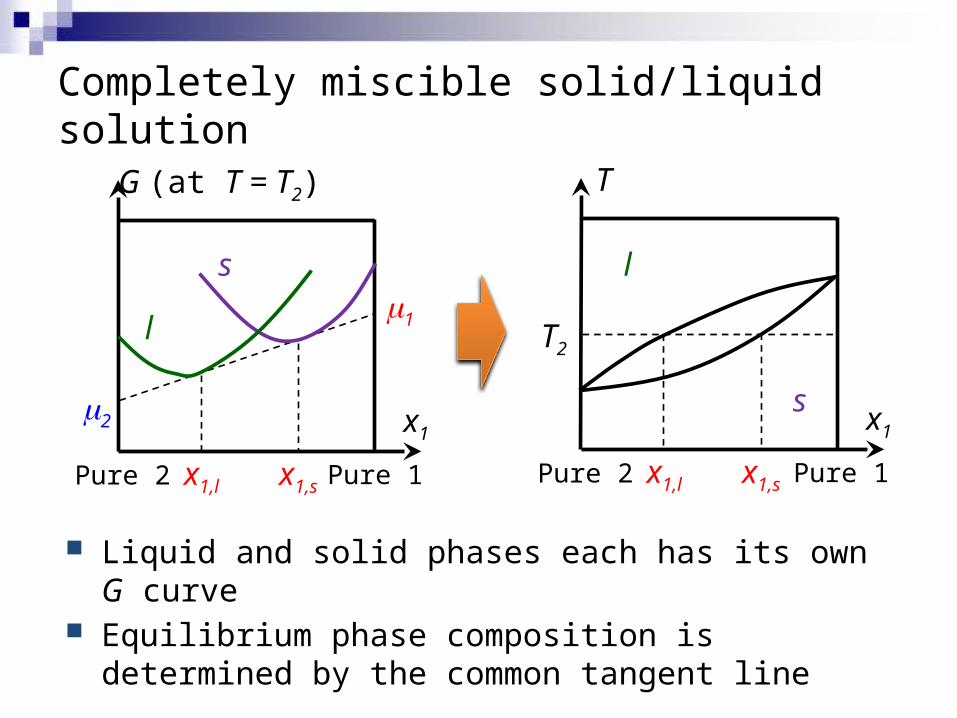
Completely miscible solid/liquid solution
Liquid and solid phases each has its own G curve Equilibrium phase composition is determined by the
common tangent line
x1
T
x1,l Pure 1Pure 2
l
s
x1,s
x1
G (at T = T2)
x1,l
m1
m2
Pure 1Pure 2
l
s
x1,s
T2
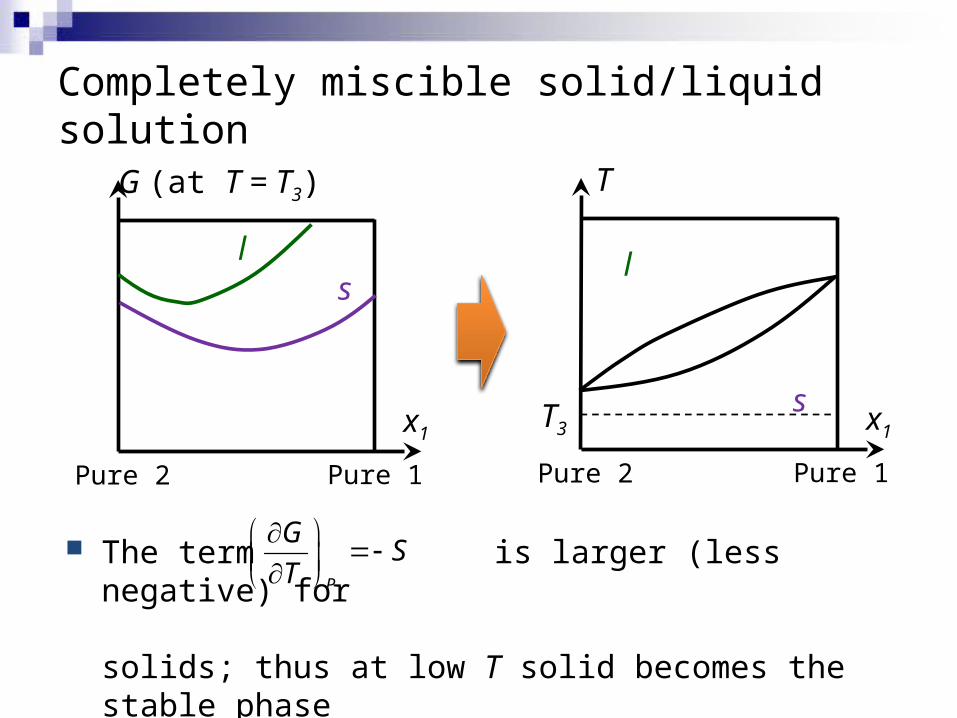
Completely miscible solid/liquid solution
The term is larger (less negative) for
solids; thus at low T solid becomes the stable phase
x1
T
Pure 1Pure 2
l
sx1
G (at T = T3)
Pure 1Pure 2
ls
T3
P
GS
T
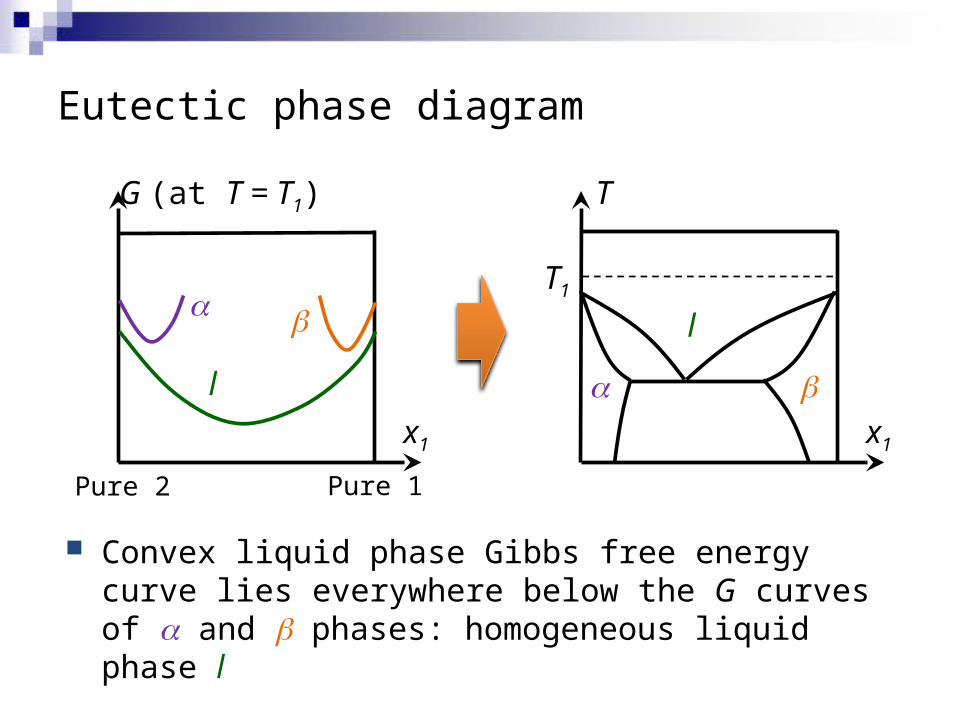
Eutectic phase diagram
x1
T
T1
b
l
x1
G (at T = T1)
Pure 1Pure 2
l
ba
a
Convex liquid phase Gibbs free energy curve lies everywhere below the G curves of a and b phases: homogeneous liquid phase l
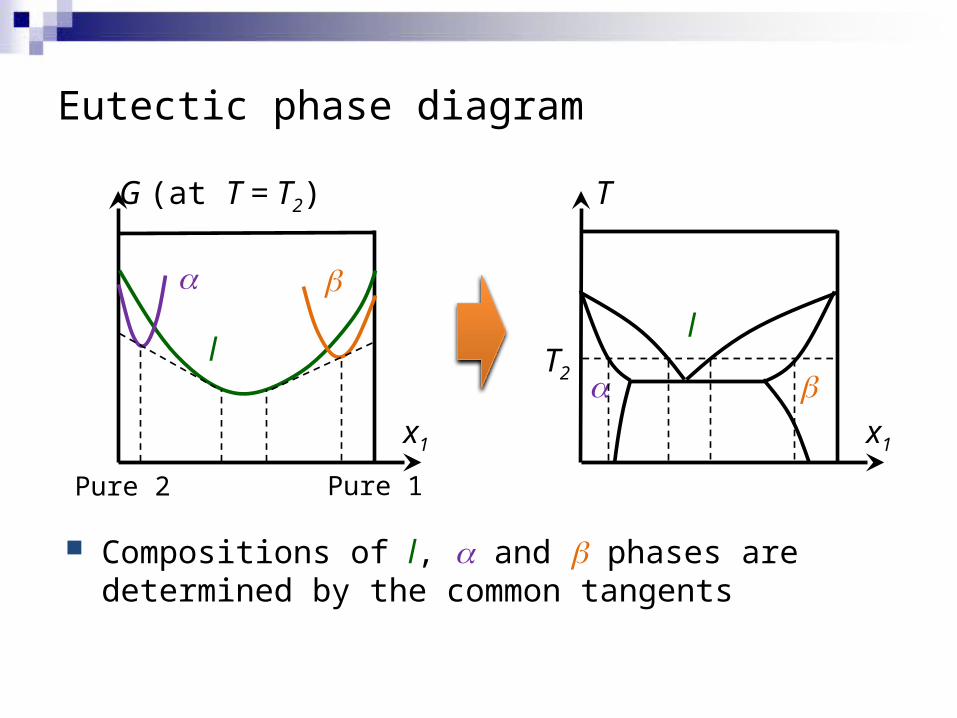
Eutectic phase diagram
x1
T
aT2 b
l
x1
G (at T = T2)
Pure 1Pure 2
l
a b
Compositions of l, a and b phases are determined by the common tangents
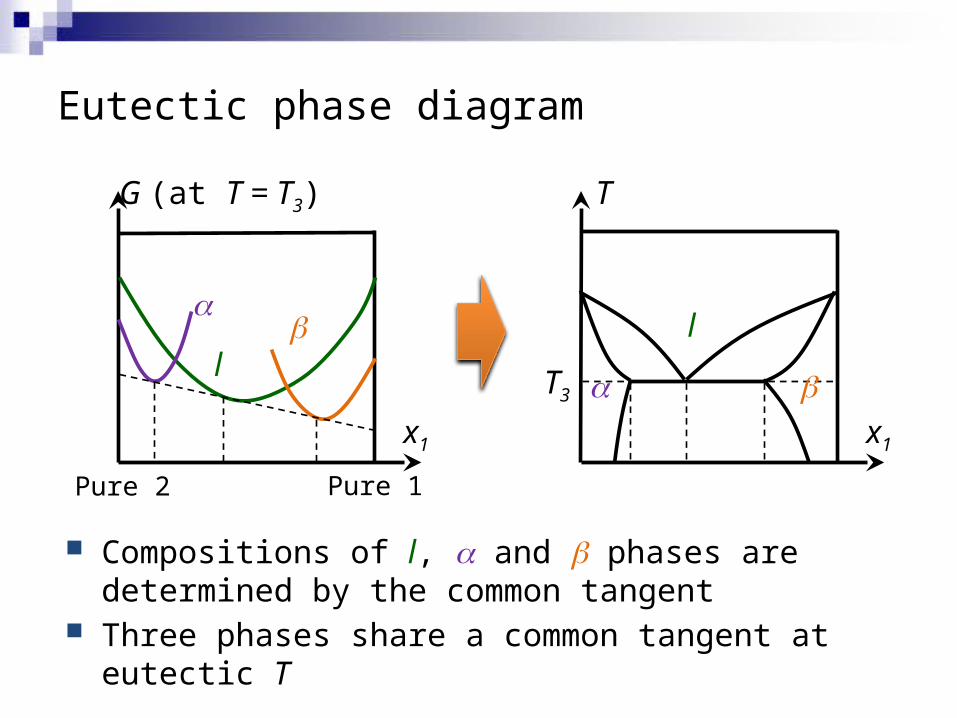
Eutectic phase diagram
x1
T
aT3 b
l
x1
G (at T = T3)
Pure 1Pure 2
l
ab
Compositions of l, a and b phases are determined by the common tangent
Three phases share a common tangent at eutectic T
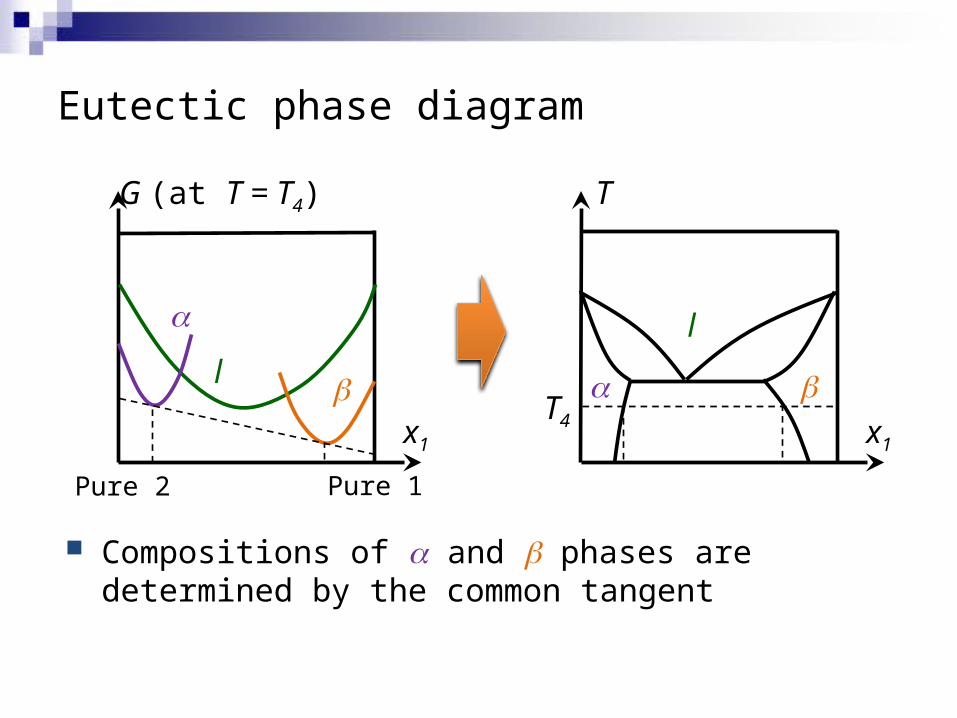
Eutectic phase diagram
x1
T
aT4
b
l
x1
G (at T = T4)
Pure 1Pure 2
l
a
b
Compositions of a and b phases are determined by the common tangent