mt4 user guide for pc - you-forex.com · changing indicator settings after the initial set-up ......
TRANSCRIPT
11 January 2016 Copyright © GMO-Z.com Trade UK Limited All rights reserved
User Guide

11 January 2016 Copyright © GMO-Z.com Trade UK Limited All rights reserved
Table of Contents
1. Download and Installation .............................................................................................................................. 5
1.1. Download .............................................................................................................................................. 5
1.2. Installation ............................................................................................................................................. 5
2. Account Login ................................................................................................................................................ 7
2.1. Server ................................................................................................................................................... 7
2.1.1. Login Details ................................................................................................................................... 8
2.1.2. Changing Login Password ................................................................................................................ 8
3. MT4 Interface Overview.................................................................................................................................. 8
3.1. Menu ..................................................................................................................................................... 8
3.2. Toolbars ................................................................................................................................................ 9
3.2.1. Standard Toolbar .......................................................................................................................... 10
3.2.2. Charts Toolbar .............................................................................................................................. 10
3.2.3. Line Studies Toolbar ...................................................................................................................... 11
3.2.4. Periodicity Toolbar ........................................................................................................................ 11
3.3. Market Watch ...................................................................................................................................... 12
3.4. Data Window ....................................................................................................................................... 13
3.5. Navigator Window ................................................................................................................................ 15
3.6. Terminal Window ................................................................................................................................. 16
3.6.1. Viewing Open Positions ................................................................................................................. 17
3.6.2. Viewing Pending Orders ................................................................................................................ 18
3.6.3. Viewing Trade History ................................................................................................................... 18
3.6.4. Setting Alerts for Events ................................................................................................................ 20
3.7. Chart Window ...................................................................................................................................... 22
3.8. Strategy Tester Window ....................................................................................................................... 24
3.9. Status Bar ............................................................................................................................................ 25
3.10. Main Menu ....................................................................................................................................... 26
3.10.1. File............................................................................................................................................... 26
3.10.2. View ............................................................................................................................................. 27
3.10.3. Insert ........................................................................................................................................... 28
3.10.4. Charts .......................................................................................................................................... 29
3.10.5. Tools ............................................................................................................................................ 30
3.10.6. Window ........................................................................................................................................ 30
3.10.7. Help ............................................................................................................................................. 31
4. Trading ........................................................................................................................................................ 33
4.1. Market Orders ...................................................................................................................................... 34
11 January 2016 Copyright © GMO-Z.com Trade UK Limited All rights reserved
4.1.1. Market Execution .......................................................................................................................... 35
4.2. Pending Orders .................................................................................................................................... 35
4.2.1. Placing New Buy/Sell – Limit/Stop Orders ....................................................................................... 36
4.2.2. Placing New Buy/Sell – Limit/Stop Orders Directly From Chart ......................................................... 37
4.3. Modifying Orders .................................................................................................................................. 38
4.3.1. Modifying Buy/Sell – Limit/Stop Orders ........................................................................................... 38
4.3.2. Modifying Stop Loss and Take Profit Orders .................................................................................... 39
4.3.3. Modifying Buy/Sell – Limit/Stop, Stop Loss and Take Profit Orders Directly From Chart ..................... 41
4.4. Trade Options ...................................................................................................................................... 42
5. Closing Positions .......................................................................................................................................... 43
5.1. Market Orders ...................................................................................................................................... 43
5.1.1. Closing Positions from Order Window ............................................................................................. 43
5.1.2. Simple Closing of Positions ............................................................................................................ 44
5.2. Pending Orders .................................................................................................................................... 45
5.3. Auto-Closeout ...................................................................................................................................... 46
6. One-Click Trading ......................................................................................................................................... 47
6.1. Enabling One-Click Trading ................................................................................................................... 47
6.2. Opening Position Using One-Click Trading .............................................................................................. 48
7. Charts ......................................................................................................................................................... 49
7.1. Open Chart Windows ............................................................................................................................ 49
7.1.1. New Chart .................................................................................................................................... 49
7.1.2. Offline Chart ................................................................................................................................. 51
7.1.3. Rearranging Multiple Chart Windows .............................................................................................. 52
7.1.4. Tick Chart ..................................................................................................................................... 53
7.2. Chart Properties ................................................................................................................................... 55
7.2.1. Colours ......................................................................................................................................... 56
7.2.2. Settings ........................................................................................................................................ 57
7.3. Chart Controls ...................................................................................................................................... 58
7.3.1. Chart Types .................................................................................................................................. 58
7.3.2. Timeframes .................................................................................................................................. 61
7.3.3. Zoom In & Out ............................................................................................................................. 62
7.3.4. Auto Scroll .................................................................................................................................... 64
7.3.5. Chart Shift .................................................................................................................................... 65
7.3.6. Cursor - Crosshair ......................................................................................................................... 65
7.4. Chart Options ....................................................................................................................................... 67
7.4.1. Showing Trade Levels on Charts .................................................................................................... 67
7.4.2. Preventing Unintended Control of Order Levels on Charts ................................................................ 67
7.5. Objects Options.................................................................................................................................... 68
7.6. Technical Indicators ............................................................................................................................. 69
11 January 2016 Copyright © GMO-Z.com Trade UK Limited All rights reserved
7.6.1. Applying Technical Indicators ........................................................................................................ 69
7.6.2. Changing Indicator Settings after the Initial Set-up ......................................................................... 71
7.6.3. Deleting Indicators / Indicators Window ......................................................................................... 71
7.7. Line Studies ......................................................................................................................................... 73
7.7.1. Line Studies from the Toolbar ........................................................................................................ 73
7.7.2. Line Studies from the Insert Menu ................................................................................................. 74
7.8. Templates ............................................................................................................................................ 77
7.8.1. Loading Templates ........................................................................................................................ 77
7.8.2. Saving Templates.......................................................................................................................... 79
7.9. Profiles ................................................................................................................................................ 80
7.9.1. Loading Profiles ............................................................................................................................ 80
7.9.2. Saving New Profiles ....................................................................................................................... 81
7.9.3. Saving Existing Profiles .................................................................................................................. 81
8. Expert Advisors ............................................................................................................................................ 82
8.1. Creating Expert Advisors ....................................................................................................................... 82
8.2. Modifying Expert Advisors ..................................................................................................................... 85
8.3. Installing External Expert Advisors ......................................................................................................... 86
8.4. Enabling Expert Advisors....................................................................................................................... 88
8.4.1. Allowing Live Trading .................................................................................................................... 88
8.5. Strategy Tester .................................................................................................................................... 90
8.5.1. Strategy Tester Terminal ............................................................................................................... 90
8.5.2. Conducting Tests .......................................................................................................................... 91
8.5.3. Test Results .................................................................................................................................. 91
8.5.4. Optimisation ................................................................................................................................. 92
9. Custom Indicators ........................................................................................................................................ 96
9.1. Creating Custom Indicators ................................................................................................................... 96
9.2. Custom Indicators Settings ................................................................................................................... 99
9.3. Modifying Custom Indicators ................................................................................................................. 99
9.4. Applying Custom Indicators................................................................................................................. 101
9.5. Removing Custom Indicators............................................................................................................... 103
10. Scripts ................................................................................................................................................... 104
10.1. Creating Scripts .............................................................................................................................. 104
10.2. Script Settings ................................................................................................................................ 108
10.3. Modifying Scripts ............................................................................................................................ 108
10.4. Executing Scripts ............................................................................................................................ 111
10.5. Removing Scripts ............................................................................................................................ 112
11. Risk Warning ......................................................................................................................................... 113

11 January 2016 5 Copyright © GMO-Z.com Trade UK Limited All rights reserved
1. Download and Installation
All Z.com Trade MT4 Demo and Live platforms can be downloaded for free. If you need any assistance, please do not
hesitate to contact us. Our Client Services Officers are available to guide you every step of the way.
Before you get started, please check that your computer meets the system requirements in order for the platform to
operate smoothly.
1.1. Download
Please download our MT4 platform from our website.
1.2. Installation
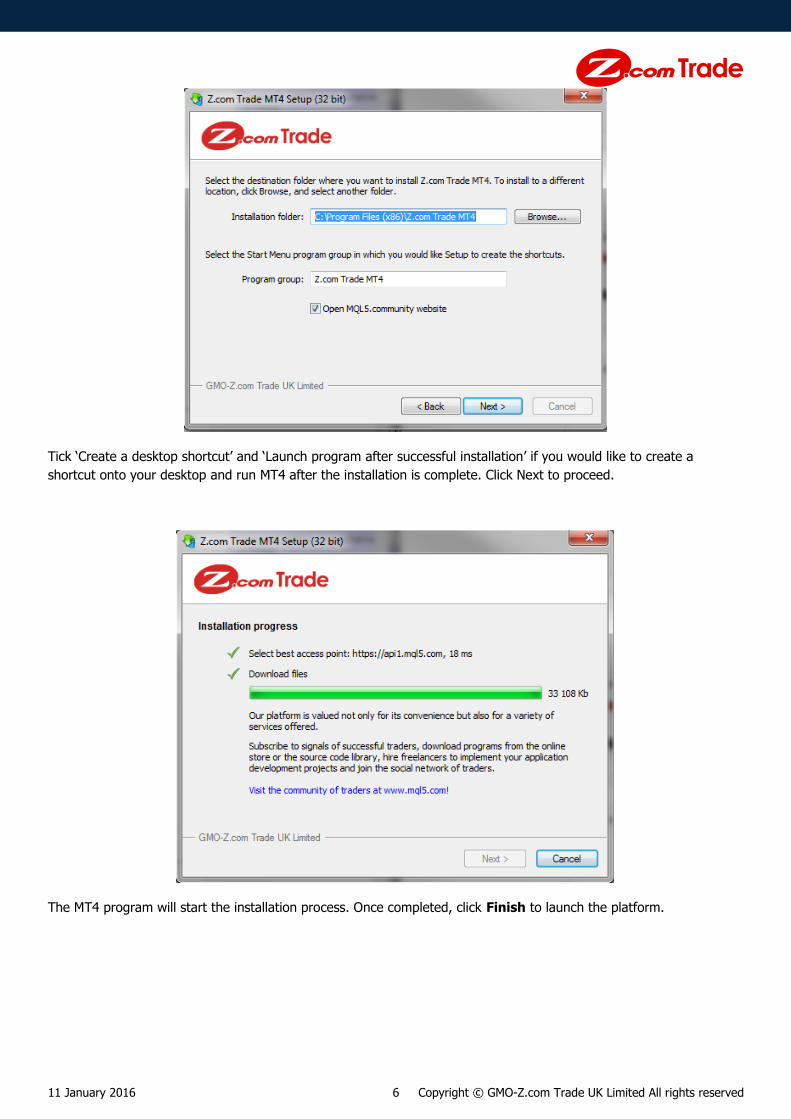
To start using MT4 it has to be installed on your device first. Upon downloading the MT4 software package, double
click on the installer and follow the instructions on the screen below:
The following window will be shown. Please read the End User License Agreement carefully and click Next to proceed.
From the “Settings” menu, specify the destination folder and the program group.
11 January 2016 6 Copyright © GMO-Z.com Trade UK Limited All rights reserved
Tick ‘Create a desktop shortcut’ and ‘Launch program after successful installation’ if you would like to create a
shortcut onto your desktop and run MT4 after the installation is complete. Click Next to proceed.
The MT4 program will start the installation process. Once completed, click Finish to launch the platform.

11 January 2016 7 Copyright © GMO-Z.com Trade UK Limited All rights reserved
2. Account Login
Upon completing installation, you will be prompted to login as shown in above:
Login: This is the Login ID which will be provided by Z.com Trade after the application is completed.
Password: This is the Password which will be provided by Z.com Trade once the application is completed.
Server: Depending on your account type, simply select the server Z.comTradeUK-Live Server for Live Accounts
(and Z.comTradeUK-Demo Server for Demo Accounts).
Save account information: Tick the box to save the above account information for next login.
Input relevant information in those fields and click Login to continue.
MT4 terminal should start up and any opened chart will automatically be updated to the latest information.
2.1. Server The Server settings allow users to configure parameters for connecting to the server:

11 January 2016 8 Copyright © GMO-Z.com Trade UK Limited All rights reserved
2.1.1. Login Details
The Server is the server IP address and the port number or the domain name. This field is automatically entered
upon installation of the MT4.
Also, the Login and the Password are the login credentials provided by Z.com Trade by email upon opening an MT4
account.
2.1.2. Changing Login Password
By selecting the Change button it redirects the user to a new window where the existing password can be changed:
Enter the current password followed by a new password and repeat the new password for confirmation to complete.
Users can also choose to change ‘investor (read only)’ password.
3. MT4 Interface Overview
MT4 is intended primarily for sophisticated analysis of markets and therefore it has more complex interface system
compared to our WebTrader. While it is designed to be as simple as possible and easy to understand it is still difficult
to fully understand the interface from the first sight only. This chapter is dedicated to explaining how the MT4
interface works as well as the basics needed for basic trade operations and more advanced material.
3.1. Menu At the very top of the MT4 interface there is a menu bar just like any other Windows applications as shown below:

11 January 2016 9 Copyright © GMO-Z.com Trade UK Limited All rights reserved
File: For chart opening, using profiles, saving data, data folder, account settings and printing options.
View: For setting the terminal languages, and displaying toolbars and windows.
Insert: For inserting technical indicators, line studies and objects to a chart.
Charts: For controlling objects on charts, chart types, timeframes, templates and other properties related to charts.
Tools: For opening new order window, opening the history centre, setting global variables, opening MetaEditor and
options.
Window: For rearranging multiple chart windows.
Help: For general help for MT4 and external links related to MT4.
For further information on the menu bar please refer to its dedicated chapter Menu.
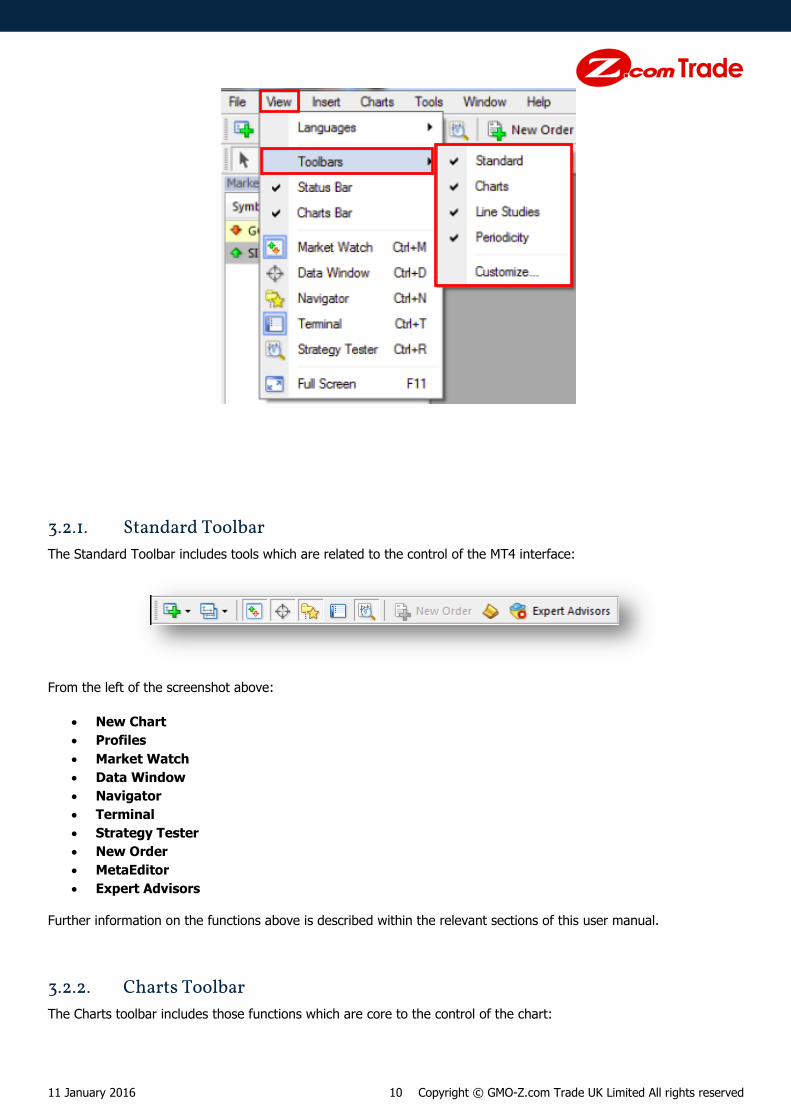
3.2. Toolbars The Toolbars are simple and easy-access tools interface on MT4 and they are located around at the top of the MT4
interface:
There are 4 types of Toolbars: Standard, Charts, Line Studies and Periodicity available on the Toolbars window.
Each Toolbar can be opened or hidden simply by right-clicking on any of the toolbars above and select from the
options:
Alternatively, this can be accomplished from the View menu by selecting the sub-menu Toolbars, and then select
the options from the side dropdown-list:
11 January 2016 10 Copyright © GMO-Z.com Trade UK Limited All rights reserved
3.2.1. Standard Toolbar
The Standard Toolbar includes tools which are related to the control of the MT4 interface:
From the left of the screenshot above:
New Chart
Profiles
Market Watch
Data Window
Navigator
Terminal
Strategy Tester
New Order
MetaEditor
Expert Advisors
Further information on the functions above is described within the relevant sections of this user manual.
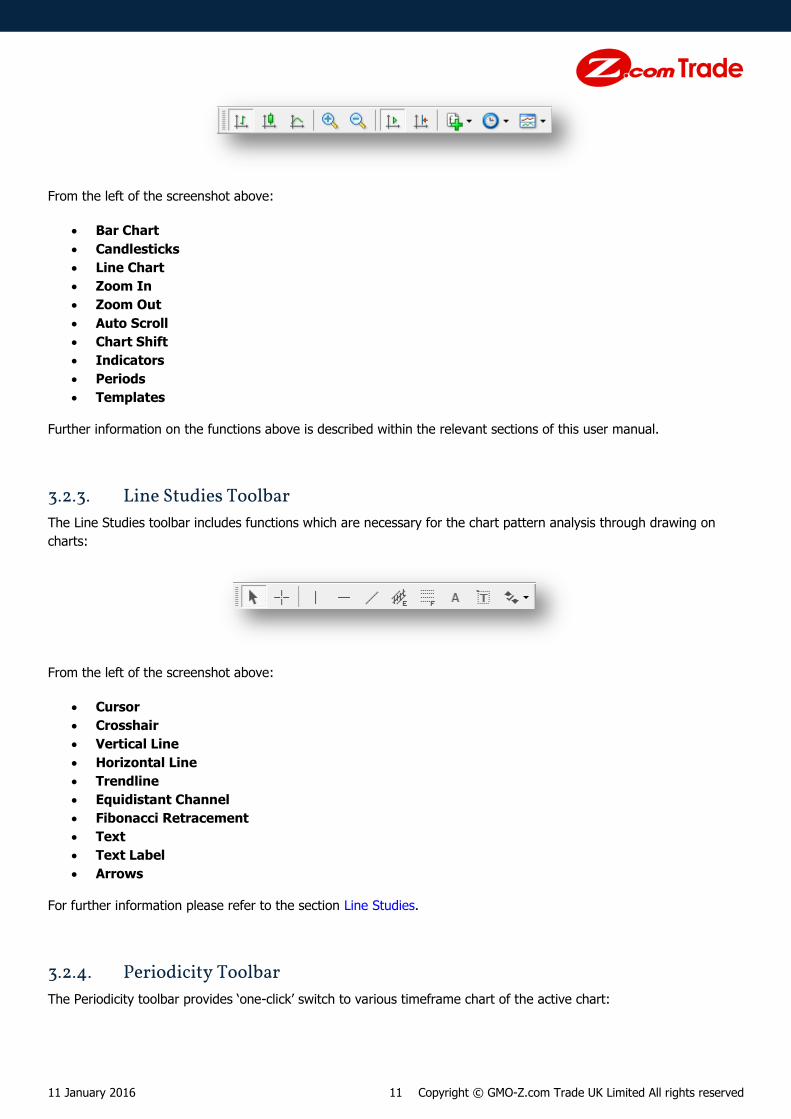
3.2.2. Charts Toolbar
The Charts toolbar includes those functions which are core to the control of the chart:
11 January 2016 11 Copyright © GMO-Z.com Trade UK Limited All rights reserved
From the left of the screenshot above:
Bar Chart
Candlesticks
Line Chart
Zoom In
Zoom Out
Auto Scroll
Chart Shift
Indicators
Periods
Templates
Further information on the functions above is described within the relevant sections of this user manual.
3.2.3. Line Studies Toolbar
The Line Studies toolbar includes functions which are necessary for the chart pattern analysis through drawing on
charts:
From the left of the screenshot above:
Cursor
Crosshair
Vertical Line
Horizontal Line
Trendline
Equidistant Channel
Fibonacci Retracement
Text
Text Label
Arrows
For further information please refer to the section Line Studies.
3.2.4. Periodicity Toolbar
The Periodicity toolbar provides ‘one-click’ switch to various timeframe chart of the active chart:

11 January 2016 12 Copyright © GMO-Z.com Trade UK Limited All rights reserved
From the left of the screenshot above:
1 Minute
5 Minutes
15 Minutes
30 Minutes
1 Hour
4 Hours
1 Day
1 Week
1 Month
For further information please refer to the section Timeframes.
3.3. Market Watch Market Watch window is primarily used for displaying market bid and ask prices for each symbol. It is intended for
simple and easy quick overview of the market where a user can refer to for the current market prices. The fields are
automatically updated upon receiving new tick data where if the bid price of an incoming tick is higher than the last
quoted bid price the price figures in that row is shown in blue, whereas if it was the other way around the price
figures will be shown in red. On top of that there will be an arrow on the left to the each symbol indicating whether
the bid price has gone up or down since the last tick data.
A typical Market Watch window will look like as shown below:
Symbol: Identifier used to describe certain tradable products.
Bid: Price at which the market is willing to buy the product. A trader is able to sell at this price.
11 January 2016 13 Copyright © GMO-Z.com Trade UK Limited All rights reserved
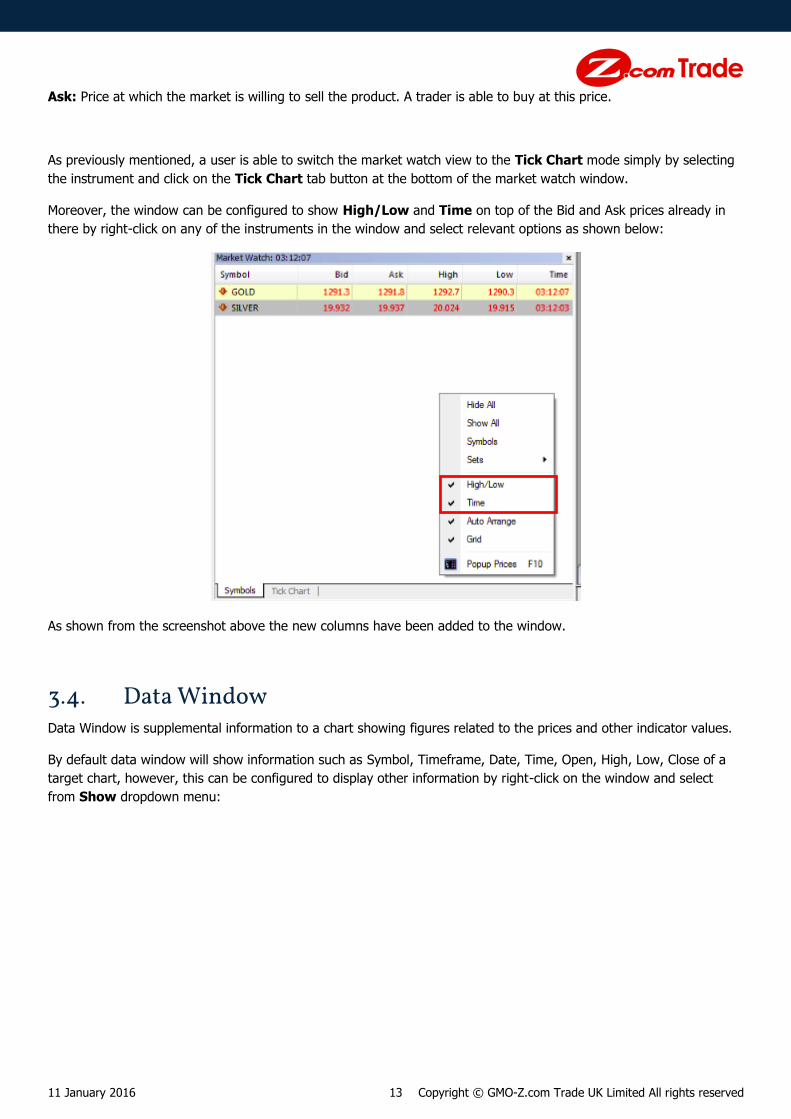
Ask: Price at which the market is willing to sell the product. A trader is able to buy at this price.
As previously mentioned, a user is able to switch the market watch view to the Tick Chart mode simply by selecting
the instrument and click on the Tick Chart tab button at the bottom of the market watch window.
Moreover, the window can be configured to show High/Low and Time on top of the Bid and Ask prices already in
there by right-click on any of the instruments in the window and select relevant options as shown below:
As shown from the screenshot above the new columns have been added to the window.
3.4. Data Window Data Window is supplemental information to a chart showing figures related to the prices and other indicator values.
By default data window will show information such as Symbol, Timeframe, Date, Time, Open, High, Low, Close of a
target chart, however, this can be configured to display other information by right-click on the window and select
from Show dropdown menu:

11 January 2016 14 Copyright © GMO-Z.com Trade UK Limited All rights reserved
In this example above all the instrument data such as the Date, Open, High, Low, Close and Volume are configured to
be displayed for the instrument shown in the screenshot.
In a situation where multiple chart windows are opened and displayed in the interface, it is NOT the active chart
which the Data Window shows the information on, but it is the chart where the cursor was last pointing to.
Also notice that there are technical indicator values displayed in the Data Window below the usual instrument data.
This can be configured from the Technical Indicator Properties by selecting Show in the Data Window which will
be explained later in chapter for Technical Indicators.
11 January 2016 15 Copyright © GMO-Z.com Trade UK Limited All rights reserved
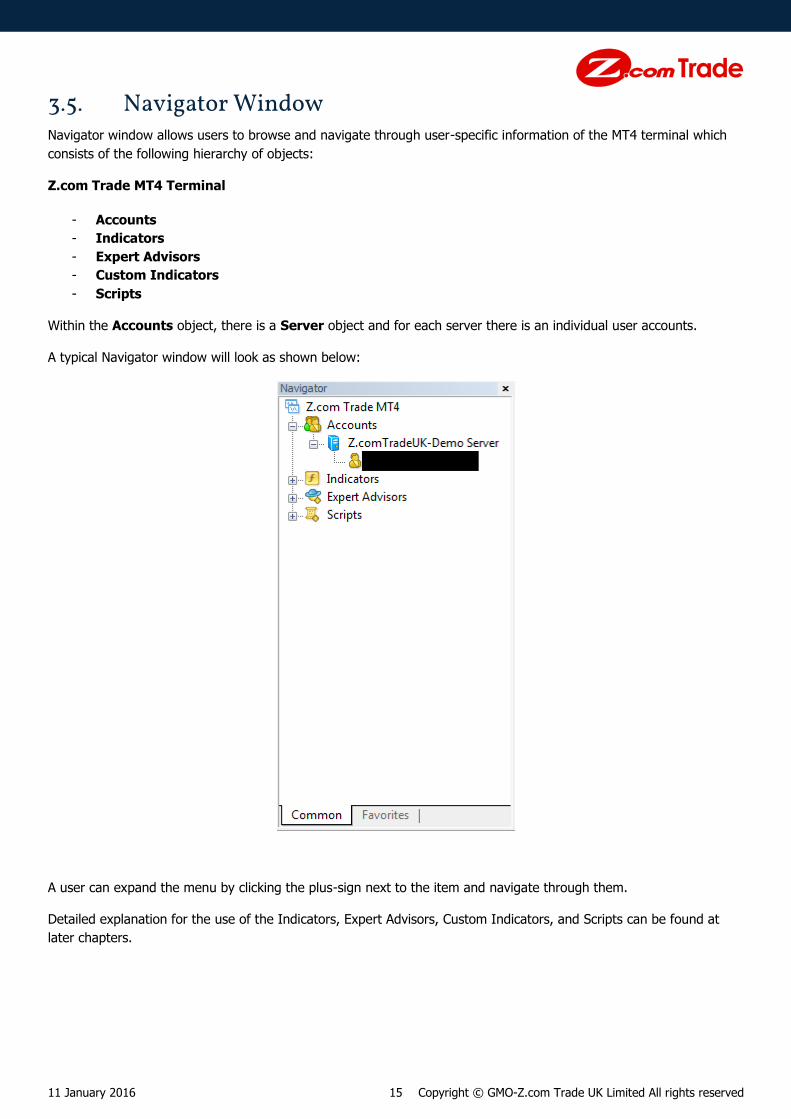
3.5. Navigator Window Navigator window allows users to browse and navigate through user-specific information of the MT4 terminal which
consists of the following hierarchy of objects:
Z.com Trade MT4 Terminal
- Accounts
- Indicators
- Expert Advisors
- Custom Indicators
- Scripts
Within the Accounts object, there is a Server object and for each server there is an individual user accounts.
A typical Navigator window will look as shown below:
A user can expand the menu by clicking the plus-sign next to the item and navigate through them.
Detailed explanation for the use of the Indicators, Expert Advisors, Custom Indicators, and Scripts can be found at
later chapters.

11 January 2016 16 Copyright © GMO-Z.com Trade UK Limited All rights reserved
3.6. Terminal Window Terminal window can be found at the bottom of the interface as shown below:
Trade: Trade-related information.
Account History: Historical activity on the account.
News: Historical news items.
Alerts: Historical alerts issued on the terminal.
Mailbox: Mailbox containing messages sent from the server.
Market: Buying or downloading applications from the market of MQL4 applications at MQL5.community website.
Code Base: Download applications published in the ‘Code Base’ section of the MQL5.community website.
Experts: Information for the status of Expert Advisor attached to a chart such as its activities.
Journal: Information regarding events and activities of the terminal.
Under the Trade tab, there is a row displaying the following information:
Balance: The amount of balance in the account. This does not take into account the Floating P/L of any positions
held, and it is only reflected to the Balance once the positions are closed and the P/L’s are realised.
Equity: The total amount of cash in the account and the equity which takes into account the current floating value of
those positions held. In other words, this would be calculated as: Balance – Net Floating P/L
Margin: The amount of cash used to open current open positions.
Free Margin: The amount of cash available to open new position. This is calculated as: Equity - Margin

11 January 2016 17 Copyright © GMO-Z.com Trade UK Limited All rights reserved
Margin Level: Proportion of Equity against Margin. This is calculated as: Equity / Margin
3.6.1. Viewing Open Positions
Open positions will be listed above the row containing the account information as shown below:
The followings are the description for each column from the left:
Order: Order reference number
Time: Time at which the position has been opened.
Type: Order Type (i.e. Buy or Sell)
Size: The size of the position in lot.
Symbol: Symbol of the instrument in which the position has been opened for.
Price: Price at which the position is opened for.
S/L: Price level for the Stop Loss if any specified.
T/P: Price level for the Take Profit if any specified.
Price: Current closing price for the position.
Commission: Any commission imposed on the order if any.
Swap: No values shall be shown here as the swap/rollover earned overnight for the open positions will only be
credited or debited from the account after the positions are closed.
Profit: Current Floating P/L calculated for the position.
11 January 2016 18 Copyright © GMO-Z.com Trade UK Limited All rights reserved
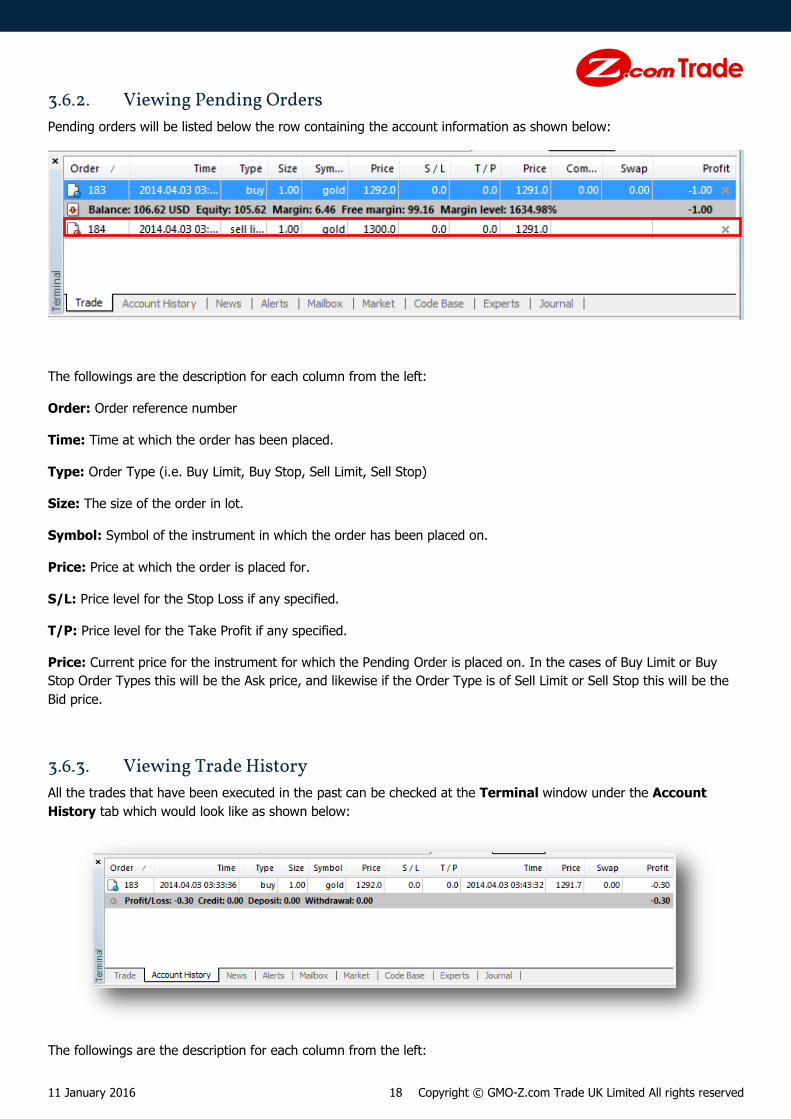
3.6.2. Viewing Pending Orders
Pending orders will be listed below the row containing the account information as shown below:
The followings are the description for each column from the left:
Order: Order reference number
Time: Time at which the order has been placed.
Type: Order Type (i.e. Buy Limit, Buy Stop, Sell Limit, Sell Stop)
Size: The size of the order in lot.
Symbol: Symbol of the instrument in which the order has been placed on.
Price: Price at which the order is placed for.
S/L: Price level for the Stop Loss if any specified.
T/P: Price level for the Take Profit if any specified.
Price: Current price for the instrument for which the Pending Order is placed on. In the cases of Buy Limit or Buy
Stop Order Types this will be the Ask price, and likewise if the Order Type is of Sell Limit or Sell Stop this will be the
Bid price.
3.6.3. Viewing Trade History
All the trades that have been executed in the past can be checked at the Terminal window under the Account
History tab which would look like as shown below:
The followings are the description for each column from the left:
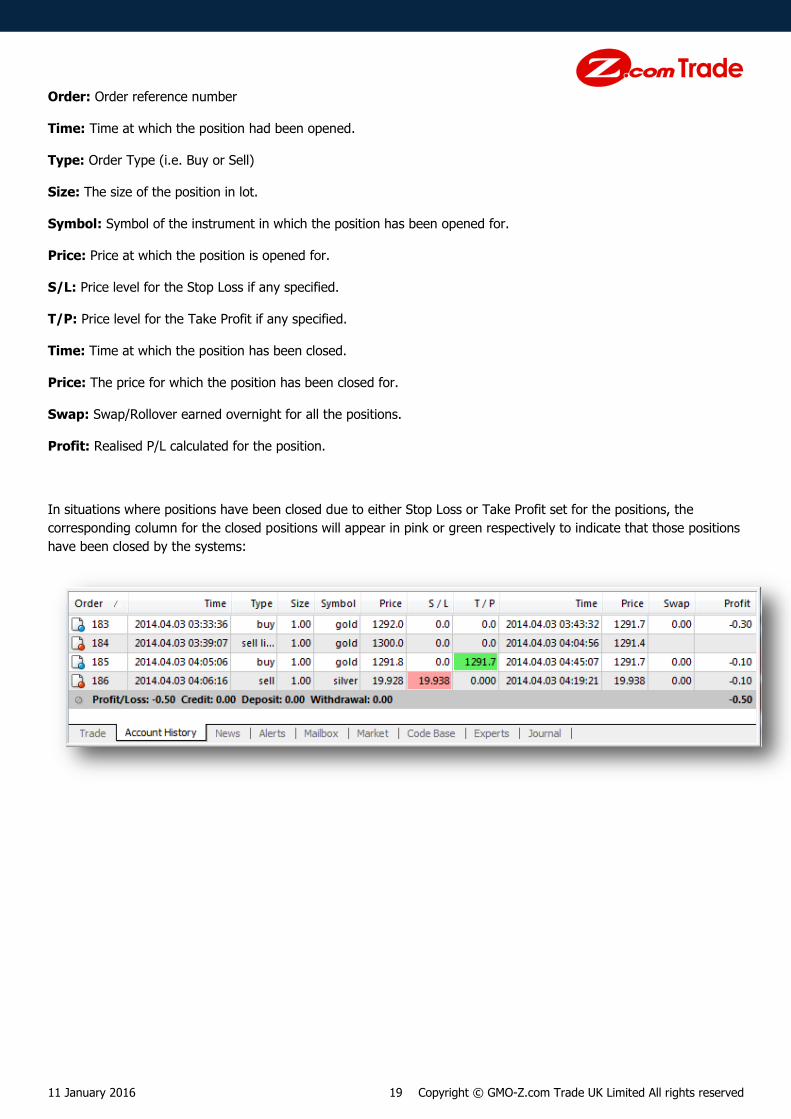
11 January 2016 19 Copyright © GMO-Z.com Trade UK Limited All rights reserved
Order: Order reference number
Time: Time at which the position had been opened.
Type: Order Type (i.e. Buy or Sell)
Size: The size of the position in lot.
Symbol: Symbol of the instrument in which the position has been opened for.
Price: Price at which the position is opened for.
S/L: Price level for the Stop Loss if any specified.
T/P: Price level for the Take Profit if any specified.
Time: Time at which the position has been closed.
Price: The price for which the position has been closed for.
Swap: Swap/Rollover earned overnight for all the positions.
Profit: Realised P/L calculated for the position.
In situations where positions have been closed due to either Stop Loss or Take Profit set for the positions, the
corresponding column for the closed positions will appear in pink or green respectively to indicate that those positions
have been closed by the systems:

11 January 2016 20 Copyright © GMO-Z.com Trade UK Limited All rights reserved
3.6.4. Setting Alerts for Events
The Alerts function on MT4 terminal enables users to set the Terminal so that it would activate alerts should certain
conditions set by the user is met. This is particularly useful since it is not easy for every user to be in front of the
screen monitoring the price action, but this function lets them sit back and notify them when it requires the attention
of the users.
The Alerts can be set in the following two ways:
3.6.4.1. Alerts through the Terminal Window
Alerts can be set simply under the Alerts tab from the Terminal window as shown below:
The first list of the Alerts is enabled and it will trigger each time when the Bid price for the symbol ‘GOLD’ goes above
1330.0 level. The alert at this moment has not been activated a single instance, and it is set to be activated for only
further 5 times with timeout of 10 seconds, expiring at 13:27 05/04/2014 and the event set as an alert.
On the other hand, the second alert item of the list is for the symbol ‘SILVER’, however, this alert has been disabled
as it is shown by the icon left of the symbol in the first column.
The Alerts can be enabled / disabled simply by right-clicking on the alert item and select Enable On / Off:
11 January 2016 21 Copyright © GMO-Z.com Trade UK Limited All rights reserved
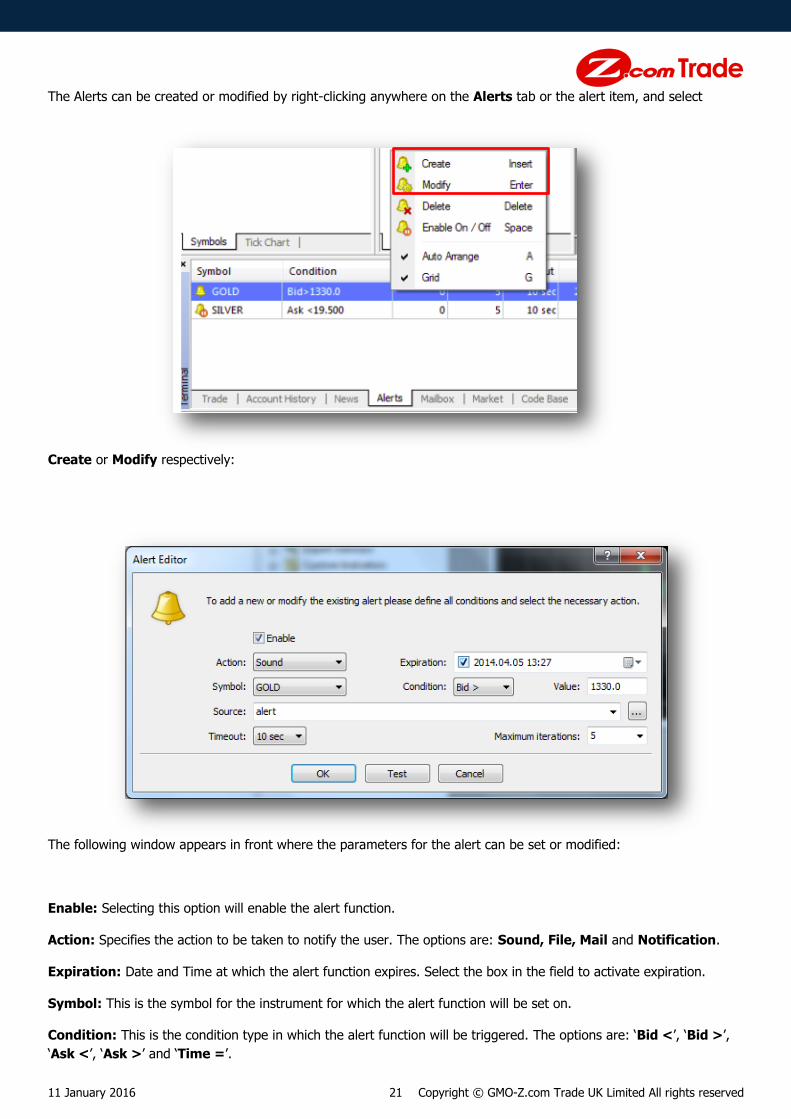
The Alerts can be created or modified by right-clicking anywhere on the Alerts tab or the alert item, and select
Create or Modify respectively:
The following window appears in front where the parameters for the alert can be set or modified:
Enable: Selecting this option will enable the alert function.
Action: Specifies the action to be taken to notify the user. The options are: Sound, File, Mail and Notification.
Expiration: Date and Time at which the alert function expires. Select the box in the field to activate expiration.
Symbol: This is the symbol for the instrument for which the alert function will be set on.
Condition: This is the condition type in which the alert function will be triggered. The options are: ‘Bid <’, ‘Bid >’,
‘Ask <’, ‘Ask >’ and ‘Time =’.

11 January 2016 22 Copyright © GMO-Z.com Trade UK Limited All rights reserved
Value: This will be the value in which combined with the condition the alert function will be triggered.
Source: This will be the alert sound source for Sound Action.
Timeout: This is the period of time between each alert triggering.
Maximum iterations: This is the maximum amount of time the alert will be triggered repeatedly.
Selecting Test button will test the alert sound to see if it is working, and by selecting OK the alert function will be set.
Alternatively, the alert function can be set directly from the chart which many users may find useful since it allows
them to see where they are setting the alert price at. This can be done by right-clicking on the price level on the chart
and place the cursor at Trading and select Alert from the sub-dropdown list as shown below:
Finally, enable the alert by double-clicking on the alert level on the chart or selecting from the Alerts tab from the
Terminal window and enter its parameters following the steps described previously.
3.6.4.2. Alerts through the Expert Advisors
In MQL4 there is a function which triggers an alert ‘Alert (“arg”)’ where ‘arg’ would be the argument for the alert
which will be set to trigger. In this way, there is more flexibility in setting the conditions in which the alert will trigger
as it can be programmed uniquely through MetaEditor.
3.7. Chart Window The Chart Windows are core to the MT4 where charts for the instruments are displayed. They will be positioned
around the centre of the MT4 interface and users are able to minimise, maximise or close the window just like other
windows.
The way the Chart Windows are displayed differs depending on whether there is only a single chart on the interface
or there are multiple charts displayed.
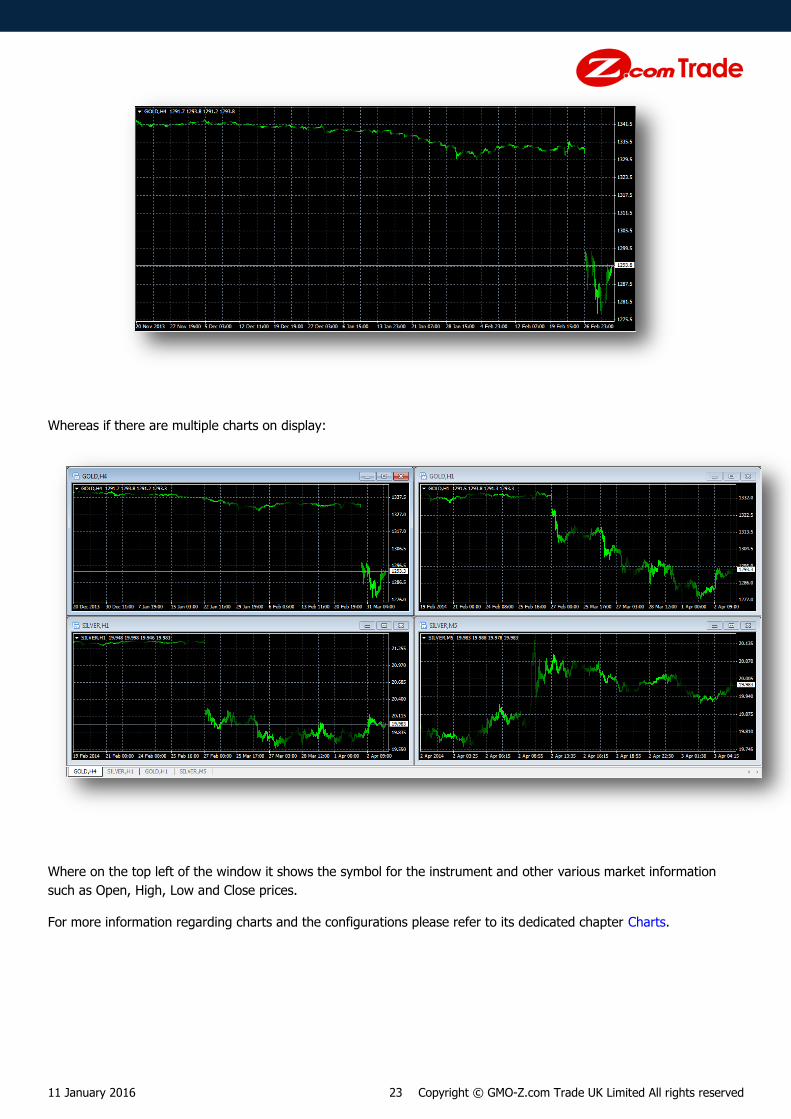
If there is a single chart on display, it would be shown as below:
11 January 2016 23 Copyright © GMO-Z.com Trade UK Limited All rights reserved
Whereas if there are multiple charts on display:
Where on the top left of the window it shows the symbol for the instrument and other various market information
such as Open, High, Low and Close prices.
For more information regarding charts and the configurations please refer to its dedicated chapter Charts.
11 January 2016 24 Copyright © GMO-Z.com Trade UK Limited All rights reserved
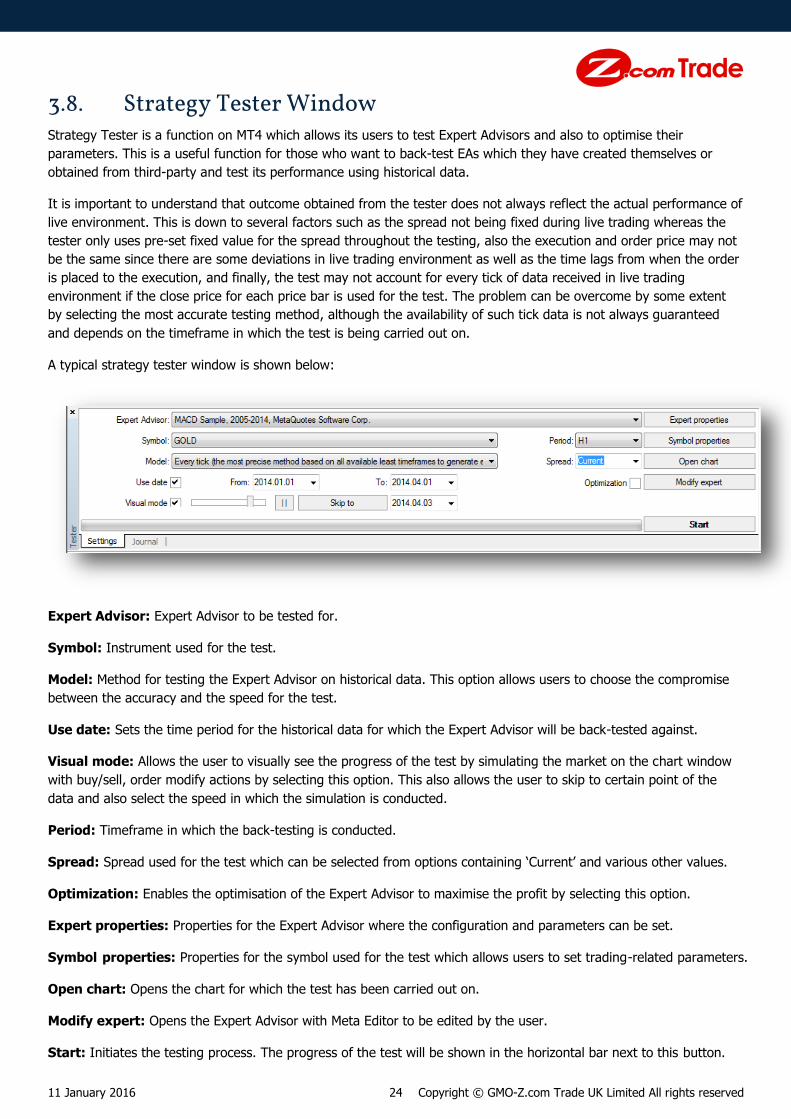
3.8. Strategy Tester Window Strategy Tester is a function on MT4 which allows its users to test Expert Advisors and also to optimise their
parameters. This is a useful function for those who want to back-test EAs which they have created themselves or
obtained from third-party and test its performance using historical data.
It is important to understand that outcome obtained from the tester does not always reflect the actual performance of
live environment. This is down to several factors such as the spread not being fixed during live trading whereas the
tester only uses pre-set fixed value for the spread throughout the testing, also the execution and order price may not
be the same since there are some deviations in live trading environment as well as the time lags from when the order
is placed to the execution, and finally, the test may not account for every tick of data received in live trading
environment if the close price for each price bar is used for the test. The problem can be overcome by some extent
by selecting the most accurate testing method, although the availability of such tick data is not always guaranteed
and depends on the timeframe in which the test is being carried out on.
A typical strategy tester window is shown below:
Expert Advisor: Expert Advisor to be tested for.
Symbol: Instrument used for the test.
Model: Method for testing the Expert Advisor on historical data. This option allows users to choose the compromise
between the accuracy and the speed for the test.
Use date: Sets the time period for the historical data for which the Expert Advisor will be back-tested against.
Visual mode: Allows the user to visually see the progress of the test by simulating the market on the chart window
with buy/sell, order modify actions by selecting this option. This also allows the user to skip to certain point of the
data and also select the speed in which the simulation is conducted.
Period: Timeframe in which the back-testing is conducted.
Spread: Spread used for the test which can be selected from options containing ‘Current’ and various other values.
Optimization: Enables the optimisation of the Expert Advisor to maximise the profit by selecting this option.
Expert properties: Properties for the Expert Advisor where the configuration and parameters can be set.
Symbol properties: Properties for the symbol used for the test which allows users to set trading-related parameters.
Open chart: Opens the chart for which the test has been carried out on.
Modify expert: Opens the Expert Advisor with Meta Editor to be edited by the user.
Start: Initiates the testing process. The progress of the test will be shown in the horizontal bar next to this button.
11 January 2016 25 Copyright © GMO-Z.com Trade UK Limited All rights reserved
For more information on how to use the Strategy Tester window, please refer to the section Strategy Tester.
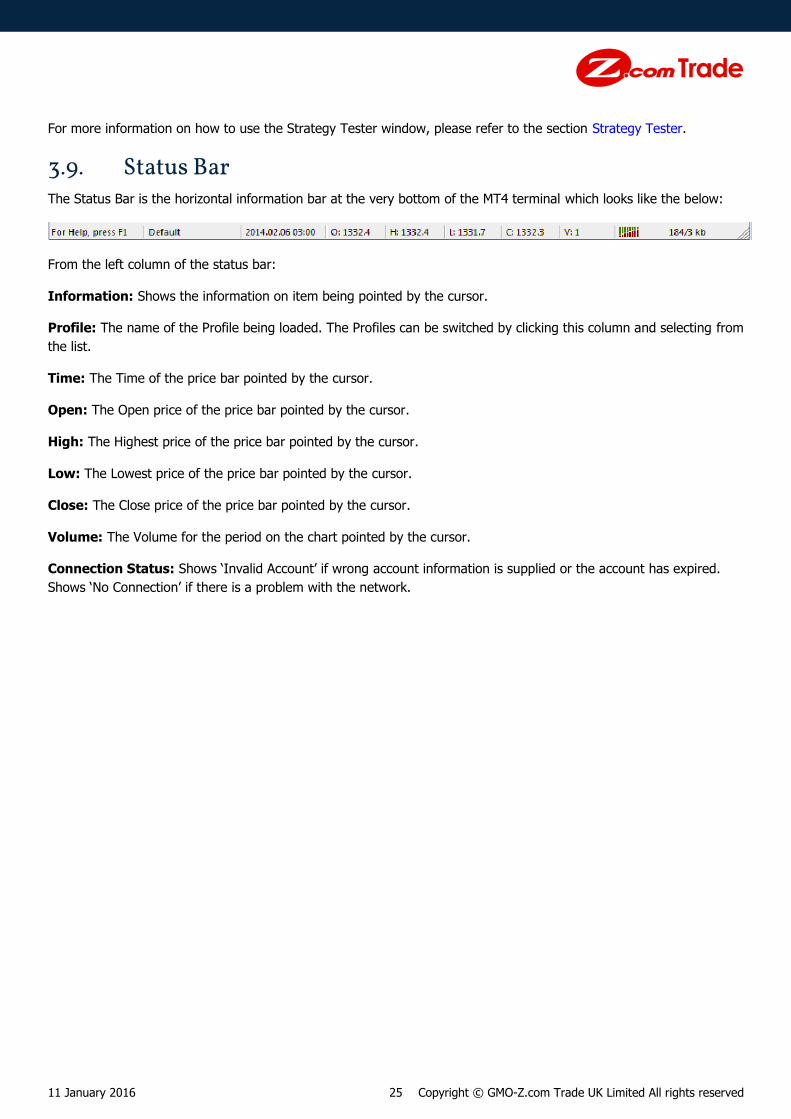
3.9. Status Bar The Status Bar is the horizontal information bar at the very bottom of the MT4 terminal which looks like the below:
From the left column of the status bar:
Information: Shows the information on item being pointed by the cursor.
Profile: The name of the Profile being loaded. The Profiles can be switched by clicking this column and selecting from
the list.
Time: The Time of the price bar pointed by the cursor.
Open: The Open price of the price bar pointed by the cursor.
High: The Highest price of the price bar pointed by the cursor.
Low: The Lowest price of the price bar pointed by the cursor.
Close: The Close price of the price bar pointed by the cursor.
Volume: The Volume for the period on the chart pointed by the cursor.
Connection Status: Shows ‘Invalid Account’ if wrong account information is supplied or the account has expired.
Shows ‘No Connection’ if there is a problem with the network.

11 January 2016 26 Copyright © GMO-Z.com Trade UK Limited All rights reserved
3.10. Main Menu
Menus in MT4 provide core functionality to control MT4. Although using the menu to navigate through MT4 may not
be the best option when it comes to usability, this gives users an option to look for anything that cannot be found
elsewhere.
3.10.1. File
The File menu is the most basic type of the menu which contains general controls of MT4 terminal:
New Chart: Opens a new chart.
Open Offline: Opens an offline chart.
Open Deleted: Opens a chart which has been deleted.
Profiles: Controls profiles.
Close: Closes the active chart.
Save As: Saves the market data of the active chart in ASCII (.txt) format.
Save As Picture: Saves pictures of the current MT4 active workspace, active chart.
Open Data Folder: Opens the folder which contains application data.
Open an Account: Please note that this function does not work. Please go to our website to submit your
application online.

11 January 2016 27 Copyright © GMO-Z.com Trade UK Limited All rights reserved
Login: Opens a new window for the login.
Print Setup: Opens a new window for setting up a printer.
Print Preview: Opens a print preview on the chart window.
Print: Prints the active chart.
Exit: Quits the application.
3.10.2. View
The View menu contains functions for controlling the MT4 interface:
Languages: Changes the language on MT4.
Toolbars: Display options for the Toolbars.
Status Bar: Displays the Status Bar.
Charts Bar: Displays the Charts Bar.
Market Watch: Displays the Market Watch.
Data Window: Displays the Data Window.
Navigator: Displays the Navigator Window.
Terminal: Displays the Terminal Window.
Strategy Tester: Displays the Strategy Tester.
Full Screen: Displays the Chart Window in full-screen.
11 January 2016 28 Copyright © GMO-Z.com Trade UK Limited All rights reserved
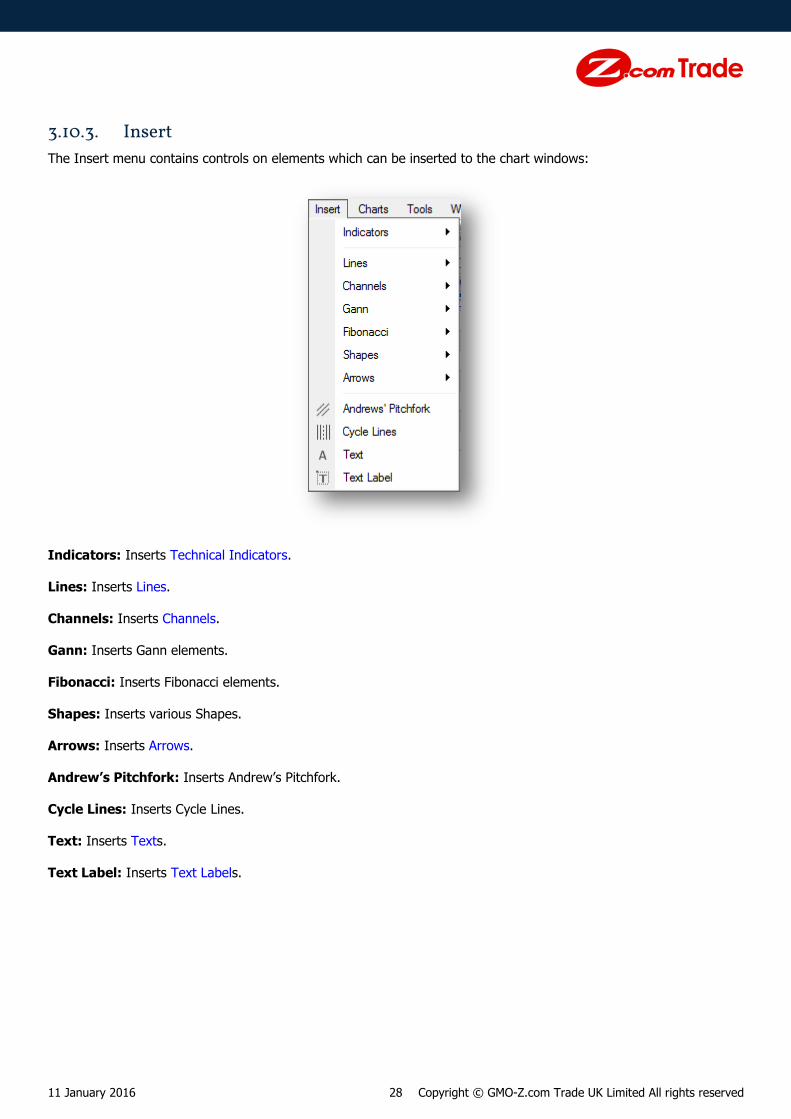
3.10.3. Insert
The Insert menu contains controls on elements which can be inserted to the chart windows:
Indicators: Inserts Technical Indicators.
Lines: Inserts Lines.
Channels: Inserts Channels.
Gann: Inserts Gann elements.
Fibonacci: Inserts Fibonacci elements.
Shapes: Inserts various Shapes.
Arrows: Inserts Arrows.
Andrew’s Pitchfork: Inserts Andrew’s Pitchfork.
Cycle Lines: Inserts Cycle Lines.
Text: Inserts Texts.
Text Label: Inserts Text Labels.

11 January 2016 29 Copyright © GMO-Z.com Trade UK Limited All rights reserved
3.10.4. Charts
The Charts menu contains controls on the charts:
Indicators List: Displays the currently used Technical Indicators for the active chart in a new window.
Objects: Control for all the objects on the active chart.
Bar Chart: Switches the chart type to the Bar Chart.
Candlesticks: Switches the chart type to the Candlesticks.
Line Chart: Switches the chart type to the Line Chart.
Foreground Chart: The chart would appear in front of all the objects.
Periodicity: Switches the Timeframes for the active chart.
Template: Controls the Template for the active chart.
Refresh: Refreshes the active chart.
Grid: Displays the Grid Lines on the active chart.
11 January 2016 30 Copyright © GMO-Z.com Trade UK Limited All rights reserved
Volumes: Displays the Volumes on the active chart.
Auto Scroll: Enables Auto Scroll for the active chart.
Chart Shift: Enables Chart Shift for the active chart.
Zoom In: Zooms In on the active chart.
Zoom Out: Zooms Out on the active chart.
Step by Step: Shift the chart by one bar to the left or hit F12 to perform the same action.
Properties: Properties for the active chart.
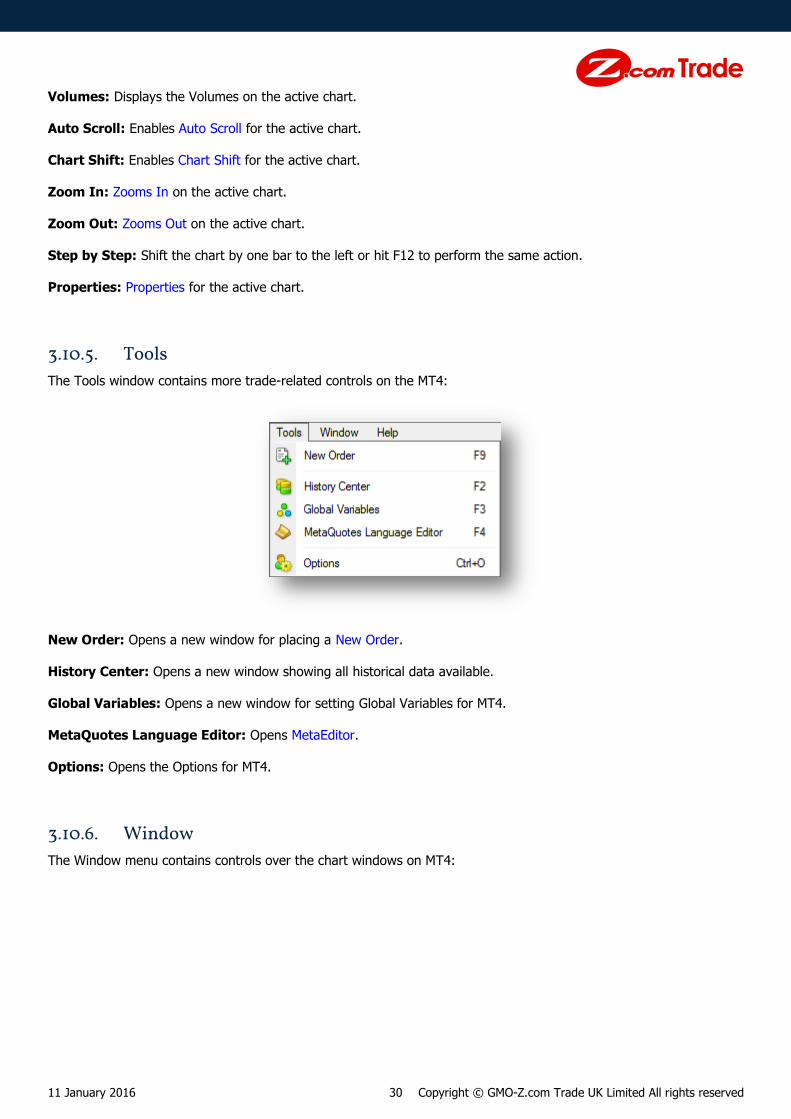
3.10.5. Tools
The Tools window contains more trade-related controls on the MT4:
New Order: Opens a new window for placing a New Order.
History Center: Opens a new window showing all historical data available.
Global Variables: Opens a new window for setting Global Variables for MT4.
MetaQuotes Language Editor: Opens MetaEditor.
Options: Opens the Options for MT4.
3.10.6. Window
The Window menu contains controls over the chart windows on MT4:
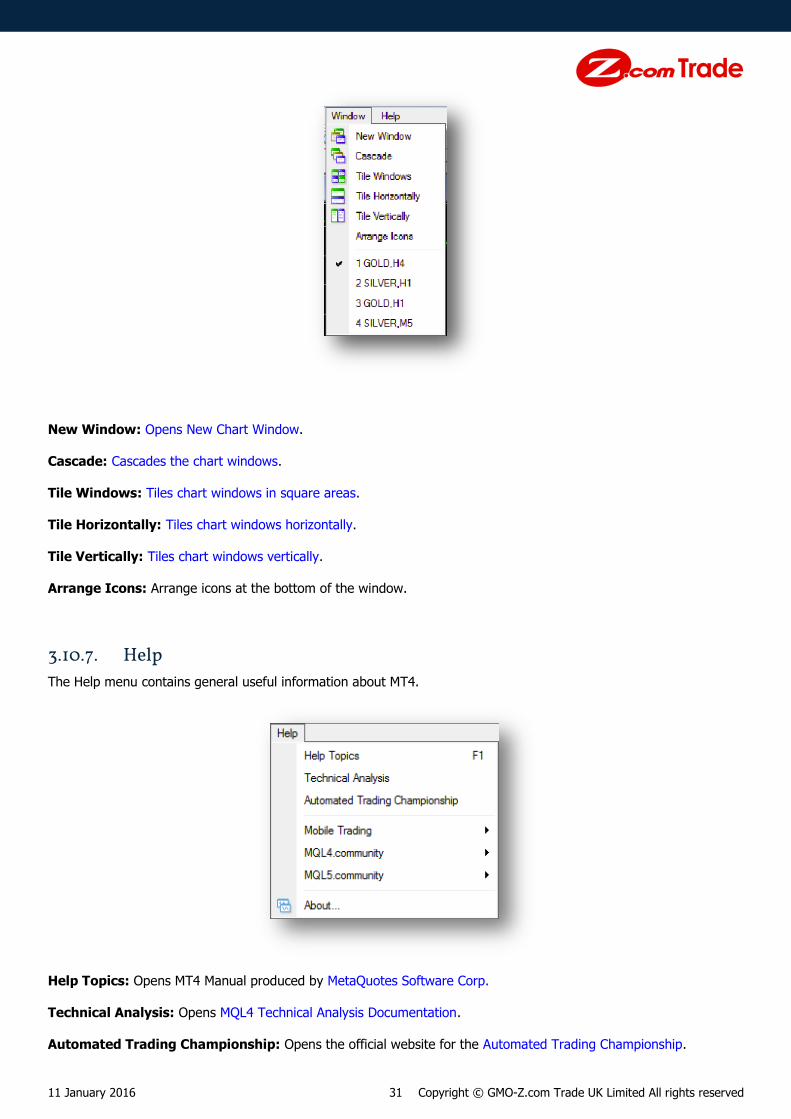
11 January 2016 31 Copyright © GMO-Z.com Trade UK Limited All rights reserved
New Window: Opens New Chart Window.
Cascade: Cascades the chart windows.
Tile Windows: Tiles chart windows in square areas.
Tile Horizontally: Tiles chart windows horizontally.
Tile Vertically: Tiles chart windows vertically.
Arrange Icons: Arrange icons at the bottom of the window.
3.10.7. Help
The Help menu contains general useful information about MT4.
Help Topics: Opens MT4 Manual produced by MetaQuotes Software Corp.
Technical Analysis: Opens MQL4 Technical Analysis Documentation.
Automated Trading Championship: Opens the official website for the Automated Trading Championship.
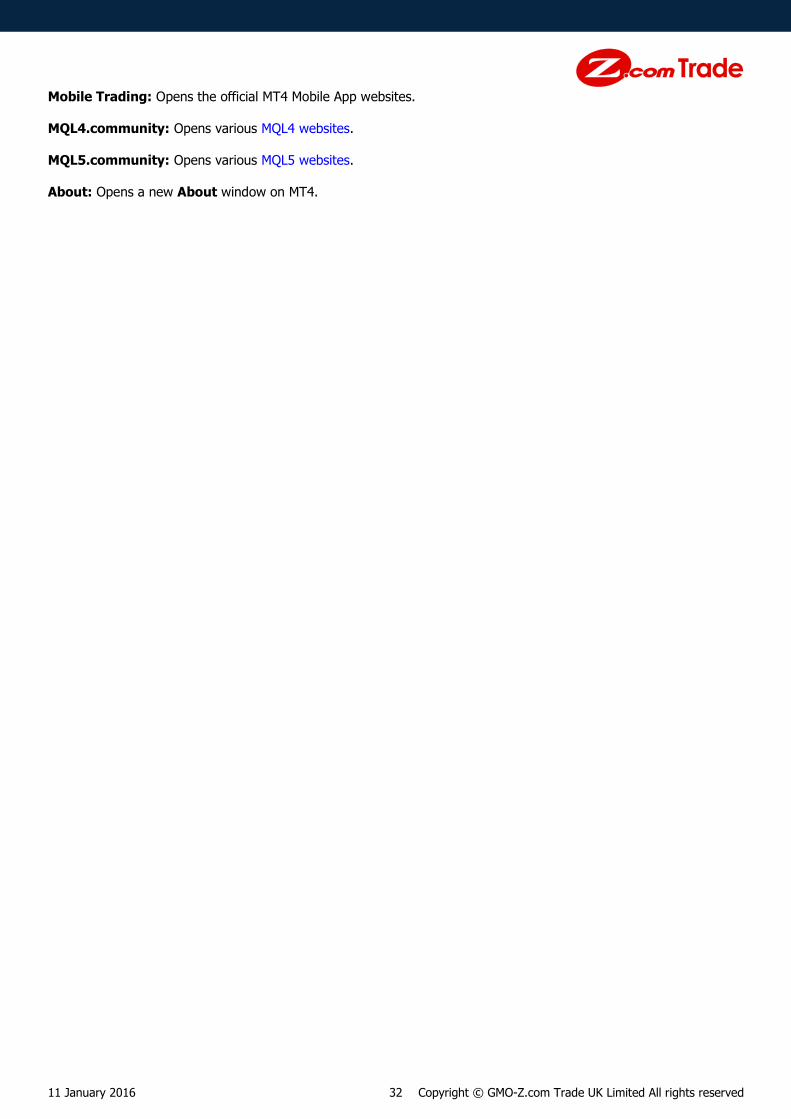
11 January 2016 32 Copyright © GMO-Z.com Trade UK Limited All rights reserved
Mobile Trading: Opens the official MT4 Mobile App websites.
MQL4.community: Opens various MQL4 websites.
MQL5.community: Opens various MQL5 websites.
About: Opens a new About window on MT4.

11 January 2016 33 Copyright © GMO-Z.com Trade UK Limited All rights reserved
4. Trading
MT4 platform offered by Z.com Trade is capable of handling order types of Market Execution and Pending Order.
Market Execution order can be placed for instant opening of positions, whereas Pending Order is for placing Buy/Sell –
Limits/Stop, Stop Loss, and Take Profits orders.
*It is important to note that under the Market Execution order type, even if an order is placed at particular price it is
not guaranteed to be executed at that price due to market fluctuations and order processing times. In some cases the
execution price may deviate from the order price more than other occasions.
*With Z.com Trade MT4 it is possible to hedge positions, meaning that if you attempt to close a position by placing an
order with opposite direction you will end up with two opposite positions instead of closing the original position.
Most of the orders in MT4 can be placed from Order window which can be opened by clicking on the New Order
button from the Standard Toolbar as shown below:
Alternatively, the Order window can be opened by double-clicking on one of the Symbols from the Market Watch
Window, or right-click and select New Order:
A new window appears as shown below:

11 January 2016 34 Copyright © GMO-Z.com Trade UK Limited All rights reserved
4.1. Market Orders A new position can be opened for an instrument from Order window with ‘Market Execution’ type. This section
explains how to open a position using the Order window.
Symbol: Select the symbol for the instrument in which the order is intended to be placed. By default this will be the
active chart or the instrument of the chart where the new order is selected from.
Volume: Order size in lots. For more information on contract specifications, please refer to our website.
Stop Loss: Set the level for stop loss for pending orders.
Take Profit: Set the level for take profit for pending orders.
Comment: Set the comment which will be linked to the order.
11 January 2016 35 Copyright © GMO-Z.com Trade UK Limited All rights reserved
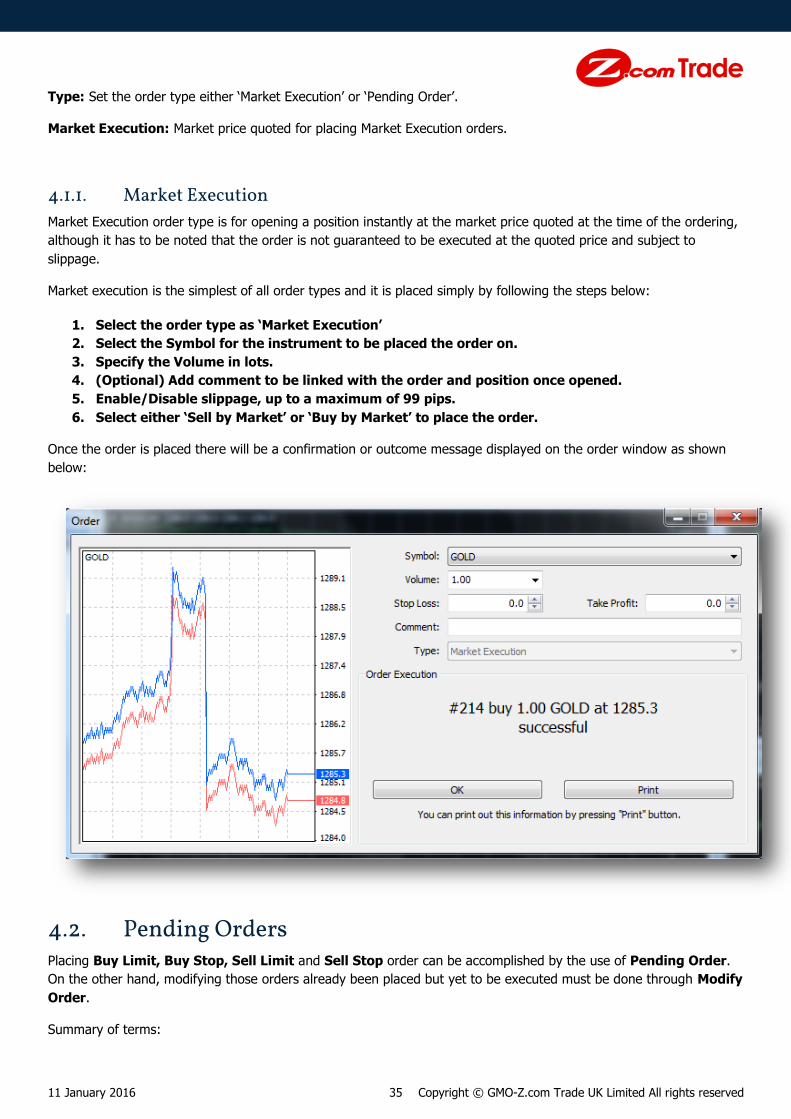
Type: Set the order type either ‘Market Execution’ or ‘Pending Order’.
Market Execution: Market price quoted for placing Market Execution orders.
4.1.1. Market Execution
Market Execution order type is for opening a position instantly at the market price quoted at the time of the ordering,
although it has to be noted that the order is not guaranteed to be executed at the quoted price and subject to
slippage.
Market execution is the simplest of all order types and it is placed simply by following the steps below:
1. Select the order type as ‘Market Execution’
2. Select the Symbol for the instrument to be placed the order on.
3. Specify the Volume in lots.
4. (Optional) Add comment to be linked with the order and position once opened.
5. Enable/Disable slippage, up to a maximum of 99 pips.
6. Select either ‘Sell by Market’ or ‘Buy by Market’ to place the order.
Once the order is placed there will be a confirmation or outcome message displayed on the order window as shown
below:
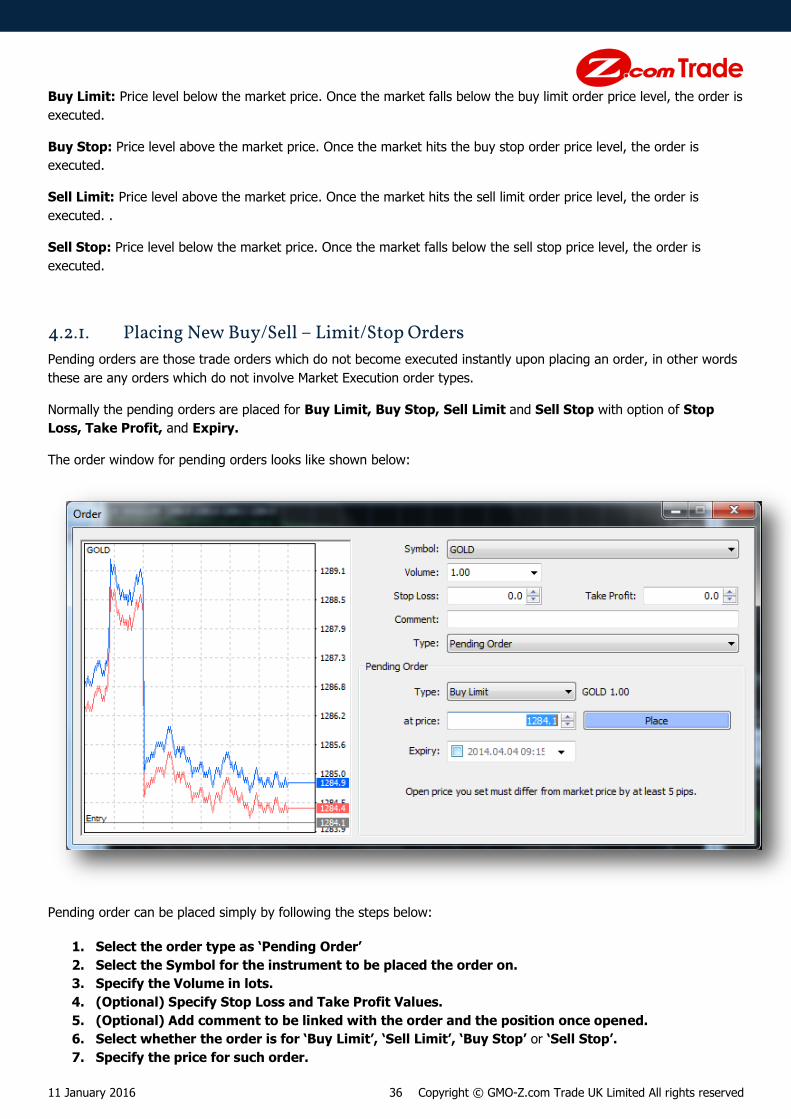
4.2. Pending Orders Placing Buy Limit, Buy Stop, Sell Limit and Sell Stop order can be accomplished by the use of Pending Order.
On the other hand, modifying those orders already been placed but yet to be executed must be done through Modify
Order.
Summary of terms:
11 January 2016 36 Copyright © GMO-Z.com Trade UK Limited All rights reserved
Buy Limit: Price level below the market price. Once the market falls below the buy limit order price level, the order is
executed.
Buy Stop: Price level above the market price. Once the market hits the buy stop order price level, the order is
executed.
Sell Limit: Price level above the market price. Once the market hits the sell limit order price level, the order is
executed. .
Sell Stop: Price level below the market price. Once the market falls below the sell stop price level, the order is
executed.
4.2.1. Placing New Buy/Sell – Limit/Stop Orders
Pending orders are those trade orders which do not become executed instantly upon placing an order, in other words
these are any orders which do not involve Market Execution order types.
Normally the pending orders are placed for Buy Limit, Buy Stop, Sell Limit and Sell Stop with option of Stop
Loss, Take Profit, and Expiry.
The order window for pending orders looks like shown below:
Pending order can be placed simply by following the steps below:
1. Select the order type as ‘Pending Order’
2. Select the Symbol for the instrument to be placed the order on.
3. Specify the Volume in lots.
4. (Optional) Specify Stop Loss and Take Profit Values.
5. (Optional) Add comment to be linked with the order and the position once opened.
6. Select whether the order is for ‘Buy Limit’, ‘Sell Limit’, ‘Buy Stop’ or ‘Sell Stop’.
7. Specify the price for such order.
11 January 2016 37 Copyright © GMO-Z.com Trade UK Limited All rights reserved
Please note that the price level must differ from market price by at least the minimum distance shown in the
order window (in pips). Otherwise, the pending order will not be accepted. This is applicable to all entry
pending orders, Stop Loss and Take profit orders.
8. (Optional) Specify Expiry date.
9. Select ‘Place’ button to place the order.
4.2.2. Placing New Buy/Sell – Limit/Stop Orders Directly From Chart
Alternatively, MT4 has a functionality to place Buy/Sell – Limit/Stop orders directly on the chart. This is a very useful
tool for traders since it allows for easy actions and also gives the ability to interact trade actions with chart patterns.
For example a trader might spot an opportunity on a chart by analysing its price patterns which may have been as a
result of indicators drawn on the chart. Based on such information the trader knows exactly at which price the order
should be placed for, so hence rather than placing an order from the Order window by manually entering the price
level it can be accomplished simply by pointing the cursor to the intended price level on the chart and right-click to
place the order.
Moreover, this tool automatically recognises which order types are appropriate for the corresponding price level
selected. For example if the price level is chosen above the current market price, it will only give you choices of Sell
Limit and Buy Stop, whereas if it was the other way around it would only give you choices of Buy Limit and Sell Stop.
On top of these, Users are also able to enable Alert function for a particular price level directly on the chart through
the same method.
For placing such new orders, follow the instructions below:
1. Identify which type of order needs to be placed on which instrument.
2. Identify the price level at which the order needs to be placed on.
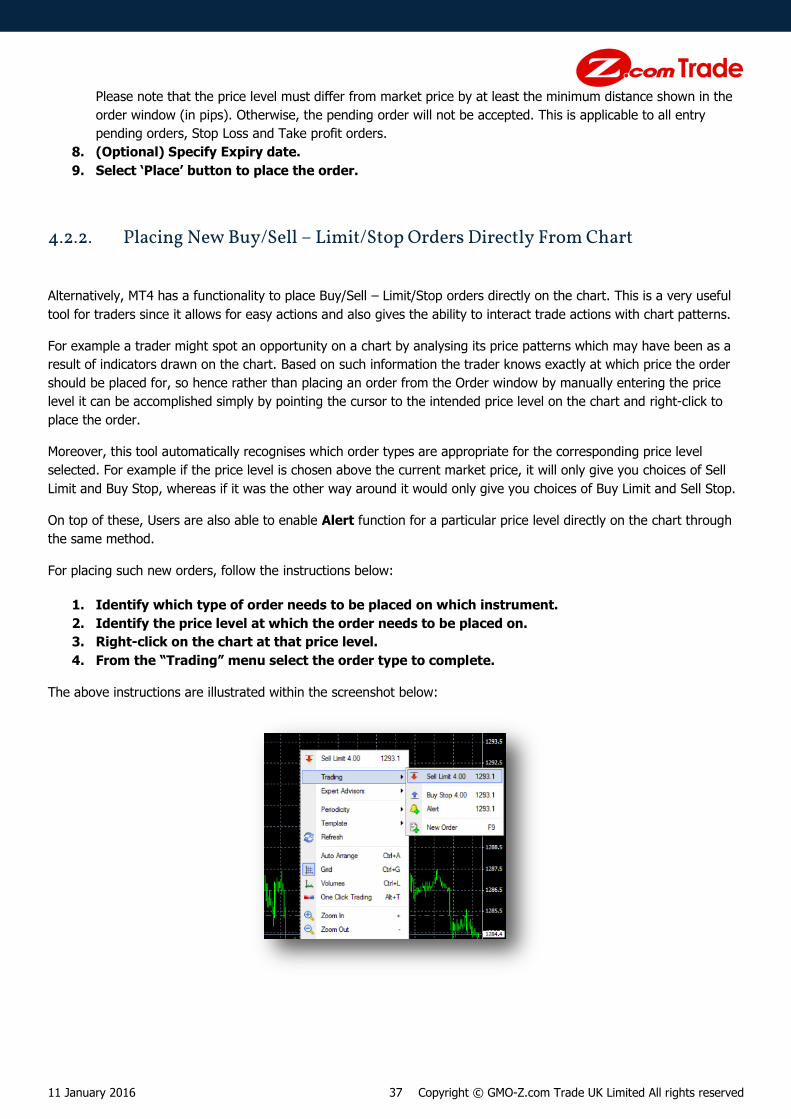
3. Right-click on the chart at that price level.
4. From the “Trading” menu select the order type to complete.
The above instructions are illustrated within the screenshot below:
11 January 2016 38 Copyright © GMO-Z.com Trade UK Limited All rights reserved
4.3. Modifying Orders All the orders apart from those with Market Execution types (i.e. Buy/Sell – Limit/Stop, Stop Loss and Take Profit
orders) can be modified as long as they are yet to be executed. Normally those orders would appear on the chart as
dotted horizontal lines to indicate which type and at what price the orders are placed for.
4.3.1. Modifying Buy/Sell – Limit/Stop Orders
Pending orders can be modified to have their parameters changed or even delete the order itself.
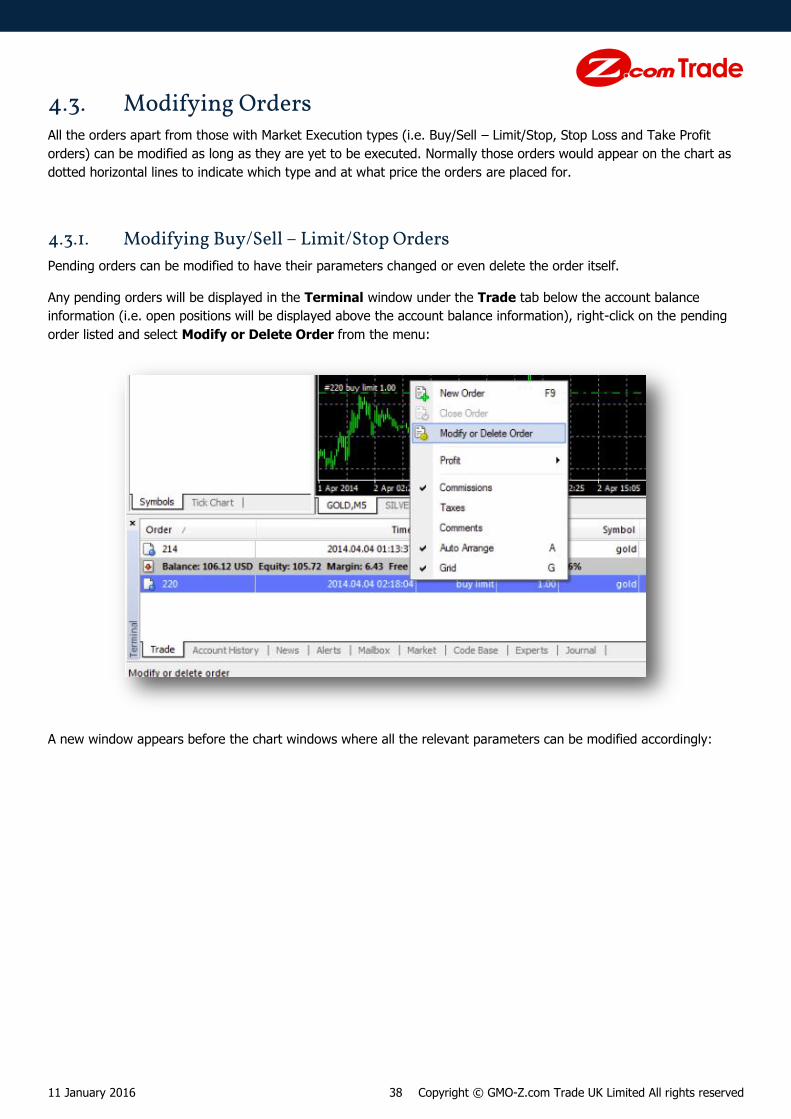
Any pending orders will be displayed in the Terminal window under the Trade tab below the account balance
information (i.e. open positions will be displayed above the account balance information), right-click on the pending
order listed and select Modify or Delete Order from the menu:
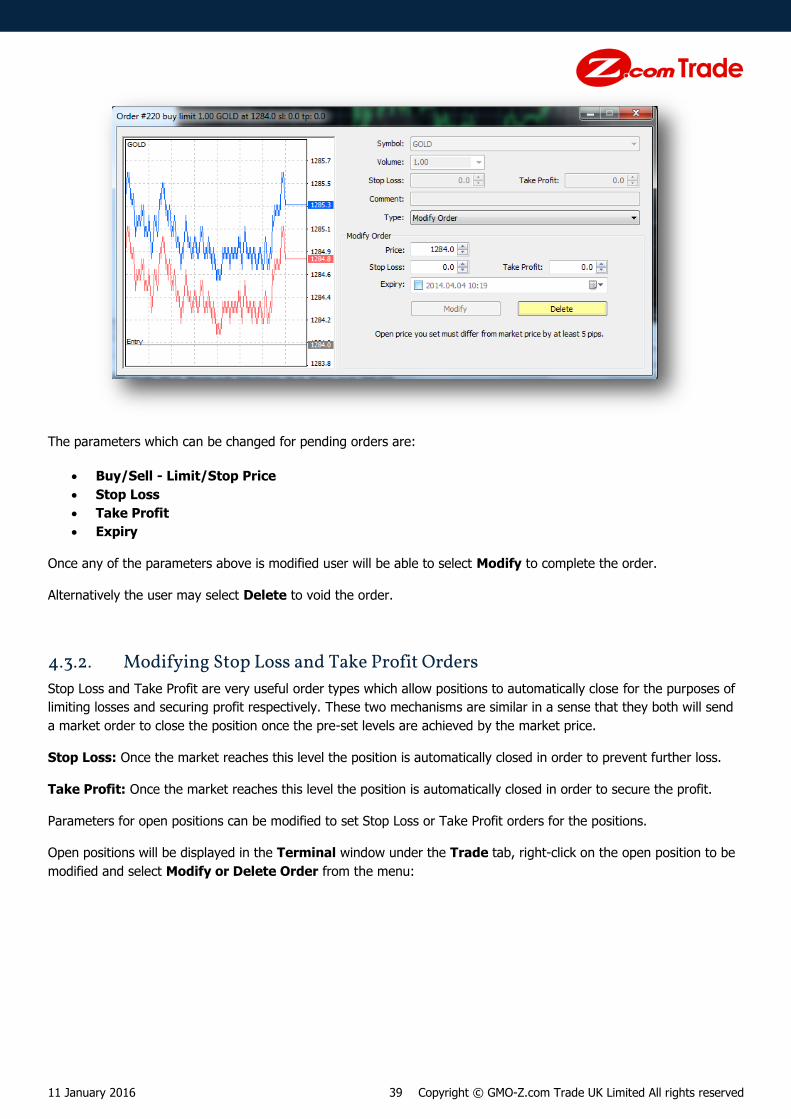
A new window appears before the chart windows where all the relevant parameters can be modified accordingly:
11 January 2016 39 Copyright © GMO-Z.com Trade UK Limited All rights reserved
The parameters which can be changed for pending orders are:
Buy/Sell - Limit/Stop Price
Stop Loss
Take Profit
Expiry
Once any of the parameters above is modified user will be able to select Modify to complete the order.
Alternatively the user may select Delete to void the order.
4.3.2. Modifying Stop Loss and Take Profit Orders
Stop Loss and Take Profit are very useful order types which allow positions to automatically close for the purposes of
limiting losses and securing profit respectively. These two mechanisms are similar in a sense that they both will send
a market order to close the position once the pre-set levels are achieved by the market price.
Stop Loss: Once the market reaches this level the position is automatically closed in order to prevent further loss.
Take Profit: Once the market reaches this level the position is automatically closed in order to secure the profit.
Parameters for open positions can be modified to set Stop Loss or Take Profit orders for the positions.
Open positions will be displayed in the Terminal window under the Trade tab, right-click on the open position to be
modified and select Modify or Delete Order from the menu:

11 January 2016 40 Copyright © GMO-Z.com Trade UK Limited All rights reserved
A new window appears before the chart window where all the relevant parameters can be modified accordingly:
The parameters which can be changed for pending orders are:
Stop Loss
Take Profit

11 January 2016 41 Copyright © GMO-Z.com Trade UK Limited All rights reserved
For modifying either Stop Loss or Take Profit, it can be done either by directly entering the value in the corresponding
field or select the Level (i.e. deviation from the current price in pips) and click Copy as button with relevant value
inside to paste the automatically generated value into the corresponding field.
Finally click Modify button to complete modifying the open position.
4.3.3. Modifying Buy/Sell – Limit/Stop, Stop Loss and Take Profit Orders Directly
From Chart
All the order types apart from the Market Execution can be modified directly from the chart by dragging the lines
along the price levels. This is a useful tool as it allows instant modification of orders and also the user is able to
choose the new price directly on the chart.
To modifying orders:
1. Click on the order line and drag it to the new price level
The screenshot below shows the order line on a chart:
Upon completion check that the order line has been updated to the new price level. This might take a few seconds for
the order to be accepted by the server. If the new price level is invalid (e.g. trying to modify Buy Limit order above
the current market price), nothing would happen on the chart and the original order line remains in the same price
level.
11 January 2016 42 Copyright © GMO-Z.com Trade UK Limited All rights reserved
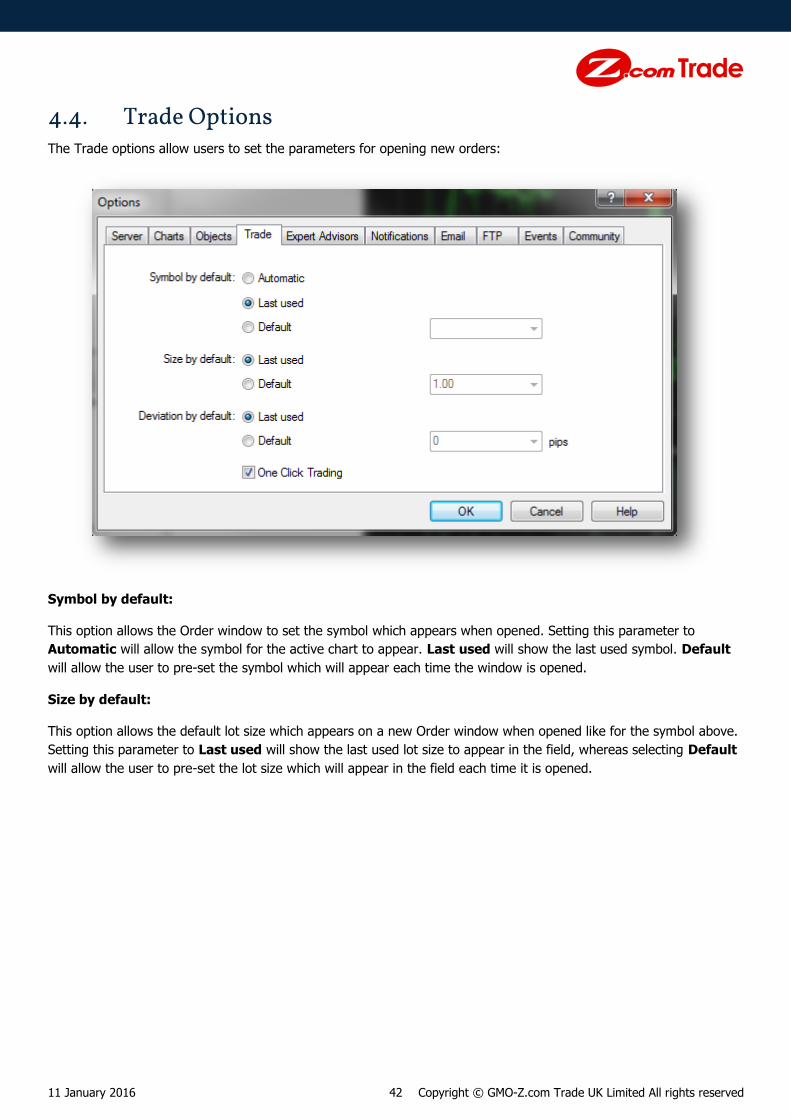
4.4. Trade Options The Trade options allow users to set the parameters for opening new orders:
Symbol by default:
This option allows the Order window to set the symbol which appears when opened. Setting this parameter to
Automatic will allow the symbol for the active chart to appear. Last used will show the last used symbol. Default
will allow the user to pre-set the symbol which will appear each time the window is opened.
Size by default:
This option allows the default lot size which appears on a new Order window when opened like for the symbol above.
Setting this parameter to Last used will show the last used lot size to appear in the field, whereas selecting Default
will allow the user to pre-set the lot size which will appear in the field each time it is opened.
11 January 2016 43 Copyright © GMO-Z.com Trade UK Limited All rights reserved
5. Closing Positions
With Z.com Trade MT4, positions can only be closed using dedicated position closing function as it allows for ‘Hedging’
when two positions are opened in the opposite directions.
5.1. Market Orders Closing a position through Market Order is done by ‘Market Execution’ order type where the user places a close order
given the market quote, although it must be noted that the order is not guaranteed to be executed at the quoted
price.
Normally, positions can be closed from an Order Window where the closing lot size can be specified which is useful
for partial closing of a position. On the other hand, there are other methods exist which allow for simple closing of the
entire position which can be used if it is known that the entire position needs to be closed rather than a part of it.
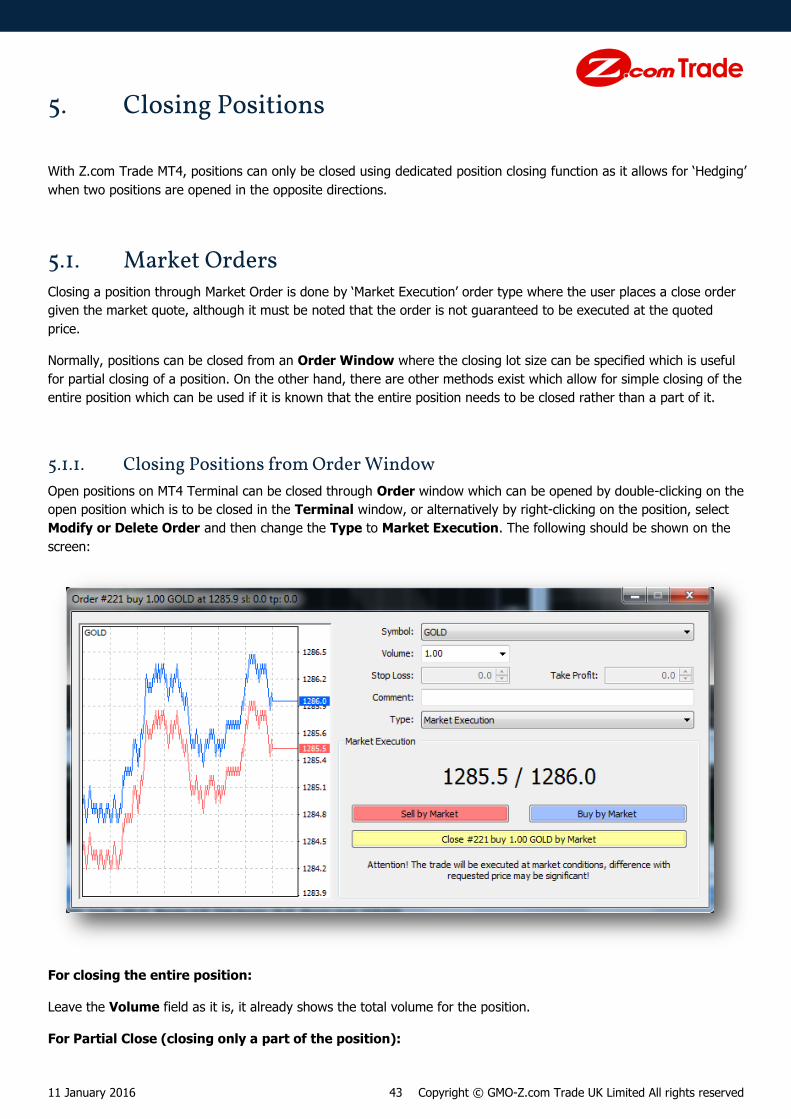
5.1.1. Closing Positions from Order Window
Open positions on MT4 Terminal can be closed through Order window which can be opened by double-clicking on the
open position which is to be closed in the Terminal window, or alternatively by right-clicking on the position, select
Modify or Delete Order and then change the Type to Market Execution. The following should be shown on the
screen:
For closing the entire position:
Leave the Volume field as it is, it already shows the total volume for the position.
For Partial Close (closing only a part of the position):
11 January 2016 44 Copyright © GMO-Z.com Trade UK Limited All rights reserved
Enter the lot size on the Volume field in which is to be closed. This must be equal to or less than the size of the
position and incremental of the minimum order size.
And then finally select Close button to complete the closing of the position.
If the close order is succeeded the closed position should be available to view in the Terminal window under the
Account History tab.
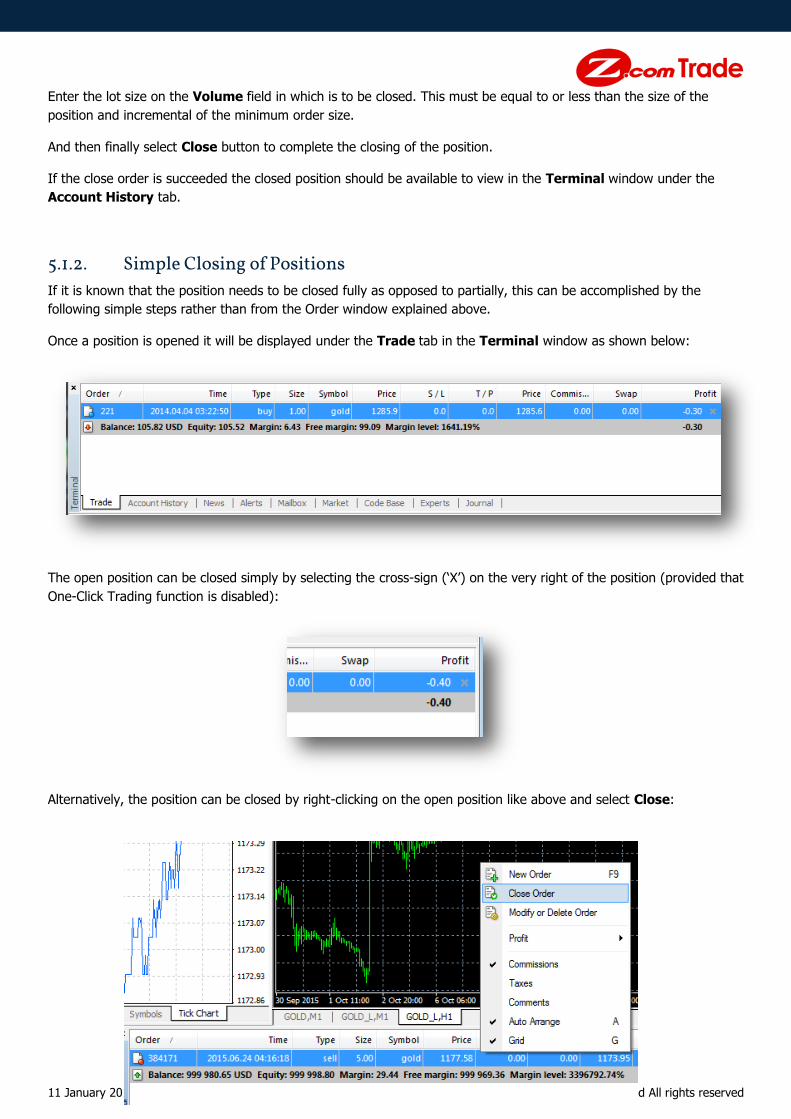
5.1.2. Simple Closing of Positions
If it is known that the position needs to be closed fully as opposed to partially, this can be accomplished by the
following simple steps rather than from the Order window explained above.
Once a position is opened it will be displayed under the Trade tab in the Terminal window as shown below:
The open position can be closed simply by selecting the cross-sign (‘X’) on the very right of the position (provided that
One-Click Trading function is disabled):
Alternatively, the position can be closed by right-clicking on the open position like above and select Close:

11 January 2016 45 Copyright © GMO-Z.com Trade UK Limited All rights reserved
The position will be closed with Market Execution upon selecting the option. Closed positions can be checked in
Terminal window under the Account History tab:
5.2. Pending Orders Positions can be closed through a Pending Order as well as a Market Order. Pending Orders for closing position are
Stop Loss and Take Profit orders.
Stop Loss: A system which prevents further losses for a position by setting a price level at which the position will be
automatically closed if the market moves in an unfavourable direction to the trader.
Take Profit: A system which secures certain amount of profit for a position by setting a price level at which the
position will be automatically closed if the market moves in favourable direction to the trader.
The procedures for setting these orders are described in the previous sections Pending Orders and Modifying Stop
Loss and Take Profit Orders.
Once the positions are closed due to either Stop Loss or Take Profit, they can be viewed under the Account History
tab from the Terminal window.
If the position is closed due to the Stop Loss being triggered, the cell under the column S/L will be shown with pink
background colour:
If the position is closed due to the Take Profit being triggered, the cell under the column T/P will be shown with
Green background colour:
11 January 2016 46 Copyright © GMO-Z.com Trade UK Limited All rights reserved
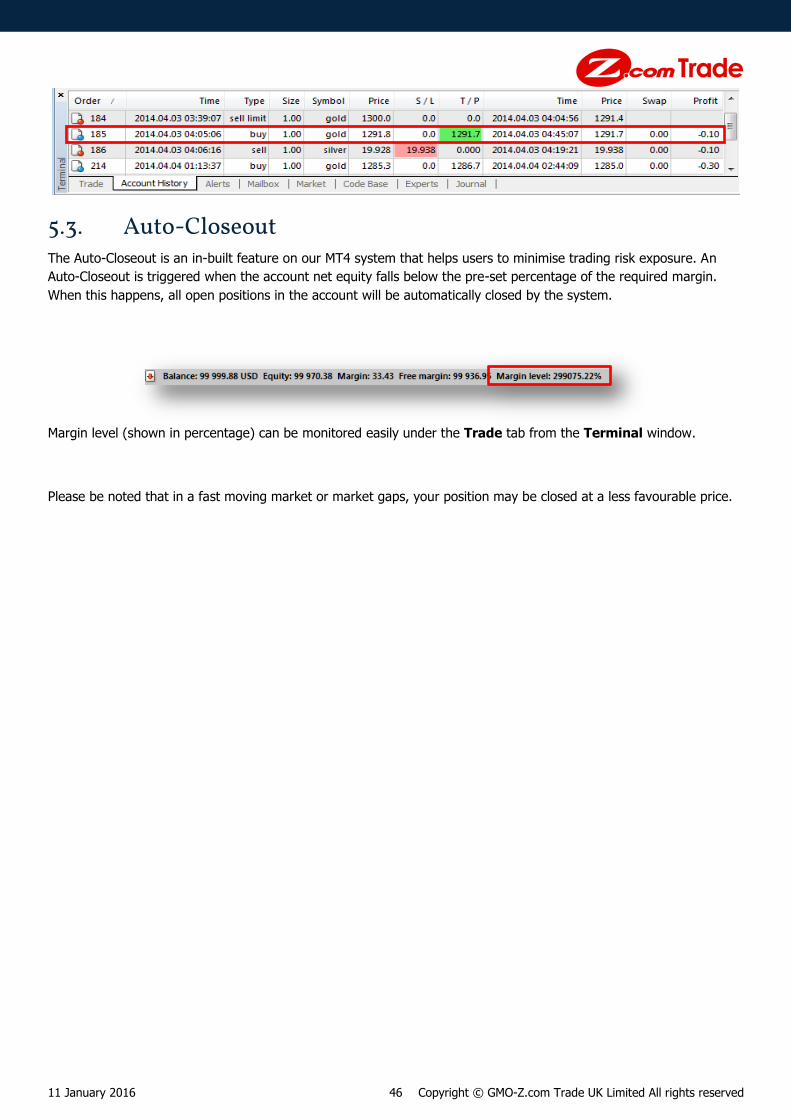
5.3. Auto-Closeout The Auto-Closeout is an in-built feature on our MT4 system that helps users to minimise trading risk exposure. An
Auto-Closeout is triggered when the account net equity falls below the pre-set percentage of the required margin.
When this happens, all open positions in the account will be automatically closed by the system.
Margin level (shown in percentage) can be monitored easily under the Trade tab from the Terminal window.
Please be noted that in a fast moving market or market gaps, your position may be closed at a less favourable price.

11 January 2016 47 Copyright © GMO-Z.com Trade UK Limited All rights reserved
6. One-Click Trading
One Click Trading is a very simple tool which allows users to open a position by placing Market Execution order with a
single click of a button on a chart.
*Please be noted that placing an order in the opposite direction to the existing position will not result in closing of the
existing position, instead the ‘Hedging’ will be enabled where the terminal will have two positions with opposite
directions to each other.
6.1. Enabling One-Click Trading To open One-Click Trading tool, right-click on the chart of choice and select One-Click Trading as shown below:
Alternatively hit Alt + T on the keyboard or click on the white downward-pointing arrow at the top left of the chart:
As a result One Click Trading tool will appear like shown below:

11 January 2016 48 Copyright © GMO-Z.com Trade UK Limited All rights reserved
6.2. Opening Position Using One-Click Trading One of the features of One-Click Trading is the ease of trading as it literally takes one click to place an order for an
instrument.
The procedure for placing an order using One-Click Trading is:
1. Specify the lot size for the trade.
2. Select either ‘SELL’ or ‘BUY’.
Once the order is executed the open position will be displayed in the terminal window under the Trade tab.
11 January 2016 49 Copyright © GMO-Z.com Trade UK Limited All rights reserved
7. Charts
Chart Windows are where the charts for various instruments are shown. In most cases chart windows will be the main
component for the MT4 interface.
7.1. Open Chart Windows Instrument charts can be opened in various ways in MT4. There are two types of charts one being online (normal)
chart and the other one being offline chart. Normally when the chart is opened it receives constant price feed and
updated accordingly, however, in the case of offline chart there are no price feed received and updated on the chart,
and therefore the offline chart is useful for tasks which do not require constant price update such as analysis of
historical price.
7.1.1. New Chart
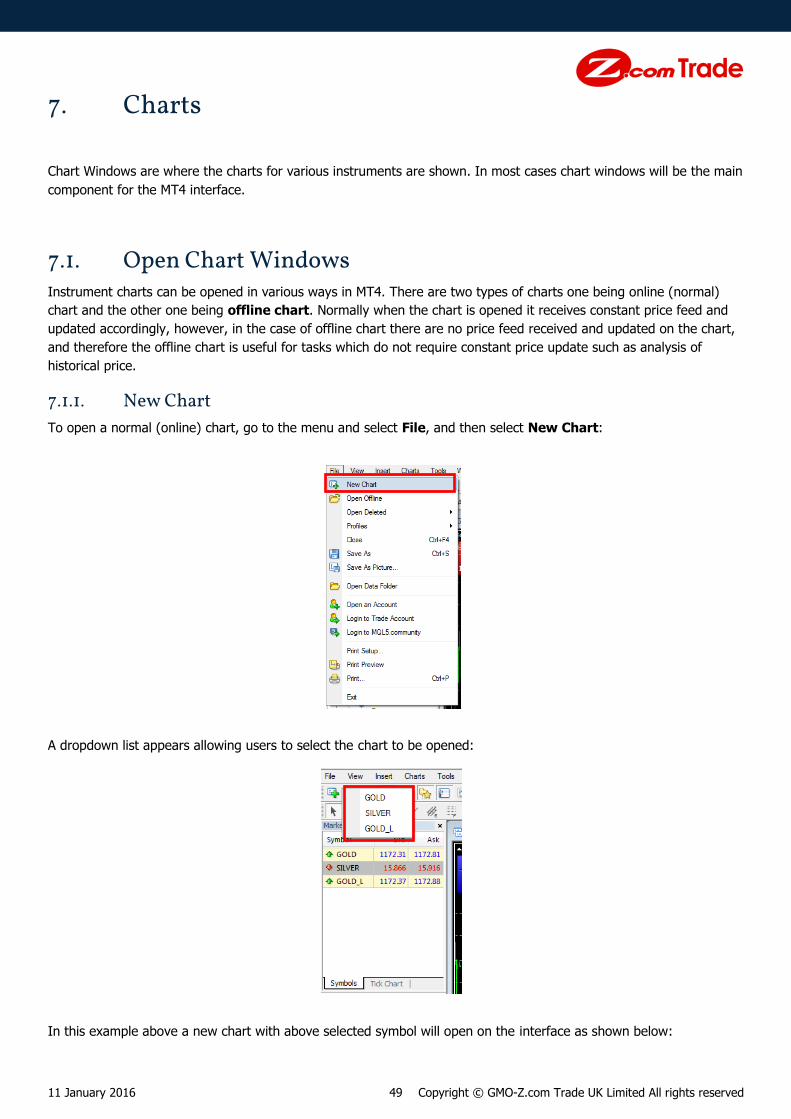
To open a normal (online) chart, go to the menu and select File, and then select New Chart:
A dropdown list appears allowing users to select the chart to be opened:
In this example above a new chart with above selected symbol will open on the interface as shown below:
11 January 2016 50 Copyright © GMO-Z.com Trade UK Limited All rights reserved
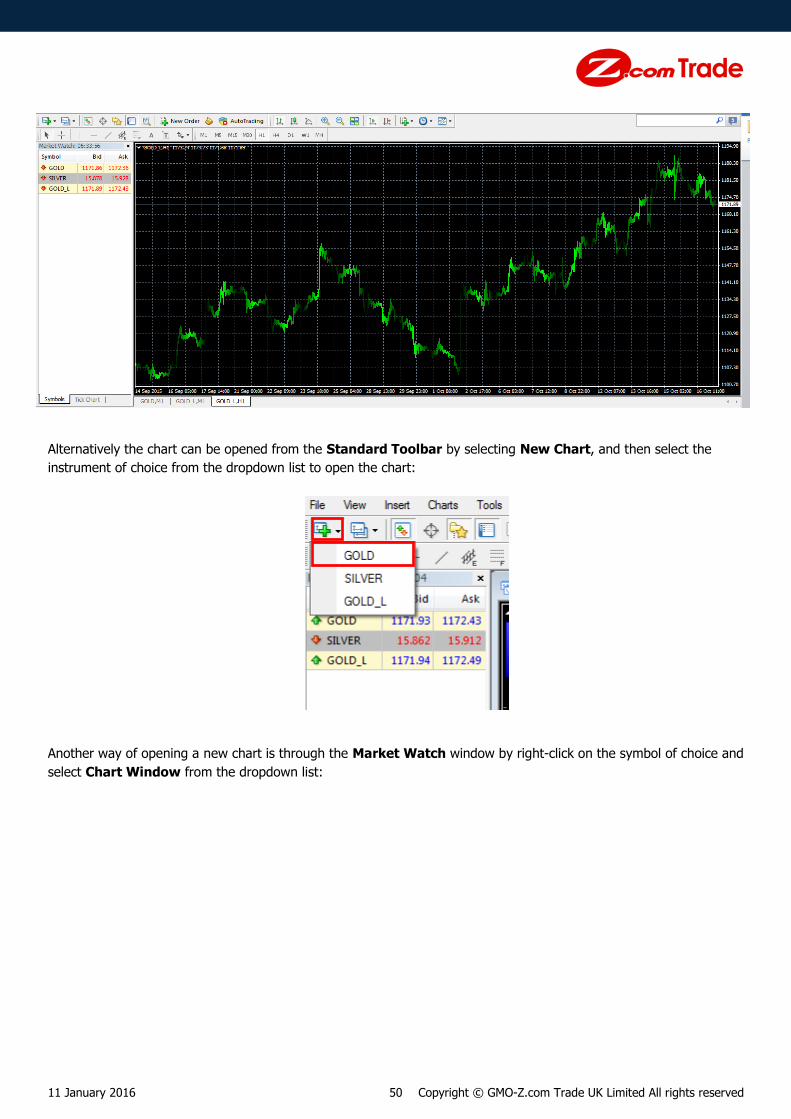
Alternatively the chart can be opened from the Standard Toolbar by selecting New Chart, and then select the
instrument of choice from the dropdown list to open the chart:
Another way of opening a new chart is through the Market Watch window by right-click on the symbol of choice and
select Chart Window from the dropdown list:

11 January 2016 51 Copyright © GMO-Z.com Trade UK Limited All rights reserved
7.1.2. Offline Chart
As for opening an offline chart, there is only one way of doing so which is through the menu by selecting File, and
then select Open Offline:

11 January 2016 52 Copyright © GMO-Z.com Trade UK Limited All rights reserved
Select an instrument of choice and select Open to open its chart offline.
7.1.3. Rearranging Multiple Chart Windows
Occasionally there may be some situations where multiple windows need to be opened at given one time, many users
trade on multiple markets and prefer to have the pictures of those markets open and visible to them in a single view.
In order to respond to such demand MT4 has a functionality to arrange multiple charts on its interface.
In order to have multiple charts opened, firstly open new charts either online or offline according to the instructions
from the previous topic. To see which instrument charts are open refer to the Charts Bar at the bottom of the chart
as shown below:
The highlighted chart tab on the very left of the tabs shown above is the active chart which means whatever action
taken without selecting a specific chart will automatically apply to this chart.
It may be that all these charts are open in a single window all together, however, in many cases only a single chart
may be displayed and a user has to flick through the tabs above to view each different chart. In order to arrange
these charts so to display them all together in a single view, go to the menu and select Windows, and from the
dropdown menu choose an appropriate window type and select:
In this example the window type of Tile Windows has been selected which rearranged the chart windows as shown
below:
11 January 2016 53 Copyright © GMO-Z.com Trade UK Limited All rights reserved
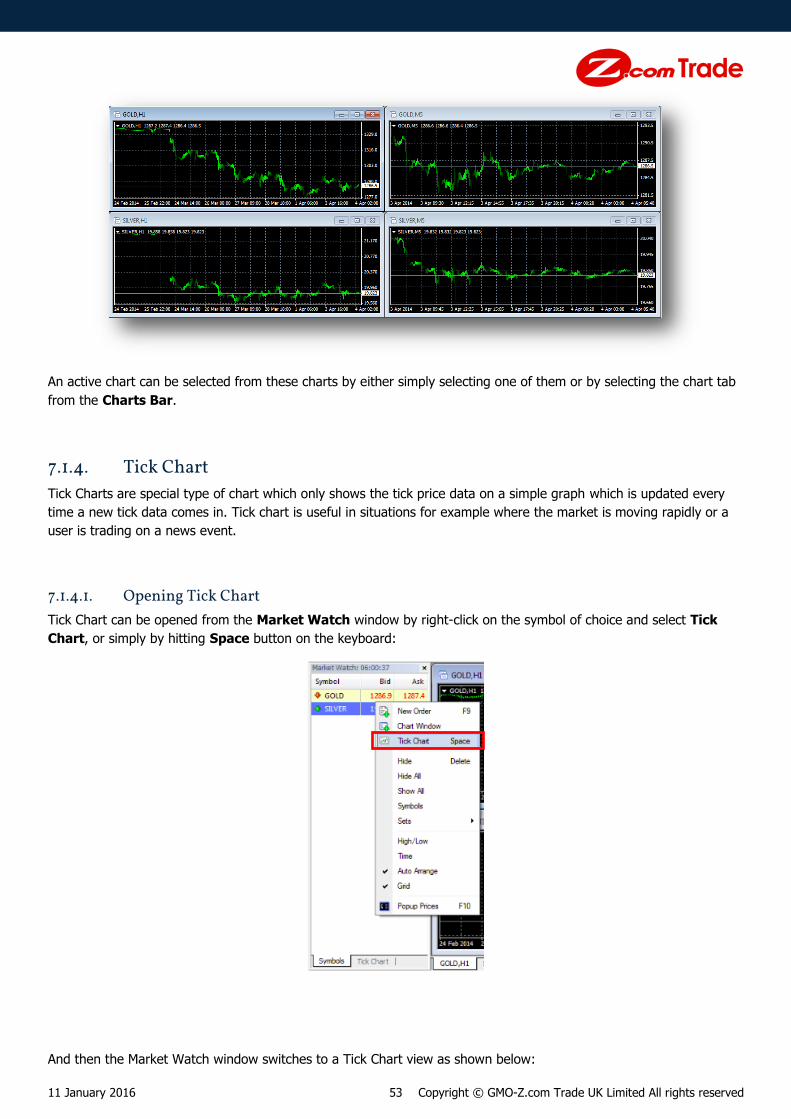
An active chart can be selected from these charts by either simply selecting one of them or by selecting the chart tab
from the Charts Bar.
7.1.4. Tick Chart
Tick Charts are special type of chart which only shows the tick price data on a simple graph which is updated every
time a new tick data comes in. Tick chart is useful in situations for example where the market is moving rapidly or a
user is trading on a news event.
7.1.4.1. Opening Tick Chart
Tick Chart can be opened from the Market Watch window by right-click on the symbol of choice and select Tick
Chart, or simply by hitting Space button on the keyboard:
And then the Market Watch window switches to a Tick Chart view as shown below:
11 January 2016 54 Copyright © GMO-Z.com Trade UK Limited All rights reserved
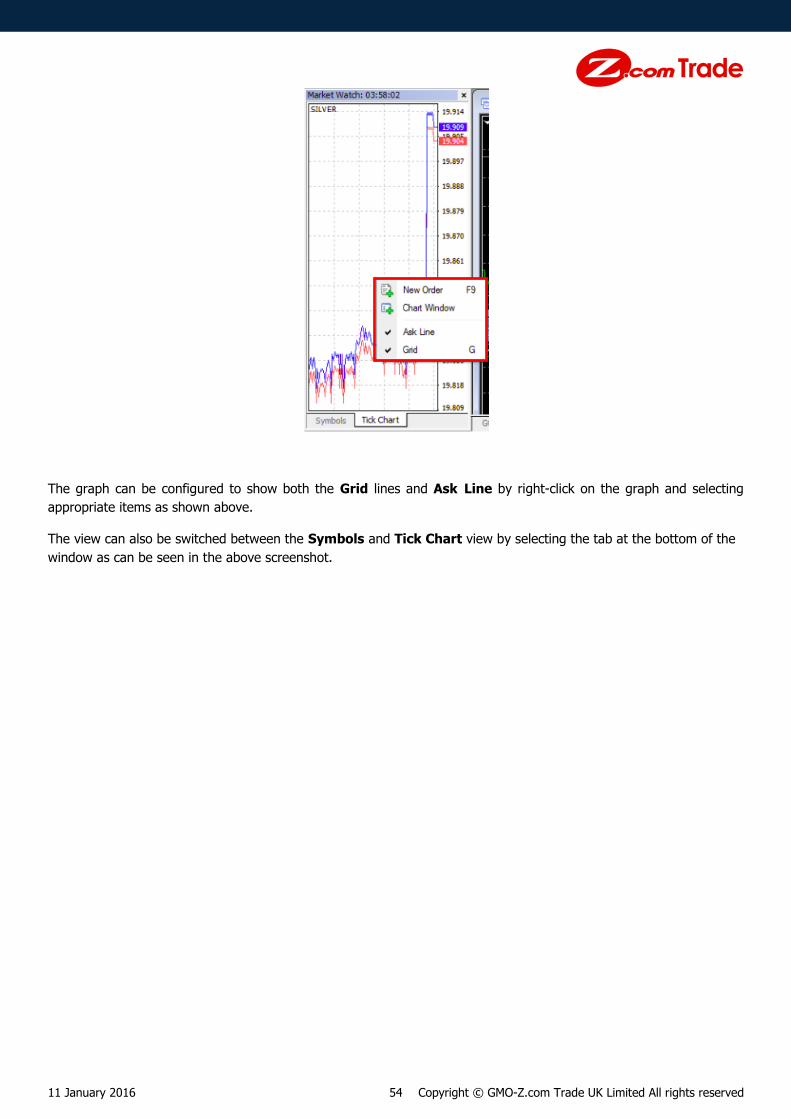
The graph can be configured to show both the Grid lines and Ask Line by right-click on the graph and selecting
appropriate items as shown above.
The view can also be switched between the Symbols and Tick Chart view by selecting the tab at the bottom of the
window as can be seen in the above screenshot.
11 January 2016 55 Copyright © GMO-Z.com Trade UK Limited All rights reserved
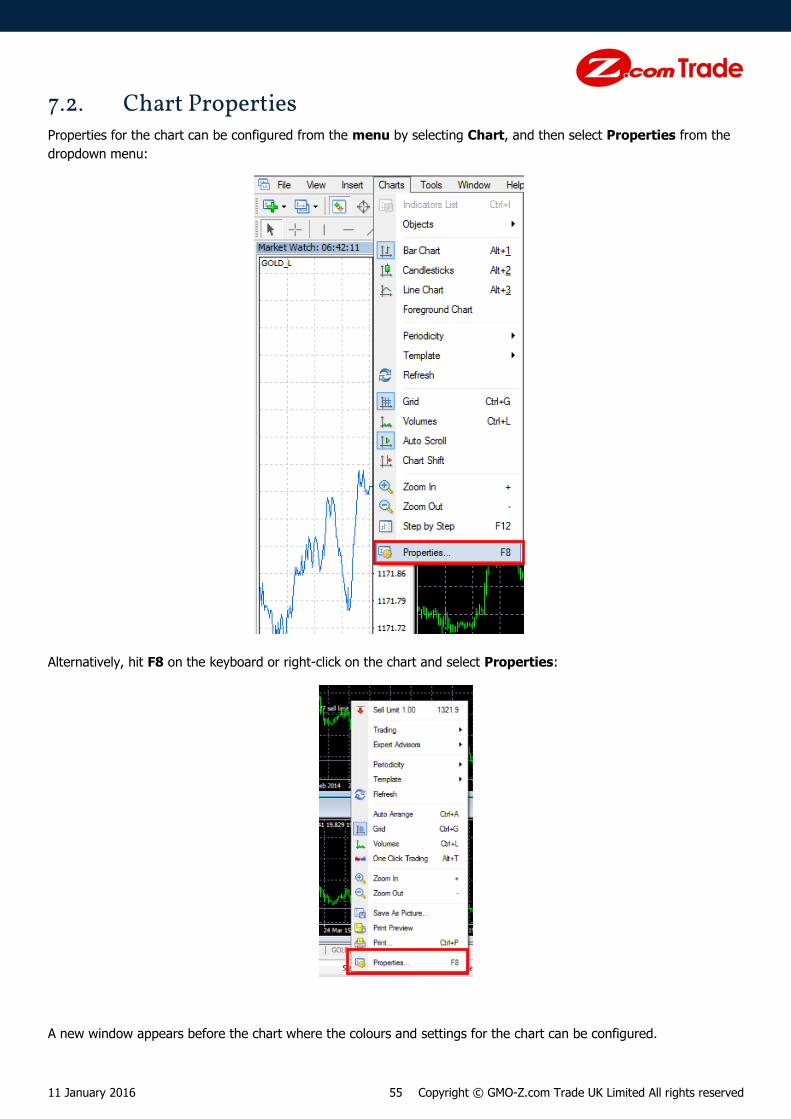
7.2. Chart Properties Properties for the chart can be configured from the menu by selecting Chart, and then select Properties from the
dropdown menu:
Alternatively, hit F8 on the keyboard or right-click on the chart and select Properties:
A new window appears before the chart where the colours and settings for the chart can be configured.
11 January 2016 56 Copyright © GMO-Z.com Trade UK Limited All rights reserved
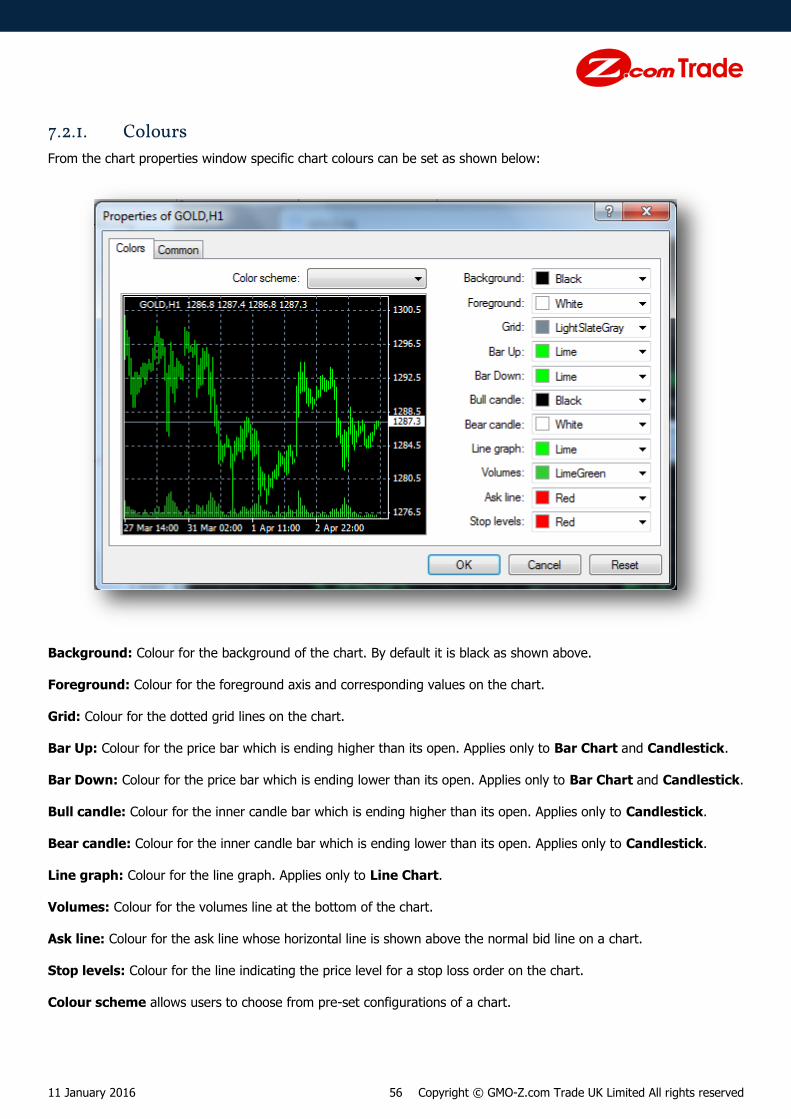
7.2.1. Colours
From the chart properties window specific chart colours can be set as shown below:
Background: Colour for the background of the chart. By default it is black as shown above.
Foreground: Colour for the foreground axis and corresponding values on the chart.
Grid: Colour for the dotted grid lines on the chart.
Bar Up: Colour for the price bar which is ending higher than its open. Applies only to Bar Chart and Candlestick.
Bar Down: Colour for the price bar which is ending lower than its open. Applies only to Bar Chart and Candlestick.
Bull candle: Colour for the inner candle bar which is ending higher than its open. Applies only to Candlestick.
Bear candle: Colour for the inner candle bar which is ending lower than its open. Applies only to Candlestick.
Line graph: Colour for the line graph. Applies only to Line Chart.
Volumes: Colour for the volumes line at the bottom of the chart.
Ask line: Colour for the ask line whose horizontal line is shown above the normal bid line on a chart.
Stop levels: Colour for the line indicating the price level for a stop loss order on the chart.
Colour scheme allows users to choose from pre-set configurations of a chart.

11 January 2016 57 Copyright © GMO-Z.com Trade UK Limited All rights reserved
7.2.2. Settings
The Common tab menu of the chart properties allows users to configure other general settings for the chart:
Offline chart: Opens the chart in offline mode.
Chart on foreground: Enables the chart to appear before all others such as indicators.
Chart shift: Shifts the chart so that the latest bar would be positioned at the chart shift mark on the chart.
Chart autoscroll: Allows the chart to automatically shift to the latest bar whenever a new tick data is received.
Scale fix One to One: fix the chart scale as "one to one" (the size of one pip of the vertical axis in pixels is equal to
the distance between the bars axes in pixels). The Scale fix option will be automatically enabled.
Scale fix: Fixes the current vertical chart scale.
Bar chart: Switches the chart to bar chart.
Candlesticks: Switches the chart to candlesticks.
Line chart: Switches the chart to line chart.
Show OHLC: The latest Open, High, Low and Close price will appear at the top left corner of the chart.
Show Ask line: Ask line which is a horizontal line above the normal (bid) price level line will appear in the chart.
Show period separators: Shows dotted vertical lines separating certain time period for example daily for
timeframes smaller than H4.
Show grid: Enables the dotted grid lines to appear on the chart.
Show volumes: Enables the volume histogram to appear at the bottom of the chart for each bar.
11 January 2016 58 Copyright © GMO-Z.com Trade UK Limited All rights reserved
Show object descriptions: Enables the object descriptions to appear on the chart.
7.3. Chart Controls
7.3.1. Chart Types
Chart on MT4 can be customised to different types according to the needs of a user. Chart types supported by MT4
are Bar Chart, Candlesticks and Line Chart. Line chart is the simplest of all showing only a single line of price
data, whereas both the bar chart and the candlesticks show Open, High, Low and Close prices.
Open: Price at the beginning of the current chart bar.
High: The highest price of the current chart bar.
Low: The lowest price of the current chart bar.
Close: Price at the end of the current chart bar.
The chart type can be configured at Charts Toolbar by selecting appropriate options:
From the left: Bar Chart, Candlestick and Line Chart.
In this above case the line chart is shown as being applied to the active chart.
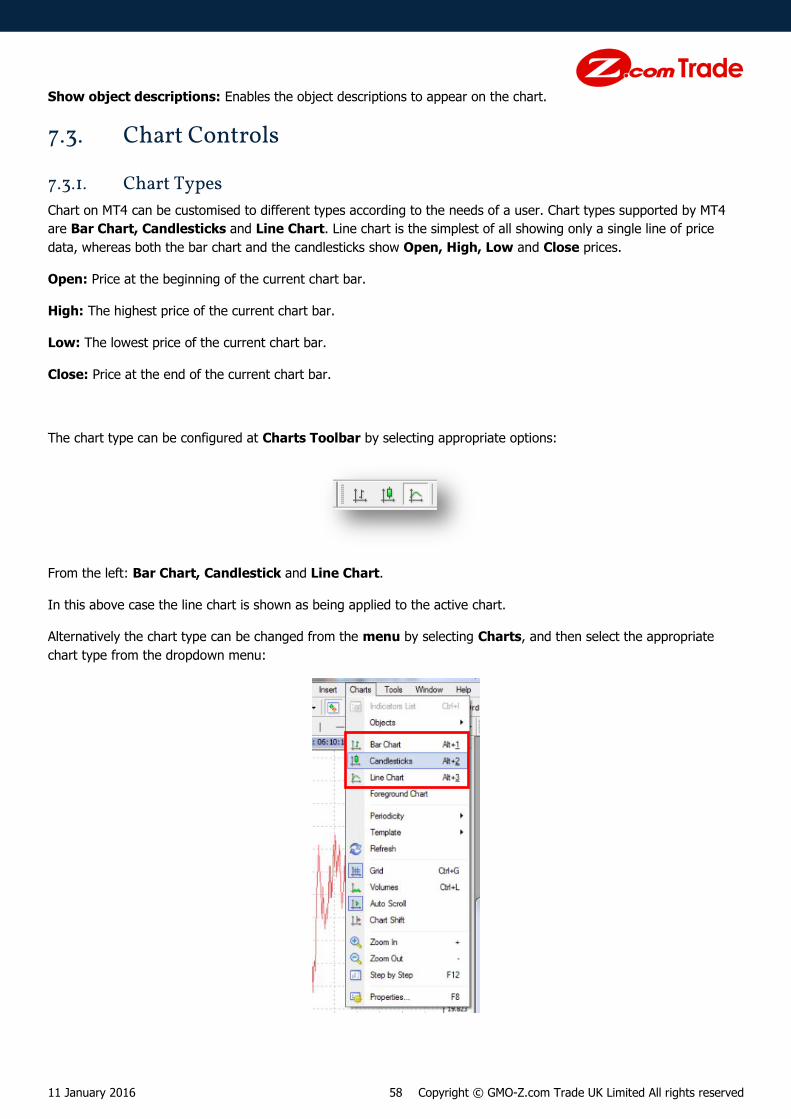
Alternatively the chart type can be changed from the menu by selecting Charts, and then select the appropriate
chart type from the dropdown menu:

11 January 2016 59 Copyright © GMO-Z.com Trade UK Limited All rights reserved
7.3.1.1. Bar Chart
A typical bar chart would look like the below:
The price level indicated to the left of the bar: Open Price
The price level indicated to the right of the bar: Close Price
The price level at the top of the bar: Highest Price
The price level at the bottom of the bar: Lowest Price
11 January 2016 60 Copyright © GMO-Z.com Trade UK Limited All rights reserved
7.3.1.2. Candlesticks
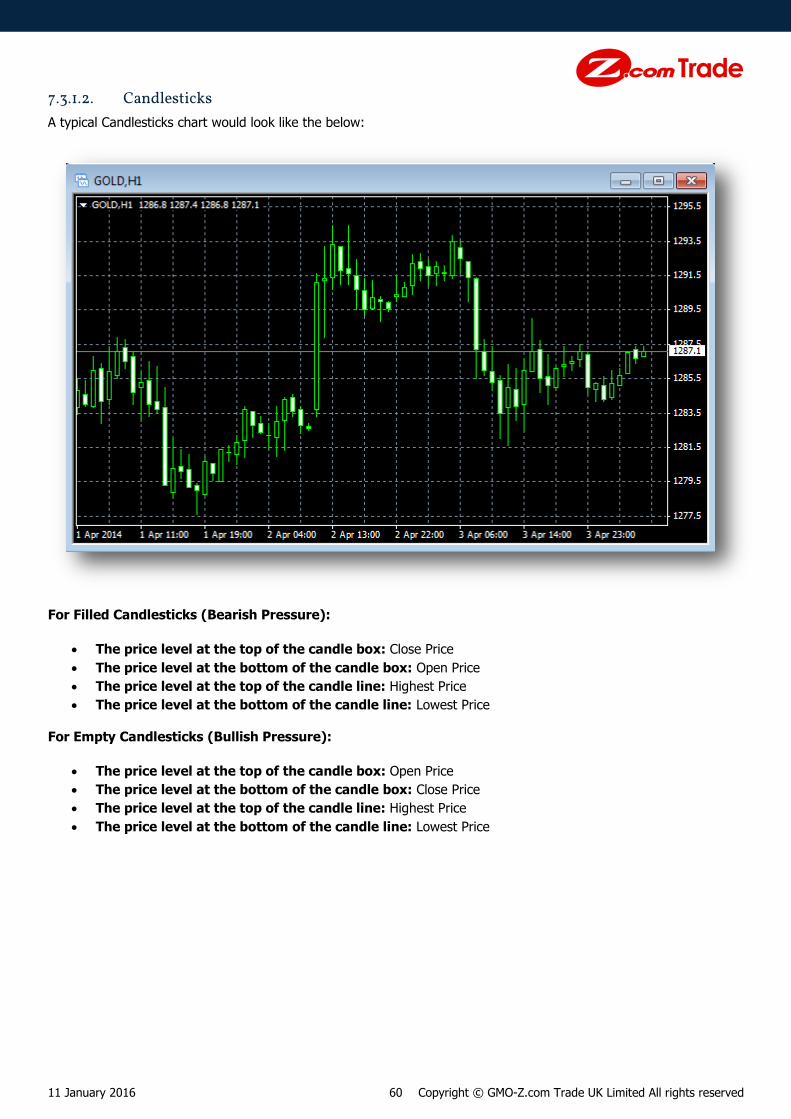
A typical Candlesticks chart would look like the below:
For Filled Candlesticks (Bearish Pressure):
The price level at the top of the candle box: Close Price
The price level at the bottom of the candle box: Open Price
The price level at the top of the candle line: Highest Price
The price level at the bottom of the candle line: Lowest Price
For Empty Candlesticks (Bullish Pressure):
The price level at the top of the candle box: Open Price
The price level at the bottom of the candle box: Close Price
The price level at the top of the candle line: Highest Price
The price level at the bottom of the candle line: Lowest Price

11 January 2016 61 Copyright © GMO-Z.com Trade UK Limited All rights reserved
7.3.1.3. Line Chart
A typical Line chart would look like the below:
Where the each point of the line represents the bid price at given time.
7.3.2. Timeframes
The markets often show different behaviour depending on the timeframe in which they are looked at, and in many
cases using multiple timeframes helps trades make more informed decisions than looking at a single timeframe data
alone. For this reason MT4 allows its users to switch between the timeframes of a given instrument.
The easiest and simplest way of changing the timeframe for an active chart is from the Periodicity Toolbar by
selecting the timeframe accordingly:
The screenshot above shows the current timeframe is set at ‘M30’, that is 30 minutes chart (i.e. each bar contains 30
minutes of information).
Alternatively the timeframe can be changed from the menu by selecting Charts, and then select Periodicity from
the dropdown menu and select the timeframe from the sub-dropdown menu accordingly:
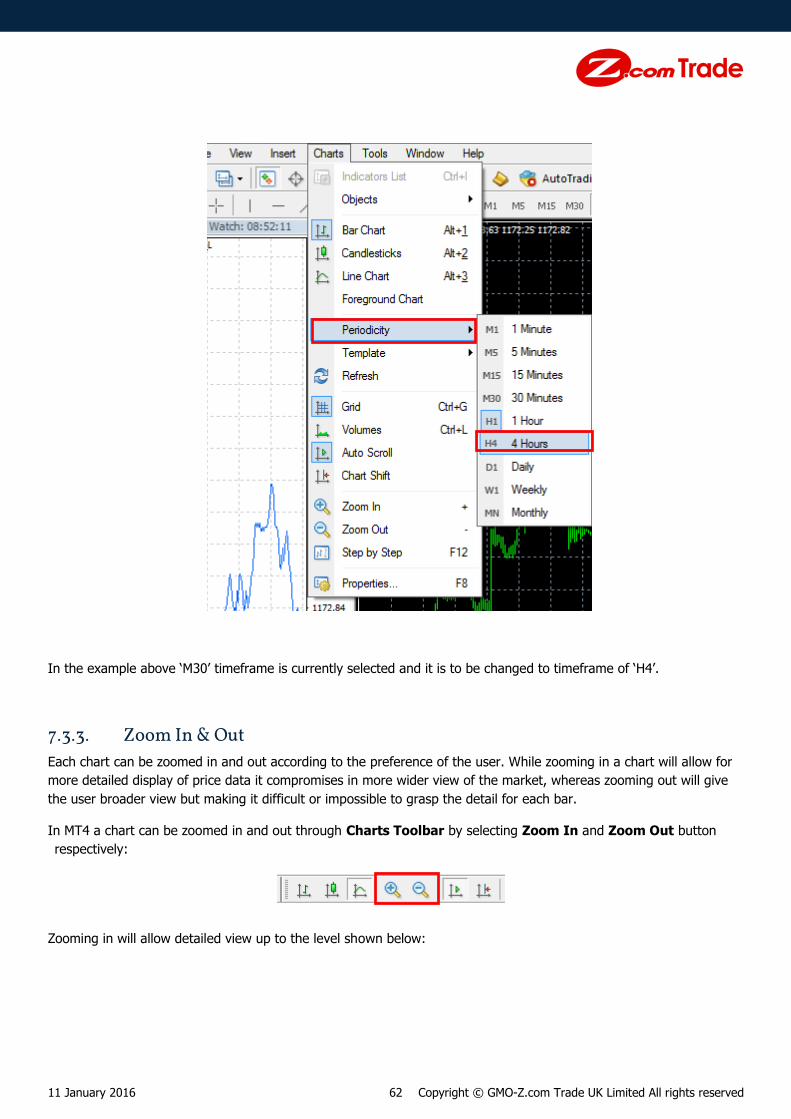
11 January 2016 62 Copyright © GMO-Z.com Trade UK Limited All rights reserved
In the example above ‘M30’ timeframe is currently selected and it is to be changed to timeframe of ‘H4’.
7.3.3. Zoom In & Out
Each chart can be zoomed in and out according to the preference of the user. While zooming in a chart will allow for
more detailed display of price data it compromises in more wider view of the market, whereas zooming out will give
the user broader view but making it difficult or impossible to grasp the detail for each bar.
In MT4 a chart can be zoomed in and out through Charts Toolbar by selecting Zoom In and Zoom Out button
respectively:
Zooming in will allow detailed view up to the level shown below:

11 January 2016 63 Copyright © GMO-Z.com Trade UK Limited All rights reserved
Whereas zooming out will allow broader view of the market up to the level shown below:

11 January 2016 64 Copyright © GMO-Z.com Trade UK Limited All rights reserved
Alternatively the chart can be zoomed in and out from the menu by selecting Charts, and select either Zoom In or
Zoom Out from the dropdown menu:
7.3.4. Auto Scroll
Chart can be configured to automatically scroll to the latest bar whenever a new tick data is received by the terminal.
This option should be disabled when studying historical chart patterns which are outside the visible scope from the
latest chart position.
Auto Scroll option can be enabled/disabled simply from the Chart Toolbar by selecting Auto Scroll button which is
the button enclosed by the red box below:
Alternatively Auto Scroll can be set up from the chart properties window as described in the previous section.

11 January 2016 65 Copyright © GMO-Z.com Trade UK Limited All rights reserved
7.3.5. Chart Shift
Chart can be configured to set minimum empty margin to the right of the latest position so to allow for extrapolation
of technical indicator lines or chart pattern lines. This is a useful tool for traders since planning ahead in the future is
one of the critical elements of trading.
The minimum margin can be set by shifting the grey downward pointing arrow at the top of the chart horizontally.
The area to the right of the arrow is the minimum empty margin.
Chart Shift option can be enabled/disabled simply from the Chart Toolbar by selecting Auto Scroll button which the
button is enclosed by the red box below:
Alternatively Chart Shift can be set up from the chart properties window as described in the previous section.
7.3.6. Cursor - Crosshair
In MT4 a user is able to navigate through the chart by means of either Cursor or Crosshair. Cursor allows the user
to have familiar arrow style icon at where it is pointed at, whereas Crosshair will give both vertical and horizontal lines
to where it is pointed at.
7.3.6.1. Cursor
Cursor is the usual arrow icon which we are used to see on PCs. In MT4 this cursor can be placed on any locations on
the chart window as shown below:
For example suppose that a cursor is placed at the position shown by the arrow in the screenshot above, within the
Status Bar there will be information on the market data shown in the red box. This market data displayed is relevant

11 January 2016 66 Copyright © GMO-Z.com Trade UK Limited All rights reserved
to the horizontal position of the cursor placed on the chart and its vertical position does not have any effect on the
displayed information as long as the horizontal position remains the same.
7.3.6.2. Crosshair
Crosshair is a special type of pointer on a chart for MT4. It is unique in a sense that it has vertical and horizontal lines
crossing at the pointer and it provides the user with exact price and time figures on the position pointed by it.
Typically a crosshair pointer will look like as shown below:
There are figures displayed by both vertical and horizontal axis for Price and Time respectively for the position of the
chart pointed by the crosshair pointer. Notice that as opposed to the cursor these figures are independent of the
market data at the horizontal position of the pointer.

11 January 2016 67 Copyright © GMO-Z.com Trade UK Limited All rights reserved
7.4. Chart Options The Charts options allow users to set parameters on the charts:
7.4.1. Showing Trade Levels on Charts
Trade Levels such as the level at which the Buy/Sell orders were executed, Buy/Sell – Limit/Stop orders are placed,
and Stop Loss or Take Profit levels can be selected to appear directly on charts by selecting Show trade levels.
7.4.2. Preventing Unintended Control of Order Levels on Charts
Since the Trade Levels are visible on the chart and they can be moved along the price level just by simply dragging
them using a mouse, it would be useful to have a safety system which prevents those Trade Levels from being
mistakenly manipulated. Such system exists in MT4 and it can be set by selecting Use ’Alt’ key to drag trade
levels which allows those Trade Levels to be changed only if the Alt key on the keyboard is pressed while dragging
them.

11 January 2016 68 Copyright © GMO-Z.com Trade UK Limited All rights reserved
7.5. Objects Options The Objects options allow users to set some settings over objects which can be applied to charts:
Show properties after creation:
Enables users to set up properties for the objects applied to a chart by displaying properties window upon application
to the chart.
Select object after creation:
Automatically selects the object upon application so that the user can move it around without having to select it
manually.
Select object by single mouse click:
Enables users to select the objects by a single-click instead of double-click.
Magnet Sensitivity:
A function which sets the checkpoints of objects automatically to difference price bars if it is within the pixel value set
for this parameter. To disable this function set the value as 0.

11 January 2016 69 Copyright © GMO-Z.com Trade UK Limited All rights reserved
7.6. Technical Indicators Technical Indicators are the tools which help traders make informed decisions on their trading. MT4 platform has by
default many of the popular technical indicators integrated and can be applied on to a chart with quick actions.
7.6.1. Applying Technical Indicators
One thing to be noted about applying Technical Indicators to a chart is that where they would be applied to. Some
indicators such as Moving Averages and Bollinger Bands can be applied directly onto the main chart whereas others
such as MACD and RSI can only be applied to a separate window below the main chart window.
The technical indicators can be applied to a chart through Navigator Window where you have to expand the
Indicator sub-menu by clicking on the ‘plus’ sign next to it, and double-click on the indicator which you wish to apply
to the chart, or alternatively right-click and select Attach to a chart as shown below:
And then a new window appears before the chart where you can specify the settings and parameters for the indicator.
Finally, click OK to apply the indicator:
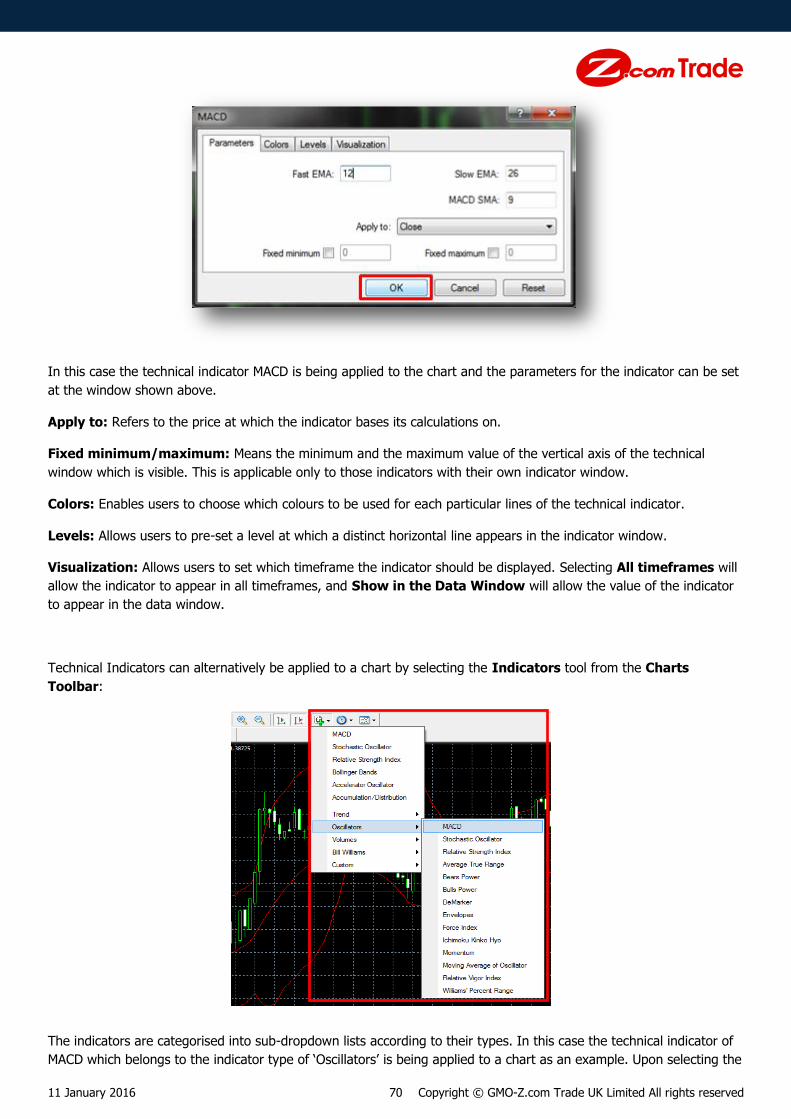
11 January 2016 70 Copyright © GMO-Z.com Trade UK Limited All rights reserved
In this case the technical indicator MACD is being applied to the chart and the parameters for the indicator can be set
at the window shown above.
Apply to: Refers to the price at which the indicator bases its calculations on.
Fixed minimum/maximum: Means the minimum and the maximum value of the vertical axis of the technical
window which is visible. This is applicable only to those indicators with their own indicator window.
Colors: Enables users to choose which colours to be used for each particular lines of the technical indicator.
Levels: Allows users to pre-set a level at which a distinct horizontal line appears in the indicator window.
Visualization: Allows users to set which timeframe the indicator should be displayed. Selecting All timeframes will
allow the indicator to appear in all timeframes, and Show in the Data Window will allow the value of the indicator
to appear in the data window.
Technical Indicators can alternatively be applied to a chart by selecting the Indicators tool from the Charts
Toolbar:
The indicators are categorised into sub-dropdown lists according to their types. In this case the technical indicator of
MACD which belongs to the indicator type of ‘Oscillators’ is being applied to a chart as an example. Upon selecting the

11 January 2016 71 Copyright © GMO-Z.com Trade UK Limited All rights reserved
indicator from the list the new window as previously shown appears where a user can enter settings and parameters
for the indicator.
7.6.2. Changing Indicator Settings after the Initial Set-up
After applying a technical indicator you may change the settings or the parameters for the indicator by double-click on
the indicator lines on the chart or right-click over the indicator window:
A user may have to look for a particular spot on the indicator line where it can be ‘double-clicked’ and for some
indicators there are only limited positions on the line where this can be done. When the right-click menu appears as
shown above select the properties option and change the settings accordingly.
7.6.3. Deleting Indicators / Indicators Window
Technical Indicators can be deleted as necessary through simple steps. There are two ways in which the indicators
can be deleted from the chart window.
One is by deleting only the indicator from the window, meaning deleting only the selected indicator from the window
and leaving the rest unchanged on the window. This is for when there are multiple indicators set up in a single
window.
For example a window below shows both RSI and Volume within a single window:
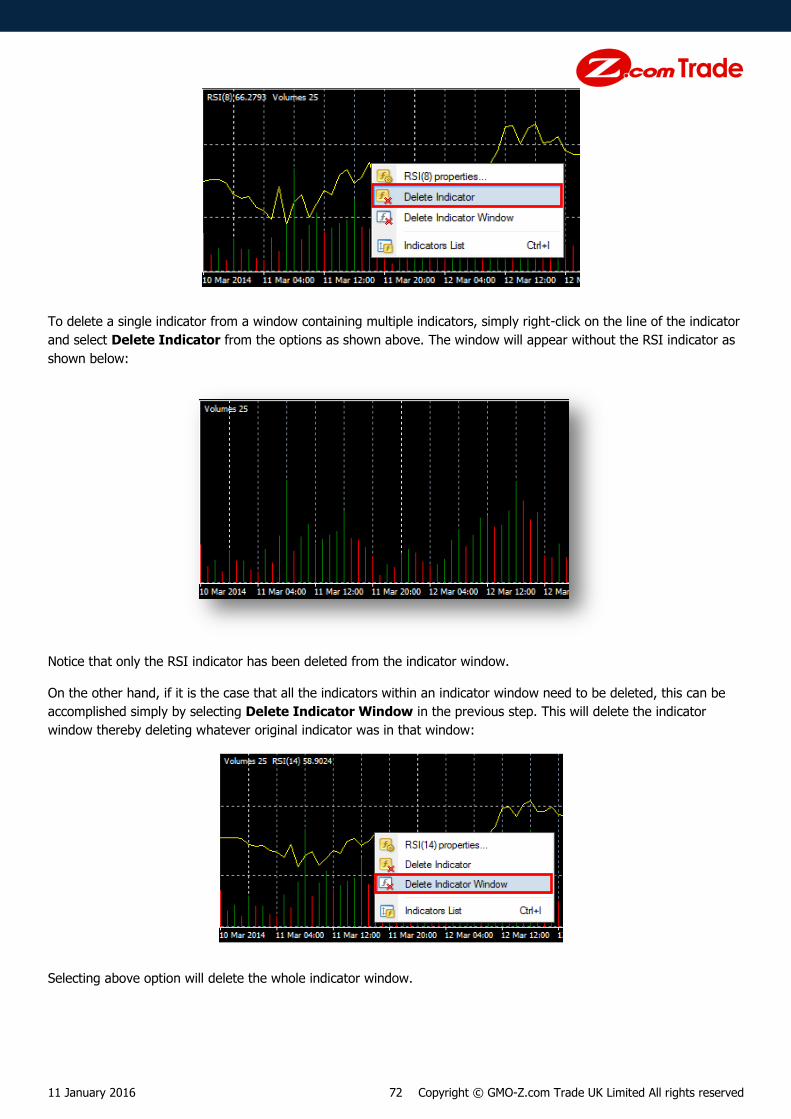
11 January 2016 72 Copyright © GMO-Z.com Trade UK Limited All rights reserved
To delete a single indicator from a window containing multiple indicators, simply right-click on the line of the indicator
and select Delete Indicator from the options as shown above. The window will appear without the RSI indicator as
shown below:
Notice that only the RSI indicator has been deleted from the indicator window.
On the other hand, if it is the case that all the indicators within an indicator window need to be deleted, this can be
accomplished simply by selecting Delete Indicator Window in the previous step. This will delete the indicator
window thereby deleting whatever original indicator was in that window:
Selecting above option will delete the whole indicator window.

11 January 2016 73 Copyright © GMO-Z.com Trade UK Limited All rights reserved
7.7. Line Studies Line Studies in MT4 refers to its functionality to place various items on a chart which help to analyse chart patterns.
The available items include those popular mainstream tools such as Trend lines, channels and Fibonacci’s.
There are two ways to apply such items onto a chart. A user can either find an appropriate tool from the Insert
menu, or simply find it from Line Studies Toolbar.
7.7.1. Line Studies from the Toolbar
MT4 has functionalities to assist a user to analyse chart patterns in Line Studies Toolbar as shown below:
From the left of the toolbar, the line types are:
Vertical Line: Draws a vertical line on a chart.
Horizontal Line: Draws a horizontal line on a chart. The line can still be seen even if the chart is scrolled.
Trendline: Draws a trendline which usually is slanted and attached to the chart prices.
Equidistant Channel: Draws a set of trendlines in parallel one at the top of the chart trend and the other at the
bottom of the chart trend.
Fibonacci Retracement: Draws a Fibonacci Retracement line on a chart.
Text: Writes a text on a chart.
Text Label: Inserts a text label on a chart.
Arrows: Inserts an object such as Thumbs Up/Down, Arrows Up/Down, Stop Sign, Check Sign, and
Left/Right Price Label.
The lines can be applied to a chart by first selecting a line type from the toolbar above, and then click on a location on
the chart where you would like the line to be inserted. The method in which these lines can be inserted to the chart
varies according to the line types. For example, while it is straight forward to pick where to place the vertical and
horizontal lines, the Equidistant Line have to be placed at the bottom left of the chart trend, then drag the line while
clicking the chart to the bottom right of the chart trend, and finally adjust the top line of the Equidistant Line by click
and drag.
As an example, the screen below shows the Fibonacci Retracement Line applied to a chart:
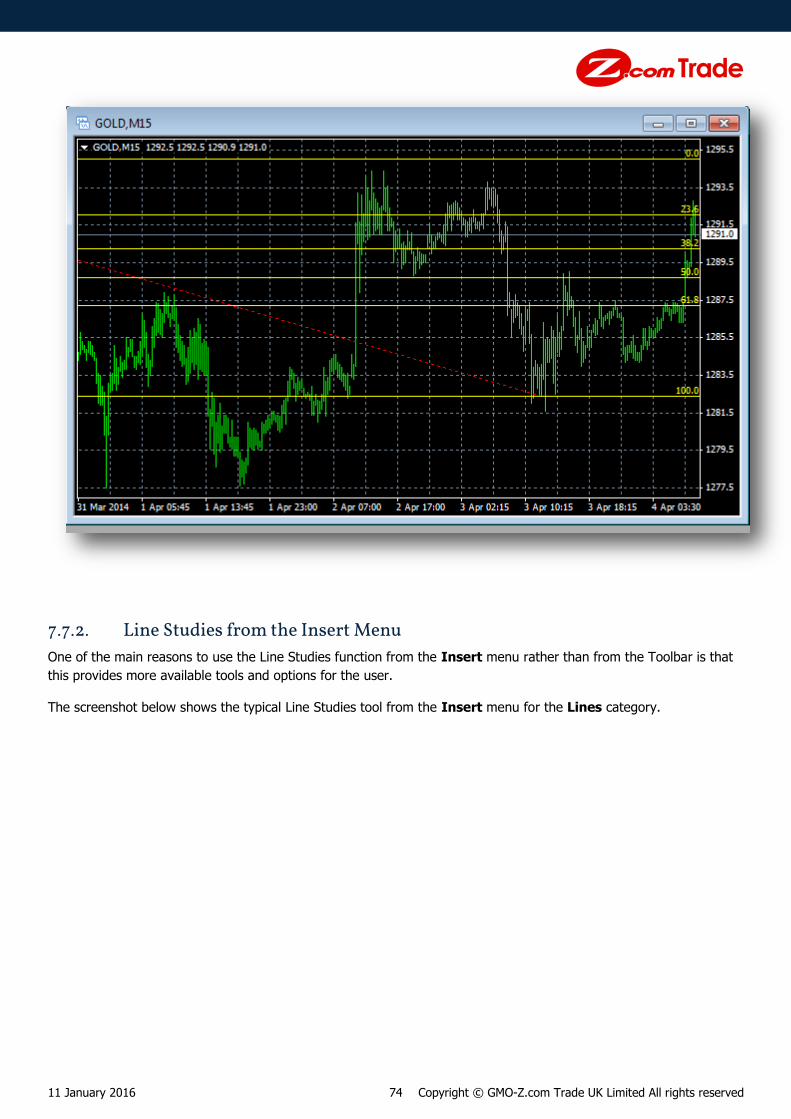
11 January 2016 74 Copyright © GMO-Z.com Trade UK Limited All rights reserved
7.7.2. Line Studies from the Insert Menu
One of the main reasons to use the Line Studies function from the Insert menu rather than from the Toolbar is that
this provides more available tools and options for the user.
The screenshot below shows the typical Line Studies tool from the Insert menu for the Lines category.

11 January 2016 75 Copyright © GMO-Z.com Trade UK Limited All rights reserved
The available tools are:
1. Lines
1.1. Vertical Line
1.2. Horizontal Line
1.3. Trendline
1.4. Trendline by Angle
2. Channels
2.1. Fibonacci
2.2. Linear Regression
2.3. Equidistant
2.4. Standard Deviation
3. Gann
3.1. Gann Line
3.2. Gann Fan
3.3. Gann Grid
4. Fibonacci
4.1. Retracement
4.2. Time Zones
4.3. Fan
4.4. Arcs
4.5. Expansion
5. Shapes
5.1. Rectangle
5.2. Triangle
5.3. Ellipse
6. Arrows
6.1. Thumbs Up
6.2. Thumbs Down
6.3. Arrow Up
6.4. Arrow Down
6.5. Stop Sign
6.6. Check Sign

11 January 2016 76 Copyright © GMO-Z.com Trade UK Limited All rights reserved
6.7. Left Price Label
6.8. Right Price Label
7. Andrew’s Pitchfork
8. Cycle Lines
9. Text
10. Text Label
Once the tool is selected from the Insert menu, it can be applied to a chart and modified the same way as those
which have been applied from the Line Studies Toolbar.
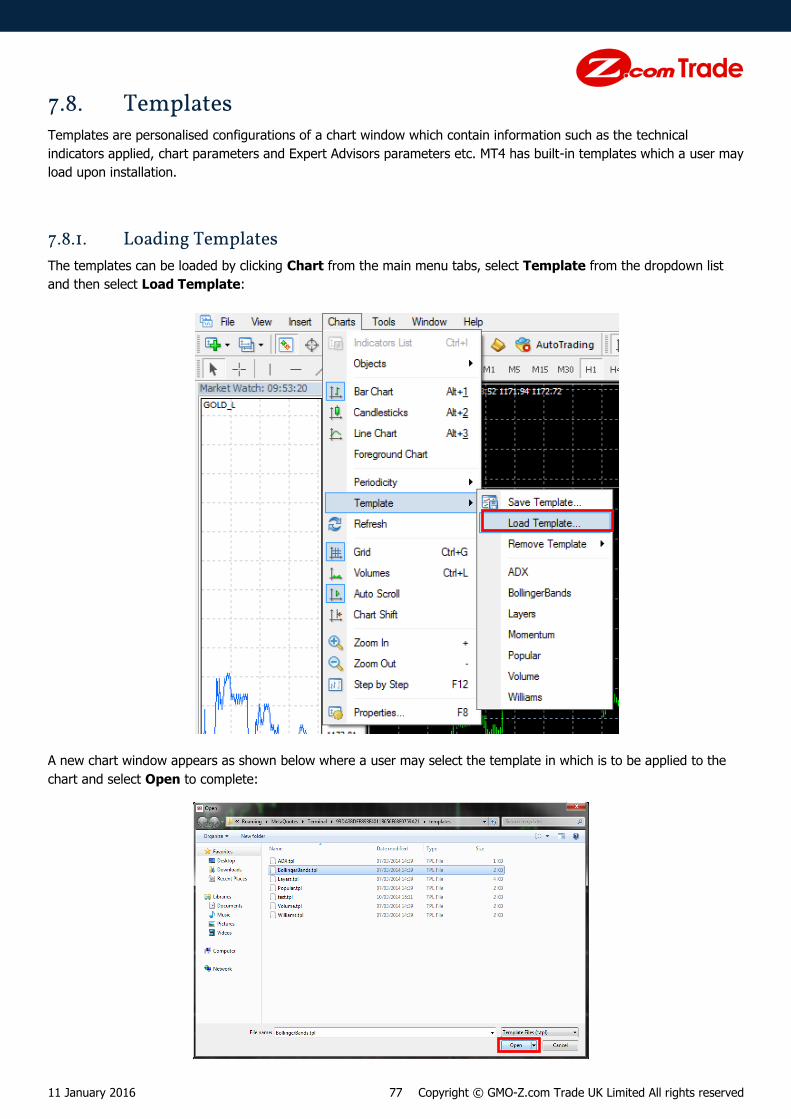
11 January 2016 77 Copyright © GMO-Z.com Trade UK Limited All rights reserved
7.8. Templates Templates are personalised configurations of a chart window which contain information such as the technical
indicators applied, chart parameters and Expert Advisors parameters etc. MT4 has built-in templates which a user may
load upon installation.
7.8.1. Loading Templates
The templates can be loaded by clicking Chart from the main menu tabs, select Template from the dropdown list
and then select Load Template:
A new chart window appears as shown below where a user may select the template in which is to be applied to the
chart and select Open to complete:

11 January 2016 78 Copyright © GMO-Z.com Trade UK Limited All rights reserved
The template should be applied to the chart upon completion. For example a default template named BollingerBands
selected in the previous step will look like the one shown below on the chart:
Alternatively templates can be applied to a chart with ease through Templates tool from the Charts Toolbar:
A user can remove any unwanted templates from this option, as well as quickly applying the templates by selecting
from the dropdown list.
Templates can only be applied to a chart through these methods in MT4. A user can apply the same template to the
other charts by manually loading the template upon opening a new chart.

11 January 2016 79 Copyright © GMO-Z.com Trade UK Limited All rights reserved
7.8.2. Saving Templates
Templates can be saved on MT4 for later uses or applications to different charts. The process is essentially the
reverse of loading the templates.
The templates can be saved by selecting Charts from the main menu tabs, select Template from the dropdown list,
and then select Save Template:
A new window appears as shown below before the chart where the user can enter the name for the template and
then select Save in order to save the template on MT4:
The template should be saved and become available to be loaded.
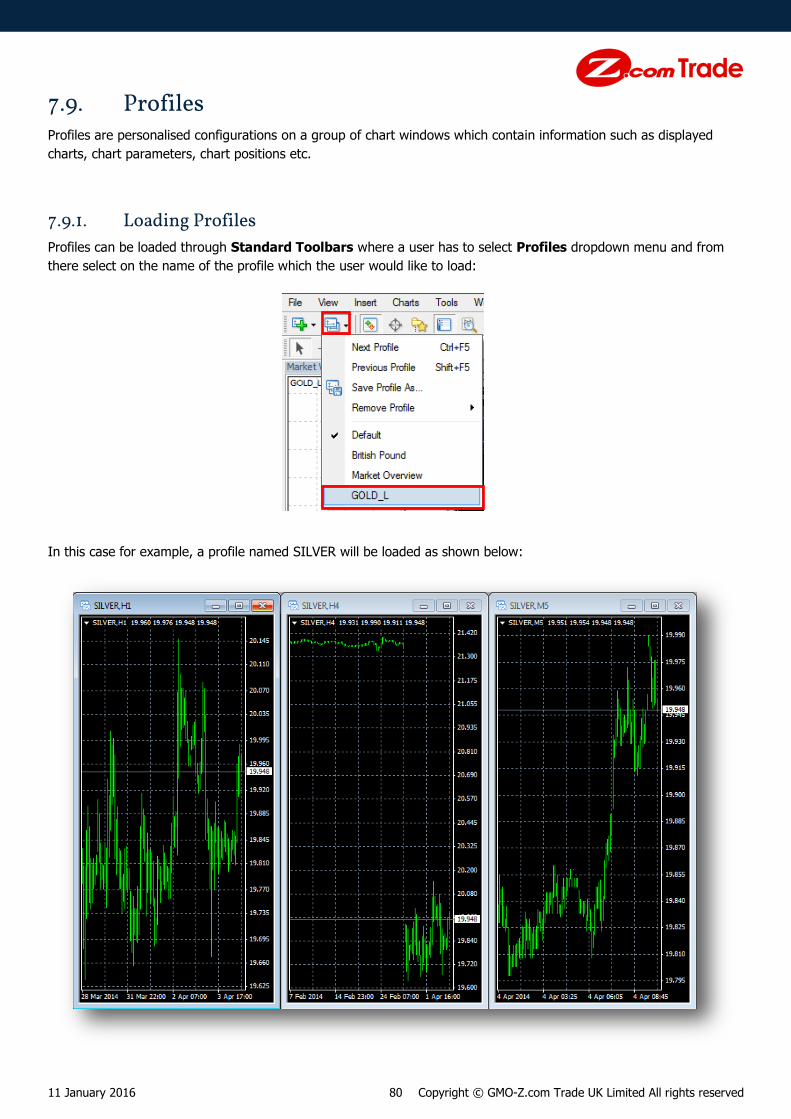
11 January 2016 80 Copyright © GMO-Z.com Trade UK Limited All rights reserved
7.9. Profiles Profiles are personalised configurations on a group of chart windows which contain information such as displayed
charts, chart parameters, chart positions etc.
7.9.1. Loading Profiles
Profiles can be loaded through Standard Toolbars where a user has to select Profiles dropdown menu and from
there select on the name of the profile which the user would like to load:
In this case for example, a profile named SILVER will be loaded as shown below:
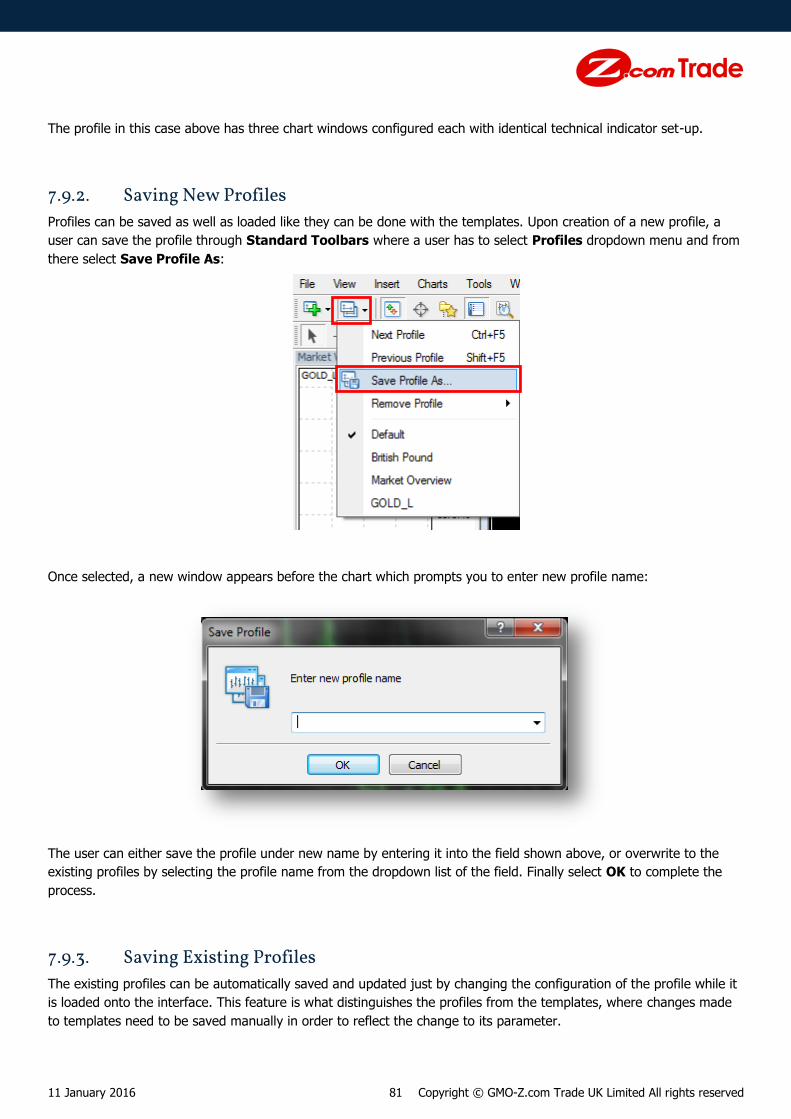
11 January 2016 81 Copyright © GMO-Z.com Trade UK Limited All rights reserved
The profile in this case above has three chart windows configured each with identical technical indicator set-up.
7.9.2. Saving New Profiles
Profiles can be saved as well as loaded like they can be done with the templates. Upon creation of a new profile, a
user can save the profile through Standard Toolbars where a user has to select Profiles dropdown menu and from
there select Save Profile As:
Once selected, a new window appears before the chart which prompts you to enter new profile name:
The user can either save the profile under new name by entering it into the field shown above, or overwrite to the
existing profiles by selecting the profile name from the dropdown list of the field. Finally select OK to complete the
process.
7.9.3. Saving Existing Profiles
The existing profiles can be automatically saved and updated just by changing the configuration of the profile while it
is loaded onto the interface. This feature is what distinguishes the profiles from the templates, where changes made
to templates need to be saved manually in order to reflect the change to its parameter.
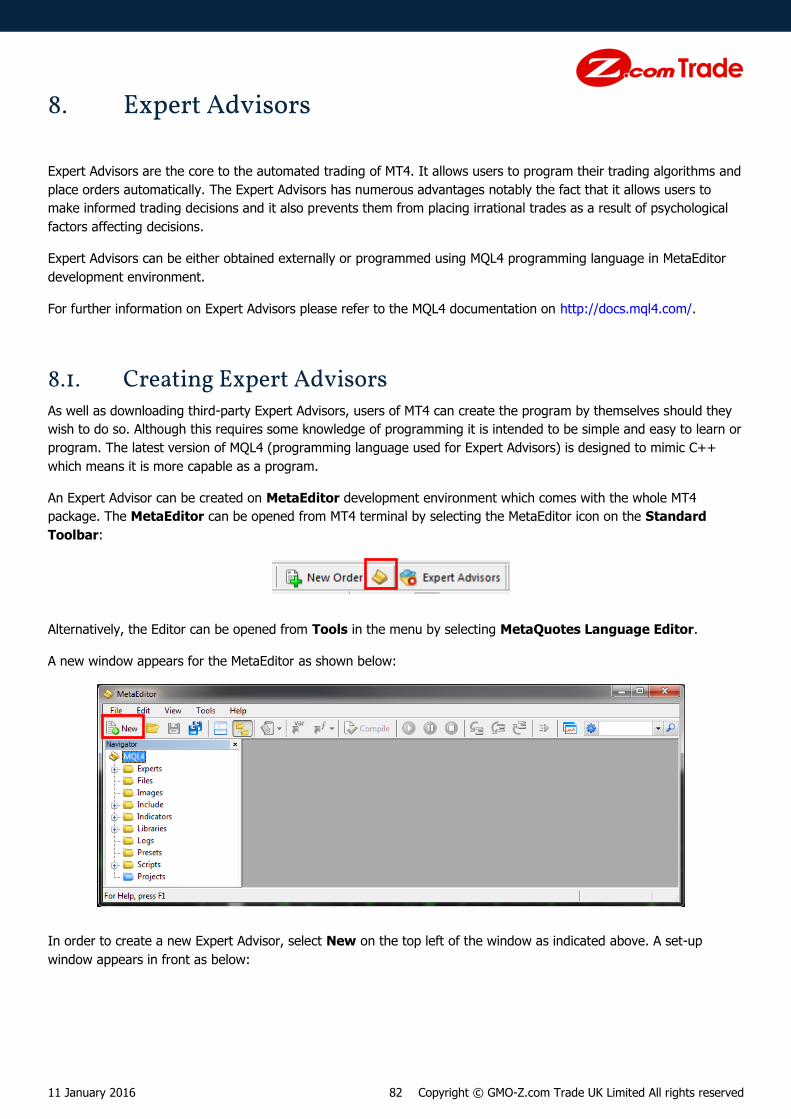
11 January 2016 82 Copyright © GMO-Z.com Trade UK Limited All rights reserved
8. Expert Advisors
Expert Advisors are the core to the automated trading of MT4. It allows users to program their trading algorithms and
place orders automatically. The Expert Advisors has numerous advantages notably the fact that it allows users to
make informed trading decisions and it also prevents them from placing irrational trades as a result of psychological
factors affecting decisions.
Expert Advisors can be either obtained externally or programmed using MQL4 programming language in MetaEditor
development environment.
For further information on Expert Advisors please refer to the MQL4 documentation on http://docs.mql4.com/.
8.1. Creating Expert Advisors As well as downloading third-party Expert Advisors, users of MT4 can create the program by themselves should they
wish to do so. Although this requires some knowledge of programming it is intended to be simple and easy to learn or
program. The latest version of MQL4 (programming language used for Expert Advisors) is designed to mimic C++
which means it is more capable as a program.
An Expert Advisor can be created on MetaEditor development environment which comes with the whole MT4
package. The MetaEditor can be opened from MT4 terminal by selecting the MetaEditor icon on the Standard
Toolbar:
Alternatively, the Editor can be opened from Tools in the menu by selecting MetaQuotes Language Editor.
A new window appears for the MetaEditor as shown below:
In order to create a new Expert Advisor, select New on the top left of the window as indicated above. A set-up
window appears in front as below:

11 January 2016 83 Copyright © GMO-Z.com Trade UK Limited All rights reserved
Make sure the item Expert Advisor (template) is selected. Select Next to proceed to the next step:
Name: Name for the Expert Advisor as it appears on MT4. Leave ‘Experts\’ to specify the folder in which the Expert
Advisor is stored in.
Author: Name of the author of this Expert Advisor.
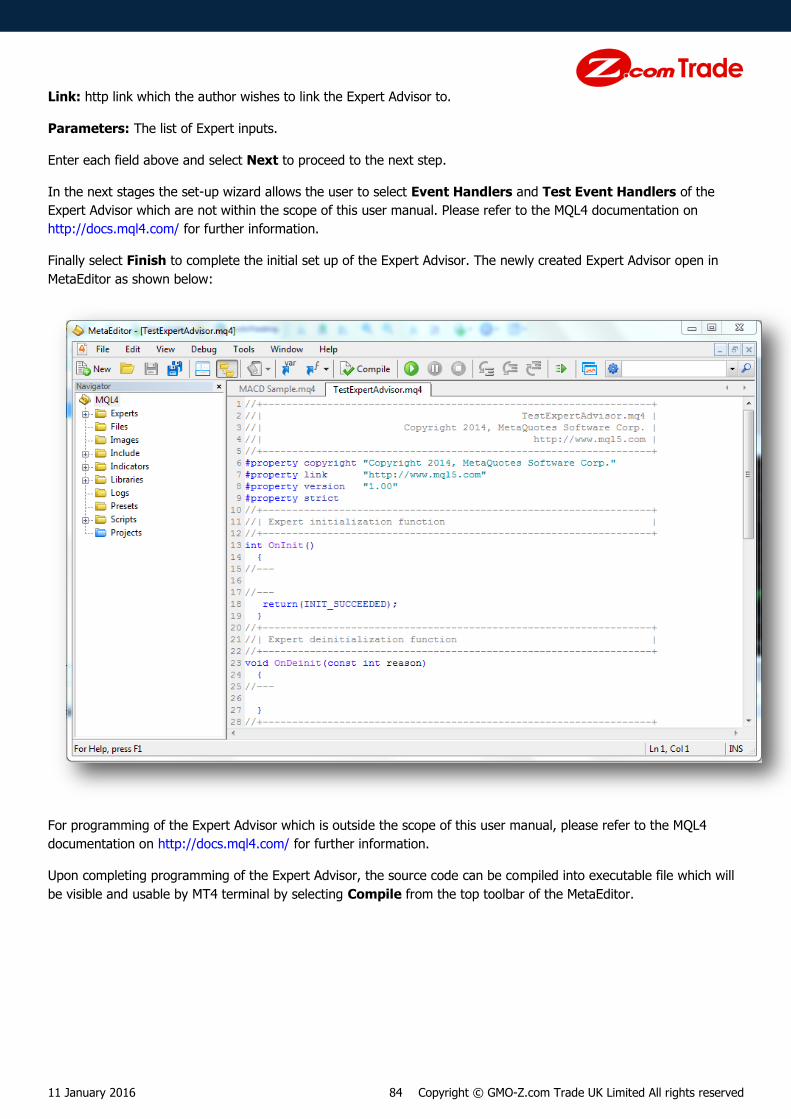
11 January 2016 84 Copyright © GMO-Z.com Trade UK Limited All rights reserved
Link: http link which the author wishes to link the Expert Advisor to.
Parameters: The list of Expert inputs.
Enter each field above and select Next to proceed to the next step.
In the next stages the set-up wizard allows the user to select Event Handlers and Test Event Handlers of the
Expert Advisor which are not within the scope of this user manual. Please refer to the MQL4 documentation on
http://docs.mql4.com/ for further information.
Finally select Finish to complete the initial set up of the Expert Advisor. The newly created Expert Advisor open in
MetaEditor as shown below:
For programming of the Expert Advisor which is outside the scope of this user manual, please refer to the MQL4
documentation on http://docs.mql4.com/ for further information.
Upon completing programming of the Expert Advisor, the source code can be compiled into executable file which will
be visible and usable by MT4 terminal by selecting Compile from the top toolbar of the MetaEditor.

11 January 2016 85 Copyright © GMO-Z.com Trade UK Limited All rights reserved
8.2. Modifying Expert Advisors The already existing Expert Advisors can be modified by opening the MQL4 Source File in MetaEditor by right-
clicking the Expert Advisor from the Navigator window and select Modify, or opening the MetaEditor and directly
open the Expert Advisor by double-clicking the source file from the Navigator window of the editor.
From the MT4 Terminal Navigator Window:
From the MetaEditor Navigator Window:
Then the source file opens in the MetaEditor in the window as shown below:
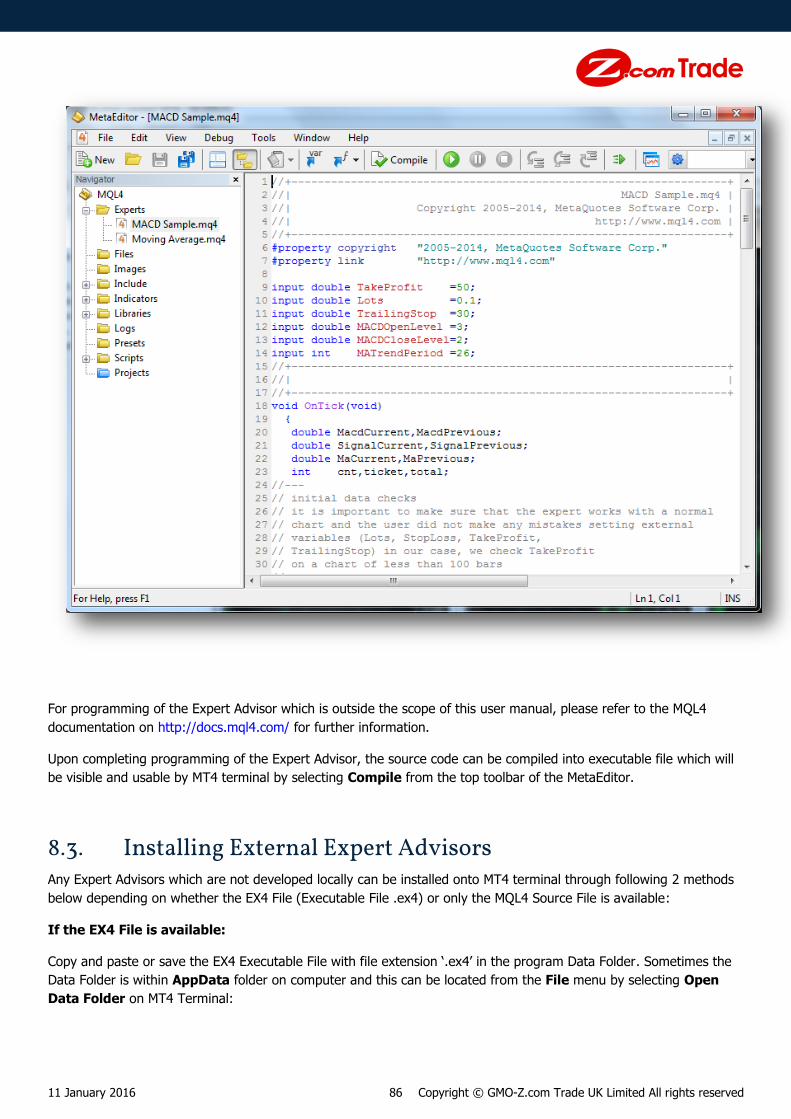
11 January 2016 86 Copyright © GMO-Z.com Trade UK Limited All rights reserved
For programming of the Expert Advisor which is outside the scope of this user manual, please refer to the MQL4
documentation on http://docs.mql4.com/ for further information.
Upon completing programming of the Expert Advisor, the source code can be compiled into executable file which will
be visible and usable by MT4 terminal by selecting Compile from the top toolbar of the MetaEditor.
8.3. Installing External Expert Advisors Any Expert Advisors which are not developed locally can be installed onto MT4 terminal through following 2 methods
below depending on whether the EX4 File (Executable File .ex4) or only the MQL4 Source File is available:
If the EX4 File is available:
Copy and paste or save the EX4 Executable File with file extension ‘.ex4’ in the program Data Folder. Sometimes the
Data Folder is within AppData folder on computer and this can be located from the File menu by selecting Open
Data Folder on MT4 Terminal:
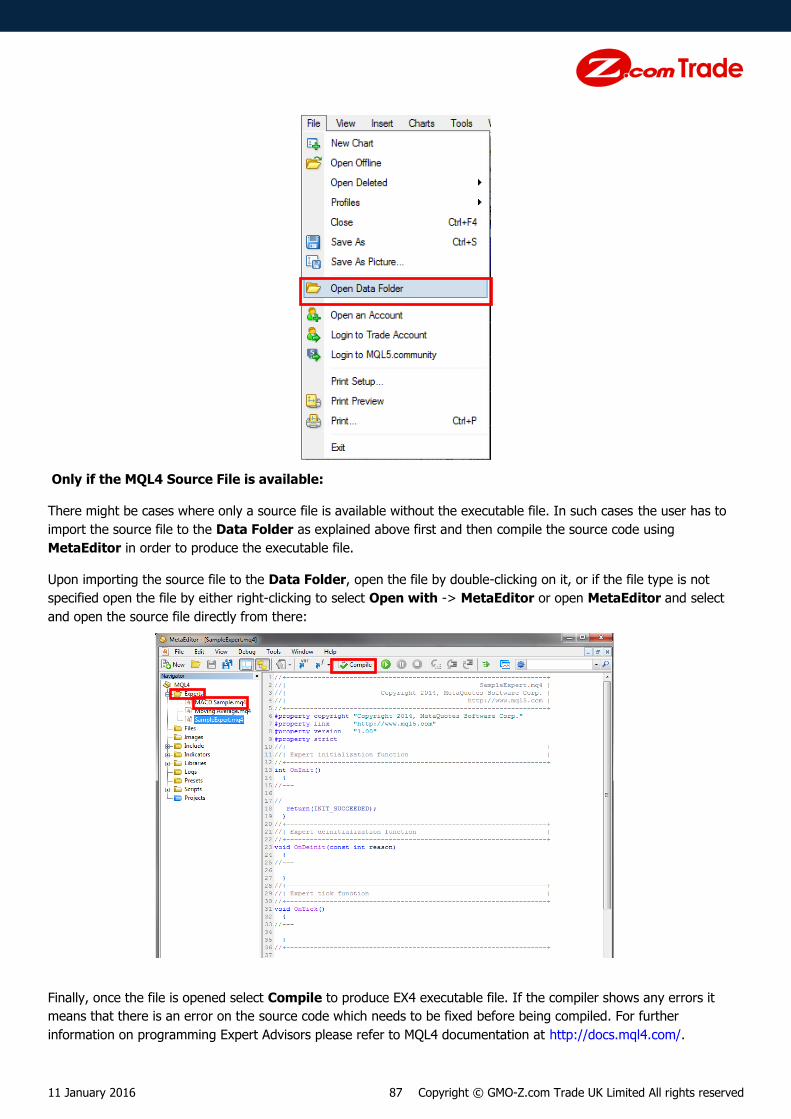
11 January 2016 87 Copyright © GMO-Z.com Trade UK Limited All rights reserved
Only if the MQL4 Source File is available:
There might be cases where only a source file is available without the executable file. In such cases the user has to
import the source file to the Data Folder as explained above first and then compile the source code using
MetaEditor in order to produce the executable file.
Upon importing the source file to the Data Folder, open the file by double-clicking on it, or if the file type is not
specified open the file by either right-clicking to select Open with -> MetaEditor or open MetaEditor and select
and open the source file directly from there:
Finally, once the file is opened select Compile to produce EX4 executable file. If the compiler shows any errors it
means that there is an error on the source code which needs to be fixed before being compiled. For further
information on programming Expert Advisors please refer to MQL4 documentation at http://docs.mql4.com/.

11 January 2016 88 Copyright © GMO-Z.com Trade UK Limited All rights reserved
Once the compile is succeeded, the Expert Advisor should be available for use on the MT4 terminal.
8.4. Enabling Expert Advisors Expert Advisors can be enabled by simply selecting the Expert Advisors button on the Standard Toolbar.
The screenshot below shows the Expert Advisor in disabled mode:
Once the Expert Advisor is enabled, the button will appear as shown below:
Alternatively, the Expert Advisor can be enabled from the Tools menu by selecting Options and then from the
Expert Advisors tab tick the box where it says Enable Expert Advisors (except for Custom Indicators and
Scripts):
And once the Expert Advisor is enabled it should start its actions when the next signal is received. However, at this
stage the Expert Advisor is set up so that it cannot automatically place trades. The following section explains the
steps required to allow the EA to trade.
8.4.1. Allowing Live Trading
In order to allow Expert Advisor to make live trades, settings must be changed on the Expert Advisor. This can be
accomplished through Tools from the menu, select Options, select Expert Advisors tab and tick the box where it
states Allow live trading:
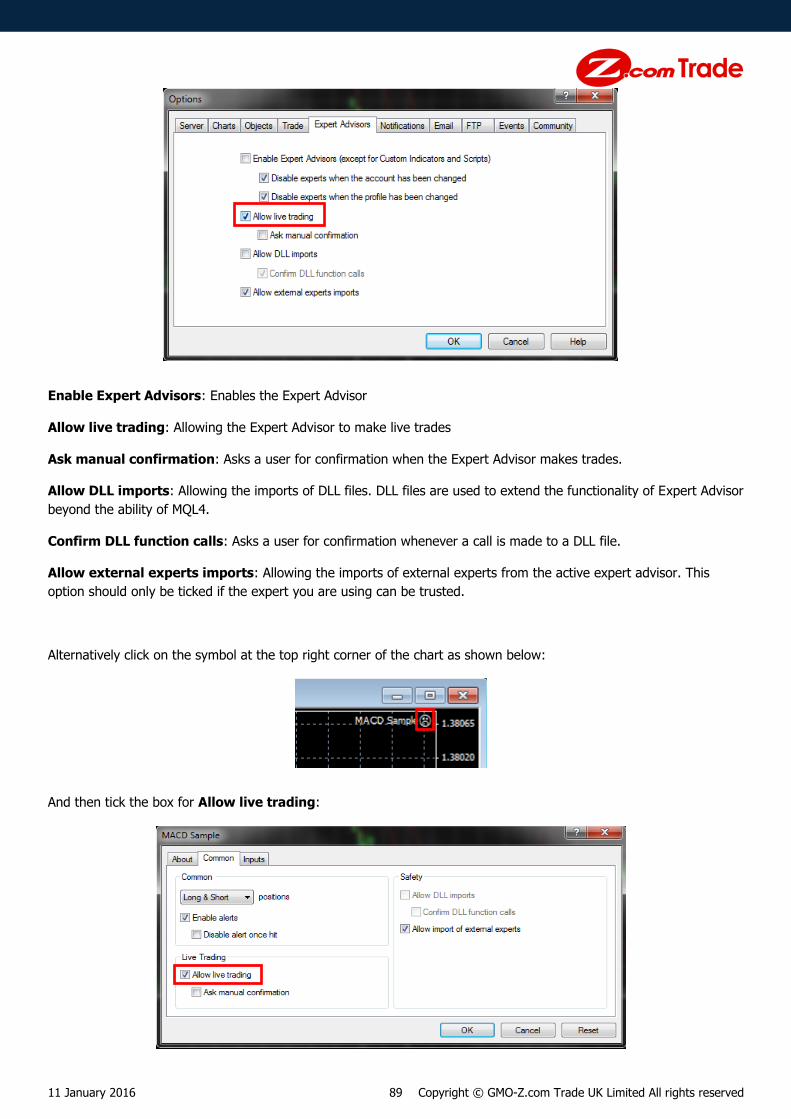
11 January 2016 89 Copyright © GMO-Z.com Trade UK Limited All rights reserved
Enable Expert Advisors: Enables the Expert Advisor
Allow live trading: Allowing the Expert Advisor to make live trades
Ask manual confirmation: Asks a user for confirmation when the Expert Advisor makes trades.
Allow DLL imports: Allowing the imports of DLL files. DLL files are used to extend the functionality of Expert Advisor
beyond the ability of MQL4.
Confirm DLL function calls: Asks a user for confirmation whenever a call is made to a DLL file.
Allow external experts imports: Allowing the imports of external experts from the active expert advisor. This
option should only be ticked if the expert you are using can be trusted.
Alternatively click on the symbol at the top right corner of the chart as shown below:
And then tick the box for Allow live trading:

11 January 2016 90 Copyright © GMO-Z.com Trade UK Limited All rights reserved
The face icon at the top right corner of the chart window will then appear as shown below:
The Expert Advisor should start trading automatically if it is programmed to do so.
8.5. Strategy Tester Strategy Tester is a powerful tool on MT4 which allows its users to test or simulate their Expert Advisors using the
historical data. At the end of the test the users would have the knowledge of how well the Expert Advisors have
performed in terms of the profit and loss. However, despite such attractive features, it must be noted that the result
indicated by such tests cannot be completely relied upon as an indicator for future performance of the Expert Advisor.
The market is a constantly changing environment and therefore something that has worked in the past is not
guaranteed to work in the future. Although there are some ways in which to improve the correlation between the test
results and the actual result, for example by accounting for longer period of historical data for the test, but this may
result in slower test implementation and lower quality of the test depending on the availability of historical data.
8.5.1. Strategy Tester Terminal
In order to carry out tests on an Expert Advisor, use the Strategy Tester window on MT4 at the bottom of the
terminal:
Expert Advisor: Expert Advisor to be tested for.
Symbol: Instrument used for the test.
Model: Method for testing the Expert Advisor on historical data. This option allows users to choose the compromise
between the accuracy and the speed for the test.
Use date: Sets the time period for the historical data for which the Expert Advisor will be back-tested against.
Visual mode: Allows the user to visually see the progress of the test by simulating the market on the chart window
with buy/sell, order modify actions by selecting this option. This also allows the user to skip to certain point of the
data and also select the speed in which the simulation is conducted.
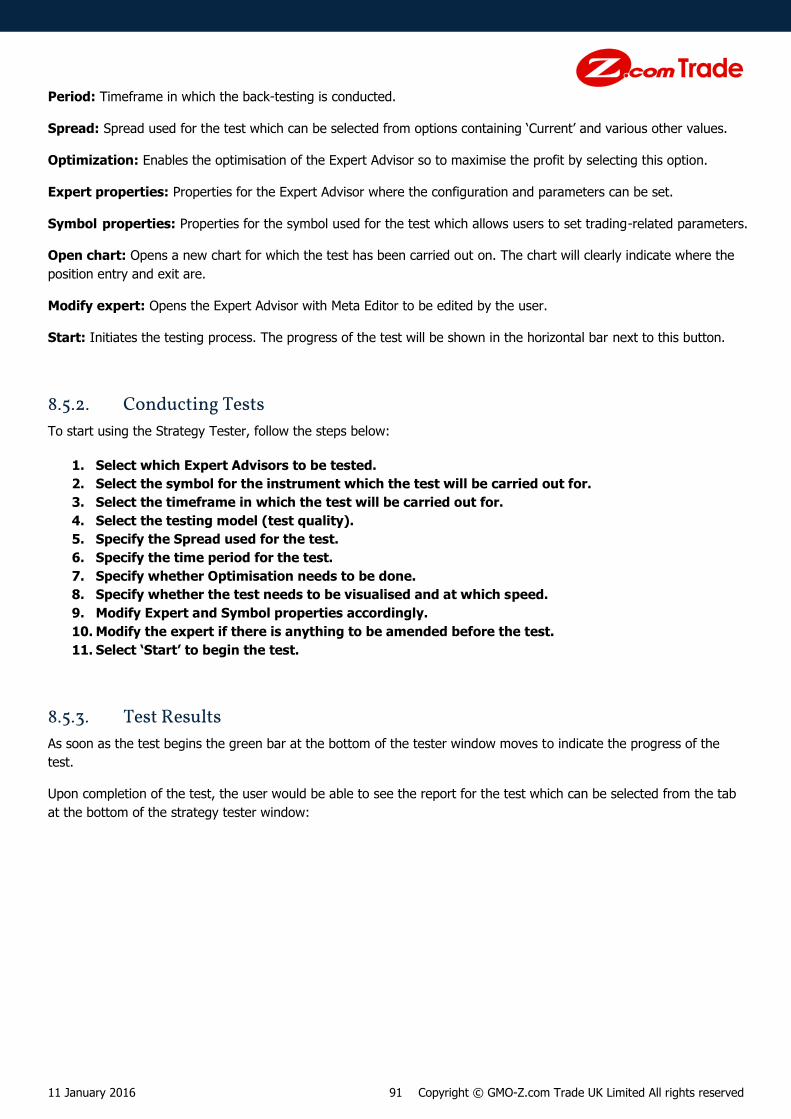
11 January 2016 91 Copyright © GMO-Z.com Trade UK Limited All rights reserved
Period: Timeframe in which the back-testing is conducted.
Spread: Spread used for the test which can be selected from options containing ‘Current’ and various other values.
Optimization: Enables the optimisation of the Expert Advisor so to maximise the profit by selecting this option.
Expert properties: Properties for the Expert Advisor where the configuration and parameters can be set.
Symbol properties: Properties for the symbol used for the test which allows users to set trading-related parameters.
Open chart: Opens a new chart for which the test has been carried out on. The chart will clearly indicate where the
position entry and exit are.
Modify expert: Opens the Expert Advisor with Meta Editor to be edited by the user.
Start: Initiates the testing process. The progress of the test will be shown in the horizontal bar next to this button.
8.5.2. Conducting Tests
To start using the Strategy Tester, follow the steps below:
1. Select which Expert Advisors to be tested.
2. Select the symbol for the instrument which the test will be carried out for.
3. Select the timeframe in which the test will be carried out for.
4. Select the testing model (test quality).
5. Specify the Spread used for the test.
6. Specify the time period for the test.
7. Specify whether Optimisation needs to be done.
8. Specify whether the test needs to be visualised and at which speed.
9. Modify Expert and Symbol properties accordingly.
10. Modify the expert if there is anything to be amended before the test.
11. Select ‘Start’ to begin the test.
8.5.3. Test Results
As soon as the test begins the green bar at the bottom of the tester window moves to indicate the progress of the
test.
Upon completion of the test, the user would be able to see the report for the test which can be selected from the tab
at the bottom of the strategy tester window:
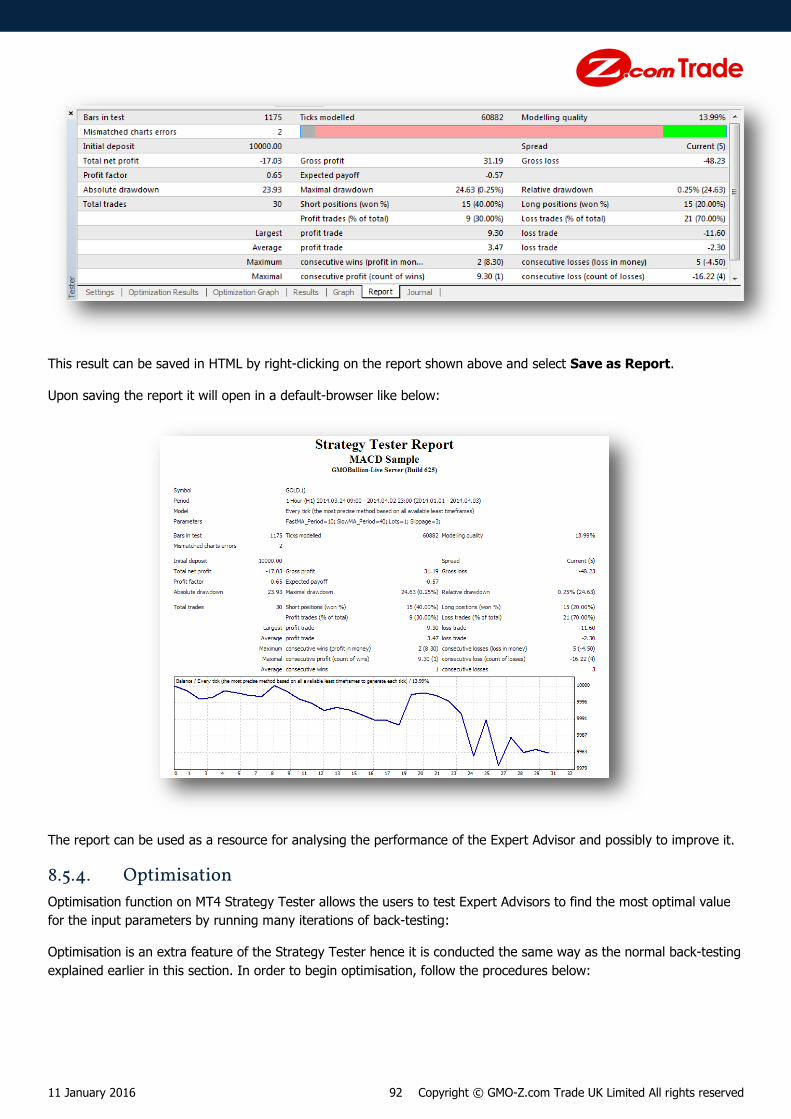
11 January 2016 92 Copyright © GMO-Z.com Trade UK Limited All rights reserved
This result can be saved in HTML by right-clicking on the report shown above and select Save as Report.
Upon saving the report it will open in a default-browser like below:
The report can be used as a resource for analysing the performance of the Expert Advisor and possibly to improve it.
8.5.4. Optimisation
Optimisation function on MT4 Strategy Tester allows the users to test Expert Advisors to find the most optimal value
for the input parameters by running many iterations of back-testing:
Optimisation is an extra feature of the Strategy Tester hence it is conducted the same way as the normal back-testing
explained earlier in this section. In order to begin optimisation, follow the procedures below:

11 January 2016 93 Copyright © GMO-Z.com Trade UK Limited All rights reserved
1. Set up the ‘Settings’ in the Strategy Tester window according to the previously explained
procedures.
2. Select the ‘Optimization’ option on the Strategy Tester window.
3. Select and open ‘Expert properties’ window.
3.1. Set optimisation parameters in the ‘Testing’ tab.
Initial deposit: Account balance and its currency which will be used for the optimisation.
Positions: Specify whether to allow trading for either Long Only, Short Only or Long & Short.
Optimized parameter: This will be the target objective variable for the optimisation.
Genetic algorithm: This option enables genetic algorithm for optimising the input variables.
3.2. Set target input variables and their parameters.
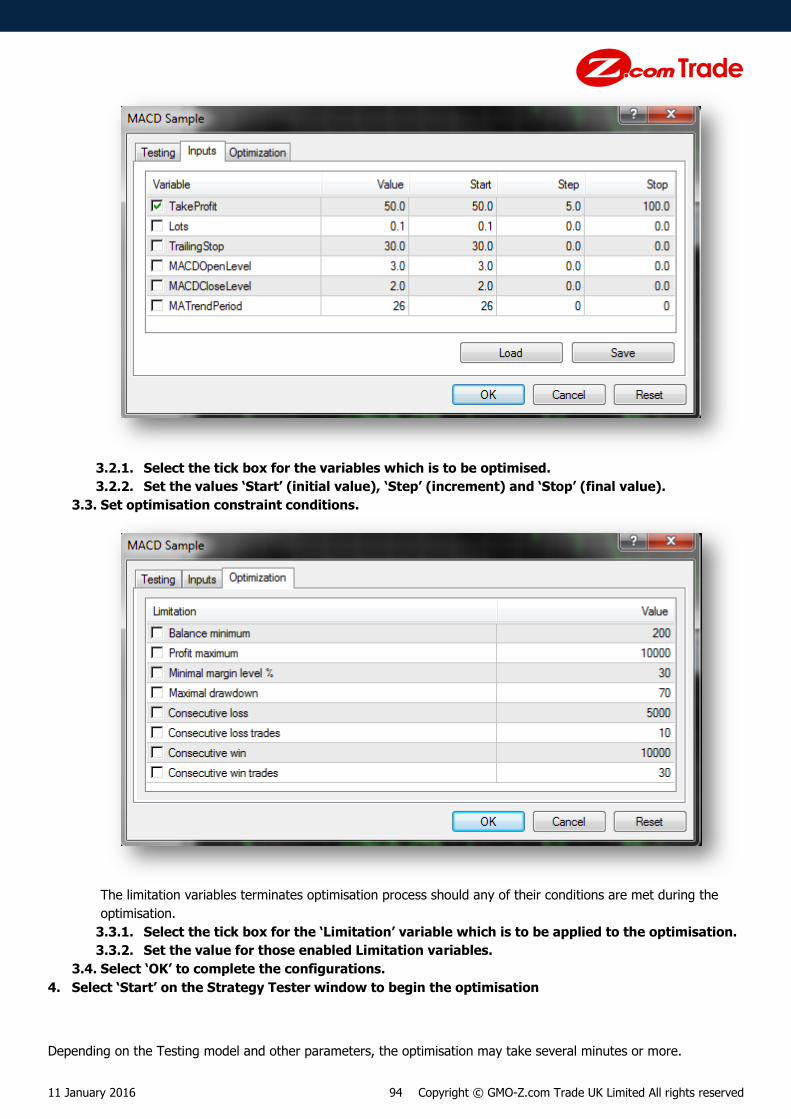
11 January 2016 94 Copyright © GMO-Z.com Trade UK Limited All rights reserved
3.2.1. Select the tick box for the variables which is to be optimised.
3.2.2. Set the values ‘Start’ (initial value), ‘Step’ (increment) and ‘Stop’ (final value).
3.3. Set optimisation constraint conditions.
The limitation variables terminates optimisation process should any of their conditions are met during the
optimisation.
3.3.1. Select the tick box for the ‘Limitation’ variable which is to be applied to the optimisation.
3.3.2. Set the value for those enabled Limitation variables.
3.4. Select ‘OK’ to complete the configurations.
4. Select ‘Start’ on the Strategy Tester window to begin the optimisation
Depending on the Testing model and other parameters, the optimisation may take several minutes or more.

11 January 2016 95 Copyright © GMO-Z.com Trade UK Limited All rights reserved
When the optimisation completes, the results can be viewed from the Optimization Results tab as shown below:
Pass: This is the iteration number.
Profit: This is the Net profit.
Total trades: Total number of trades executed during a particular iteration.
Profit factor: Proportion of the total profit against the total loss.
Expected payoff: This is the expected profit for each trade.
Drawdown $: Maximum drawdown in absolute figures.
Drawdown %: Maximum drawdown in percentage figures.
Inputs: Input parameters for each iteration.
The report can be saved by right-clicking anywhere on the results window and select Save as Report.
The optimisation results is also visualised on a graph under the tab Optimization Graph:
Where the horizontal axis represents the input parameter and the vertical axis represents the target objective variable.
11 January 2016 96 Copyright © GMO-Z.com Trade UK Limited All rights reserved
9. Custom Indicators
Custom Indicators are those technical indicators that can be built in addition to those built-in technical indicators on
MT4 platform. Custom Indicators can be programmed using Meta Editor. Like with built-in indicators, custom
indicators cannot trade for themselves. For further information on programming custom indicators using Meta Editor
please refer to the MQL4 documentation on http://docs.mql4.com/en.
9.1. Creating Custom Indicators A Custom Indicator can be created on MetaEditor development environment which comes with the whole MT4
package. The MetaEditor can be opened from MT4 terminal by selecting the MetaEditor icon on the Standard
Toolbar:
Alternatively, the Editor can be opened from Tools in the menu by selecting MetaQuotes Language Editor.
A new window appears for the MetaEditor as shown below:
In order to create a new Custom Indicator, select New on the top left of the window as indicated above. A set-up
window appears in front as below:

11 January 2016 97 Copyright © GMO-Z.com Trade UK Limited All rights reserved
Make sure the item Custom Indicator is selected. Select Next to proceed to the next step:
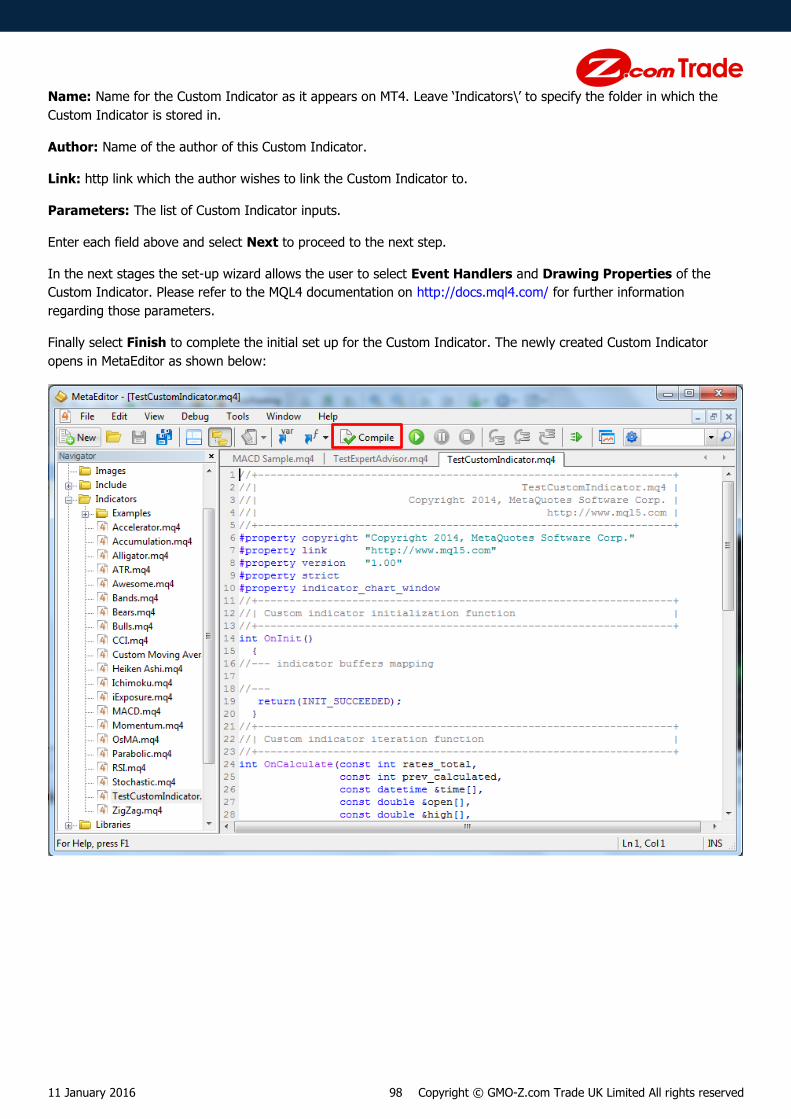
11 January 2016 98 Copyright © GMO-Z.com Trade UK Limited All rights reserved
Name: Name for the Custom Indicator as it appears on MT4. Leave ‘Indicators\’ to specify the folder in which the
Custom Indicator is stored in.
Author: Name of the author of this Custom Indicator.
Link: http link which the author wishes to link the Custom Indicator to.
Parameters: The list of Custom Indicator inputs.
Enter each field above and select Next to proceed to the next step.
In the next stages the set-up wizard allows the user to select Event Handlers and Drawing Properties of the
Custom Indicator. Please refer to the MQL4 documentation on http://docs.mql4.com/ for further information
regarding those parameters.
Finally select Finish to complete the initial set up for the Custom Indicator. The newly created Custom Indicator
opens in MetaEditor as shown below:
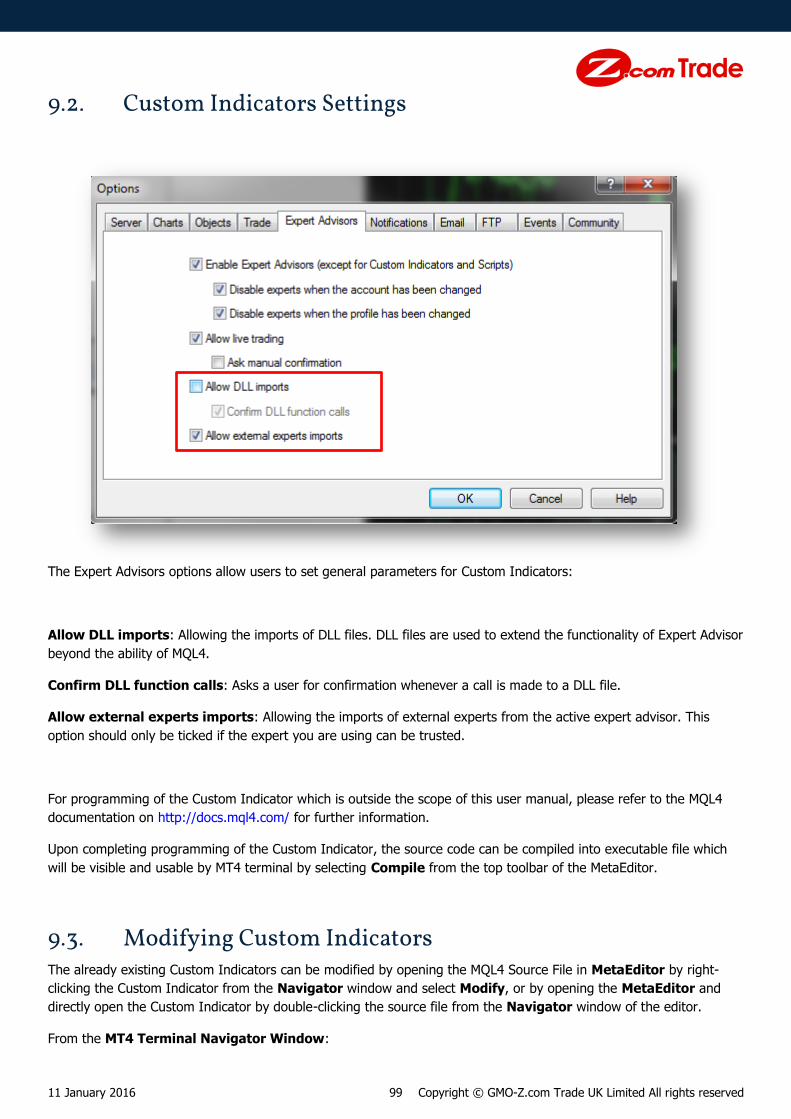
11 January 2016 99 Copyright © GMO-Z.com Trade UK Limited All rights reserved
9.2. Custom Indicators Settings
The Expert Advisors options allow users to set general parameters for Custom Indicators:
Allow DLL imports: Allowing the imports of DLL files. DLL files are used to extend the functionality of Expert Advisor
beyond the ability of MQL4.
Confirm DLL function calls: Asks a user for confirmation whenever a call is made to a DLL file.
Allow external experts imports: Allowing the imports of external experts from the active expert advisor. This
option should only be ticked if the expert you are using can be trusted.
For programming of the Custom Indicator which is outside the scope of this user manual, please refer to the MQL4
documentation on http://docs.mql4.com/ for further information.
Upon completing programming of the Custom Indicator, the source code can be compiled into executable file which
will be visible and usable by MT4 terminal by selecting Compile from the top toolbar of the MetaEditor.
9.3. Modifying Custom Indicators The already existing Custom Indicators can be modified by opening the MQL4 Source File in MetaEditor by right-
clicking the Custom Indicator from the Navigator window and select Modify, or by opening the MetaEditor and
directly open the Custom Indicator by double-clicking the source file from the Navigator window of the editor.
From the MT4 Terminal Navigator Window:

11 January 2016 100 Copyright © GMO-Z.com Trade UK Limited All rights reserved
From the MetaEditor Navigator Window:
Then the source file opens in the MetaEditor in the window as shown below:

11 January 2016 101 Copyright © GMO-Z.com Trade UK Limited All rights reserved
For programming of the Customer Indicator which is outside the scope of this user manual, please refer to the MQL4
documentation on http://docs.mql4.com/ for further information.
Upon completing programming of the Custom Indicator, the source code can be compiled into executable file which
will be visible and usable by MT4 terminal by selecting Compile from the top toolbar of the MetaEditor.
9.4. Applying Custom Indicators Custom Indicators can be applied to a chart by more or less the same way for the built-in technical indicators.
Firstly go to the Navigator window and click on the plus sign next to the Custom Indicators to expand the menu,
and right-click on the custom indicator to be applied and select Attach to a chart or simply just double-click on the
custom indicator.

11 January 2016 102 Copyright © GMO-Z.com Trade UK Limited All rights reserved
A new window as shown below appears before the chart where the configurations and parameters for the custom
indicator can be set. Select OK to complete the application of the custom indicator:
Upon completion of the above steps you will be able to see the indicator applied to the chart such as shown below for
example for Accelerator Custom Indicator built-in on MT4:
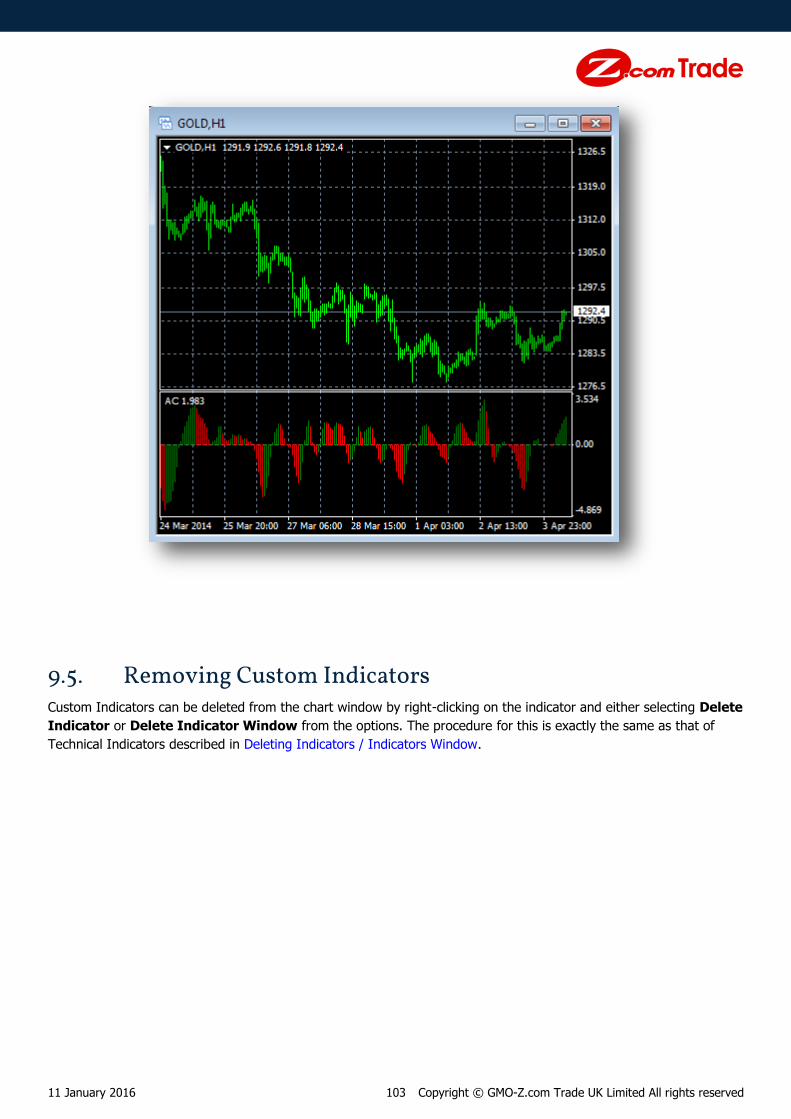
11 January 2016 103 Copyright © GMO-Z.com Trade UK Limited All rights reserved
9.5. Removing Custom Indicators Custom Indicators can be deleted from the chart window by right-clicking on the indicator and either selecting Delete
Indicator or Delete Indicator Window from the options. The procedure for this is exactly the same as that of
Technical Indicators described in Deleting Indicators / Indicators Window.
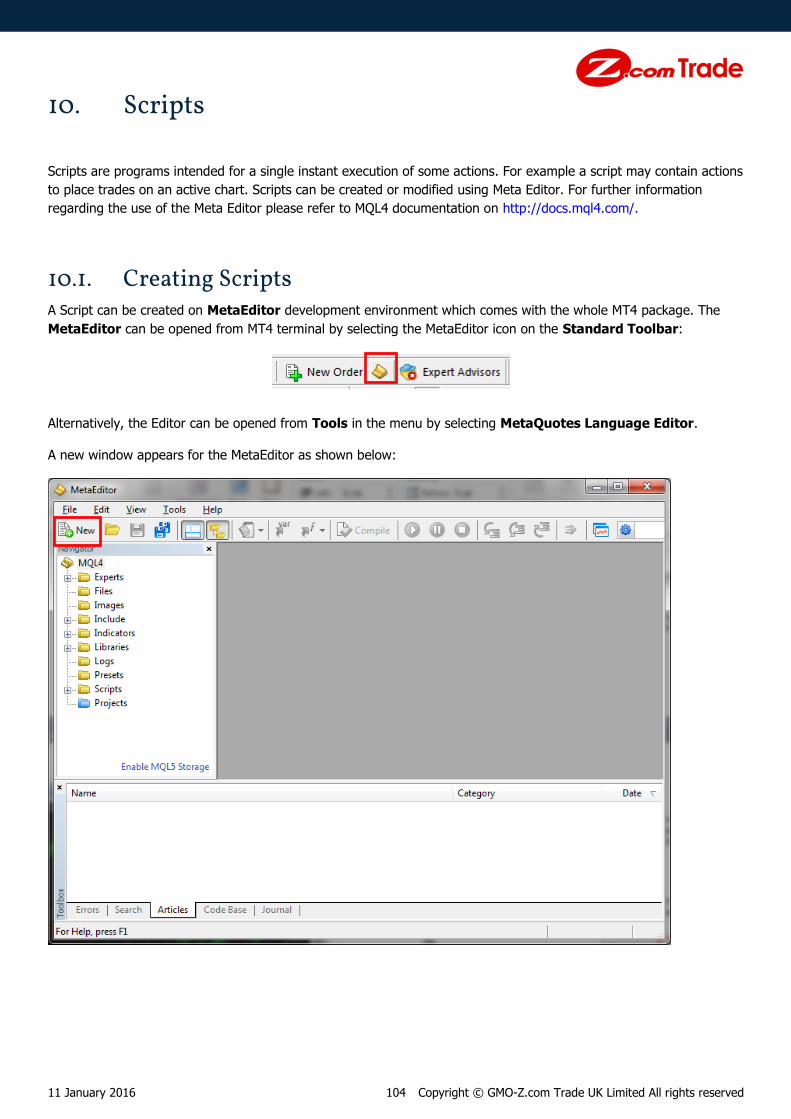
11 January 2016 104 Copyright © GMO-Z.com Trade UK Limited All rights reserved
10. Scripts
Scripts are programs intended for a single instant execution of some actions. For example a script may contain actions
to place trades on an active chart. Scripts can be created or modified using Meta Editor. For further information
regarding the use of the Meta Editor please refer to MQL4 documentation on http://docs.mql4.com/.
10.1. Creating Scripts A Script can be created on MetaEditor development environment which comes with the whole MT4 package. The
MetaEditor can be opened from MT4 terminal by selecting the MetaEditor icon on the Standard Toolbar:
Alternatively, the Editor can be opened from Tools in the menu by selecting MetaQuotes Language Editor.
A new window appears for the MetaEditor as shown below:

11 January 2016 105 Copyright © GMO-Z.com Trade UK Limited All rights reserved
In order to create a new Script, select New on the top left of the window as indicated above. A set-up window
appears in front as below:
Make sure the option Script is selected. Select Next to proceed to the next step:

11 January 2016 106 Copyright © GMO-Z.com Trade UK Limited All rights reserved
Name: Name for the Script as it appears on MT4. Leave ‘Scripts\’ to specify the folder in which the Script will be
stored in.
Author: Name of the author of this Script.
Link: http link which the author wishes to link the Script to.
Parameters: The list of Script inputs.
Enter each field above and select Finish to complete the initial set up for the Script.
The newly created Script opens in MetaEditor as shown below:
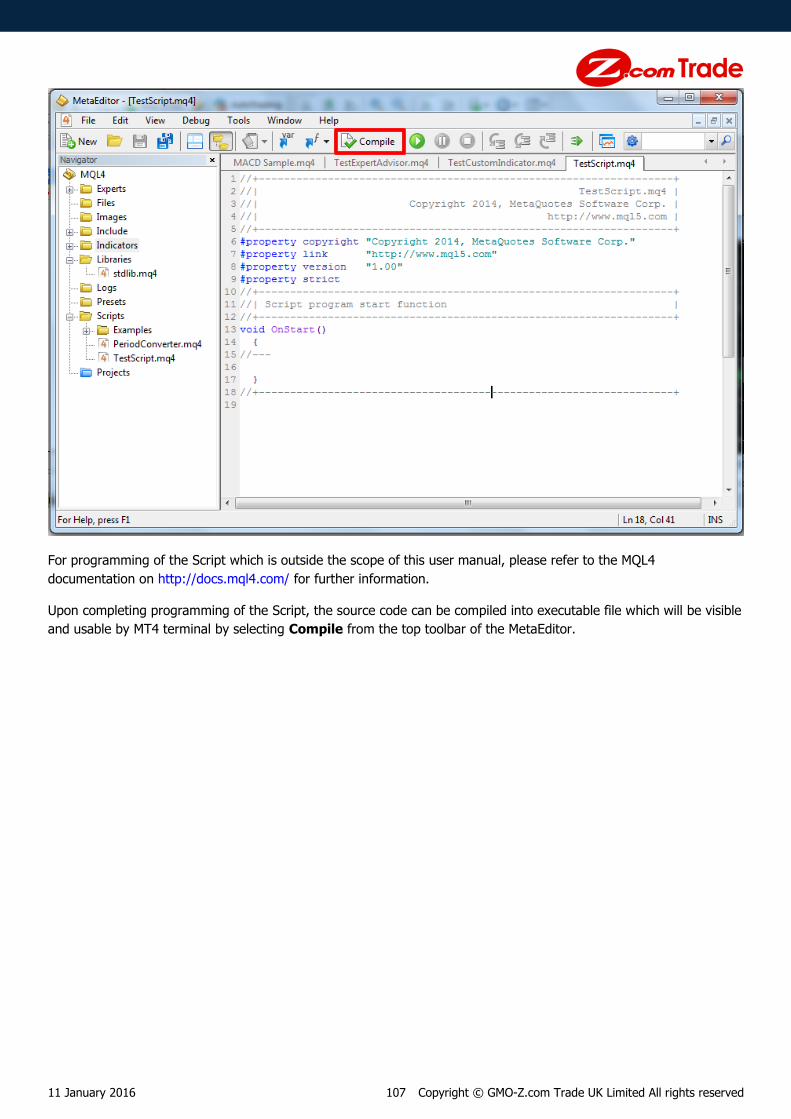
11 January 2016 107 Copyright © GMO-Z.com Trade UK Limited All rights reserved
For programming of the Script which is outside the scope of this user manual, please refer to the MQL4
documentation on http://docs.mql4.com/ for further information.
Upon completing programming of the Script, the source code can be compiled into executable file which will be visible
and usable by MT4 terminal by selecting Compile from the top toolbar of the MetaEditor.

11 January 2016 108 Copyright © GMO-Z.com Trade UK Limited All rights reserved
10.2. Script Settings The Expert Advisors options allow users to set general parameters for Script:
Enable Expert Advisors: Enables the Expert Advisor
Allow live trading: Allowing the Expert Advisor to make live trades
Ask manual confirmation: Asks user for confirmation when the Expert Advisor makes trades.
Allow DLL imports: Allowing the imports of DLL files. DLL files are used to extend the functionality of Expert Advisor
beyond the ability of MQL4.
Confirm DLL function calls: Asks a user for confirmation whenever a call is made to a DLL file.
Allow external experts imports: Allowing the imports of external experts from the active expert advisor. This
option should only be ticked if the expert you are using can be trusted.
10.3. Modifying Scripts The existing Scripts can be modified by opening the MQL4 Source File in MetaEditor by right-clicking the Script from
the Navigator window and select Modify, or by opening the MetaEditor and directly open the Script by double-
clicking the source file from the Navigator window of the editor.
From the MT4 Terminal Navigator Window:

11 January 2016 109 Copyright © GMO-Z.com Trade UK Limited All rights reserved
From the MetaEditor Navigator Window:
Then the source file opens in the MetaEditor in the window as shown below:
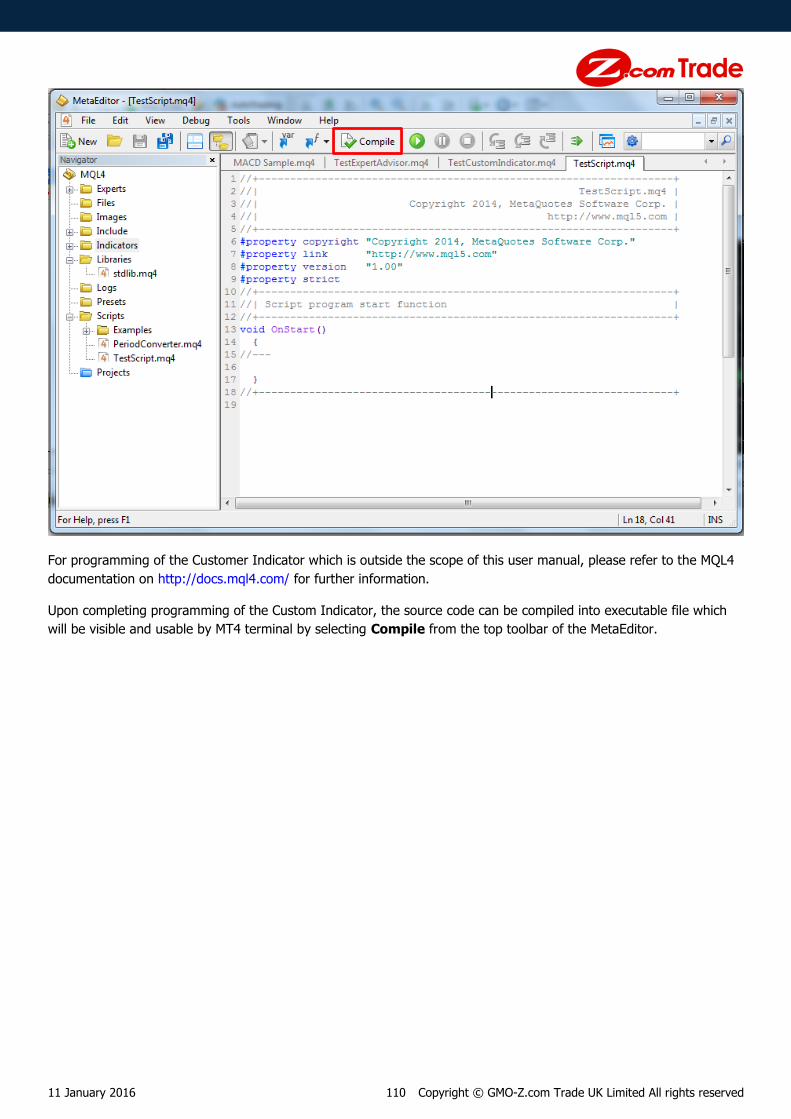
11 January 2016 110 Copyright © GMO-Z.com Trade UK Limited All rights reserved
For programming of the Customer Indicator which is outside the scope of this user manual, please refer to the MQL4
documentation on http://docs.mql4.com/ for further information.
Upon completing programming of the Custom Indicator, the source code can be compiled into executable file which
will be visible and usable by MT4 terminal by selecting Compile from the top toolbar of the MetaEditor.
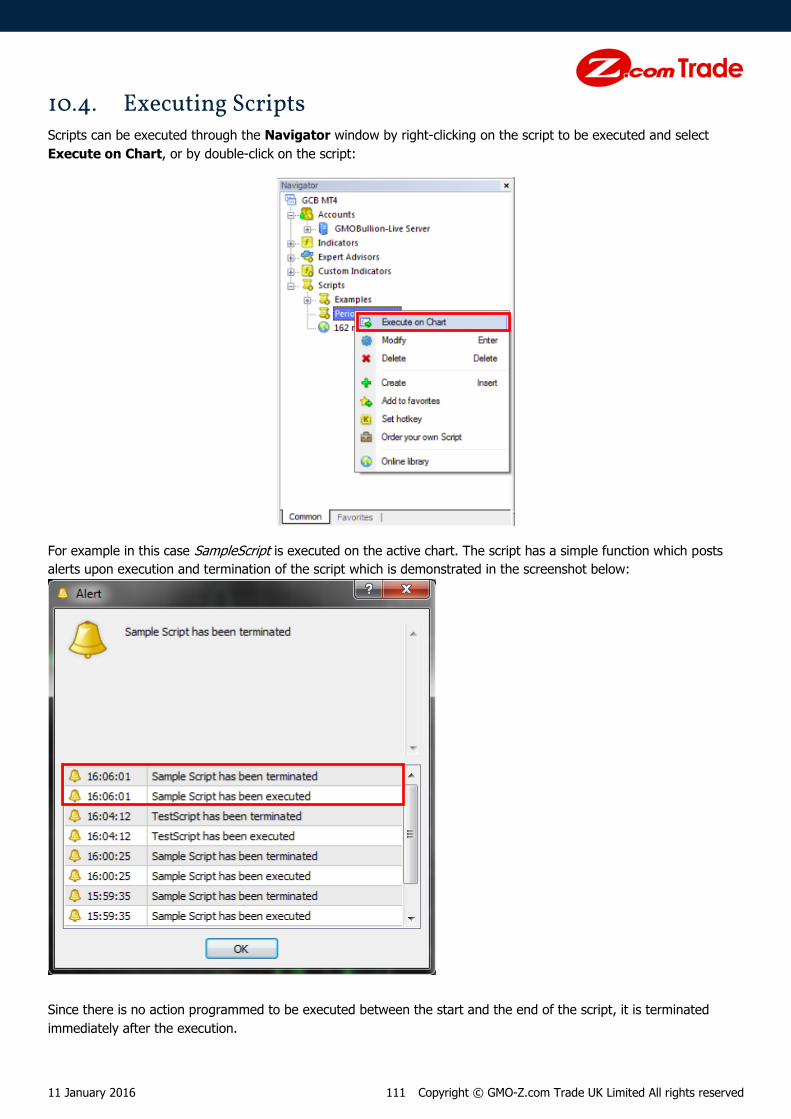
11 January 2016 111 Copyright © GMO-Z.com Trade UK Limited All rights reserved
10.4. Executing Scripts Scripts can be executed through the Navigator window by right-clicking on the script to be executed and select
Execute on Chart, or by double-click on the script:
For example in this case SampleScript is executed on the active chart. The script has a simple function which posts
alerts upon execution and termination of the script which is demonstrated in the screenshot below:
Since there is no action programmed to be executed between the start and the end of the script, it is terminated
immediately after the execution.

11 January 2016 112 Copyright © GMO-Z.com Trade UK Limited All rights reserved
10.5. Removing Scripts Usually the Scripts are short-term simple execution code which terminates after relatively short period of time.
However, in some circumstances there are long-lived scripts which need to be terminated in the midst of the
operation. These Scripts can be terminated by right-clicking on the chart to which the script has been executed on,
and select Remove Script from the options as shown below:
Likewise, the Script can be terminated by simply applying different Scripts on the chart.
11 January 2016 113 Copyright © GMO-Z.com Trade UK Limited All rights reserved
11. Risk Warning
Trading in leveraged products carries a high level of risk, and you may incur losses which exceed your initial
investment. These products are not suitable for everyone and you should seek independent advice if you are in any
doubt. Please ensure that you fully understand the risks, and visit trade.z.com for further information.