multiple choice executive summary credo · pdf filecenter for research ... charter schools are...
TRANSCRIPT

Executive Summary

© 2009 CREDO Center for Research on Education Outcomes (CREDO) Stanford University Stanford, CA http://credo.stanford.edu June 2009 CREDO gratefully acknowledges the support of the State Education Agencies and School Districts who contributed their data to this partnership.
The views expressed herein do not necessarily represent the positions or policies of the organizations listed above. No official endorsement of any product, commodity, service or enterprise mentioned in this publication is intended or should be inferred. The analysis and conclusions contained herein are exclusively those of the authors, are not endorsed by the any of CREDO’s supporting organizations, their governing boards, or the state governments, state education departments or school districts that participated in this study.

1
I. ________________________________________________________
I. EXECUTIVE SUMMARY
INTRODUCTION
As charter schools play an increasingly central role in education reform agendas across the United States, it becomes more important to have current and comprehensible analysis about how well they do educating their students. Thanks to progress in student data systems and regular student achievement testing, it is possible to examine student learning in charter schools and compare it to the experience the students would have had in the traditional public schools (TPS) they would otherwise have attended. This report presents a longitudinal student‐level analysis of charter school impacts on more than 70 percent of the students in charter schools in the United States. The scope of the study makes it the first national assessment of charter school impacts.
Charter schools are permitted to select their focus, environment and operations and wide diversity exists across the sector. This study provides an overview that aggregates charter schools in different ways to examine different facets of their impact on student academic growth.
The group portrait shows wide variation in performance. The study reveals that a decent fraction of charter schools, 17 percent, provide superior education opportunities for their students. Nearly half of the charter schools nationwide have results that are no different from the local public school options and over a third, 37 percent, deliver learning results that are significantly worse than their student would have realized had they remained in traditional public schools. These findings underlie the parallel findings of significant state‐by‐state differences in charter school performance and in the national aggregate performance of charter schools. The policy challenge is how to deal constructively with varying levels of performance today and into the future.
PROJECT APPROACH
CREDO has partnered with 15 states and the District of Columbia to consolidate longitudinal student‐level achievement data for the purposes of creating a national pooled analysis of the impact of charter schooling on student learning gains. For each charter school student, a virtual twin is created based on students who match the charter student’s demographics, English language proficiency and participation in special education or subsidized lunch programs. Virtual twins were developed for 84 percent of all the students in charter schools. The resulting matched longitudinal comparison is used to test whether students who attend charter schools fare better than if they had instead attended traditional public schools in their community. The outcome of interest is academic learning gains in reading and math, measured in standard deviation units.
Student academic learning gains on reading and math state achievement tests were examined in three ways: a pooled nationwide analysis of charter school impacts, a state‐by‐state analysis of charter school results, and an examination of the performance of charter schools against their local alternatives.

2
In all cases, the outcome of interest is the magnitude of student learning that occurs in charter school students compared to their traditional public school virtual twins. Each analysis looks at the impact of a variety of factors on charter school student learning: the state where the student resides, the school’s grade‐span, the student’s background, time in charter schools, and a number of policy characteristics of the charter school environment.
SUMMARY OF FINDINGS
Charter school performance is a complex and difficult matter to assess. Each of the three analyses revealed distinct facets of charter school performance. In increasing levels of aggregation, from the head‐to‐head comparisons within communities to the pooled national analysis, the results are presented below.
When the effect of charter schools on student learning is compared to the experience the students would have realized in their local traditional public schools, the result can be graphed in a point‐in‐time Quality Curve that relates the average math growth in each charter school to the performance their students would have realized in traditional public schools in their immediate community, as measured by the experience of their virtual twins. The Quality Curve displays the distribution of individual charter school performance relative to their TPS counterparts. A score of “0” means there is no difference between the charter school performance and that of their TPS comparison group. More positive values indicate increasingly better performance of charters relative to traditional public school effects and negative values indicate that charter school effects are worse than what was observed for the traditional public school effects.
Charter School Market Fixed Effects Quality Curve
Compared to TPS, Charter Schools are:
Worse than Exactly the same Better Than

3
The Quality Curve results are sobering:
• Of the 2403 charter schools reflected on the curve, 46 percent of charter schools have math gains that are statistically indistinguishable from the average growth among their TPS comparisons.
• Charters whose math growth exceeded their TPS equivalent growth by a significant amount account for 17 percent of the total.
• The remaining group, 37 percent of charter schools, posted math gains that were significantly below what their students would have seen if they enrolled in local traditional public schools instead.
The state‐by‐state analysis showed the following:
• The effectiveness of charter schools was found to vary widely by state. The variation was over and above existing differences among states in their academic results.
States with significantly higher learning gains for charter school students than would have occurred in traditional schools include:
o Arkansas o Colorado (Denver) o Illinois (Chicago) o Louisiana o Missouri
The gains in growth ranged from .02 Standard deviations in Illinois (Chicago) to .07 standard deviations in Colorado (Denver).
States that demonstrated lower average charter school student growth than their peers in traditional schools included:
o Arizona o Florida o Minnesota o New Mexico o Ohio o Texas
In this group, the marginal shift ranged from ‐.01 in Arizona to ‐.06 standard deviations in Ohio. Four states had mixed results or were no different than the gains for traditional school peers:
o California o District of Columbia o Georgia o North Carolina

4
• The academic success of charter school students was found to be affected by the contours of the charter policies under which their schools operate.
• States that have limits on the number of charter schools permitted to operate, known as caps, realize significantly lower academic growth than states without caps, around .03 standard deviations.
• States that empower multiple entities to act as charter school authorizers realize significantly lower growth in academic learning in their students, on the order of ‐.08 standard deviations. While more research is needed into the causal mechanism, it appears that charter school operators are able to identify and choose the more permissive entity to provide them oversight.
• Where state charter legislation provides an avenue for appeals of adverse decisions on applications or renewals, students realize a small but significant gain in learning, about .02 standard deviations.
To put variation in state results in context, the average charter school gains in reading and math were plotted against the 2007 4th Grade NAEP state averages. The position of the states relative to the national NAEP average and relative to average learning gains tees up important questions about school quality in general and charter school quality specifically.
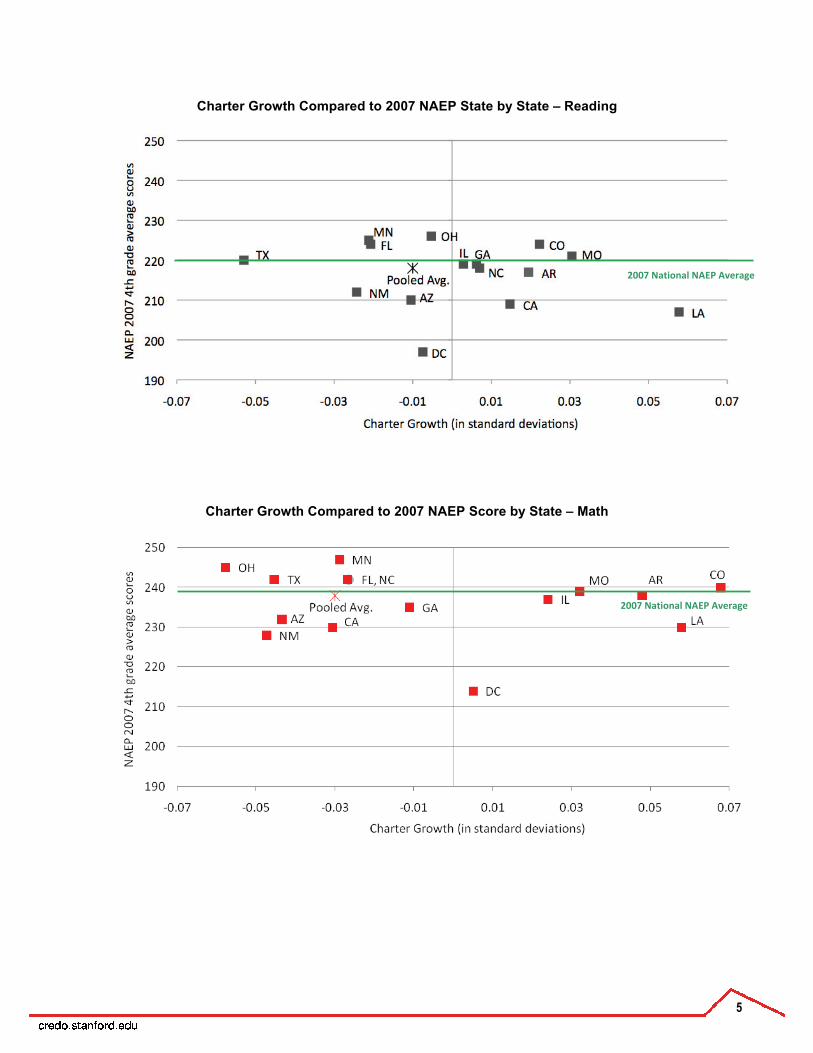
5
Charter Growth Compared to 2007 NAEP State by State – Reading
Charter Growth Compared to 2007 NAEP Score by State – Math
2007 National NAEP Average
2007 National NAEP Average

6
The analysis of total charter school effects, pooled student‐level data from all of the participating states and examined the aggregate effect of charter schools on student learning. The national pooled analysis of charter school impacts showed the following results:
• Charter school students on average see a decrease in their academic growth in reading of .01 standard deviations compared to their traditional school peers. In math, their learning lags by .03 standard deviations on average. While the magnitude of these effects is small, they are both statistically significant.
• The effects for charter school students are consistent across the spectrum of starting positions. In reading, charter school learning gains are smaller for all students but those whose starting scores are in the lowest or highest deciles. For math, the effect is consistent across the entire range.
• Charter students in elementary and middle school grades have significantly higher rates of learning than their peers in traditional public schools, but students in charter high schools and charter multi‐level schools have significantly worse results.
• Charter schools have different impacts on students based on their family backgrounds. For Blacks and Hispanics, their learning gains are significantly worse than that of their traditional school twins. However, charter schools are found to have better academic growth results for students in poverty.
English Language Learners realize significantly better learning gains in charter schools. Students in Special Education programs have about the same outcomes.
• Students do better in charter schools over time. First year charter students on average experience a decline in learning, which may reflect a combination of mobility effects and the experience of a charter school in its early years. Second and third years in charter schools see a significant reversal to positive gains.
POLICY IMPLICATIONS
As of 2009, more than 4700 charter schools enroll over 1.4 million children in 40 states and the District of Columbia. The ranks of charters grow by hundreds each year. Even so, more than 365,000 names linger on charter school wait lists. 1 After more than fifteen years, there is no doubt that both supply and demand in the charter sector are strong.
In some ways, however, charter schools are just beginning to come into their own. Charter schools have become a rallying cry for education reformers across the country, with every expectation that they will continue to figure prominently in national educational strategy in the months and years to come. And yet, this study reveals in unmistakable terms that, in the aggregate, charter students are not faring as well as their TPS counterparts. Further, tremendous variation in academic quality among charters is the norm, not the exception. The problem of quality is the most pressing issue that charter schools and their supporters face.
The study findings reported here give the first wide‐angle view of the charter school landscape in the United States. It is the first time a sufficiently large body of student‐level data has been
1 National Alliance for Public Charter Schools As of June 3, 2009: http://www.publiccharters.org/aboutschools/benefits

7
compiled to create findings that could be considered "national" in scope. More important, they provide a broad common yardstick to support on‐going conversations about quality and performance. For the first time, the dialog about charter school quality can be married to empirical evidence about performance. Further development of performance measures in forums like the Building Charter School Quality initiative could be greatly enhanced with complementary multi‐state analysis such as this first report.
It is important to note that the news for charter schools has some encouraging facets. In our nationally pooled sample, two subgroups fare better in charters than in the traditional system: students in poverty and ELL students. This is no small feat. In these cases, our numbers indicate that charter students who fall into these categories are outperforming their TPS counterparts in both reading and math. These populations, then, have clearly been well served by the introduction of charters into the education landscape. These findings are particularly heartening for the charter advocates who target the most challenging educational populations or strive to improve education options in the most difficult communities. Charter schools that are organized around a mission to teach the most economically disadvantaged students in particular seem to have developed expertise in serving these communities. We applaud their efforts, and recommend that schools or school models demonstrating success be further studied with an eye toward the notoriously difficult process of replication. Further, even for student subgroups in charters that had aggregate learning gains lagging behind their TPS peers, the analysis revealed charter schools in at least one state that demonstrated positive academic growth relative to TPS peers. These higher performers also have lessons to share that could improve the performance of the larger community of charters schools.
The flip‐side of this insight should not be ignored either. Students not in poverty and students who are not English language learners on average do notably worse than the same students who remain in the traditional public school system. Additional work is needed to determine the reasons underlying this phenomenon. Perhaps these students are "off‐mission" in the schools they attend. Perhaps they are left behind in otherwise high‐performing charter schools, or perhaps these findings are a reflection of a large pool of generally underperforming schools. Whatever the reason, the policy community needs to be aware of this dichotomy, and greater attention should be paid to the large number of students not being well served in charter schools.
In addition, we know now that first year charter students suffer a sharp decline in academic growth. Equipped with this knowledge, charter school operators can perhaps take appropriate steps to mitigate or reverse this "first year effect."
Despite promising results in a number of states and within certain subgroups, the overall findings of this report indicate a disturbing — and far‐reaching — subset of poorly performing charter schools. If the charter school movement is to flourish, or indeed to deliver on promises made by proponents, a deliberate and sustained effort to increase the proportion of high quality schools is essential. The replication of successful school models is one important element of this effort. On the other side of the equation, however, authorizers must be willing and able to fulfill their end of the original charter school bargain: accountability in exchange for flexibility. When schools consistently fail, they should be closed.
Though simple in formulation, this task has proven to be extremely difficult in practice. Simply put, neither market mechanisms nor regulatory oversight been a sufficient force to deal with
8
underperforming schools. At present there appears to be an authorizing crisis in the charter school sector. For a number of reasons — many of them understandable — authorizers find it difficult to close poorly performing schools. Despite low test scores, failing charter schools often have powerful and persuasive supporters in their communities who feel strongly that shutting down this school does not serve the best interests of currently enrolled students. Evidence of financial insolvency or corrupt governance structure, less easy to dispute or defend, is much more likely to lead to school closures than poor academic performance. And yet, as this report demonstrates, the apparent reluctance of authorizers to close underperforming charters ultimately reflects poorly on charter schools as a whole. More importantly, it hurts students.
Charter schools are already expected to maintain transparency with regard to their operations and academic records, giving authorizers full access. We propose that authorizers be expected to do the same. True accountability demands that the public know the status of each school in an authorizer's portfolio, and that we be able to gauge authorizer performance just as authorizers currently gauge charter performance. To this end, we suggest the adoption of a national set of performance metrics, collected uniformly by all authorizers in order to provide a common base line by which we can compare the performance of charter schools and actions of authorizers across state lines. Using these metrics, Authorizer Report Cards would provide full transparency and put pressure on authorizers to act in clear cases of failure.
The charter school movement to date has concentrated its formidable resources and energy on removing barriers to charter school entry into the market. It is time to concentrate equally on removing the barriers to exit.

9