munich personal repec archive - uni- · pdf filemunich personal repec archive fdi and growth...
TRANSCRIPT
MPRAMunich Personal RePEc Archive
FDI and Growth in the MENA countries:Are the GCC countries Different?
Mouna Gammoudi and Mondher Cherif and Simplice A
Asongu
June 2016
Online at https://mpra.ub.uni-muenchen.de/74227/MPRA Paper No. 74227, posted 3 October 2016 02:36 UTC

1
A G D I Working Paper
WP/16/015
FDI and Growth in the MENA countries: Are the GCC countries
Different?
Mouna Gammoudi
Laboratoire REGARDS, Université de Reims Champagne Ardenne- France
Tel: +33 07.86.10.94.00 E-mail:[email protected]
Mondher Cherif Laboratoire REGARDS,
Université de Reims Champagne Ardenne- France E-mail: [email protected]
Simplice A. Asongu
African Governance and Development Institute,
P.O. Box 8413 Yaoundé, Cameroon.
E-mail: [email protected] /[email protected]
2
2016 African Governance and Development Institute WP/16/015
AGDI Working Paper
Research Department
FDI and Growth in the MENA countries: Are the GCC countries Different?
Mouna Gammoudi, Mondher Cherif & Simplice A. Asongu
June 2016
Abstract
This paper examines the relationship between Foreign Direct Investment (FDI) and per capita
Gross Domestic Product (GDP) in the Middle East and North Africa (MENA) region for the
period 1985-2009. The empirical evidence is based on an endoeneity-robust Generalised
Method of Moments. Results show that the effect of FDI on per capita income in the Gulf
Cooperation Council (GCC) countries is positive but negative in Non-GCC countries. Results
also reveal that in contrast to the GCC countries, the financial openness policy in the Non-
GCC countries have reduced the benefits of FDI on growth, this finding is explained by the
fact that most of the Non-GCC countries that have engaged in the process of financial reforms
have poor quality of institutions. These results are confirmed with both annual data and five
year average data.
Keywords: FDI, growth, GMM, financial openness, Institutions
JEL Classification: C52; F21; F23; O40; P37

3
1- Introduction
The last four decades have been accompanied with rapid growth in the world
economy. This growth has been driven in part by the ever increasing Foreign Direct
Investment (FDI) inflows. According to the World Investment Report established by the
United Nations Conference on Trade and Development (UNCTAD) in 2012, global FDI
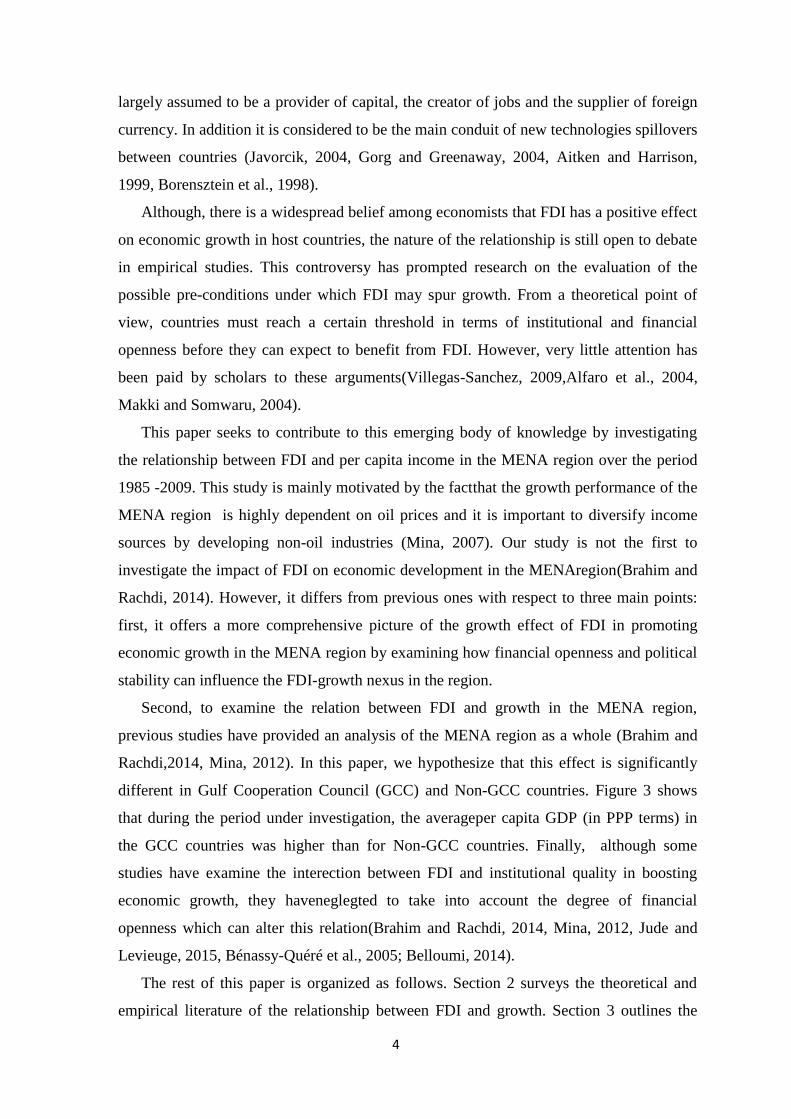
inflows reach $1.9 trillion in 2007. Although, the Middle East and North Africa (MENA)
region has received far less FDI inflows than other regions in the world, except for Sub-
Saharan Africa (see Figure 1) due in part to the weak institutions and political instability
(Gammoudi and Cherif, 2015, 2016), the share of FDI in Gross Domestic Product (GDP)
has increased considerably. For example, it moved from 0.81 percent in 1970 to reach 4
percent in 2009, a fourfold increase (see Figure 2). It has helped in the perspective that in
the late 1980s, many countries in the region have realized many liberalization reforms in
line with programs prescribed by international institutions such as the International
Monetary Fund (IMF) and the World Bank in order to encourage FDI inflows and
promote economic growth, development and poverty reduction. These reforms include
new or restructured investment legislation, incentives such as tax exemption and relaxed
restrictions on foreign ownership.
According to Organization for Economic Co-operation and Development (OECD)
report (OECD, 2007) all MENA countries have free zones except Algeria, Qatar and
Saudi Arabia. Turkey, Egypt and Kuwait have all reduced corporate taxes by up to 25%
(UNCTAD, 2004). Liberalization of FDI inflows was considered by several international
institutions and policy makers as the first step towards economic liberalization to promote
economic growth . Moreover it is comparativelymore stable than other types of capital
inflows (foreign portfolio investment and bank flows). Jeffry Sachs, special adviser to the
then Secretary General Kofi Annan on the Millennium Development Goals (September
22, 2004) said that “Many of the poorest countries are simply being bypassed by
globalization, and the promises of the rich countries are not being fulfilled. We need more
globalization that reaches poor countries, and more successful globalization, not less. The
kind of globalization that the poorest countries are feeling is brain drain. They are not
seeing inflow of foreign investment. FDI is so important because it is one of the strongest
engines for growth in the developing world”(Katsioloudes and Hadjidakis, 2007, p. 214).
The fundamental concern about whether FDI helps to improve economic growth has
been discussed extensively in the economic literature. Many policy makers and academics
contend that FDI can has important positive effects on a host country’s growth as it is
4
largely assumed to be a provider of capital, the creator of jobs and the supplier of foreign
currency. In addition it is considered to be the main conduit of new technologies spillovers
between countries (Javorcik, 2004, Gorg and Greenaway, 2004, Aitken and Harrison,
1999, Borensztein et al., 1998).
Although, there is a widespread belief among economists that FDI has a positive effect
on economic growth in host countries, the nature of the relationship is still open to debate
in empirical studies. This controversy has prompted research on the evaluation of the
possible pre-conditions under which FDI may spur growth. From a theoretical point of
view, countries must reach a certain threshold in terms of institutional and financial
openness before they can expect to benefit from FDI. However, very little attention has
been paid by scholars to these arguments(Villegas-Sanchez, 2009,Alfaro et al., 2004,
Makki and Somwaru, 2004).
This paper seeks to contribute to this emerging body of knowledge by investigating
the relationship between FDI and per capita income in the MENA region over the period
1985 -2009. This study is mainly motivated by the factthat the growth performance of the
MENA region is highly dependent on oil prices and it is important to diversify income
sources by developing non-oil industries (Mina, 2007). Our study is not the first to
investigate the impact of FDI on economic development in the MENAregion(Brahim and
Rachdi, 2014). However, it differs from previous ones with respect to three main points:
first, it offers a more comprehensive picture of the growth effect of FDI in promoting
economic growth in the MENA region by examining how financial openness and political
stability can influence the FDI-growth nexus in the region.
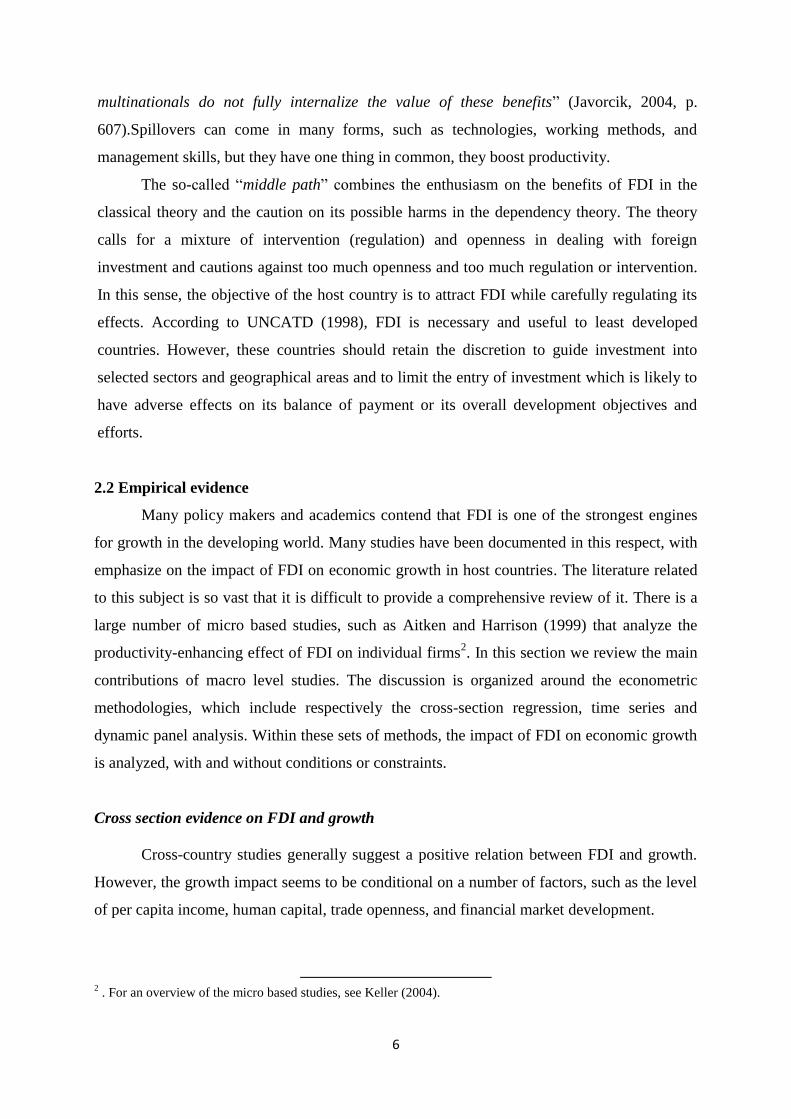
Second, to examine the relation between FDI and growth in the MENA region,
previous studies have provided an analysis of the MENA region as a whole (Brahim and
Rachdi,2014, Mina, 2012). In this paper, we hypothesize that this effect is significantly
different in Gulf Cooperation Council (GCC) and Non-GCC countries. Figure 3 shows
that during the period under investigation, the averageper capita GDP (in PPP terms) in
the GCC countries was higher than for Non-GCC countries. Finally, although some
studies have examine the interection between FDI and institutional quality in boosting
economic growth, they haveneglegted to take into account the degree of financial
openness which can alter this relation(Brahim and Rachdi, 2014, Mina, 2012, Jude and
Levieuge, 2015, Bénassy-Quéré et al., 2005; Belloumi, 2014).
The rest of this paper is organized as follows. Section 2 surveys the theoretical and
empirical literature of the relationship between FDI and growth. Section 3 outlines the

5
methodological framework and data used in the empirical study. Section 4 discusses the
regression results while Section 5 draws conclusions.
2-Relationship between FDI and economic growth
2.1 Theoretical underpinnings
From the theoretical point of view, scholars distinguish between three theories which have
been used to study the impact of FDI on economic growth (Toone, 2013), namely:
dependency theory, classical theory and middle path theory.
In its extreme form, the dependency theory is based on the Marxist tenet, which sees
globalization in terms of the spread of market capitalism, the exploitation of cheap labour and
resources in return for the obsolete technologies of developed countries. Proponents of
dependency theory maintain that FDI has a negative impact on developing countries and
provide three main explanations to substantiate the argument. First, the benefits of FDI are
unequally distributed between multinational corporations and host countries in favor of the
former. Foreign capital absorbs local assets that could have been used to finance internal
development, this means that foreign firms exploit profit-making opportunities in developing
countries but expatriate the profit to the wealthy host countries (Jensen, 2008).
Second, multinational corporations create distortions within the local economy by
crowding-out domestic investment; employing inappropriate capital‐intensive technologies
leading to unemployment; worsening the distribution of income; and altering consumer tastes
and undermining the local culture (Taylor and Thrift, 2013). Third, there is a potential
“alliance” between foreign capital and local elite (political and economic elites), each of these
actors use their power and influence to gain from the alliance. The citizens of host countries
are excluded from this alliance and suffer greatly from the distorted policies created by this
system (Jensen, 2008).
Advocates of the classical theory advance the claim that FDI contributes to the
economic development of host countries through a number of channels. These include, the:
transfer of capital, advanced technological equipment and skills; improvement in the balance
of payments; expansion of the tax base and foreign exchange earnings through FDI exports;
creation of employment, infrastructural development and integration of the host economy
into international markets (Toone, 2013). Much of these views can be seen in the vast
literature on “spillover1”: a concept that occurs “ when the entry or presence of multinational
corporation increases productivity of domestic firms in the host country and the
1 See Gorg and Greenaway (2004) for a review of a “spillover” literature
6
multinationals do not fully internalize the value of these benefits” (Javorcik, 2004, p.
607).Spillovers can come in many forms, such as technologies, working methods, and
management skills, but they have one thing in common, they boost productivity.
The so-called “middle path” combines the enthusiasm on the benefits of FDI in the
classical theory and the caution on its possible harms in the dependency theory. The theory
calls for a mixture of intervention (regulation) and openness in dealing with foreign
investment and cautions against too much openness and too much regulation or intervention.
In this sense, the objective of the host country is to attract FDI while carefully regulating its
effects. According to UNCATD (1998), FDI is necessary and useful to least developed
countries. However, these countries should retain the discretion to guide investment into
selected sectors and geographical areas and to limit the entry of investment which is likely to
have adverse effects on its balance of payment or its overall development objectives and
efforts.
2.2 Empirical evidence
Many policy makers and academics contend that FDI is one of the strongest engines
for growth in the developing world. Many studies have been documented in this respect, with
emphasize on the impact of FDI on economic growth in host countries. The literature related
to this subject is so vast that it is difficult to provide a comprehensive review of it. There is a
large number of micro based studies, such as Aitken and Harrison (1999) that analyze the
productivity-enhancing effect of FDI on individual firms2. In this section we review the main
contributions of macro level studies. The discussion is organized around the econometric
methodologies, which include respectively the cross-section regression, time series and
dynamic panel analysis. Within these sets of methods, the impact of FDI on economic growth
is analyzed, with and without conditions or constraints.
Cross section evidence on FDI and growth
Cross-country studies generally suggest a positive relation between FDI and growth.
However, the growth impact seems to be conditional on a number of factors, such as the level
of per capita income, human capital, trade openness, and financial market development.
2 . For an overview of the micro based studies, see Keller (2004).

7
Studies using Ordinary Least Squares (OLS)
Blomstrom et al. (1992) based on OLS and the generalized instrumental variable
(GIV) estimations in a sample of 78 developing countries and 23 developed countries over the
period 1960 -1985, found that FDI contributed positively to economic growth in higher
income developing countries but not in lower income countries. In this study, the authors used
the ratio of FDI to GDP, measured in current dollars as a proxy of FDI and they added the
following variables: the average ratio of the number of students enrolled in secondary
education to the population of the appropriate age groups; a variable to assess the dynamics of
prices; ratio of fixed capital formation as a percentage of the GDP; change in labor force
participation rate and the average ratio of import of machinery and transport equipment to
GDP.
Balasubramanyam et al. (1996) used the OLS estimation method and concluded that
FDI had a greater impact on countries that promote exports of products than on countries that
have import substitution policies. The sample used in this study covers 46 developing
countries over the period 1970-1985. The results are based on an equation aimed at explaining
growth using the following variables: labor input, domestic capital stock, stock of foreign
capital and exports.
Borensztein et al. (1998) examine the effect of FDI on economic growth by using the
Seemingly Unrelated Regression (SUR) technique3 in the case of 69 developing countries
over the period 1970-1989. Authors in this study include: initial GDP; government
consumption; black market premium on foreign exchange; measures of political instability
and political rights; a proxy variable for financial development; inflation rate; a measure of
the quality of institutions; human capital; FDI and an interaction term built with FDI and
human capital. They suggest that FDI contributed to economic growth through the transfer of
technology. However, the higher productivity of FDI holds only when the host country has a
minimum threshold stock of human capital.
Alfaro (2003) uses a cross-section analysis on 47 countries between 1980 and 1999 in
order to evaluate the role of FDI on economic growth. More precisely, she attempts to
determine whether FDI in the primary, manufacturing, and services sectors exerts different
effects on a country’s growth. The variables included in this study are: the growth of real per
capita, government final consumption expenditure as a percentage of GDP, secondary
3Borensztein et al. (1998) use seemingly unrelated regressions (SUR) with panel data averaged over two separate
time-periods (1970-1979 and 1980-1989) to account for the possible correlation of error terms across equations.
8
schooling of the total population, inflation, institutional quality and openness. Results reveal
that FDI inflows into the primary sector tend to have a negative effect on growth, whereas
FDI inflows into the manufacturing sector have a positive effect. Evidence from the foreign
investments in the service sector is ambiguous. These results are robust to the inclusion of
other growth determinants, such as human capital, different samples, and the use of lagged
values of FDI.
Alfaro et al. (2004) examine the links between FDI, financial markets and economic
growth using cross-country data from 71 developing and developed countries. Their empirical
evidence suggests that the development of local financial markets is an important precondition
for a positive impact of FDI on growth. Financial market development is measured by
capitalization, liquidity, private sector credit and bank credit. Control variables include:
domestic investment, government consumption, trade, creditor rights, schooling, inflation,
institutional stability (measured by risk of expropriation, level of corruption, the rule of law,
and bureaucratic quality) and dummy variables for sub-Saharan Africa. The results are robust
to different measures of financial market development, the inclusion of other determinants of
economic growth, and consideration of endogeneity. This finding was further supported by
Villegas-Sanchez (2009) using micro-level data from Mexico. The author finds that domestic
firms benefit from FDI only if they are relatively large and located in financially developed
regions.
However, the studies cited above are subject to criticism. Firstly, as noted by Herzer et
al. (2008),a well-known problem with cross-country studies is the assumption of identical
production functions across countries. In fact, production technologies, institutions and
policies differ substantially across countries, so that the growth effects of FDI are also likely
to differ. As a consequence of cross-country parameter heterogeneity, these regression results
are generally not robust to the selection of countries. Secondly, unobserved heterogeneity due
to omitted variables may lead to biased parameter estimates. Thirdly, cross-country studies
may suffer from serious endogeneity biases. In fact, FDI will be endogenous if the economic
growth rate of a host country is an important factor for international firms when deciding
where to invest. In other words, FDI can determine and be determined by host country growth
rates (i.e. higher growth leads to higher FDI). Carkovic and Levine (2002) claim that previous
FDI and growth studies should be viewed skeptically, given that most of these studies do not
control for possible endogeneity when using FDI flows and heterogeneity among countries.
Accordingly, studies, in response to these problems have adopted different strategies. Some
have tried to solve this endogeneity with instrumental variables techniques (Alfaro, 2003,

9
Alfaro et al., 2004), panel data approach (Gui-Diby, 2014,Feeny et al., 2014) or using time-
series.
Studies using cross section instrumental variable approach (IV)
To overcome the endogeneity problem of FDI, researchers have adopted the IV
technique. The choice of an appropriate instrument should be driven by the literature of FDI
determinants. An ideal instrument should be highly correlated with FDI but not with the error
term in the regressions. Some studies have sought to find a valid external instrument for the
FDI variable (Feeny et al., 2014). Unfortunately suitable instruments have been difficult to
identify, some of these studies used the distance that the host country is from the major
investing country. The favored approach of recent FDI literature has therefore been to control
for the potential endogeneity of the FDI variable by using internal instruments. For example,
Alfaro(2003), Alfaro et al.(2004) and Makki and Somwaru (2004)use lagged of FDI, which is
considered as a consistent instrument in the literature (Asongu, 2014; Asongu and De Moor,
2016).
Makki and Somwaru (2004) analyse the role FDI and trade in economic growth of
developing countries within the endogenous growth-theory framework. The authors use the
SUR method as well as instrumental variables in the sample of 66 developing countries over
the period 1971- 2000. Macroeconomic policies and institutional stability are necessary pre-
conditions for the positive effect of FDI on growth. The control variables include: trade in
goods and services, stock of human capital, domestic capital investment, initial GDP, inflation
rate, tax on income, profits, capital gains in the host country expressed as percentage of
current revenue, and government consumption.
Similarly, Durham (2004) examines the effects of FDI and equity foreign portfolio
investment on economic growth using data on 80 countries from 1979 to1998 in the sample of
83 countries (62 non-OECD and 21 high-income countries) found that the effect of FDI
depends on the absorptive capacity in the host countries, specifically, financial and
institutional developments. The estimations are based on equations that include initial GDP,
human capital variables explaining the economic growth rate, investment ratio, FDI, and
different interaction terms with FDI.
Based on a panel of 57 developing countries over the period 1980 to 1999, Yabi
(2010) concluded that FDI flows do not always have an impact on economic growth. He
found that due to the heterogeneity of countries, the positive impact of FDI was observed in
countries with high economic growth but not in countries with low economic growth. These

10
results were based on estimations with instrumental variables that included control variables
that explained economic growth, such as local investment, average number of years spent in
secondary schools by the male population, inflation, fertility rate, government consumption,
rule of law, number of telephone lines per thousands of people, etc.
Noting that although the cross section-sectional IV regression address biases related to
the endogeneity problem (omitted variable, measurement error and simultaneity), it suffers
from two important problems. Firstly, only the endogeneity and measurement error of FDI are
controlled, the technique does not control the endogeneity and measurement error of other
explanatory variables included in the growth regression. Secondly, if there are country-
specific fixed effects that are not included in the conditioning information set and that help to
explain economic growth, the OLS estimation may produce erroneous estimates on the FDI
coefficient.
Panel evidence on FDI and growth
To remove the effect of omitted variable bias and deal with the unobserved country-
specific effects, empirical studies have used the fixed and/or random effects models.
Furthermore, to control for the endogeneity problem induced by the inclusion of the lagged
explanatory variable in dynamic model, several studies have employed the GMM estimator
(Asongu, 2013, 2015; Gammoudi and Cherif, 2016).
Fixed and random effect
Serrasqueiro and Nunes (2008)assert that developing countries differ in terms of:
colonial history, political regimes, ideologies and religious affiliations, geographical locations
and climatic conditions. According to the narrative, if this heterogeneity is not taken into
account it will influence measurement of the estimated parameters. Thus to control for
country-specific effects, studies have used panel data models of fixed or random effects.
Bengoa and Sanchez-Robles (2003)examine the relationships among economic freedom, FDI
and economic growth using panel data analysis for a sample of 18 Latin American countries
for the period 1970 to 1999. They include control variables such as inflation, primary
enrollment, secondary enrollment and public consumption. Using a fixed effects model, they
suggest that FDI is positively correlated with economic growth in the host countries.
However, host countries require, adequate human capital, economic stability and liberalized
markets to benefit from long-term capital flows. These results are robust with the two-step
11
Generalized Method of Moments as an alternative estimation. Melnyk et al. (2014) investigate
the impact of FDI on economic development in post communist transition economies by using
fixed effects to show a positive relationship between FDI and economic growth. Tiwari and
Mutascu (2011) examine whether FDI has an impact on the economic growth in the case of
23 Asian countries by employing data from 1986 to 2008. Using random and fixed effects
models, they find that FDI enhances growth in these countries
In contrast to the studies cited above, Johnson (2006) find that FDI inflows have a
positive effect on host country economic growth for developing but not for developed
economies. Mello (1999) looks at causation from FDI to growth in the sample of 23 OECD
and non-OECD countries for the period 1970-1990 by using time series and panel data
estimations (fixed effect) to find weak indications of a positive relationship between FDI and
economic growth.
Generalized method of moments (GMM)
To account for unobserved country-specific effects and to control for the potential
endogeneity problem induced by the inclusion of the lagged dependent variable, Carkovic and
Levine (2002) construct a panel data set covering 71 developing and developed countries in
order to analyze the relationship between FDI and growth. Performing both cross-country
OLS analysis and dynamic panel data analysis using GMM, they conclude that there is no
robust link running from inward FDI to host country economic growth
Gui-Diby (2014) examines the impact of FDI on economic growth in 50 African
countries during the period 1980 to 2009 by using the system GMM estimators. He finds that
FDI inflows have a significant impact on economic growth in the African region during the
period of interest. However, this effect is not identical during the overall period, the impact of
FDI on economic growth was negative during the period 1980 to 1994 and positive during the
period 1995 to 2009. He also finds that human resources do not matter in the FDI-growth
nexus.
Feeny et al. (2014) use data averaged over seven five-year periods between 1971 and
2010 for a sample of 209 countries to examine the impact of FDI to the Pacific region. More
precisely, to examine whether the FDI-growth relationship is different in Pacific countries, the
authors include in their econometric model an interaction term between FDI and the Pacific
countries dummy variable. Results show that the impact of FDI is lower in pacific countries
than it is in host countries. On average, a 10% increase in the ratio of FDI to host in GDP is
associated with higher growth of about 2% in all countries on average. The impact in Pacific
12
countries falls to between 0.1 and 0.4%. The low impact of FDI on economic growth is
explained by the fact that FDI displaces domestic investment in the Pacific region.
Alege and Ogundipe (2014) investigate the relationship between FDI and economic
growth in the Economic Community of West African States (ECOWAS) in the period
between 1970 and 2011 to show that the positive effect of FDI on economic development
depends on the absorptive capacity in the host country capability of the available human
stock, extent of openness, the political and economic stability of ECOWAS countries, when
they use pooled OLS, fixed effects and random effects. However, considering the System-
GMM panel estimation technique they find that the contributions of FDI appear insignificant
in the dynamism of GDP per capita despite the significant contributions of the control
variables.
Time series evidence on FDI and growth
The time series analysis is undertaken to analyze whether there exists any long-run
relationship between FDI and economic growth as well as the direction of the relationship.
In this context, Adewumi (2006) examines the contribution of FDI to economic growth in
Africa using annual series, by applying time series analysis from 1970 to 2003. He found that
FDI contributes positively to economic growth in most of the countries, but it is not
statistically significant. Herzer et al. (2008) examine the FDI-led growth hypothesis for 28
developing countries, 10 countries from Latin America, 9 countries from Asia and 9 countries
from Africa by using cointegration techniques. Their results indicate that there is no clear
association between the growth impact of FDI and the level of per capita income, the level of
education, the degree of openness and the level of financial market development in
developing countries.
Zhang (2001) analyses the causality between FDI and economic growth in the case of
11 developing countries in East Asia and Latin America. Using cointegration and Granger
causality tests, he finds that in five cases economic growth is enhanced by FDI but that host
country conditions such as trade regime and macroeconomic stability are important.
Frimpong and Oteng-Abayie (2006) examine the causal link between FDI and GDP growth
for Ghana for the pre and post structural adjustment program (SAP) periods and the direction
of the causality between two the variables by using annual time series data covering the
period from 1970 to 2005. The results establish no causality between FDI and growth for the
total sample period and the pre-SAP period. FDI, however caused GDP growth during the

13
post –SAP period. Har et al. (2008) reached the same result in the case of Malaysia for the
period 1970 to 2005.
Chowdhury and Mavrotas (2006) examine the causal relationship between FDI and
economic growth by using time series data covering a period from 1969 to 2000 in the case of
three developing countries, namely Chile, Malaysia and Thailand. They suggest that it is GDP
that causes FDI in the case of Chile and not vice versa while for both Malaysia and Thailand,
there is a strong evidence of a bi-directional causality between the two variables. Majagaiya et
al. (2010) found unidirectional causality from FDI to economic growth. In the case of Nepal
over the period between 1980 and 2006, the same result is reached by Tang et al. (2008) in the
case on China.
Herzer (2012) shows that the cross-country and panel studies, as well as time series
analyses suffer from several econometric problems, then he examines empirically the impact
of FDI on growth in 44 developing countries by employing panel cointegration techniques
that are robust to omitted variables and endogenous regressors, to find that the effect of FDI
on economic growth in developing countries is negative. However, there are large differences
in the effect of FDI on economic growth across countries. Accordingly, it is depends on
freedom from government intervention, business freedom, FDI volatility, and primary export
dependence.
The above literature review suggests that the impact of FDI on economic growth
remains extremely controversial. This is partly due to the use of different samples by different
authors and partly due to the endogeneity problem between FDI and growth. FDI may have a
positive impact on economic growth leading to an enlarged market size, which in turn attracts
further FDI.
Despite these controversial effects, the empirical evidence generally suggests that FDI has
a positive impact on economic growth in developing countries, as recent surveys by Lim
(2001) and Hansen and Rand (2006) attest. However, the existence and size of the impact of
FDI on growth seems to depend on economic and political conditions in the host country,
such as the level of per capita income, the human capital base, the degree of openness in the
economy and the extent of the development of domestic financial markets.
2- Specification of models
In order to empirically test if FDI has a direct effect on per capita income in the MENA
region over the period1985 to 2009,we use the following dynamic panel models to capture the

14
dynamics of the variables over time, as presented by Azman-Saini et al. (2010) and GUI-Diby
(2014):
𝑳𝑮𝑫𝑷𝒊,𝒕 = 𝜶𝑳𝑮𝑫𝑷𝒊,𝒕−𝟏 + 𝜷𝟏𝑭𝑫𝑰𝒊,𝒕
+ 𝜷𝟐𝑿𝒊,𝒕
+ 𝛈𝐢 + 𝛆𝐢,𝐭 (1-1)
Where i is country index, t is time index, LGDP, represent the logarithmic value of the
purchasing power parity (PPP)-converted gross domestic product (GDP) per capita at 2005
constant price, FDI is foreign direct investment in percentage of GDP at current prices, X is
the matrix of control variables that affect economic growth, t is unobserved country-specific
effect term, and it it is the usual error term.
The group of control variables is comprised of covariates frequently used in the FDI–
growth literature, including: Urban population growth in annual percentage (POP), general
government final consumption expenditure to GDP (GOV), gross domestic investment as a
percentage of GDP (GCF), and secondary gross school enrollment ratio (SEC)(as a proxy for
human capital).
After we see the direct effect of FDI inflows on per capita income in the MENA
region, we examine whether this effect is significantly different in NonGCC countries. To
answer this question, we add an interaction term between FDI/GDP and the Non-GCC
countries to capture the effect of FDI in this region. The NonGCC variable is a dummy
variable taking the value of 1 if the country is located in the GCC and zero otherwise.
Our model is specified, then as follows:
𝑳𝑮𝑫𝑷𝒊,𝒕 = 𝜶𝑳𝑮𝑫𝑷𝒊,𝒕−𝟏 + 𝜷𝟏𝑭𝑫𝑰
𝒊,𝒕 + 𝜷𝟐𝑿
𝒊,𝒕+ 𝜷𝟑(𝑭𝑫𝑰 ∗ 𝑵𝒐𝒏𝑮𝑪𝑪)𝒊,𝒕 + 𝛈𝐢 + 𝛆𝐢,𝐭 (1-2)
Where,(FDI*NonGCC) is an interaction term between FDI and NonGCC countries. From
equation (2), the effect of FDI on per capita income is given by:
𝑑𝐿𝐺𝐷𝑃𝑖
𝑑𝐹𝐷𝐼𝑖= {
𝜷𝟏, 𝑓𝑜𝑟 𝑐𝑜𝑢𝑛𝑡𝑟𝑖𝑒𝑠 𝑜𝑢𝑡𝑠𝑖𝑑𝑒 𝑁𝑜𝑛 𝐺𝐶𝐶𝜷𝟏 + 𝜷𝟑, 𝑓𝑜𝑟 𝑁𝑜𝑛 𝐺𝐶𝐶 𝑐𝑜𝑢𝑛𝑡𝑟𝑖𝑒𝑠
Finally to determine the role of financial openness and institutional qualities in the
FDI-growth relationship, we include separately the two interaction terms: FDI*KAOPEN

15
and FDI*INS. While the significance of the first interaction term implies that open financial
countries are more likely to benefit from FDI. The significance of the second suggests that the
marginal effect of FDI on growth depends on the level of institutional qualities in the host
countries.
3.1 Methodology
We employ the GMM panel estimator first proposed by Arellano and Bond (1991) and
extended by Arellano and Bover (1995) and Blundell and Bond (1998). This estimator
enables us firstly, to control for country-specific effects, which cannot be done using country-
specific dummies due to the dynamic structure of the regression equation. Secondly, to control
for a simultaneity bias caused by the possibility that some of the explanatory variables may be
endogenous. For example, FDI will be endogenous if the economic growth rate of a host
country is an important factor for international firms when deciding where to invest. In other
words, FDI can determine and be determined by host country growth rates.
Arellano and Bond (1991) propose transforming Eq. (1-1) into first-differences to eliminate
country-specific effects as follows:
𝑳𝑮𝑫𝑷𝒊,𝒕 − 𝑳𝑮𝑫𝑷𝒊,𝒕−𝟏
= 𝜶(𝑳𝑮𝑫𝑷𝒊,𝒕−𝟏 − 𝜶𝑳𝑮𝑫𝑷𝒊,𝒕−𝟐) + 𝜷𝟏(𝑭𝑫𝑰𝒊,𝒕
− 𝑭𝑫𝑰𝒊,𝒕−𝟏 ) + 𝜷𝟐(𝑿𝒊,𝒕
− 𝑿𝒊,𝒕−𝟏)
+ (𝛆𝐢,𝐭 −𝛆𝐢,𝐭−𝟏 )
(4-3)
To address the possible simultaneity bias of explanatory variables and the correlation
between (𝑳𝑮𝑫𝑷𝒊,𝒕−𝟏 − 𝑳𝑮𝑫𝑷𝒊,𝒕−𝟐 ) and (𝛆𝐢,𝐭 −𝛆𝐢,𝐭−𝟏 ), Arellano and Bond (1991) proposed that the
lagged levels of the regressors are used as instruments. This is valid under the assumptions
that: (i) the error term is not serially correlated, and (ii) the lag of the explanatory variables
are weakly exogenous. This strategy is known as difference GMM estimation. Following
Arellano and Bond (1991),we set the following moment conditions:
𝐄[𝑳𝑮𝑫𝑷𝒊,𝒕−𝒔. (𝛆𝐢,𝐭−𝛆𝐢,𝐭−𝟏)] = 𝟎𝐟𝐨𝐫𝐬≥2; t=3 ;…. T (1-4)
𝐄[𝑭𝑫𝑰𝒊,𝒕−𝒔. (𝛆𝐢,𝐭−𝛆𝐢,𝐭−𝟏)] = 𝟎𝐟𝐨𝐫𝐬≥2; t=3 ;…. T (1-5)
𝐄[𝑿𝒊,𝒕−𝒔. (𝛆𝐢,𝐭−𝛆𝐢,𝐭−𝟏)] = 𝟎𝐟𝐨𝐫𝐬≥2; t=3 ;…. T (1-6)
Although the difference estimator above is able to control for country-specific effects
and simultaneity bias, however, as pointed out by Arellano and Bover (1995), lagged levels
are poor instruments for first differences if the variables are close to a random walk (such as
economic growth). In response, Blundell and Bond (1998) proposed a more efficient

16
estimator, the “system” GMM estimator, which combines the difference Eq. (1-3) and the
level Eq. (1-1). Blundell and Bond (1998) show that this estimator is able to reduce biases and
imprecision associated with difference estimator. Following Arellano and Bover (1995), the
additional moment conditions for the second part of the system (the regression in levels) are
set as follows:
𝐄 [(𝑳𝑮𝑫𝑷𝒊,𝒕−𝒔 − 𝑳𝑮𝑫𝑷𝒊,𝒕−𝒔−𝟏). (𝛈𝐢 + 𝛆𝐢,𝐭
)] = 𝟎𝐟𝐨𝐫𝐬=1 (1-7)
𝐄 [(𝑭𝑫𝑰𝒊,𝒕−𝒔 − 𝑭𝑫𝑰𝒊,𝒕−𝒔−𝟏). (𝛈𝐢 + 𝛆𝐢,𝐭
)] = 𝟎𝐟𝐨𝐫𝐬=1 (1-8)
𝐄 [(𝑿𝒊,𝒕−𝒔 − 𝑿𝒊,𝒕−𝒔−𝟏). (𝛈𝐢 + 𝛆𝐢,𝐭
)] = 𝟎𝐟𝐨𝐫𝐬=1 (1-9)
The consistency of the GMM estimator depends on two specification tests. The first is
the Hansen (1982) J-test of over-identifying restrictions. The joint null hypothesis is that the
instruments are jointly valid. A rejection casts doubt on the validity of the instruments.
The second test examines the hypothesis of no second-order serial correlation in the error
term of the difference Eq. (1-3) (Arellano and Bond, 1991). A satisfaction of the Hansen and
serial correlation diagnostic tests gives credence to the adequacy of our instruments.
The GMM estimators are typically applied in one and two-step variants (Arellano and
Bond, 1991). The one-step estimators use weighting matrices that are independent of the
estimated parameters, whereas the two-step GMM estimator uses the so-called optimal
weighting matrices in which the moment conditions are weighted by a consistent estimate of
their covariance matrix. In our study, we use the two-step GMM estimator, which is
asymptotically efficient and robust to all kinds of heteroscedasticity (Asiedu and Lien, 2011).
Furthermore, following the results of Roodman (2009) on the number of instruments to be
used for GMM, a limited number of instruments was used in a collapse matrix format.
To check whether the results obtained are sensitive to changes in the period of
estimation by accounting for the effect of business cycle, we re-estimate the empirical models
using data averaged within countries over five-year period, so that there are five observations
per country over the 1985 to 2009 period (1985-1989, 1990-1994,1995-1999,2000-
2004,2005-2009, which yield 85 observations.

17
3.2 Data
Depended variable
Following Alexeev and Conrad (2011) and Gui-Diby (2014) we use the logarithmic
value of the purchasing power parity (PPP)-converted gross domestic product (GDP) per
capita at 2005 constant price to measure economic performance .This measurement allows us
to take into account price differences between countries and to provide an assessment of the
real volume of the GDP.
Foreign direct investment (FDI)
Most of empirical studies in the relation between FDI and growth have used the net
FDI inflows (with FDI outflows subtracted), as a percentage of host country GDP (Adewumi,
2006, Alfaro et al., 2004, Azman-Saini et al., 2010; Uduak et al., 2014; Asongu, 2016).
According to the World Bank, FDI refers to the net inflows of investment to acquire a lasting
management interest (10 percent or more of the voting stock) in an enterprise operating in an
economy other than that of the investor and can be further developed as the sum of equity
capital, reinvestment of earnings, other long-term capital, and short-term capital as shown in
the balance of payments.Net FDI inflows include new investment from foreign investors less
disinvestment. Net FDI flows can therefore be negative if disinvestment exceeds new foreign
investment in a country. However, the regression sample includes just 46 observations that are
negative. We use Net FDI inflows as a percentage of GDP as proxy of FDI and we expect an
ambiguous sign of its coefficient.
Government expenditure (GOV)
A large part of the empirical growth literature has examined the impact of government
expenditure on economic growth. Overall, the evidence on the nature of the relationship is
mixed. Brahim and Rachdi (2014) show a positive impact of government expenditure on
growth in the case of the MENA region. However, Eken et al. (1997) find that the effect of
government expenditures is negative in non-oil –exporting countries and positive in oil
exporting countries. We use a general government final consumption expenditure as
percentage of GDP which includes all government current expenditures for purchases of
goods and services (including compensation of employees) and expenditures on national
defense and security, but exclude government military expenditures that are part of

18
government capital formation (WDI). The sign of government expenditure coefficient is
expected to be ambiguous.
Human capital (SEC)
The importance of human capital to economic growth is highlighted by several studies
(Blomstrom et al., 1992,Feeny et al., 2014). In addition to a direct impact on economic
growth, human capital can be critical for absorbing foreign knowledge and is an important
determinant of whether positive FDI spillovers will be realized. Borensztein et al. (1998)
argue that countries need to reach a certain threshold level of human capital in order to
experience positive the effect of FDI. This finding is confirmed by Li and Liu (2005) which
assert that human capital is very important for inward FDI to positively promote economic
growth in developing countries. Human capital has been measured in various ways inthe
literature. Average years of schooling and school completion rates from Barro and Lee (2001)
are often favored. In our study we use the Secondary school enrollment (% gross) to capture
human capital since these data are widely available for the MENA countries under
consideration and we anticipate a positive relationship between secondary school enrolment
and growth. According to the WDI, Secondary School enrollment (% gross) is the total
enrollment in secondary education, regardless of age, expressed as a percentage of the
population of official secondary education age.
Population (POP)
Many studies have confirmed the positive relationship between per capita income and
urbanization levels. Hytenget (2011) shows that urbanization impacts GDP per capita
positively in the case of 47 SSA countries over the period 1970 to 2009. Arouri et al. (2014)
find that there is an inverted U-shape relationship between urbanization and economic
development in African countries. In the first stage of development, urbanization improves
economic growth, in the second stage there is a negative correlation between urbanization and
economic growth. However, they observe in the case of North African countries that GDP per
capita is strictly increasing with urban population share. Thus, in our study we include the
growth of urban population in annual percentage as a proxy of the population. The sign of the
population coefficient is expected to be positive. According to the World Bank urban,
population refers to people living in urban areas as defined by national statistical offices. It is
calculated using World Bank population estimates and urban ratios from the United Nations
World Urbanization Prospects.

19
Domestic investment (GCF)
Several studies have highlighted the important role of domestic investment in
enhancing economic growth (Adams, 2009, Tang et al., 2008 and Feeny et al., 2014). For
example, Gui-Diby(2014) show a positive impact of domestic investment in African countries
during the period from 1980 to 2009, Brahim and Rachdi (2014) reach the same result based
on a sample of 19 MENA countries over the period 2008 -2011. We use gross domestic
investment as a percentage of GDP as proxy of investment4. “Gross capital formation consists
of outlays on additions to the fixed assets of the economy plus net changes in the level of
inventories. Fixed assets include land improvements (fences, ditches, drains, and so on);
plant, machinery, and equipment purchases; and the construction of roads, railways, and the
like, including schools, offices, hospitals, private residential dwellings, and commercial and
industrial buildings. Inventories are stocks of goods held by firms to meet temporary or
unexpected fluctuations in production or sales, and "work in progress."(World Bank5).
Capital control (KAOPEN)
This measure was taken from Chinn and Ito (2008). It is scaled in the range between
−2.5 and 2.5, with higher values standing for higher degrees of financial openness. One of the
merits of the KAOPEN index is that it refers to the intensity of capital controls because it
incorporates other types of restrictions such as current account restrictions, not just capital
account controls. The data was available for 181 developed and developing countries for
1970–2008 and updated to 2011.
Institutional quality (INS)
In the literature, many measurements for institutional quality are employed by
researchers. One of the most widely used measures is obtained from the International Country
Risk Guide (ICRG). Following Knack and Keefer (1995), we use this database. We employ
the index of political risk as proxy of institutional quality. It is ranged from zero to one
hundred. The highest overall rating (theoretically, 100) indicates the lowest risk, and the
lowest score (theoretically, 0) indicates the highest risk.
4Some studies use the investment share of PPP GDP per capita at current prices from the Penn World Table
(PWT 7.1). 5Emphasis from original.

20
Data on the dependent variable (per capita GDP (PPP)), net FDI inflows as a percentage
of GDP (FDI) and the control variables (including, urban population growth in annual
percentage (POP), general government final consumption expenditure to GDP (GOV), gross
domestic investment as a percentage of GDP (GCF), and secondary gross school enrollment
ratio (SEC)) are collected from World Development Indicators published by the World Bank
(2011) online database. Data on institutional quality (INS) are from the International Country
Risk Guide (ICRG) published by the Political Risk Services (PRS Group) and data on capital
control is obtained from Chinn and Ito (2008). Full details of data sources and definitions are
reported in Table (1-1) of the Appendix.
3- Empirical results
4.1 Descriptive statistics
The descriptive statistics of the variables is presented in Table 1-2. These descriptive
statistics is presented for the entire sample as well as for the GCC countries and for the non
GCC countries. The information in the table shows that the variations of per capita GDP and
FDI in the percentage of GDP are quite high as their standard deviations exceed the average
and their related coefficients of variation are above 1.1. There is considerable variation in log
per capita GDP across countries, ranging from 7.5024 in Yemen (1990) to 11.3689 in the
United Arab Emirates (U.A.E) (in 1985). The average of net inflows of FDI is 2.14 percent of
GDP, with a standard deviation of 3.88. The maximum value of net inflows of FDI is from
Bahrain (33.56 in 1996). The U.A.E exhibits the highest value of institutional quality (highest
scoring: 0.79), whereas the lowest index value is observed in Lebanon (lowest scoring: 0.1).
Furthermore, the table reveals that the average per capita GDP is lower in Non GCC countries
relative to GCC countries, although the level of FDI in these countries is higher. The statistics
also reveal a greater degree of financial openness, higher levels of human capital, urbanization
and institutional quality in GCC countries.
Table 1-3 present the pairwise correlation coefficients of the variables that are
analyzed, and suggests that there is a positive, but weak correlation between FDI and per
capita GDP for MENA countries for the period 1985-2009. The variation of per capita GDP is
more strongly correlated with secondary gross school enrollment, urbanization and financial
openness. Based on this descriptive analysis, the impact of FDI on economic growth remains
questionable as this variable does not necessarily explain a significant portion of the

21
variability of the dependent variable per capita GDP given that the correlation coefficients and
growth rates do not suggest such a conclusion.
In the following tables we report results of our estimation using the system GMM
estimator. Before discussing the estimation results, we must confirm the validity of the
instruments. Indeed, the GMM system regressions satisfy both the Hansen test of over-
identifying restrictions and the second order serial correlation test (AR(2)). In all
specifications of the Hansen test, we do not reject the null hypothesis that our instruments are
valid. Moreover, the AR (2) test fails to reject the null hypothesis that there is no second order
correlation in the first-differenced residuals. In the light of the overwhelming failure to reject
the null hypothesis, the models seem correctly specified.
Tables 1-4 present the results of the direct effect of FDI on per capita GDP income, as
well as whether the FDI-growth relationship is different in Non-GCC countries. Tables 1-5
and 1-6 report respectively, the results of regressions analyzing the influence of financial
openness and institutional qualities on the role FDI in economic growth. In each table, we
report empirical results of GMM-system estimators based on both annual and five year
average data.
4.2 The direct effect of FDI on per capita GDP income
Results of annual data are provided in columns 1-4, while the results of five-year
average data are reported in columns 5-8. The first regression (Column 1) is run by including
all of the control variables, namely: human capital, domestic investment, government
expenditure, urban population and the lagged of log per capita GDP. Results indicate that as
expected the level of urbanization and human capital have positive associations with growth,
the coefficient attached to these variables are all statistically significant (at the 10% and 5%
levels, respectively). For example, a 10% increase in Secondary School enrollment is
associated with (on average) about a 3% increase in per capita income growth. However the
coefficient attached to the domestic investment is positive and significant only when we use
the five-year average data set.
Column 2 in Tables1-4 shows the results of the Eq.1-1 where we include the
explanatory variable FDI/GDP and we control for human capital, domestic investment,
government expenditure, urban population and the lagged of log per capita GDP. We note that

22
∂LGDP /∂FDI =β1and therefore the parameter of interest is the estimated coefficient of FDI,
β1, which is positive and significant at the 1% level, suggesting that everything being equal,
FDI improves per capita GDP in the MENA region. A one standard deviation increase in FDI
(sd = 3.88, see Table 1-4) is expected to increase income per capita by about 0.08percentage
points [∂ LGDP /∂FDI =0.021*3.88=0.08]. We use an example to provide the reader with a
better sense of the positive effect of FDI on per capita GDP in the region. Specifically, we
consider two countries in the MENA region that have extremely different levels of FDI net
inflows: Iran and Qatar. The average value of FDI net inflows from 1985 to 2009 is about
0.52 for Iran and 2.33 for Qatar. Then, the estimation result of the regression (Column 2)
shows that everything being equal, an increase in FDI inflows from the level of Iran to the
level of Qatar will increase per capita GDP by about 0.038 percentage points in the short run
and by about 0.82 percentage points in the long-run. This follows from the fact that the short-
run effect of a change in FDI on per capita GDP is given by (𝛽1̂ ∗ ∆) and the long-run effect
is (𝛽1̂∗∆)
1−∝̂ Where 𝛽1̂ is the estimated coefficient of FDI and ∝̂ is the estimated coefficient of
LGDPi,t-1.Here, =[2.33-0.52] and from Table [4-4] 𝛽1̂ = 0.021 and ∝̂= 0.954. Then ∂LGDP
/∂FDI=[0.021*(2.33-0.52)=0.038] in the short period and 92.4 [0.021* (2.33-0.52)/1-
0.954=0.82] in the long period.
Results reveal also that the estimated coefficient of lagged GDP ∝̂ is positive,
suggesting that the current value of per capita GDP is positively correlated with future per
capita GDP. Note that a one unit increase in the level of current FDI inflows on current GDP
is equal to 𝛽1̂ and the long effect is 𝛽1̂
1−∝̂. Since 𝛽1̂ <
𝛽1̂
1−∝̂. , this result implies that past levels of
FDI inflows have less than proportionate impact on current and future per capita GDP ,
however the effects subsides over time. Urban population remains significantly positive.
We now discuss if the effect of FDI in Non-GCC countries is significantly different
from the GCC countries. In Column 3, we include in addition to FDI variable, the interaction
term between FDI and the Non- GCC (FDI*Non-GCC) region to compare the effect of FDI
on per capita income in the Non GCC region with the GCC region. Results indicate that FDI
remains positive and statistically significant at 1%. The coefficient attached to the FDI
variable suggests that a 10% increase in FDI is associated with (on average) about a 3.8%
increase in per capita income growth. In contrast, the coefficient attached to the FDI-Non
GCC interaction variable is negative, large and statistically significant. Since the coefficient
on the FDI-Non GCC interaction is in absolute terms larger than the coefficient on the FDI

23
variable, the results imply that FDI has a negative association with growth in the Non GCC
countries.
In Column 4, we interact the GOV variable with a GCC dummy variable to examine
whether the effect of government consumption on per capita GDP is different for this region
than it is in the Non GCC region. We show that while the coefficient of government
consumption is negative and statistically significant at the 5% level, the coefficient associated
to interaction term is positive and statistically significant at the 5% level. This result that is
consistent with Eken et al. (1997) which find that the effect of government expenditures is
negative in non-oil –exporting countries and positive in oil exporting countries.
The results of five year average data are robust and consistent with annual data set for
all control variables Furthermore, the coefficient of FDI remains positive and statistically
significant and the coefficient of the FDI-Non GCC interaction variable is negative and
statistically significant. In sum, the effect of FDI on per capita income in the GCC region is
positive but negative in Non GCC countries. This result is confirmed by using an annual data
set and a five year average data.
There are a number of explanations as to why the impact of FDI in Non GCC is
different from that in GCC countries. One explanation is that in the Non GCC region, FDI
flows were mainly hosted by countries with low value added in the manufacturing sector.
Another explanation is that the profits from FDI may have been repatriated overseas rather
than re-invested in the Non-GCC countries. Furthermore, the negative impact of foreign
inflows in these economies could be related with the difficulties that these countries face in
improving their business environment. Toone (2013) suggests that among the primary factors
contributing to the upsurge in FDI in the GCC were the liberal FDI policies adopted by GCC
member states. He asserts that the GCC countries have successfully promoted open FDI
regimes while simultaneously maintaining regulatory control over strategic economic sectors,
particularly in the areas of labor regulation and resource management. Thus, in the following,
we test the role of financial openness and institutional qualities in the FDI-growth
relationship.
4.3 FDI and growth: the role of capital account liberalization
The estimation in Tables 1-5 provide evidence of the growth effects of capital account
openness in the MENA region as well as the result of the influence of capital control on the

24
FDI-growth relationship. We report the results of annual data in Columns 1-6 and in Columns
7-12 we present the results of five year average data.
Column 1 shows that the estimated coefficient of KAOPEN is positive and significant at the
1% level, suggesting a positive effect of capital account liberalization on growth. The findings
also show that ceteris paribus, a one standard deviation increase in KOPEN (sd = 1.75 Table
1-2) will increase GDP per capita by about 0.16 percentage points [∂ LGDP /∂KAOPEN
=0.094*1.75=0.16].
Furthermore, to test whether capital account liberalization affects growth in non-GCC
and GCC countries similarly, we include the interaction term between the index of capital
openness and Non GCC dummy variable (KAOPEN*Non-GCC). Results as reported in
Column 2 indicate that while the coefficient related to KAOPEN remains positive and
statistically significant at the 1% level, the coefficient of KAOPEN-Non GCC variable is
negative and statistically significant at the 1% level. However, given the size of the
coefficient on these variable (0.361>0.341), these results suggest that the impact of capital
account openness is positive, but it is much smaller than for GCC countries. This further
implies that the effect of financial openness on per capita income in the Non-GCC countries is
less than in the GCC countries.
The effect of FDI as well as that of financial openness on per capita GDP in the
MENA region remain positive when we include the FDI and KAOPEN variables
simultaneously(see Columns 3 and 9). Then to check whether the growth effect of FDI in the
MENA region is sensitive to the degree of financial openness, the variable KAOPEN is
interacted with FDI inflows. As reported in Column 4 (and 10 for the five year average data),
the coefficient corresponding to the interaction term is negative and statistically significant,
suggesting that MENA countries with capital controls are likely to benefit more from the
effect of FDI on growth. However, when we interact KAOPEN with FDI in Non GCC and
GCC countries separately, we find that the estimate for Non GCC countries is negative and
statistically significant (-0.006) and that of the GCC countries is positive and statistically
significant (0.011). This implies that the financial openness policy in GCC countries has
increased the benefits of FDI on per capita income. Nevertheless such policies have reduced
the benefits of FDI on growth in the Non-GCC region. These results are consistent with those
obtained by the five –year average data (see Column 11 and 12 in Tables 1-5.
Thus, the rapid increase of growth into the GCC can be attributed in part to: (i) the
financial openness policies which were undertaken in the 1980s as part of the structural
adjustment programs of the IMF and World Bank and (ii) the legal and institutional changes

25
adopted by GCC governments during the past fifteen years. The GCC experience
demonstrates that while liberal policies are in no doubt essential for the promotion of FDI,
they can be supplemented with strategic regulatory controls that protect local investors and
ensure long-term economic stability.
The negative effect of capital account liberalization in the FDI- growth relationship in
Non GCC can be explained by the fact that most of these countries that have engaged in the
process of financial reforms have poor quality of institutions. This fact is reflected by their
comparatively low levels of governance quality in the Worldwide Governance Indicators.
In what follows, we try to test whether institutional quality can influence the capital account
liberalization-growth nexus.
4.4 Capital account and growth: the role of institutional quality
Tables 1-6 report the results of the regression analyzing the direct effect of
institutional quality on income per capita and their influence on the role of capital account
policies in promoting growth. Results of annual data are provided in Columns 1-3, while the
results of five-year average data are presented in Columns 4-6.
Column 1 shows that the effect of institutional quality on income per capita in the
MENA region is positive with coefficient of 0.015 that is statically significant at 1% level. A
one standard deviation increase in institutional quality (sd = 11.99 Table 4-2) will increase the
income per capita by about 0.18 percentage points in the MENA region [∂LGDP/∂ INS
0.015*11.99=-0.18].Furthermore, we provide an example to illustrate the catalyzing effect of
institutions in enhancing the per capita income. Consider two countries in the MENA region
that differ significantly in terms of institutions: (i) Lebanon, a country with very poor
institutions and (ii)Oman, a country with the best institutions in the region. The average
values of the measures of institutions (ICRG index) from 1985-2009 for the two countries are:
46.61 in Lebanon and 69.63 in Oman. Everything being equal, an improvement in the
institutional quality in Lebanon to the level of Oman will increase per capita income by about
0.34 percentage points [0.015 (69.63-46.61) =0.34].
To see if the effect of institutions significantly differs in Non-GCC region than the
GCC region, we enter the interaction term between the institutional variable and the Non-
GCC dummy. Column 2 (and 5 for five year average data) suggests that while, the coefficient
of institutional variable remains positive and statistically significant, the interaction term
between INS*Non-GCC is negative and statically significant at 1% level. More precisely
given the size of the coefficient on these variable (0.0078>0.0074), these results suggest that

26
the impact of institutions on per capita income is positive in the Non-GCC region, but it is
much smaller than for GCC countries. These findings are confirmed when we use the five
year average data. As apparent in Tables 1-2, the average values of the measures of
institutional quality in the GCC and Non-GCC are 11.84 and 10.56 respectively. It follows
that everything being equal, a one standard deviation increase in institutional quality will
increase the income per capita by about 0.17 percentage points in the GCC region [∂LGDP/∂
INS 0.015*11.84=0.17] and by about 0.15 percentage points in the Non- GCC region
[∂LGDP/∂ INS 0.015*10.56=0.15].
As a final exercise and to capture the complementary effect of financial openness and
institutional quality on growth, we add an interaction term between capital openness and
institutional variable (KAOPEN*INS). The results show that the coefficient of the interaction
term between these two variables is positive and statistically significant at 1% level. This
result is confirmed by using the five year average data (Column 6) and implies that
institutional quality further enhances the positive effect of capital openness on growth in the
MENA region: a result which is in line with previous studies (Klein, 2005; Chinn and Ito,
2002) which demonstrated that institutional conditions matters in the Capital Account
Liberalisation (CAL) and per capita income relationship. Overall, countries with a higher
degree of institutional development benefit more from financial liberalization than those with
a lower degree.
5. Conclusion
In this study, we have investigated the effect of FDI inflows on growth, taking into
account the role of financial openness and institutional quality. The following findings have
been established. First, FDI inflows have contributed to the growth of the GCC region and
have adversely affected growth in the Non-GCC countries. Secondly, using the interaction
terms between capital openness and FDI, we have found that the financial openness policy in
GCC countries has increased the benefits of FDI on per capita income, and reduced the
benefits of FDI on growth in Non-GCC region. Thirdly, we have also established that the
impact of institutions on per capita income in the Non-GCC region is less than that in other
countries in the GCC region. Finally, when we have assessed whether institutional quality
matters for capital account liberalization and growth relationship to show that institutional
quality further boosts the positive effect of capital openness on growth.
With regard to policy, our results suggest that capital account policy in Non-GCC
countries must be embedded within a sound institutional and financial framework .Thus,

27
governments in this region should develop a set of policies that are not only focused on
capital account openness but also on the improvement of political framework, which
constitutes a necessary precondition for successful capital account liberalization and attraction
of FDI which is considered as an engine of growth. These states must undertake measures that
can help to: (i) fight corruption;(ii)enhance the protection of property rights; (iii)increase the
respect for law and the impartiality of the legal system and(iv)improve other aspects of the
institutional environment. Our results are in line with Fratzscher and Bussiere (2004) who
have stressed the importance of domestic institutions, the size of FDI and the financial
openness in boosting economic growth . This result has important implications for countries
in the MENA region given that most of the countries in the region which are in dire need of
FDI have weak institutions (Gammoudi and Cherif,2015).

28
Figure 1 : FDI net inflows in selected regions, 1970-2011
(in billions of current US$)
Source: WDI and author’s calculations
Figure 2 :Evolution of FDI inflows in theMENA region
Source: WDI and author’s calculations
0 100 200 300FDI net inflows (in billions of current US$)
Sub-Saharan Africa
Middle East & North Africa
Latin America & Caribbean
East Asia & Pacific
Europe & Central Asia
02
46
8
FD
I, n
et
inflow
s (
% o
f G
DP
)
1970 1980 1990 2000 2010Year

29
Figure 3: GDP per capita, PPP (constant 2005 International US$) (Average data :
1985-2009)
0
20,000
40,000
60,000
80,000
GD
P p
er
capita, P
PP
(consta
nt 2005 Inte
rnational U
S$)
U.A
.E
Qata
r
Kuw
ait
Bahra
in
Saoudi A
rabia
Om
an
Lib
ya
Turk
ey
Lebanon
Iran
Alg
eria
Tunis
ia
Jord
an
Egypt
Syria
Maro
co
Yem
en

30
Table 1-1Data description and sources
Variable Description Proxy Source Expected sign
Growth The natural logarithm of GDP per capita, PPP (constant 2005
international $)
LGDP WDI(2011)
FDI Net FDI inflows as a percentage of GDP FDI WDI(2011) (+)/ (-)
Human capital School enrollment, secondary (% gross) SEC WDI(2011) (+)
Domestic investment Gross domestic investment as a percentage of GDP GCF WDI(2011) (+)
Government expenditure General government final consumption expenditure to GDP GOV WDI(2011) (+)/(-)
Population Urban population growth (annual %) POP WDI(2011) (+)
Capital account liberalization Capital openness index measuring the extent of openness in capital
account transactions
KAOPEN Chinn and Ito
(2008)
(+)/(-)
Institution qualities Political risk index INS ICRG (2008) (+)

31
Table 1-2 Summarystatistics
Variables Obs Mean Std.Dev Min Max
LGDPP 393 9.1623 0.9853 7.5024 11.3689
SEC 322 72.18474 20.74493 25.12675 114.8685
POP 421 3.637981 2.531282 -2.948278 17.74491
GOV 365 18.51184 6.863613 7.5156 76.2221
GCF 388 23.53369 6.620468 7.9052 46.2682
FDI 393 2.147137 3.881058 -5.28819 33.566
KAOPEN 397 .5655672 1.75367 -1.83119 2.50001
INS 420 60.7625 11.9903 10.6667 79.1667
Non GCC countries
LGDPP 253 8.5366 0.5163 7.5024 10.7282
SEC 210 65.57335 18.20823 30.77665 112.6223
POP 275 2.99103 1.570227 .7273965 12.86543
GOV 238 15.78053 3.948783 7.5156 28.8754
GCF 251 24.3317 6.351928 9.92224 46.2682
FDI 243 2.101644 3.629748 -5.11178 23.5374
KAOPEN 253 -.381102 1.487954 -1.83119 2.50001
INS 270 57.97191 11.84348 10.6667 75
GCC countries
LGDPP 140 10.2930 0.5048 9.5380 11.3689
SEC 112 84.58112 19.55842 25.12675 114.8685
POP 146 4.856555 3.407525 -2.948278 17.74491
GOV 127 23.63036 8.140358 10.11 76.2221
GCF 137 22.07164 6.872258 7.9052 41.8557
FDI 150 2.220836 4.26855 -5.28819 33.566
KAOPEN 144 2.228812 .4934496 1.16699 2.50001
INS 150 65.78555 10.56115 34 79.1667
LGDPP is the natural logarithm of GDP per capita, FDI is the net FDI inflows as a percentage of GDP, GCF is the gross domestic investment as a percentage of GDP,
GOV is the general government final consumption expenditure to GDP, POP is the urban population growth (annual %), KAOPEN is the measure of capital account
liberalization from Chin and Ito(2008) and INS is the political risk index given from the ICRG.

32
Table 1-3 Pairwisecorrelation coefficients
Per capita
GDP LGDP SEC POP GOV GCF FDI KAOPEN INS
Per capita GDP 1.0000
LGDP 0.9662* 1.0000
SEC 0.5895* 0.5684* 1.0000
POP 0.2909* 0.2932* 0.0647 1.0000
GOV 0.3805* 0.3865* 0.1502* -0.0254 1.0000
GCF -0.0756 -0.0858 -0.0878 0.0267 -0.1641* 1.0000
FDI 0.0446 0.0390 0.3123* 0.0626 -0.0947 0.1117* 1.0000
KAOPEN 0.5955* 0.5677* 0.4633* 0.2742* 0.3991* -0.115* 0.2158* 1.0000
INS 0.3094* 0.2623* 0.3581* 0.1421* -0.0522 0.0128 0.2176* 0.1891* 1.0000
Note(*) means that the correlation coeifficient is significant at 5% level
LGDPP is the natural logarithm of GDP per capita, FDI is the net FDI inflows as a percentage of GDP, GCF is the gross domestic
investment as a percentage of GDP, GOV is the general government final consumption expenditure to GDP, POP is the urban
population growth (annual %), KAOPEN is the measure of capital account liberalization from Chin and Ito(2008) and INS is the
political risk index given from the ICRG.

33
Variables Table 1-4 The direct effect of FDI
Dependent variable Log of per capita GDP (PPP)
Annual data 5- year average data c
(1) (2) (3) (4) (5) (6) (7) (8)
LGDPP(t-1) 0.938
(0.000)***
0.954
(0.000)***
0.950
(0.000)***
0.892
(0.000)***
0.937
(0.000)***
0.982
(0.000)***
0.977
(0.000)
0.927
(0.000)***
FDI 0.021
(0.000)***
0.038
(0.000)***
0.007
(0.017)**
0.0021
(0.080)** 0.015
(0.001)***
0.10
(0.054)**
SEC 0.003
(0.036)**
0.001
(0.216)
0.001
(0.195)
0.0003
(0.647)
0.0007
(0.643)
0.0006
(0.10)*
0.0002
(0.630)
-0.0002
(0.821)
POP 0.011
(0.072)*
0.014
(0.041)**
0.004
(0.280)
0.002
(0.698)
0.009
(0.041)**
0.006
(0.007)***
0.003
(0.057)*
0.0003
(0.933)
GCF 0.002
(0.211)
0.000
(0.988)
-0.001
(0.197)
0.0007
(0.808)
-0.003
(0.228)
0.001
(0.003)***
0.0007
(0.493)
0.004
(0.173)
GOV -0.006
(0.060)*
-0.004
(0.088)*
-0.008
(0.006)***
-0.025
(0.012)**
-0.0016
(0.681)
0.0005
(0.764)
0.001
(0.275)
-0.011
(0.005)
GOV*GCC 0.018
(0.014)**
0.014
(0.012)**
FDI*NONGCC -0.039
(0.000)***
-0.012
(0.012)*
constant 0.35
(0.119)
0.325
(0.163)
0.518
(0.019)**
1.23
(0.111)
0.295
(0.453)
0.048
(0.682)
0.134
(0.043)**
0.680
(0.054)*
AR(2)a 0.10 0.10 0.69 0.22 0.47 0.47 0.75 0.58
Hansenb 0.33 0.52 0.53 0.70 0.70 0.53 0.22 0.59
Number of instrumens 10 13 14 11 8 14 17 11
Number of
observations
278 264 264 264 68 66 66 66
Note: p-values in parenthesis. ***, **, * refer to the 1, 5 and 10% levels of significance respectively.
The model is estimated with the two-step Arellano-Bond GMM dynamic panel methodology which is asymptotically efficient and robust for all kinds of
heteroskedasticity. a The null hypothesis is that the errors in the first difference regression exhibit no second order correlation.
b The null hypothesis is that the instruments are not correlated with the residuals.
c- regression is based on 5-years averages for the period 1985-1989, 1990-1994,1995-1999,2000-2004,2005-2009
LGDPP is the natural logarithm of GDP per capita, FDI is the net FDI inflows as a percentage of GDP, GCF is the gross domestic investment as a percentage of
GDP, GOV is the general government final consumption expenditure to GDP, POP is the urban population growth (annual %), KAOPEN is the measure of capital

34
account liberalization given from Chin and Ito(2008) andINS is the political risk index given from the ICRG.

35
Table 1-5 FDI , CAL (Capital Account Liberalisation) and interaction
Variables Dependent variable Log of per capita GDP (PPP)
Anuual data 5- year average data c
(1) (2) (3) (4) (5) (6) (7) (8) (9) (10) (11) (12)
LGDPP(t-1) 0.765
(0.000)***
0.583
(0.000)***
0.833
(0.000)***
0.846
(0.000)***
0.783
(0.000)***
0.791
(0.000)***
0.904
(0.000)***
0.938
(0.000)***
0.917
(0.000)***
0.930
(0.000)***
0.969
(0.000)***
0.985
(0.000)***
FDI 0.015
(0.002)***
0.087
(0.017)**
-0.005
(0.134)
0.011
(0.001)***
0.038
(0.094)*
0.057
(0.078)*
-0.005
(0.251)
0.011
(0.054)*
SEC 0.004
(0.009)***
0.006
(0.004)***
0.002
(0.018)**
0.001
(0.490)
0.0035
(0.018)**
0.0031
(0.047)**
0.001
(0.339)
0.002
(0.052)*
-0.0000
(0.391)
-0.0004
(0.655)
-0.0001
(0.832)
-0.0002
(0.754)
POP 0.020
(0.022)**
0.005
(0.431)
0.001
(0.830)
0.009
(0.076)*
0.008
(0.245)
0.015
(0.04)**
0.005
(0.067)*
-0.001
(0.822)
-0.003
(0.546)
-0.002
(0.398)
-0.001
(0.699)
0.037
(0.308)
GCF 0.005
(0.029)**
0.007
(0.006)***
0.004
(0.002)***
-0.0005
(0.857)
0.004
(0.052)*
0.004
(0.089)*
0.001
(0.324)
0.0004
(0.817)
0.003
(0.213)
0.002
(0.398)
-0.003
(0.226)
0.0009
(0.744)
GOV -0.003
(0.528)
-0.016
(0.006)***
-0.007
(0.051)*
-0.009
(0.035)**
-0.003
(0.421)
-0.002
(0.592)
0.002
(0.486)
-0.004
(0.145)
0.001
(0.370)
0.001
(0.659)
-0.004
(0.188)
-0.004
(0.016)**
KAOPEN 0.094
(0.004)***
0.361
(0.001)***
0.086
(0.008)***
0.10
(0.004)***
0.091
(0.008)***
0.095
(0.008)***
0.048
(0.000)**
0.152
(0.030)**
0.033
(0.008)***
0.040
(0.035)**
0.015
(0.076)*
0.023
(0.005)***
KAOPEN*NONGCC -0.346
(0.002)***
-0.147
(0.032)**
FDI*NONGCC -0.030
(0.002)***
-0.064
(0.009)***
-0.039
(0.077)*
-0.043
(0.096)*
FDI*KAOPEN -0.024
(0.010)**
-0.008
(0.039)**
FDI*KAOPEN*GCC 0.011
(0.013)**
0.016
(0.004)***
FDI*KAOPEN*NONGCC -0.006
(0.004)***
-0.004
(0.016)**
constant 1.69
(0.001)***
3.23
(0.000)***
1.36
(0.018)**
1.40
(0.024)**
1.63
(0.003)***
1.52
(0.006)***
0.711
(0.001)***
1.27
(0.034)**
0.651
(0.011)**
0.560
(0.064)*
0.468
(0.000)***
0.179
(0.317)
AR(2) a 0.14 0.82 0.11 0.26 0.34 0.12 0.24 0.97 0.33 0.35 0.64
Hansenb 0.53 0.33 0.38 0.62 0.49 0.42 0.77 0.65 0.66 0.48 0.31
Number of instrumens 11 12 15 15 13 13 13 14 15 16 17
Number of observations 277 277 263 263 263 263 68 68 66 66 66
Note: p-values in parenthesis. ***, **, * refer to the 1, 5 and 10% levels of significance respectively.
The model is estimated with the two-step Arellano-Bond GMM dynamic panel methodology which is asymptotically efficient and robust for all kinds of heteroskedasticity. a The null hypothesis is that the errors in the first difference regression exhibit no second order correlation.
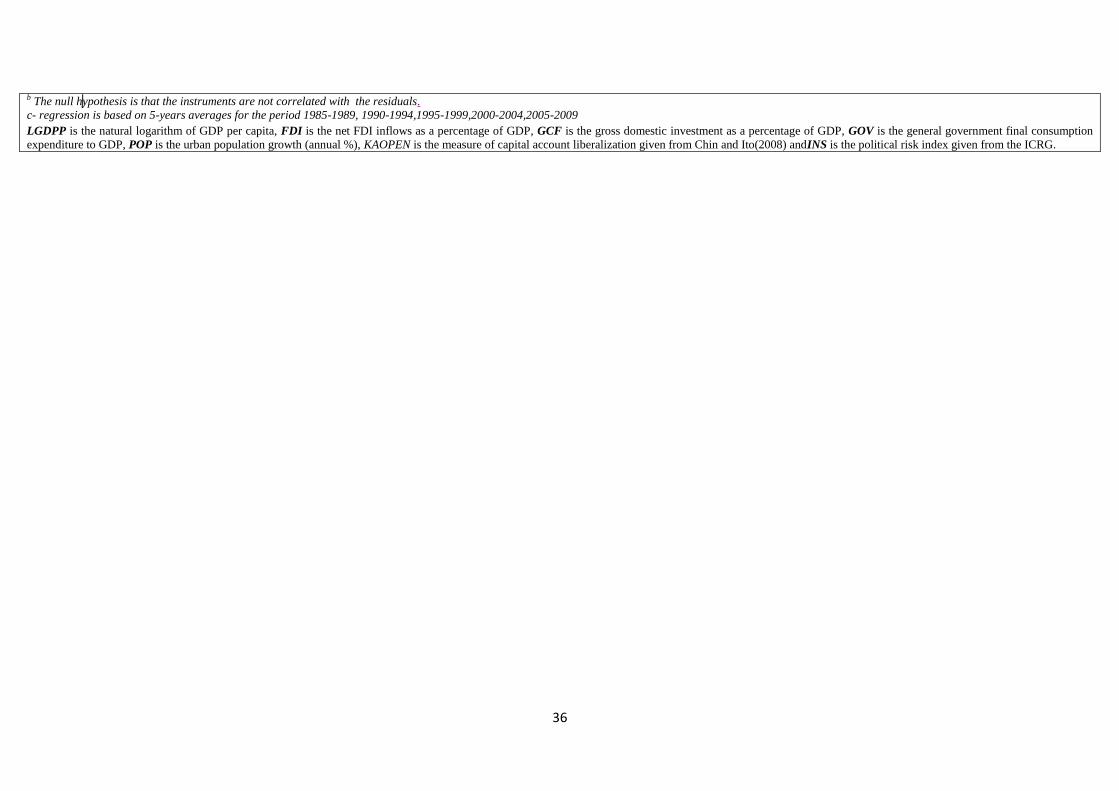
36
b The null hypothesis is that the instruments are not correlated with the residuals.
c- regression is based on 5-years averages for the period 1985-1989, 1990-1994,1995-1999,2000-2004,2005-2009
LGDPP is the natural logarithm of GDP per capita, FDI is the net FDI inflows as a percentage of GDP, GCF is the gross domestic investment as a percentage of GDP, GOV is the general government final consumption
expenditure to GDP, POP is the urban population growth (annual %), KAOPEN is the measure of capital account liberalization given from Chin and Ito(2008) andINS is the political risk index given from the ICRG.

37
Variables Table 1-6 Institutions, CAL(Capital Account Liberalisation) and interaction
Dependent variable Log of per capita GDP (PPP)
Anuual data 5- year average data c
(1) (2) (3) (6) (7) (8) LGDPP(t-1) 0.893
(0.000)***
0.821
(0.000)***
0.899
(0.000)***
0.992
(0.000)***
0.805
(0.000)***
0.906
(0.000)***
FDI 0.018
(0.007)***
0.040
(0.055)*
SEC 0.0002
(0.871)
0.0006
(0.363)
0.001
(0.367)
0.0000
(0.962)
0.002
(0.108)*
-0.0004
(0.653)
POP 0.029
(0.005)***
0.002
(0.559)
-0.008
(0.232)
0.005
(0.079)*
-0.002
(0.510)
-0.002
(0.706)
GCF -0.005
(0.347)
-0.0003
(0.811)
0.0005
(0.740)
-0.001
(0.240)
0.0007
(0.681)
-0.001
(0.651)
GOV -0.006
(0.083)*
-0.016
(0.000)***
-0.010
(0.004)***
0.0007
(0.813)
-0.005
(0.143)
0.0001
(0.963)
INS 0.015
(0.004)***
0.0078
(0.000)***
-0.0001
(0.951)
0.0007
(0.056)*
0.0051
(0.076)*
0.002
(0.140)
FDI*NONGCC -0.026
(0.008)***
-0.041
(0.073)*
INS*NONGCC -0.0074
(0.000)***
-0.0050
(0.009)***
KAOPEN*INS 0.0015
(0.002)***
0.0005
(0.001)***
constant 0.13
(0.479)
1.71
(0.000)***
1.02
(0.009)***
0.043
(0.46)
1.604
(0.007)***
0.755
(0.006)***
AR(2)a 0.11 0.14 0.11 0.45 0.34 0.36
Hansenb 0.12 0.25 0.48 0.73 0.68 0.64
Number of instruments 12 14 17 16 13 16
Number of observations 278 278 263 68 68 66
Note: p-values in parenthesis. ***, **, * refer to the 1, 5 and 10% levels of significance respectively.
The model is estimated with the two-step Arellano-Bond GMM dynamic panel methodology which is asymptotically efficient and robust for all kinds of heteroskedasticity. a The null hypothesis is that the errors in the first difference regression exhibit no second order correlation. b The null hypothesis is that the instruments are not correlated with the residuals.
c- regression is based on 5-years averages for the period 1985-1989, 1990-1994,1995-1999,2000-2004,2005-2009
LGDPP is the natural logarithm of GDP per capita, FDI is the net FDI inflows as a percentage of GDP, GCF is the gross domestic investment as a percentage of GDP, GOV is the general
government final consumption expenditure to GDP, POP is the urban population growth (annual %), KAOPEN is the measure of capital account liberalization given from Chin and Ito

38
(2008) and INS is the political risk index given from the ICRG.

39
References
Adams, S., 2009. Foreign Direct investment, domestic investment, and economic growth in Sub-
Saharan Africa. Journal of Policy Modeling 31(6), 939–949.
doi:10.1016/j.jpolmod.2009.03.003
Adewumi, S., 2006. The impact of FDI on growth in developing countries: An African experience.
Jönköping international business school.
Aitken, B.J., Harrison, A.E., 1999. Do Domestic Firms Benefit from Direct Foreign Investment?
Evidence from Venezuela. American Economic Review 89 (3), 605–618.
Alege, P.O., Ogundipe, A.A., 2014. Foreign Direct Investment and Economic Growth in
ECOWAS: A System-GMM Approach (SSRN Scholarly Paper No. ID 2476365). Social
Science Research Network, Rochester, NY.
Alexeev, M., Conrad, R., 2011. The natural resource curse and economic transition. Economic
Systems 35 (4), 445–461. doi:10.1016/j.ecosys.2010.10.003
Alfaro, L., 2003. Foreign direct investment and growth: Does the sector matter. Harvard Business
School 1–31.
Alfaro, L., Chanda, A., Kalemli-Ozcan, S., Sayek, S., 2004. FDI and economic growth: the role of
local financial markets. Journal of International Economics 64 (1), 89–112.
doi:10.1016/S0022-1996(03)00081-3
Arellano, M., Bond, S., 1991. Some Tests of Specification for Panel Data: Monte Carlo Evidence
and an Application to Employment Equations. The Review of Economic Studies 58 (2), 277–
297. doi:10.2307/2297968
Arellano, M., Bover, O., 1995. Another look at the instrumental variable estimation of error-
components models. Journal of Econometrics 68 (1), 29–51. doi:10.1016/0304-
4076(94)01642-D
Arouri, M.E.H., Youssef, A.B., Nguyen-Viet, C., Soucat, A., 2014. Effects of urbanization on
economic growth and human capital formation in Africa.PGDA Working Paper No. 119
Asiedu, E., Lien, D., 2011. Democracy, foreign direct investment and natural resources. Journal of
International Economics 84 (1), 99–111.
Asongu, S. A., 2013. Harmonizing IPRs on Software Piracy: Empirics of Trajectories in Africa.
Journal of Business Ethics, 118(1), 45-60.
Asongu, S. A., 2014. Financial development dynamic thresholds of financial globalization:
Evidence from Africa. Journal of Economic Studies, 41(2), 166-195.
Asongu, S. A., 2015. On Taxation, Political Accountability and Foreign Aid: Empirics to a
Celebrated Literature. South African Journal of Economics, 83(2), 180-198.
Asongu, S. A., 2016. Determinants of Growth in Fast-Developing Countries: Evidence from
Bundling and Unbundling Institutions. Politics & Policy, 44(1), 97-134.
Asongu, S. A., De Moor, L., 2016. Financial Globalisation Dynamic Thresholds for Financial
Development: Evidence from Africa. European Journal of Development Research.
http://link.springer.com/article/10.1057%2Fejdr.2016.10
Azman-Saini, W.N.W., Baharumshah, A.Z., Law, S.H., 2010. Foreign direct investment, economic
freedom and economic growth: International evidence. Economic Modelling 27 (5), 1079–
1089.
Balasubramanyam, V.N., Salisu, M., Sapsford, D., 1996. Foreign Direct Investment and Growth in
EP and is Countries. The Economic Journal 106 (434), 92
Barro, R.J., Lee, J.-W., 2001. International data on educational attainment: updates and
implications. Oxf. Econ. Pap. 53 (3), 541–563. doi:10.1093/oep/53.3.541
Belloumi, M., 2014. The relationship between trade, FDI and economic growth in Tunisia: An
application of the autoregressive distributed lag model. Economic Systems 38 (2), 269–287.
doi:10.1016/j.ecosys.2013.09.002

40
Bénassy-Quéré, A., Maylis Coupet, Thierry Mayer, 2005. Institutional Determinants of Foreign
Direct Investment. CEPII, Working Paper No 2005 – 05.
Bengoa, M., Sanchez-Robles, B., 2003. Foreign direct investment, economic freedom and growth:
new evidence from Latin America. European Journal of Political Economy, Economic
Freedom 19 (3), 529–545.
Blomstrom, M., Lipsey, R.E., Zejan, M., 1992. What Explains Developing Country Growth?
Working Paper No. 4132. National Bureau of Economic Research
Blundell, R., Bond, S., 1998. Initial conditions and moment restrictions in dynamic panel data
models. Journal of Econometrics 87 (1), 115–143. doi:10.1016/S0304-4076(98)00009-8
Borensztein, E., De Gregorio, J., Lee, J.-W., 1998. How does foreign direct investment affect
economic growth? Journal of International Economics 45 (1), 115–135.
Brahim, M., Rachdi, H., 2014. Foreign Direct Investment, Institutions and Economic Growth:
Evidence from the MENA Region. Journal of Reviews on Global Economics 3, 328–339.
Carkovic, M.V., Levine, R., 2002. Does Foreign Direct Investment Accelerate Economic Growth?
(SSRN Scholarly Paper No. ID 314924). Social Science Research Network, Rochester, NY.
Chinn, M.D., Ito, H., 2002. Capital account liberalization, institutions and financial development:
cross country evidence. National Bureau of Economic Research.
Chinn, M.D., Ito, H., 2008. A New Measure of Financial Openness. Journal of Comparative Policy
Analysis: Research and Practice 10 (3), 309–322. doi:10.1080/13876980802231123
Chowdhury, A., Mavrotas, G., 2006. FDI and Growth: What Causes What? World Economy 29
(1), 9–19. doi:10.1111/j.1467-9701.2006.00755.x
Durham, J.B., 2004. Absorptive capacity and the effects of foreign direct investment and equity
foreign portfolio investment on economic growth. European Economic Review 48 (2), 285–
306.
Eken, M.S., Helbling, T., Mazarei, A., 1997. Fiscal Policy and Growth in the Middle East and
North Africa Region (EPub). International Monetary Fund.
Feeny, S., Iamsiraroj, S., McGillivray, M., 2014. Growth and Foreign Direct Investment in the
Pacific Island countries. Economic Modelling 37, 332–339.
doi:10.1016/j.econmod.2013.11.018
Fratzscher, M., Bussiere, 2008. Financial Openness and Growth: Short-run Gain, Long-run Pain?.
Review of International Economics 16 (1), 69–95. doi:10.1111/j.1467-9396.2007.00727.x
Frimpong, J.M., Oteng-Abayie, E.F., 2006. Bivariate causality analysis between FDI inflows and
economic growth in Ghana [WWW Document]. URL http://mpra.ub.uni-muenchen.de/351/
(accessed 11.13.14).
Gammoudi, M., Cherif, M., 2015. Capital Account Openness, Political Institutions and FDI in the
MENA Region: An Empirical Investigation. Economics Discussion Papers, No 2015-10, Kiel
Institute for the World Economy. http://www.economics-
ejournal.org/economics/discussionpapers/2015-10
Gammoudi, M., Cherif, M., 2016. Threshold effects in the capital account liberalization and
foreign direct investment relationship. Middle East Development Journal 8 (1), 156–175.
doi:10.1080/17938120.2016.1151324
Gorg, H., Greenaway, D., 2004. Much ado about nothing? do domestic firms really benefit from
foreign direct investment? The World Bank research observer 19 (2), 171–197.
Gui-Diby, S.L., 2014. Impact of foreign direct investments on economic growth in Africa:
Evidence from three decades of panel data analyses. Research in Economics 68 (3), 248–256.
doi:10.1016/j.rie.2014.04.003
Hansen, H., Rand, J., 2006. On the Causal Links Between FDI and Growth in Developing
Countries. World Economy 29 (1), 21–41. doi:10.1111/j.1467-9701.2006.00756.x

41
Herzer, D., 2012. How Does Foreign Direct Investment Really Affect Developing Countries’
Growth? Review of International Economics 20 (2), 396–414. doi:10.1111/j.1467-
9396.2012.01029.x
Herzer, D., Klasen, S., Nowak-Lehmann D., F., 2008. In search of FDI-led growth in developing
countries: The way forward. Economic Modelling 25 (5), 793–810.
doi:10.1016/j.econmod.2007.11.005
Hytenget, E., 2011. The Impact of Urbanization on GDP per Capita : A Study of Sub-Saharan
Africa.Jönköping International Business School
Javorcik, B.S., 2004. Does Foreign Direct Investment Increase the Productivity of Domestic
Firms? In Search of Spillovers Through Backward Linkages. American Economic Review
94(3), 605–627.
Jensen, N.M., 2008. Nation-States and the Multinational Corporation: A Political Economy of
Foreign Direct Investment. Princeton University Press.
Johnson, A., 2006. The Effects of FDI Inflows on Host Country Economic Growth. Working Paper
Series in Economics and Institutions of Innovation.
Jude, C., Levieuge, G., 2015. Growth effect of FDI in developing economies: the role of
institutional quality. Document de travail, N°559, Banque de France
Katsioloudes, M.I., Hadjidakis, S., 2007. International Business: A Global Perspective. Routledge.
Keller, W., 2004. International technology diffusion. Journal of economic literature 42, 752–782.
Klein, M.W., 2005. Capital Account Liberalization, Institutional Quality and Economic Growth:
Theory and Evidence (NBER Working Paper No. 11112). National Bureau of Economic
Research, Inc.
Knack, S., Keefer, P., 1995. Institutions and Economic Performance: Cross-Country Tests Using
Alternative Institutional Measures. Economics & Politics 7 (3), 207–227. doi:10.1111/j.1468-
0343.1995.tb00111.x
Li, X., Liu, X., 2005. Foreign Direct Investment and Economic Growth: An Increasingly
Endogenous Relationship. World Development 33(3), 393–407.
doi:10.1016/j.worlddev.2004.11.001
Lim, E.-G., 2001. Determinants of, and the Relation Between, Foreign Direct Investment and
Growth A Summary of the Recent Literature (SSRN Scholarly Paper No. ID 880230). Social
Science Research Network, Rochester, NY.
Makki, S.S., Somwaru, A., 2004. Impact of Foreign Direct Investment and Trade on Economic
Growth: Evidence from Developing Countries. American Journal of Agricultural Economics
86 (3), 795–801.
Mello, L. de, 1999. Foreign direct investment-led growth: evidence from time series and panel
data. Oxford Economic Papers. 51 (1), 133–151. doi:10.1093/oep/51.1.133
Melnyk, L., Kubatko, O., Pysarenko, S., 2014. The impact of foreign direct investment on
economic growth: case of post communism transition economies. Problems and Perspectives
in Management 12 (1), 17-24
Mina, W., 2007. The location determinants of FDI in the GCC countries. Journal of Multinational
Financial Management 17 (4), 336–348. doi:10.1016/j.mulfin.2007.02.002
Mina, W.M., 2012. The Institutional Reforms Debate and FDI Flows to the MENA Region: The
“Best” Ensemble. World Development 40 (9), 1798–1809.
doi:10.1016/j.worlddev.2012.04.026
OECD (2007): “Tax Incentives for Investment – A Global Perspective: experiences in MENA and
non-MENA countries.” MENA-OECD Investment program.
Roodman, D., 2009. A Note on the Theme of Too Many Instruments. Oxford Bulletin of
Economics and Statistics 71(1), 135–158. doi:10.1111/j.1468-0084.2008.00542.x

42
Serrasqueiro, Z., Nunes, P.M., 2008a. Determinants of capital structure: Comparison of empirical
evidence from the use of different estimators. International Journal of Applied Economics
5(1), 14–29
Tang, S., Selvanathan, E.A., Selvanathan, S., 2008. Foreign Direct Investment, Domestic
Investment, and Economic Growth in China: A Time Series Analysis.Working Paper Series
No. RP2008/19. World Institute for Development Economic Research (UNU-WIDER).
Taylor, M., Thrift, N., 2013. The Geography of Multinationals: Studies in the Spatial Development
and Economic Consequences of Multinational Corporations. Routledge.
Tiwari, A.K., Mutascu, M., 2011. Economic growth and FDI in Asia: A panel-data approach.
Economic Analysis and Policy 41(2), 173.
Toone, J.E., 2013. Mirage in the Gulf?: Examining the Upsurge in FDI in the GCC and Its Legal
and Economic Implications for the MENA Region (SSRN Scholarly Paper No. ID 2150603).
Social Science Research Network, Rochester, NY.
Uduak S. A.A, Salisu R. I., Simplice A.,(2014). Determinants of Foreign Direct Investment in
Fast-Growing Economies: A Study of BRICS and MINT, African Governance and
Development Institute Working Paper No. 14/002, Yaoundé.
United Nations Conference on Trade and Development. 2004. World Investment Report: The shift
towards services. United Nations, New York.
United Nations Conference on Trade and Development. 2012. World investment report: Towards a
new generation of investment policies. United Nations, New York; Geneva.
Villegas-Sanchez, C., 2009. FDI spillovers and the role of local financial markets: evidence from
Mexico. Manuscript, University of Houston.
Yabi, O.G., 2010. Investissements directs étrangers et croissance: Théories et analyse
économétrique appliquée aux pays en développement. Editions universitaires europeennes
EUE.
Zhang, K.H., 2001. Does Foreign Direct Investment Promote Economic Growth? Evidence From
East Asia And Latin America. Contemporary Economic Policy 19 (2), 175–185.