municipality of anchorage public transportation department · pdf filemunicipality of...
TRANSCRIPT

Municipality of Anchorage Public Transportation
Department
Dimond Center Intermodal Facility Feasibility Study
Technical Memorandum:
Task 2-Service Demand Estimates
AUGUST 2011
RANDY KINNEY, P.E., PTOE
750 WEST DIMOND BLVD., STE 203 ANCHORAGE, AK 99515
Kinney Engineering, LLC

Dimond Center Intermodal Facility Feasibility Study Task 2-Service Demand Estimates August 2011
Kinney Engineering, LLC Page i
Table of Contents
List of Acronyms ................................................................................................................... iii 1 Introduction ................................................................................................................... 1
1.1 Location and Vicinity ............................................................................................... 2 1.2 This Report-Task 2 Objectives and Scope .............................................................. 3 1.3 Summary of Findings .............................................................................................. 3
2 Growth Potential for the Dimond Center and Vicinity .................................................... 5 3 AMATS 2027 Travel Demand Model Bus Ridership Forecast ....................................... 8 4 Commuter Rail Ridership Forecast ............................................................................... 9
4.1 Operating Assumptions ........................................................................................... 9 4.1.1 Rail Service ...................................................................................................... 9 4.1.2 Station Mode of Access and Mode of Egress ................................................... 9
4.2 Key Inputs to Service Demand Estimates ............................................................. 10 4.2.1 Population and Employment Growth .............................................................. 10 4.2.2 ANC Enplanements ........................................................................................ 11 4.2.3 Parking Utilization ........................................................................................... 11 4.2.4 Transit Mode Share ........................................................................................ 11 4.2.5 Previous Rail and Bus Forecasts .................................................................... 12
4.3 Service Demand Estimates ................................................................................... 14 5 Parking Demand ......................................................................................................... 16
5.1 Background Peak Parking Demand ...................................................................... 16 5.1.1 Determine the study area and the type and quantity of each land use ........... 16 5.1.2 Select parking ratios ....................................................................................... 19 5.1.3 Apply adjustment factors ................................................................................ 19 5.1.4 Final estimate ................................................................................................. 25
5.2 Future Peak Parking Demand without the Intermodal Station ............................... 25 5.3 Peak Parking Demand with the Intermodal Station ............................................... 25
6 References .................................................................................................................. 27 APPENDIX A – Data Tables .............................................................................................. 29 APPENDIX B – AMATS Model 2027 Population and Employment Maps .......................... 36

Dimond Center Intermodal Facility Feasibility Study Task 2-Service Demand Estimates August 2011
Kinney Engineering, LLC Page ii
Figures
Figure 1: Location and Vicinity Map ..................................................................................... 2 Figure 2: Peak Day Daily Riders Predicted for People Mover and Commuter Rail .............. 4 Figure 3: Detail from Commercial Tract Fragment Lot Site Plan (Plat 2000-141) ................ 7 Figure 4: Estimated Year 2015 and 2030 Average Daily Line and DCIF Ridership for Mat-Su Valley to Anchorage Service (Sources: WSA 2002 and WSA 2009) ............................ 13 Figure 5: Study Area Land Uses ........................................................................................ 17 Figure 6: Peak Parking Demand Adjusted by Month .......................................................... 22 Figure 7: December Peak Period Parking Demand by Time of Day .................................. 23 Figure 8: Anchorage Average Auto Occupancy from 1985 to 2007 ................................... 24
Tables
Table 1: Bus Ridership Forecast for Dimond Transit Center ................................................ 8 Table 2: Estimated Daily Ridership between ANC and Dimond Center Intermodal Facility 11 Table 3: AMATS Year 2027 Forecast Regional Transit Mode Share ................................. 12 Table 4: Estimated Daily Ridership for Bus Patrons Transferring to Rail Service .............. 14 Table 5: Year 2015 Service Demand Estimate for DCIF .................................................... 15 Table 6: Year 2030 Service Demand Estimate for DCIF .................................................... 15 Table 7: Quantity and Base Parking Ratio for each Land Use in the Study Area ............... 18 Table 8: Weekday Peak Parking Demand (December, 2 PM) for Study Area .................... 20 Table 9: Weekend Peak Parking Demand (December, 2 PM) for Study Area ................... 21 Table 10: Peak Parking Demand for Expansion of Dimond Center Scenarios ................... 25 Table 11: Parking Base Ratio for Dimond Center Intermodal Facility ................................ 26 Table 12: Factors Affecting Park-and-Ride Demand at Dimond Center Intermodal Facility 27

Dimond Center Intermodal Facility Feasibility Study Task 2-Service Demand Estimates August 2011
Kinney Engineering, LLC Page iii
List of Acronyms
AADT annual average daily traffic
ADA Americans with Disabilities Act
ADAAG Americans with Disabilities Act Accessibility Guidelines
ADOL Alaska Department of Labor and Workforce Development
ADOT&PF Alaska Department of Transportation and Public Facilities
AMATS Anchorage Metropolitan Area Transportation Solutions
ANC Ted Stevens Anchorage International Airport
ARRC Alaska Railroad Corporation
DCIF Dimond Center Intermodal Facility
DD directional distribution
FTA Federal Transit Administration
ISER Institute of Social and Economic Research
ITC intermodal transportation center
K percent of daily traffic in peak hour
KELLC Kinney Engineering, LLC
LOS level of service
MOA Municipality of Anchorage
MOE measure of effectiveness
PTR permanent traffic recorder
TDM travel demand model
ULI Urban Land Institute
VHB Vanasse Hangen Brustlin, Inc.
WSA Wilbur Smith Associates

Dimond Center Intermodal Facility Feasibility Study Task 2-Service Demand Estimates August 2011
Kinney Engineering, LLC Page 1
1 Introduction Kinney Engineering, LLC (KELLC) is under contract with the Municipality of Anchorage (MOA) Public Transportation Department to conduct a feasibility study concerning an intermodal facility to be located near the existing Dimond Transit Center. The proposed intermodal facility would expand existing facilities in the area to integrate commuter rail, park and ride facilities, the bus system, and the street and trail network. In addition to serving South Anchorage neighborhoods, the facility would provide transfers between modes for trips throughout the Municipality.
The goals of the feasibility study include:
• Determine the demand for an intermodal facility (ridership estimates for bus and rail transit, park and ride activity, and pedestrian and bicycle trips to the facility for the years 2015 and 2030)
• Determine necessary improvements to the existing infrastructure (with or without the construction of an intermodal facility)
• Determine infrastructure needs for the proposed intermodal facility (including 3 alternatives)
• Determine the planning level cost estimates for the proposed facility • Determine possible sources of funding
The MOA Public Transportation Department is the client for this feasibility study. However, an intermodal facility would require a collaboration of the Municipality of Anchorage, the Alaska Railroad (ARRC), the Dimond Center; and other potential stakeholders.
KELLC is the prime consultant for this project, and as project manager, is directly responsible to the Municipality. In addition, KELLC will collect data, perform public involvement, identify travel demand, and perform site and railway conceptual engineering and cost estimates.
Vanasse Hangen Brustlin, Inc. (VHB) is a subconsultant to KELLC for transit and rail planning, and will determine rail modal share, intermodal infrastructure facility requirements and cost estimates.
The project feasibility study has 4 task phases. This report describes the activities of the second task, which is to determine ridership data for People Mover and for the proposed ARRC commuter rail service for the years 2015 and 2030. The four task phases for the project are:
• Task 1: Background, Existing Conditions, and Stakeholder Meetings • Task 2: Service Demand Estimates • Task 3: Options • Task 4: Executive Summary

Dimond Center Intermodal Facility Feasibility Study Task 2-Service Demand Estimates August 2011
Kinney Engineering, LLC Page 2
1.1 Location and Vicinity The proposed Dimond Center Intermodal Facility will be located in South Anchorage. The general location and vicinity are presented in Figure 1, below.
Figure 1: Location and Vicinity Map
The study area for this project includes public property (Dimond Boulevard along the north side of the Dimond Center site and Old Seward Highway between Dimond Boulevard and 88th Avenue) and private property (Dimond Center Drive, 88th Avenue between the railroad tracks and the Old Seward Highway, and other unnamed parking circulation roadways along the bus routes on the Dimond Center property). The

Dimond Center Intermodal Facility Feasibility Study Task 2-Service Demand Estimates August 2011
Kinney Engineering, LLC Page 3
Dimond Transit Center itself is built on Dimond Center property which the Dimond Center has historically leased to the municipality for $1 per year.
1.2 This Report-Task 2 Objectives and Scope The purpose of this report is to provide sketch-planning level estimates of demand for rail ridership and park and ride activity for the proposed intermodal facility. These estimates are based on previous estimates for rail service in the Anchorage area, forecast population and employment growth in the area, and other assumed contributions to potential ridership. Estimates were prepared for the years 2015 and 2030. The studies and analysis elements for Task 2 include:
• Growth Potential for the Dimond Center and Vicinity
• Anchorage Metropolitan Area Transportation Solutions (AMATS) 2027 Travel Demand Model Bus Ridership Forecast
• Commuter Rail Ridership Forecast
• Parking Demand
1.3 Summary of Findings Daily ridership at the Dimond Transit Center for People Mover was first determined for the year 2027 using the AMATS 2027 travel demand model. Ridership for the years 2015 and 2030 were then determined by projecting the ridership level for 2027 backwards or forwards using a 1% growth rate. No changes in service level were assumed.
For the ARRC commuter rail service, a service level assumption was made of six daily round trips between the Ship Creek Station, Ted Stevens Anchorage International Airport (ANC), and the Dimond Center (two in the morning, one in the mid-day, and three in the evening). Service to the Girdwood station would be provided with one round-trip in the morning and one in the evening. (An additional trip to Girdwood could be provided for ski trips as necessary.) Ridership level for the commuter rail service was based on enplanements at ANC, the 2002 rail study completed for ARRC by Wilbur Smith Associates (WSA) and its 2009 update, and bus ridership levels. Between 150 and 250 daily riders are predicted for the year 2015 and between 175 and 375 are predicted for the year 2030. Figure 2 shows the current and predicted future ridership level for People Mover and for commuter rail at the intermodal facility.
Based on the daily rider prediction for the commuter rail, fewer than 40 parking spaces would be needed for use of employees of the train station and train riders each day. An analysis of latent park-and-ride demand based simply on the volume of traffic on the major nearby roadways found that as many as 80 parking spaces could be used by bus and rail transit riders each day if the intermodal facility were advertised as a park-and-ride facility; however, park-and-ride is likely to be much less than this if the current level

Dimond Center Intermodal Facility Feasibility Study Task 2-Service Demand Estimates August 2011
Kinney Engineering, LLC Page 4
of congestion between the Seward Highway and the Dimond Transit Center continues or becomes worse.
0
100
200
300
400
500
600
700
800
900
2010 2015 2030
Daily
Rid
ers
People Mover
Commuter Rail (low estimate)
Commuter Rail (high estimate)
Figure 2: Peak Day Daily Riders Predicted for People Mover and Commuter Rail

Dimond Center Intermodal Facility Feasibility Study Task 2-Service Demand Estimates August 2011
Kinney Engineering, LLC Page 5
2 Growth Potential for the Dimond Center and Vicinity The Dimond Center is located at the southwest quadrant of the intersection of East Dimond Boulevard and Old Seward Highway in south Anchorage. It is Alaska’s largest shopping center, with approximately 728,000 square feet (sf) of gross leasable area (GLA) and more than 200 stores, including Best Buy, Old Navy and a nine-screen Regal Cinema. The Dimond Center complex also includes a six story office building immediately south of the mall complex (120,000 sf), and a three-star hotel southwest of the mall (with 109 rooms). Within the mall, there is an ice rink, a bowling alley, an athletic club, and a US Postal Service branch. Just west of the mall, adjacent to the ARRC rail line is the Dimond Transit Center, which is currently served by five People Mover bus routes, some of which also stop at points along the perimeter of the Dimond Center. The transit center is the proposed location of the Dimond Center Intermodal Facility. A separate parking structure with 450 spaces is also proposed adjacent to the complex.
The Dimond Center opened with 174,000 sf GLA in 1977. In 1981, it underwent a major expansion, more than doubling in size. The office tower, including the ice rink, bowling alley, and athletic club was completed in 1987. In 1996, the theater megaplex was constructed on the second floor of the mall. The Dimond Hotel was built on a mall outparcel in 2002. Also in 2002, the previous Alaska Marketplace store was demolished and replaced with a Best Buy, slightly expanding the size of the mall.
South of the Dimond Center is a Wal-mart Supercenter, which opened in 1994 with 167,000 sf and later expanded to a Super Wal-mart, with about 200,000 sf. Construction on the expansion was completed in 2009. North of the Dimond Center, across Dimond Boulevard, is a strip mall with stores such as David’s Bridal, Bed Bath and Beyond, and Pet Smart. Many of these stores opened in the last few years. On the opposite (east) side of the Old Seward Highway are additional shopping destinations, including Sam’s Club and Sports Authority. Just to the east of this shopping complex is the Seward Highway, the major north-south highway route in the Anchorage area. This segment of the Seward Highway operates as a freeway and includes a diamond / partial cloverleaf interchange with East Dimond Boulevard. The Seward Highway provides highway access to Girdwood and Whittier to the south and connects to the Glenn Highway to the north, providing access to the Matanuska-Susitna (Mat-Su) Valley.
Nearly all of the Dimond Center complex is within ¼ mile "as the crow flies” of the proposed Dimond Center Intermodal Facility and nearly all of the adjacent retail east of Old Seward Highway is within ½ mile of the proposed intermodal facility; however, the built environment is not pedestrian friendly. Most of the area is covered by surface parking with few sidewalk or pedestrian routes. Both Old Seward Highway and East Dimond Boulevard are divided major arterial highways that provide significant pedestrian barriers, even during the warm season.

Dimond Center Intermodal Facility Feasibility Study Task 2-Service Demand Estimates August 2011
Kinney Engineering, LLC Page 6
In the Draft Land Use Plan Map that has been approved by the Anchorage Planning and Zoning Commission to supplement the Anchorage Bowl Comprehensive Plan, the area is proposed to be designated as a Regional Commercial Center. The Regional Commercial Center designation encourages mixed uses, including commercial, office, entertainment, transit, and housing.
A very small portion of the land around the Dimond Center that is designated Regional Commercial Center on the Draft Land Use Plan Map remains undeveloped. The majority of the undeveloped land near the Dimond Center is designated Industrial. A 2009 report assessing industrial land availability in the Municipality of Anchorage found that the Municipality does not currently have enough developable land set aside for industrial uses. As a result, there is limited possibility for commercial expansion in the Regional Commercial Center.
Predictions of retail growth in the Municipality of Anchorage indicate that expansion of retail properties will slow down considerably in the near term. David Irwin, of Irwin Development Group, LLC, predicts less than 1 million sf of added retail space for the next 5 years, in contrast to the nearly 4 million sf of retail space that has been added over the past 15 years. Known plans for retail expansion in the city are limited mostly to the north side of Anchorage, including continued development of Tikahtnu Commons at the junction of Muldoon with the Glenn Highway and plans for a new Wal-mart and Sam’s Club in Muldoon (closing the Sam’s Club near Northway Mall). When Tikahtnu Commons is complete, it will be larger than the Dimond Center, but as it is not enclosed, the Dimond Center will remain Alaska’s largest enclosed mall.
Some expansion of the Dimond Center in the next 20 years can be expected, depending on the anchor stores that are attracted to the mall. According to Hugh Ashlock of the Dimond Center, expansion would probably be limited to adding 40,000 to 50,000 sf of GLA, including the possibility of constructing outparcel buildings on existing fragment lots. Examination of the Plat of Commercial Tract Fragment Lot Site Plan (Plat 2000-141), a detail from which is found in Figure 3) shows that there are two identified fragment lots that have not yet been developed. These are fragment lot 13 (northwest corner, 29,811 sf) and fragment lot 12 (northeast corner directly south of Burger King, 28,171 sf).

Dimond Center Intermodal Facility Feasibility Study Task 2-Service Demand Estimates August 2011
Kinney Engineering, LLC Page 7
Figure 3: Detail from Commercial Tract Fragment Lot Site Plan (Plat 2000-141)

Dimond Center Intermodal Facility Feasibility Study Task 2-Service Demand Estimates August 2011
Kinney Engineering, LLC Page 8
3 AMATS 2027 Travel Demand Model Bus Ridership Forecast
The AMATS model uses census data zones to define trip production and attraction based on socioeconomic data such as the average household size in the area and the average number of retail employees that work there. Mode choice is modeled separately by trip purpose, using both socioeconomic data and trip characteristics, such as travel time, parking costs, and node densities. The mode choice model for each trip purpose was validated by comparing the results of the mode choice models to mode choices in the 2002 Anchorage Household Travel Survey. The travel demand model was created for the year 2027.
KELLC has used the AMATS model extensively to predict traffic volumes for future road projects in the Anchorage Bowl. Near the Dimond Boulevard corridor, KELLC has found that the AMATS model predicts reduced traffic volumes in the area, in spite of predicted population and employment growth that should result in increased traffic volumes. The population growth map and the employment growth map are provided in the Appendix. As a result of the inconsistency between the AMATS model output and the expected increase in traffic volumes, KELLC has modified the model output in the area around Dimond Boulevard to better meet reasonable expectations of traffic growth.
The AMATS model also predicted fewer transit trips with an origin or destination at the Dimond Transit Center than would be expected for the year 2027, given predicted future population trends. The prediction of 2027 transit trips to and from the Downtown Transit Center, however, was found to be reasonable. As a result, the growth in transit trips to the Dimond Transit Center from current volumes to the 2027 model volumes were calculated using the predicted percent increase of transit trips at the Downtown Transit Center over the same period. The 2027 bus ridership forecast for the People Mover Dimond Transit Center is presented in the table below.
People Mover Bus Route
2027 Average Daily Ridership Forecast for Dimond Transit Center
Percentage Distribution
1 156 17% 2 138 15% 7 147 16% 9 322 35%
60 157 17% Total 920 100%
Table 1: Bus Ridership Forecast for Dimond Transit Center

Dimond Center Intermodal Facility Feasibility Study Task 2-Service Demand Estimates August 2011
Kinney Engineering, LLC Page 9
4 Commuter Rail Ridership Forecast
4.1 Operating Assumptions
4.1.1 Rail Service While the estimates are for the Dimond Center Intermodal Facility only, the objective of ARRC and other stakeholders is for service to and from four stations:
1. Dimond Center Intermodal Facility 2. Downtown Anchorage (Ship Creek Intermodal Center) 3. Ted Stevens Anchorage International Airport (ANC) 4. Girdwood
For the core “triangle” service to the three Anchorage stations, six round trips are proposed to operate daily – two in the morning, one in the mid-day, and three in the evening; this is a reasonable initial level of service given the activity patterns at each location and is based on the WSA review (2002 and 2009). Travel to all three stations is expected to take 30 minutes. The additional evening trip would allow for greater use of retail and entertainment activities adjacent to the Dimond Center Intermodal Facility. One round trip in the morning and one round trip in the evening would provide service to Girdwood, although an additional round trip could be added during high season to increase access to the Alyeska Resort. A station area rail mode share capture rate of 5 percent for the intermodal facility was assumed based on the previous forecasting efforts of WSA. Given the development patterns in Anchorage, a reasonable catchment area for all modes of access and egress extends about 3 miles from station locations. This service plan limits the amount of work trips using the intermodal facility because the most significant origin market for work trips destined to Anchorage is the Mat-Su Valley, which would not be served in this scenario.
4.1.2 Station Mode of Access and Mode of Egress Although this analysis includes only station-level estimates at the Dimond Center Intermodal Facility, the estimates do include assumptions about how travelers would travel to (mode of access) and from (mode of egress) the other three stations, since those assumptions could potentially impact ridership at the Dimond Center Intermodal Facility. The mode of access and mode of egress assumptions for each station are indicated below:
4.1.2.1 Dimond Center Intermodal Facility Our analysis assumes that some sort of retail circulator shuttle service will be provided in the Dimond station area to transport riders to local destinations. Most riders arriving at the Dimond Center rail station on the train would likely board such a circulator shuttle that would take them to stops located throughout the retail complex and surrounding destinations. It is assumed that the circulator service would be timed to operate in coordination with the train schedule. A smaller percentage of arriving riders would

Dimond Center Intermodal Facility Feasibility Study Task 2-Service Demand Estimates August 2011
Kinney Engineering, LLC Page 10
transfer to one of the five People Mover bus routes serving the Dimond Transit Center. Finally, a very small number of arriving riders could walk to their final destination, since those destinations are dispersed through a wide area with few pedestrian routes. Riders originating at the Dimond Center could arrive via walking, retail circulator shuttle (if provided), or People Mover bus. Drive access (park and ride) could be possible, especially if additional parking is provided during the peak period. Drive access could be particularly appealing for service to Girdwood during the winter months.
4.1.2.2 Downtown Anchorage (Ship Creek Intermodal Center) Train riders arriving in downtown Anchorage would walk to their destinations or transfer to a People Mover bus. The proposed Ship Creek Intermodal Transportation Center (ITC) provides for improved bus transit and pedestrian connections between the rail station and downtown. Riders originating at Ship Creek would arrive via walking or People Mover bus or by driving. The planned parking improvements as part of the ITC will provide some parking for drive access rail riders, although this number is expected to be small.
4.1.2.3 Ted Stevens Anchorage International Airport (ANC) Rail riders originating at ANC would walk through the terminal or take an airport shuttle to the rail station and board the train. Nearly all riders arriving at ANC by train would board an on-site airport shuttle or walk to the airport terminal.
4.1.2.4 Girdwood All travel to and from the Girdwood station would be either via driving (for work travel originating in Girdwood) or resort shuttle service (for Anchorage recreational travel to Girdwood resorts), or Glacier Valley Transit.
4.2 Key Inputs to Service Demand Estimates The service demand estimates for the Dimond Center Intermodal Facility were built up from information on population and employment growth, activity at ANC, current parking utilization adjacent to the Dimond Transit Center, current and forecast transit mode split for the Anchorage area, and previous rail forecasts for the Anchorage area. Information for each of these elements is contained below:
4.2.1 Population and Employment Growth As noted in the existing conditions report, forecast employment growth for the Anchorage area is 0.8% per year from the year 2000 to the year 2030. The existing conditions report also noted that forecast population growth is 0.8% per year from the year 2007 to the year 2030. For purposes of these demand estimates, a slightly more aggressive growth rate of 1% per year was assumed. Ridership at the Dimond Center Intermodal Facility and activity at the Dimond Center is expected to grow at the same rate as Anchorage’s population and employment.

Dimond Center Intermodal Facility Feasibility Study Task 2-Service Demand Estimates August 2011
Kinney Engineering, LLC Page 11
4.2.2 ANC Enplanements Total monthly enplanements at ANC averaged approximately 205,000 per month from July 2007 to June 2010. This breaks down into roughly 7,000 daily enplanements as a base. To be conservative, it was assumed that between 1% and 2% of daily enplanements would travel via rail to the Dimond Center. This assumption is well-founded since the Dimond Center is a major retail and entertainment complex with close proximity to other major retail stores, and also has a hotel and office complex on-site. While bus options that connect the ANC to the Dimond Center do currently exist, rail service would provide a direct, one-seat ride with no intermediate stops. The capture rate would tend to be higher during the summer months, as well as during the months of October and December when citizens from the Alaska villages would be arriving at ANC and then traveling to the Dimond Center to spend Permanent Fund checks, attend the October Alaska Federation of Natives convention, and/or do holiday shopping. Enplanements are expected to grow at the same rate as population and employment (see Table 2 below).
Low High Horizon Year Daily
Ridership Capture Rate Daily Ridership Capture Rate
74 1% 147 2% 2015
85 1% 171 2% 2030 NOTE: Base of 7,000 daily enplanements for year 2010 and growth of 1% annually
Table 2: Estimated Daily Ridership between ANC and Dimond Center Intermodal Facility
4.2.3 Parking Utilization The existing conditions report shows a maximum parking utilization of 57% (620 of 1082 spaces) for spaces within 600 feet of the Dimond Transit Center. This figure suggests that parking capacity is generally not an issue in the area, although there are days and time periods where certain lots are more heavily utilized. If current conditions remain, parking would not be an issue, although use of excess parking space for an intermodal facility would depend upon a parking agreement with the Dimond Center and approval of the municipality. Future expansion at the Dimond Center or the implementation of parking management strategies to spread parking demand more evenly through the site could affect parking utilization. Thus, parking utilization may need to be reevaluated in the future.
4.2.4 Transit Mode Share Data from the recently released 3-year American Community Survey data profile for Anchorage reports a work-travel transit mode share of 1.3%, which is a decrease from a transit mode share of 1.8% as reported in the year 2000 census. The mode share for transit in Anchorage is less than both walking and working at home. In contrast, the

Dimond Center Intermodal Facility Feasibility Study Task 2-Service Demand Estimates August 2011
Kinney Engineering, LLC Page 12
AMATS travel demand model forecasts that 2027 transit mode share for home-based work trips will be 4.4% (see Table 3 below). Table 3 also shows the forecast transit mode share for various non-work trip purposes that would signify travel to the Dimond Center Intermodal Facility. Achieving the forecast transit mode share would require not only a reversal of the current downward trend in transit use, but also higher annual growth in transit use once the downward trend was reversed. The methodology to estimate ridership did not use mode share splits directly. Instead, it used the AMATS forecast of transit ridership for the five People Mover bus routes serving the existing Dimond Transit Center (see section 3 on page 8).
Trip Purpose AM Peak PM Peak Off-Peak
Home based work 4.4% 4.4% 3.2%
Home based shopping 0.8% 0.8% 0.6%
Home based school 13.3% 13.3% 13.3%
Home based other 1.5% 1.5% 1.2%
Non-home based work 0.9% 0.9% 0.6%
Non-home based non-work 0.7% 0.7% 0.5%
Table 3: AMATS Year 2027 Forecast Regional Transit Mode Share
4.2.5 Previous Rail and Bus Forecasts The previous forecasts for transit service within the corridor, including the Dimond Center, served as a key reference point for the demand estimates. Three sets of forecasts are summarized below:
The 2002 commuter rail study prepared for ARRC by WSA estimated year 2015 average daily line ridership ranging from 585 to 700 riders for service from the Mat-Su Valley to Anchorage, including service to the Dimond Center, but excluding direct service to/from ANC. Based on a 5% capture rate, the Dimond Center Intermodal Facility average daily ridership would be between 29 and 35 riders (the higher value is for the winter months) for the year 2015. Applying the assumed 1% growth rate, this figure could grow to between 32 and 39 average daily riders by 2030 (see Figure 4). The 2002 study also included an estimate of about 33 average daily riders between Girdwood and Anchorage. This would add approximately 1 to 2 additional riders at the intermodal facility. Non-work trips were not considered as part of this study.
The WSA May 2009 working paper assessed the ridership potential for rail service from the Mat-Su Valley to Anchorage, without a stop at the Dimond Center, but with service to ANC. The “max build” scenario in this paper estimated year 2020 average weekday line ridership ranging from 1,200 to 1,600 riders. Applying the 1% growth rate yields a range of approximately 1,300 to 1,800 riders in the year 2030. The base of work trips for these estimates came from the Knik Arm Bridge and Toll Authority (KABATA) model.

Dimond Center Intermodal Facility Feasibility Study Task 2-Service Demand Estimates August 2011
Kinney Engineering, LLC Page 13
Non-work trips were not considered as part of this study. Individual station estimates were not included, but a rail mode capture rate of 5% for the Dimond Center would yield a range of 57 to 76 riders in the year 2015 and 66 to 88 riders in the year 2030 (see Figure 4).
Line DCIF Line DCIF
2015 2030
WSA 2002 High 700 35 813 41
WSA 2009 High 1,522 76 1,715 88
WSA 2002 Low 585 29 679 34
WSA 2009 Low 1,141 57 1,287 66
-
200
400
600
800
1,000
1,200
1,400
1,600
1,800
Aver
age
Daily
Rid
ersh
ip
ASSUMPTIONS: 1% annual growth rate; Daily ridership is equal to annual ridership divided by 330; DCIF ridership is 5% of daily line ridership
Figure 4: Estimated Year 2015 and 2030 Average Daily Line and DCIF Ridership for Mat-Su Valley to Anchorage Service (Sources: WSA 2002 and WSA 2009)
Using the AMATS model, the forecast year 2027 ridership for the five People Mover bus routes serving the existing Dimond Transit Center is estimated to be 920 riders total for

Dimond Center Intermodal Facility Feasibility Study Task 2-Service Demand Estimates August 2011
Kinney Engineering, LLC Page 14
all five routes. This number would increase to 940 by the year 2030 at a 1% growth rate, and can be back-cast to 816 riders in the year 2015. The percentage of those bus riders using the rail service is anticipated to be low due to a relative lack of travel time savings and increased fare when compared with the bus, in addition to the limited destinations of the rail service, which might force multiple transfers. However, transfers are likely to increase during the winter months when weather more significantly impacts bus travel time. A transfer rate from bus to rail of between 5% and 7% was assumed.
Low High Horizon Year Daily
Ridership Capture Rate Daily Ridership Capture Rate
41 5% 57 7% 2015
47 5% 66 7% 2030 NOTE: Based on year 2027 forecast bus ridership of 920 riders for the five routes currently serving the Dimond Transit Center and 1% annual growth
Table 4: Estimated Daily Ridership for Bus Patrons Transferring to Rail Service
4.3 Service Demand Estimates Based on the previous analyses, the average daily ridership at the Dimond Center Intermodal Facility is estimated to be in the range of approximately 150-250 riders in the year 2015, and 175-375 riders in 2030, as shown in Table 5 and Table 6. These estimates are greater than the estimates described in the previous studies due the inclusion of potential non-work trips to and from ANC, the potential diversion from bus, and additional potential trips factored in with a 15% uncertainty term, given the retail-oriented character of the Dimond Center Intermodal Facility. The 15% uncertainty term is also included as an acknowledgement that the estimates may be overly optimistic, since they are pivoting from forecasts that included significantly more service, specifically to the Mat-Su Valley, than assumed for these estimates.
The upper end of the ranges would probably we reached in certain seasons, such as in October through January with Permanent Fund spending, holiday shopping, and when highway and bus travel is less appealing due to snow and ice. This level of demand could be served adequately by the assumed operating plan. It should be noted that the 15% uncertainty term itself, which reduces the low end of the range and increases the high end of the range, is also very optimistic. For this initial level of estimation and in this specialized market, an uncertainty factor of as high as 50% could be considered. The absence of coordinated shuttle service to circulate passengers through the Dimond Center and surrounding retail area from and to the Dimond Center Intermodal Facility is very likely to reduce potential ridership into the low range of the demand estimates or below, as walkability in the surrounding area is greatly hampered by the urban design (and weather conditions during the winter months).

Dimond Center Intermodal Facility Feasibility Study Task 2-Service Demand Estimates August 2011
Kinney Engineering, LLC Page 15
Year 2015 and 2030 transit mode share is expected to change little from the AMATS forecast, even with the addition of the Dimond Center Intermodal Facility and rail service, as the estimated ridership is not enough to significantly impact transit mode share. Driving or riding the bus may still be generally more attractive, except during the winter months when car and bus trips take longer due to snow and ice.
This analysis assumes growth at the Dimond Center will keep pace with the regional growth rate of 1% per year. This regional growth rate is slightly higher than the AMATS forecast regional growth rate, and builds in new growth that may occur from increased densities at the Dimond Center.
Source of Data Low High
Estimated DCIF Ridership Based on WSA 2009 White Paper 57 76
ANC Enplanements Traveling to DCIF 74 85
Diversion from People Mover Bus Routes 41 57
Subtotal 172 218
Uncertainty -15% 15% 2015 Sketch Level Planning Demand Estimate Average Daily Ridership 146 251
NOTE: Ridership between Girdwood and the DCIF contributes insignificantly to the ridership estimates in this table.
Table 5: Year 2015 Service Demand Estimate for DCIF
Source of Data Low High
Estimated DCIF Ridership Based on WSA 2009 White Paper 66 88
ANC Enplanements Traveling to DCIF 85 171
Diversion from People Mover Bus Routes 57 66
Subtotal 208 325
Uncertainty -15% 15% Sketch Level Planning Demand Estimate Average Daily Ridership 177 374
NOTE: Ridership between Girdwood and the DCIF contributes insignificantly to the ridership estimates in this table.
Table 6: Year 2030 Service Demand Estimate for DCIF

Dimond Center Intermodal Facility Feasibility Study Task 2-Service Demand Estimates August 2011
Kinney Engineering, LLC Page 16
5 Parking Demand A 450 space parking garage was proposed as part of the South Anchorage Intermodal Transportation Center Project Prospectus; however, no additional parking was proposed as part of ARRC’s Dimond Center Intermodal Transportation Center Project Development Plan. This section uses the Urban Land Institute’s shared parking methodology to determine the current (background) parking demand, possible future parking demand in the case of Dimond Center expansion, and the parking demand that would be added in the case that the intermodal center is built to determine how many additional spaces, if any, would be required by the Dimond Center Intermodal Facility.
5.1 Background Peak Parking Demand The Dimond Center and the surrounding parcels represent a wide variety of complementary land uses, including retail, entertainment, and office. The peak periods of parking demand for these uses are not all at the same time (for example, the peak parking period for office buildings is weekdays from 10 AM to 3 PM whereas the peak period for movie theaters is on weekends from 8 PM to 11 PM). In addition, some trips are “captured” within the site. For example, office workers may eat lunch at a restaurant on site or parents might shop while their children are skating. Only one parking space is used even though two of the land uses are accessed. In situations of shared parking, determining parking demand by simply adding up the greatest number of parking spaces required by each land use would result in a significant overestimate of the parking demand. The Urban Land Institute (ULI) Shared Parking, 2nd edition provides a methodology for determining parking demand in situations of shared parking.
5.1.1 Determine the study area and the type and quantity of each land use The Dimond Center is a total of 728,000 sf GLA divided between retail space, office space, and entertainment facilities, including a health club, a movie theater, a bowling alley, and a skating rink. The Dimond Center shares parking with a number of outlying buildings, including: a hotel, a fast-food restaurant (the Burger King on the north-east corner of the lot), and a drive-in bank. Restaurants located within the Dimond Center do not need to be included separately because they are estimated to comprise less than 20% of the retail area. A small lube shop just north of the bank was not included in the analysis because of the lack of available information for that kind of land use and because it would only add about 10 spaces (less than 1%) to the parking need during the peak hour. Wal-mart and the two strip shopping malls east of the Wal-mart parking lot were included in the parking demand analysis because there is an existing shared parking agreement between the Dimond Center and Wal-mart that allows the Dimond Center to use 45 Wal-mart parking spaces. In addition, customers for Wal-mart have been observed using the Dimond Center parking lot during peak periods of parking demand at Wal-mart. The study area for the parking demand analysis is shown in Figure 5. The size of each of these land uses are shown in Table 7.

Dimond Center Intermodal Facility Feasibility Study Task 2-Service Demand Estimates August 2011
Kinney Engineering, LLC Page 17
Figure 5: Study Area Land Uses

Dimond Center Intermodal Facility Feasibility Study Task 2-Service Demand Estimates August 2011
Kinney Engineering, LLC Page 18
Weekdays Weekends
Quantity of Land Use Base Ratio Units Base Ratio Units Source
Dimond Center Retail Customer 477,700 3.0641 /ksf GLA 3.4188 /ksf GLA A Employee 0.7547 /ksf GLA 0.8547 /ksf GLA
Office Building Visitor 120,000 0.2475 /ksf GLA 0.0295 /ksf GLA A
Employee 3.2875 /ksf GLA 0.317 /ksf GLA
Health Club Customer 40,000 6.6 /ksf GLA 5.5 /ksf GLA A Employee 0.4 /ksf GLA 0.25 /ksf GLA
Cineplex Customer 1,800 0.19 /seat 0.26 /seat A Employee 0.01 /seat 0.01 /seat
Hotel - Leisure Guest 190 0.9 /room 1 /room A
Employee 0.25 /room 0.18 /room
Bowling Alley Customer 12 4.389 /lane 5.301 /lane B Employee 0.231 /lane 0.279 /lane
Ice Rink (Public Assembly Space)
Customer 200 0.2375 /person 0.2375 /person C Employee 0.0125 /person 0.0125 /person
Fast Food (Burger King)
Customer 3,600 12.75 /ksf GLA 12 /ksf GLA A Employee 2.25 /ksf GLA 2 /ksf GLA
Bank Branch with Drive-in
Customer 6375 3 /ksf GLA 3 /ksf GLA A Employee 1.6 /ksf GLA 1.6 /ksf GLA
Outparcel Shopping Center Customer 31,700 3.0641 /ksf GLA 3.4188 /ksf GLA A Employee 0.7547 /ksf GLA 0.8547 /ksf GLA
Wal-mart Customer
200,000 3.272 /ksf GLA 4.432 /ksf GLA
B Employee 0.818 /ksf GLA 1.108 /ksf GLA
A – Smith, Mary S. Shared Parking, 2nd edition. Washington, D.C.: ULI-the Urban Land Institute and the International Council of Shopping Centers, 2005. B – McCourt, Ransford S. Parking Generation, 3rd edition. Washington, D.C.: Institute of Transportation Engineers, 2004. C – Dimensions of Parking, 5th edition. Washington, D.C.: ULI-the Urban Land Institute and the National Parking Association, 2010.
Table 7: Quantity and Base Parking Ratio for each Land Use in the Study Area

Dimond Center Intermodal Facility Feasibility Study Task 2-Service Demand Estimates August 2011
Kinney Engineering, LLC Page 19
5.1.2 Select parking ratios Parking ratios relate the size of the land use to the number of parking spaces needed for that use. For most of the land uses in the study area, these ratios were found in Shared Parking. Where ratios for a particular land use were not available in Shared Parking, values were taken from either the ULI’s Dimensions of Parking or from the Institute of Transportation Engineer’s Parking Generation, 3rd edition. The 85th percentile value from Parking Generation was used because this is the value generally used by the ULI in determining the parking ratios that were published in Shared Parking (except for shopping centers, where ULI uses the 20th highest parking hour in the year). Shared Parking provides separate parking ratios for visitors or customers of each land use and for employees at each land use. Neither Parking Generation nor Dimensions of Parking provides separate ratios for these two types of users, however. As a result, the percentage split for customers and employees was selected based on the percentage split for a similar use in Shared Parking. Table 7, on page 18, shows the base parking ratios for each land use for both types of users (customers/visitors and employees) and for weekdays and weekends. The source of each parking ratio is also included in the table.
5.1.3 Apply adjustment factors Four adjustment factors are then applied to the estimate of needed parking spaces for each land use, as shown in Table 8 and Table 9:
• Monthly adjustment factors
• Time-of-day adjustment factors
• Non-captive adjustment factors
• Mode adjustment factors
These adjustment factors account for the interaction between different land uses and calibrate the parking demand analysis for the specific site under study.
5.1.3.1 Monthly adjustment factors Each type of land use has unique monthly factors. There are separate factors for customers/visitors and for employees. The monthly adjustment factors are based on a 13 month system, where the month of December is divided into two periods: one from December 1 to December 24 and the second from December 25 to December 31. This is because although retail demand diminishes significantly after December 25, cinemas experience a significant peak in this period. Assuming that both peaks occur at the same time could result in a significant overestimation of the need for parking in locations with both retail and cinema uses.

Dimond Center Intermodal Facility Feasibility Study Task 2-Service Demand Estimates August 2011
Kinney Engineering, LLC Page 20
Unadjusted Demand
Month Adjustment December
Peak-Hour Adjustment
2 PM
Non-captive Adjustment
Mode Adjustment
December 2 PM Peak
Parking Demand
Dimond Center Retail
Customer 1,464 100% 100% 90% 95% 1,252
Employee 361 100% 100% 100% 80% 289
Office Building
Visitor 30 100% 100% 100% 100% 30
Employee 395 100% 100% 100% 80% 316
Health Club Customer 264 93% 70% 95% 100% 163
Employee 16 100% 75% 100% 80% 10
Cineplex Customer 342 23% 55% 95% 95% 39
Employee 18 50% 60% 100% 80% 4
Hotel - Leisure
Guest 171 50% 70% 100% 66% 40
Employee 48 100% 100% 100% 80% 38
Bowling Alley
Customer 53 100% 70% 95% 95% 33
Employee 3 100% 75% 100% 80% 2
Ice Rink Customer 48 100% 55% 95% 95% 24
Employee 3 100% 60% 100% 80% 1
Fast Food (Burger King)
Customer 46 100% 90% 50% 100% 21
Employee 8 100% 95% 100% 80% 6
Bank Branch with Drive-in
Customer 19 100% 70% 95% 100% 13
Employee 10 100% 100% 100% 80% 8
Outparcel Shopping Center
Customer 97 100% 100% 95% 100% 92
Employee 24 100% 100% 100% 80% 19
Wal-mart Customer 654 100% 100% 95% 90% 559
Employee 164 100% 100% 100% 80% 131
Total 3,090
Table 8: Weekday Peak Parking Demand (December, 2 PM) for Study Area

Dimond Center Intermodal Facility Feasibility Study Task 2-Service Demand Estimates August 2011
Kinney Engineering, LLC Page 21
Unadjusted Demand
Month Adjustment December
Peak-Hour Adjustment
2 PM
Non-captive Adjustment
Mode Adjustment
December 2 PM Peak
Parking Demand
Dimond Center Retail
Customer 1,633 100% 100% 90% 95% 1,396
Employee 408 100% 100% 100% 80% 326
Office Building
Visitor 4 100% 60% 100% 100% 2
Employee 38 100% 60% 100% 80% 18
Health Club Customer 220 93% 25% 100% 100% 51
Employee 10 100% 50% 100% 80% 4
Cineplex Customer 468 67% 55% 90% 95% 147
Employee 18 80% 60% 100% 80% 7
Hotel - Leisure
Guest 190 50% 70% 100% 66% 44
Employee 34 100% 100% 100% 80% 27
Bowling Alley
Customer 64 100% 25% 95% 95% 14
Employee 3 100% 50% 100% 80% 1
Ice Rink Customer 48 100% 55% 95% 95% 24
Employee 3 100% 60% 100% 80% 1
Fast Food (Burger King)
Customer 43 100% 90% 50% 100% 19
Employee 7 100% 95% 100% 80% 5
Bank Branch with Drive-in
Customer 19 100% 0% 95% 100% 0
Employee 10 100% 0% 100% 80% 0
Outparcel Shopping Center
Customer 108 100% 100% 100% 100% 108
Employee 27 100% 100% 100% 80% 22
Wal-mart Customer 886 100% 100% 95% 90% 758
Employee 222 100% 100% 100% 80% 178
Total 3,152
Table 9: Weekend Peak Parking Demand (December, 2 PM) for Study Area
Because monthly adjustment factors were not available for the bowling alley and the ice rink, it was assumed that the maximum number of spaces for these uses was needed in

Dimond Center Intermodal Facility Feasibility Study Task 2-Service Demand Estimates August 2011
Kinney Engineering, LLC Page 22
every month of the year (uniform demand). Although this is unlikely to be the case, it represents a conservative estimate. At the same time, the maximum number of parking spaces needed for these uses (67 for the bowling alley and 52 for the ice rink) is small compared to the parking spaces required for other uses, so using this conservative estimate will not result in a significant overestimation of the number of spaces needed.
For the month of October, the monthly adjustment factor for retail uses (Super Regional Shopping Center and Community Shopping Center) was adjusted upward for customers (from 66% to 72%) to match the adjustment factor for November because of the spike in customers at retail establishments in Alaska due to the dispersal of the Permanent Fund Dividend in October.
Figure 6 shows how parking demand is predicted to vary by month for the sum of land uses in the study area. The peak parking demand for this mixture of uses clearly occurs in December, with the Late December period a close second and November coming in third. Thus, December adjustment factors were chosen to represent the peak parking period in Table 8 and Table 9.
0500
10001500200025003000350040004500
Jan Feb Mar Apr May Jun Jul Aug Sep Oct Nov Dec Late DecPa
rkin
g De
man
d Ad
just
ed b
y M
onth
Weekday Weekend
Figure 6: Peak Parking Demand Adjusted by Month
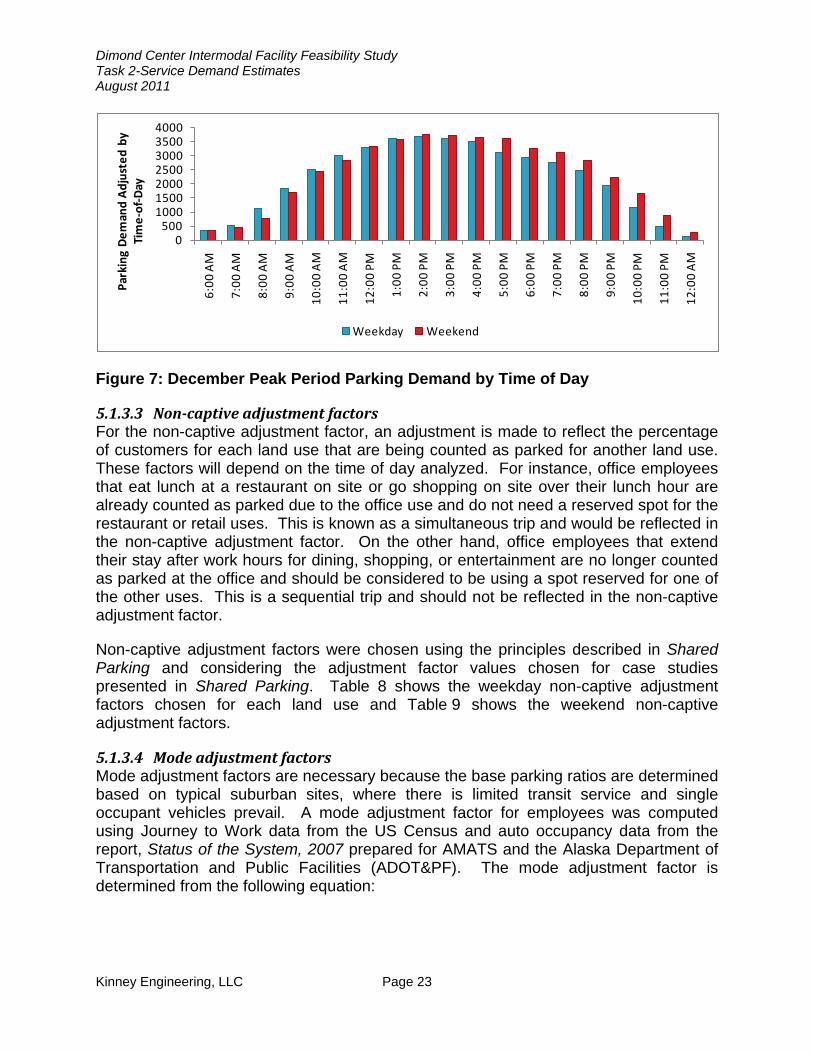
5.1.3.2 Time-of-day adjustment factors The time-of-day factors adjust for the variation in parking demand throughout the day and is responsible for the most significant benefits of the shared parking analysis. For the bowling alley, time-of-day factors were copied from the time-of-day factors for the health club, with adjustments due to the narrower hours of operation for the bowling alley. Time-of-day factors for the ice rink were copied from the cinema land use, once again with adjustments due to the narrower hours of operation for the ice rink. As with the monthly adjustment factors, the time-of-day adjustment factors chosen for these two land uses has a small effect due to the small number of spaces required for these uses. Figure 7 shows the variation in parking demand over the day for the mix of land uses in the study area. The peak period is from 2 to 3 PM.
Dimond Center Intermodal Facility Feasibility Study Task 2-Service Demand Estimates August 2011
Kinney Engineering, LLC Page 23
0500
1000150020002500300035004000
6:00
AM
7:00
AM
8:00
AM
9:00
AM
10:0
0 AM
11:0
0 AM
12:0
0 PM
1:00
PM
2:00
PM
3:00
PM
4:00
PM
5:00
PM
6:00
PM
7:00
PM
8:00
PM
9:00
PM
10:0
0 PM
11:0
0 PM
12:0
0 AM
Park
ing
Dem
and
Adju
sted
by
Tim
e-of
-Day
Weekday Weekend
Figure 7: December Peak Period Parking Demand by Time of Day
5.1.3.3 Non-captive adjustment factors For the non-captive adjustment factor, an adjustment is made to reflect the percentage of customers for each land use that are being counted as parked for another land use. These factors will depend on the time of day analyzed. For instance, office employees that eat lunch at a restaurant on site or go shopping on site over their lunch hour are already counted as parked due to the office use and do not need a reserved spot for the restaurant or retail uses. This is known as a simultaneous trip and would be reflected in the non-captive adjustment factor. On the other hand, office employees that extend their stay after work hours for dining, shopping, or entertainment are no longer counted as parked at the office and should be considered to be using a spot reserved for one of the other uses. This is a sequential trip and should not be reflected in the non-captive adjustment factor.
Non-captive adjustment factors were chosen using the principles described in Shared Parking and considering the adjustment factor values chosen for case studies presented in Shared Parking. Table 8 shows the weekday non-captive adjustment factors chosen for each land use and Table 9 shows the weekend non-captive adjustment factors.
5.1.3.4 Mode adjustment factors Mode adjustment factors are necessary because the base parking ratios are determined based on typical suburban sites, where there is limited transit service and single occupant vehicles prevail. A mode adjustment factor for employees was computed using Journey to Work data from the US Census and auto occupancy data from the report, Status of the System, 2007 prepared for AMATS and the Alaska Department of Transportation and Public Facilities (ADOT&PF). The mode adjustment factor is determined from the following equation:

Dimond Center Intermodal Facility Feasibility Study Task 2-Service Demand Estimates August 2011
Kinney Engineering, LLC Page 24
Where Amode is the mode adjustment factor, SOV% is the percentage of drivers driving to work alone, and Occupancy is the average number of people per automobile traveling to work. According to the 2009 American Community Survey or the US Census Bureau, 89% of workers in Anchorage drive to work with no other passengers in their vehicle. This is the value for SOV%.
Commuter vehicle occupancy was taken from the Status of the System report, which reported occupancy measured via a survey of 22 employment sites in Anchorage performed during the morning commute period every year starting from 1985 and last published in 2007. The occupancy for each year is shown in Figure 8. The figure shows that vehicle occupancy has varied over time, with a decreasing trend. The value for 2007 was 1.12 occupants per vehicle.
11.05
1.11.15
1.21.25
1.3
1985
1986
1987
1988
1989
1990
1991
1992
1993
1994
1995
1996
1997
1998
1999
2000
2001
2002
2003
2004
2005
2006
2007
Aver
age
Auto
mob
ile
Occ
upan
cy
Figure 8: Anchorage Average Auto Occupancy from 1985 to 2007
Entering these values in the above equation yields a mode adjustment factor for employees of about 80%. Shared Parking suggests rounding this value up to reflect the fact that the base parking ratios do reflect some ridesharing, walking, and drop-off behavior; however, the Dimond Transit Center makes public transportation more accessible at the Dimond Center than at other Anchorage locations. Thus, the mode adjustment factor chosen for employees was 80%. For customers/visitors, the mode adjustment factor was dropped from 100% for some of the uses, as public transportation is frequently used by visitors to the mall and to Wal-mart. Hotel guests frequently arrive at the hotel via taxi, therefore the mode adjustment factor was dropped to 66%. (This is typical of the mode adjustment factors found in Shared Parking for hotels.) The final tabulation of parking demand for the study area, including all of the appropriate factors is shown for weekdays in Table 8 and for weekends in Table 9.

Dimond Center Intermodal Facility Feasibility Study Task 2-Service Demand Estimates August 2011
Kinney Engineering, LLC Page 25
5.1.4 Final estimate The total peak parking demand is determined by summing the peak period parking demand for all of the different land uses. The final estimate is that 3,090 spaces are needed on weekdays (see Table 8) and 3,152 spaces are needed on weekends (see Table 9). Both of these figures correspond well to an audit of current parking spaces done by examining an aerial photo of the study area, which found approximately 3,156 parking spaces in the study area.
5.2 Future Peak Parking Demand without the Intermodal Station Clearly, expansion of retail property in this area is limited by the need to maintain adequate parking during peak periods. Assuming that adequate parking would be provided, however, the Dimond Center has indicated a possible expansion of retail in the study area by around 40,000 to 50,000 sf GLA. The parking requirements for this expansion would depend upon the type of land use. Several possible scenarios were considered to determine parking needs in excess of the spaces already provided. [NOTE: These scenarios do not represent any specific plans for expansion on the part of the Dimond Center, rather they were chosen to represent an array of possible future land uses: ranging from those that would impact parking the least (adding office space) to those with the highest unmet parking demand (adding convention space)]. Results of this analysis are shown in Table 10.
Change in Land Use
Weekday Peak Period Parking
Demand
Weekend Peak Period Parking
Demand
Number of New Parking Spaces
Needed
% Change in Maximum Peak Period Parking
Demand
Current 3,090 3,152 N/A N/A
Add 50,000 sf retail 3,299 3,393 241 8%
Add 25,000 sf retail 25,000 sf office
3,263 3,276 124 4%
Add 50,000 sf office 3,232 3,160 80 3%
Add convention rooms to hotel 3,486 3,063 334 11%
Table 10: Peak Parking Demand for Expansion of Dimond Center Scenarios
5.3 Peak Parking Demand with the Intermodal Station The daily ridership predicted for the Dimond train station is 150 to 300 in 2015 and 175 to 350 in 2030, where the higher number reflects October through December peak period usage. The base ratio for the land use (taken from Land Use 093, Light Rail Transit Station with Parking, in Parking Generation) is shown in Table 11. The same rate was used for weekends and weekdays because there is no information for weekends in Parking Generation. No non-captive adjustment was made for this use. The mode adjustment factor was set at 75%, based on the assumption that riders

Dimond Center Intermodal Facility Feasibility Study Task 2-Service Demand Estimates August 2011
Kinney Engineering, LLC Page 26
transferring from public transit buses would arrive at the station by a mode other than private automobile (according to Table 5 and Table 6 on page 15, 25% of the projected peak period train ridership transfers from public transit).
Base Ratio Units
Dimond Center Intermodal Facility Customer 0.2067 / boardings Employee 0.0053 / boardings
Table 11: Parking Base Ratio for Dimond Center Intermodal Facility
The peak parking demand for the train station is thus predicted to be about 33 spaces in 2015 and 38 spaces in 2030.
Another way to consider parking demand for a park-and-ride facility is to consider the features of the surrounding neighborhoods and traffic network. The Florida Department of Transportation’s Update of FDOT State Park & Ride Lot Program Planning Manual presents a methodology for determining demand for park and ride facilities by considering the volume of traffic on the nearby streets. Inputs into this model include the average annual daily traffic (AADT), the percentage of daily traffic in the peak hour (K), and the directional distribution of traffic in the peak hour (DD). This information is used to determine the peak hour traffic in the main direction of travel. These volumes are further modified by applying factors that limit the design period to a portion of an hour depending on level of AADT and that specify the percentage of passing traffic during that time period that would use the park-and-ride facility. Following this methodology, it was determined that latent park-and-ride demand for the Dimond Center is approximately 80 parking spaces. This number would represent combined demand for park-and-ride from both rail and bus passengers.
A number of factors affect the attractiveness of a potential park-and-ride site, which in turn would affect the parking demand. These are shown in Table 12. Given that there is no evidence of current park-and-ride activity, it can be presumed that the distance of the Dimond Transit Center from the Seward Highway and traffic congestion between the Seward Highway and the Dimond Transit Center significantly reduces the park-and-ride demand at this location.

Dimond Center Intermodal Facility Feasibility Study Task 2-Service Demand Estimates August 2011
Kinney Engineering, LLC Page 27
Increase park-and-ride demand: Decrease park-and-ride demand:
• Served by transit • Upstream from major bottleneck on
Seward Highway • Parking area is secure
• Further than ½ mile from freeway (Seward Highway)
• Not visible from Seward Highway • Several traffic signals and
significant congestion between Seward Highway and proposed park-and-ride facility
Table 12: Factors Affecting Park-and-Ride Demand at Dimond Center Intermodal Facility
6 References • Dimond Center. “Dimond Center: Alaska’s favorite mall,” marketing brochure for
the Dimond Center. April, 2009. Accessed at http://www.dimondcenter.com /leasing.htm# on November 1, 2010.
• “Anchorage’s Dimond Center.” Mall Hall of Fame, November 1, 2007. Accessed at http://mall-hall-of-fame.blogspot.com/search/label/Alaska on November 1, 2010.
• “Planning Department Planning Staff Analysis Site Plan Review, Case No. 2001-162,” Municipality of Anchorage, October 8, 2001. Accessed at http://munimaps.muni.org/website/planning/staffcomments/2001-162.pdf on November 1, 2010.
• “Planning Department Planning Staff Analysis Site Plan Review, Case No. 2007-085,” Municipality of Anchorage, June 4, 2007. Accessed at http://munimaps.muni.org/planning/pzdocs/staffcomments/2007-085.pdf on November 1, 2010.
• “Anchorage Bowl Land Use Plan Map,” draft approved in concept by the Planning and Zoning Commission, Municipality of Anchorage, June 28, 2006. Accessed at http://www.muni.org/Departments/Planning/Projects/ AnchLandUse/Pages/default.aspx on November 1, 2010.
• Economic & Planning Systems, Inc. and GDeS Architecture & Planning. “Anchorage Industrial Land Assessment,” prepared for Anchorage Economic Development Corporation and the Municipality of Anchorage, March 31, 2009. Accessed at http://www.muni.org/Departments/Planning/Publications/Pages /IndustrialLandAssessment.aspx on November 1, 2010.

Dimond Center Intermodal Facility Feasibility Study Task 2-Service Demand Estimates August 2011
Kinney Engineering, LLC Page 28
• Irwin, David. “2010 Anchorage Retail Market Forecast” presented to Building Owners and Managers Association Anchorage, January 2010. Accessed at http://www.bomaanchorage.com/ on November 1, 2010.
• Bluemink, Elizabeth. “Stores feel pinch as long Anchorage Retail Boom Trails Off,” Anchorage Daily News, March 25, 2010. Accessed at http://www.adn.com/2010/03/24/1198066/retail-boom-trails-off.html on November 1, 2010.
• Anchorage International Airport Statistics System. Monthly Enplanement Data.
• CTPP Profile using 2005-2007 American Community Survey for the Municipality of Anchorage. Downloaded from http://ctpp.transportation.org (a website of the American Association of State Highway and Transportation Officials).
• Chu, Xuehao, Laurel Land, and Ram Pendyala. “Update of FDOT State Park and Ride Lot Program Planning Manual,” Center for Urban Transportation Research, University of South Florida, April 2001. Accessed at http://www.dot.state.fl.us/research-center/Completed_PTO.shtm on 9 August 2011.
• Burns, E.N. “Priority Rating of Potential Park-and-Ride Sites,” ITE Journal, February 1979.

Dimond Center Intermodal Facility Feasibility Study Task 2-Service Demand Estimates August 2011
Kinney Engineering, LLC
APPENDIX A – Data Tables

Dimond Center Intermodal Facility Feasibility Study Task 2-Service Demand Estimates August 2011
Kinney Engineering, LLC
Table A- 1: Estimated Average Daily Line Ridership for Mat-Su Valley / Anchorage Service (Source: WSA 2002)
WSA 2002 (2015H) Low High
Annual 193,000 231,000 Year Horizon
Daily (/330) 585 700 1 2015
591 707 2 2016
Assumes Mat-Su 597 714 3 2017
Service 603 721 4 2018
609 728 5 2019
Line ridership 615 736 6 2020
621 743 7 2021
627 750 8 2022
633 758 9 2023
640 766 10 2024
646 773 11 2025
652 781 12 2026
659 789 13 2027
666 797 14 2028
672 805 15 2029
679 813 16 2030
Table A- 2: Estimated Average Daily Station Ridership for DCIF (Source: WSA 2002)
WSA 2002 (2015H) Low High Year Horizon
Daily 29 35 1 2015
30 35 2 2016
Assumes Mat-Su 30 36 3 2017
Service 30 36 4 2018
30 36 5 2019
Dimond only 31 37 6 2020
31 37 7 2021
31 38 8 2022
32 38 9 2023
32 38 10 2024
32 39 11 2025
33 39 12 2026
33 39 13 2027
33 40 14 2028

Dimond Center Intermodal Facility Feasibility Study Task 2-Service Demand Estimates August 2011
Kinney Engineering, LLC
WSA 2002 (2015H) Low High Year Horizon
34 40 15 2029
34 41 16 2030
Table A- 3: Estimated Average Daily Line Ridership for Girdwood – Anchorage Service (Source: WSA 2002)
WSA 2002 (2015H) Low High
Annual 11,000 Year Horizon
Daily (/330) 33 1 2015
34 2 2016
Girdwood Only 34 3 2017
Service 34 4 2018
35 5 2019
Line ridership 35 6 2020
35 7 2021
36 8 2022
36 9 2023
36 10 2024
37 11 2025
37 12 2026
38 13 2027
38 14 2028
38 15 2029
39 16 2030
Table A- 4: Estimated Average Daily Station Ridership for DCIF (Source: WSA 2002)
WSA 2002 (2015H) Low High Year Horizon
Daily 1.67 1 2015
1.68 2 2016
Girdwood Only 1.70 3 2017
Service 1.72 4 2018
1.73 5 2019
Dimond only 1.75 6 2020
1.77 7 2021
1.79 8 2022
1.80 9 2023
1.82 10 2024

Dimond Center Intermodal Facility Feasibility Study Task 2-Service Demand Estimates August 2011
Kinney Engineering, LLC
1.84 11 2025
1.86 12 2026
1.88 13 2027
1.90 14 2028
1.92 15 2029
1.93 16 2030
Table A- 5: Estimated Average Weekday Line Ridership for Mat-Su Valley to Anchorage Service (Source: WSA 2009)
WSA 2009 (2020H) Low High Year Horizon
1141 1522 2015
1153 1537 2016
1164 1552 2017
1176 1568 2018
1188 1584 2019
Weekday (Forecast Year) 1,200 1,600 1 2020
1212 1616 2 2021
1224 1632 3 2022
Assumes Mat-Su 1236 1648 4 2023
Service 1249 1665 5 2024
1261 1682 6 2025
Uses KABATA Model 1274 1698 7 2026
1287 1715 8 2027
Case 1 (Max Build) 1299 1733 9 2028
1312 1750 10 2029
1326 1767 11 2030
5% capture for DCIF
Year 2015 57 76
Year 2030 66 88
Table A- 6: Total Monthly ANC Enplanements (000s) Source: ANC Statistics
Total Month
337 1 Jul-07
328 2
225 3
174 4

Dimond Center Intermodal Facility Feasibility Study Task 2-Service Demand Estimates August 2011
Kinney Engineering, LLC
Total Month
161 5
172 6
157 7
143 8
178 9
157 10
239 11
293 12
339 13
360 14
226 15
178 16
151 17
170 18
155 19
133 20
158 21
149 22
189 23
259 24
303 25
296 26
212 27
169 28
150 29
168 30
153 31
130 32
159 33
151 34
193 35
263 36 June 2010
205 AVG
6.831481 /30 Daily
Table A- 7: Estimated Daily Enplanement Diversions to DCIF (Source: ANC Statistics)
7,000 Daily Low Capture High Capture Year Horizon

Dimond Center Intermodal Facility Feasibility Study Task 2-Service Demand Estimates August 2011
Kinney Engineering, LLC
7,000 Daily Low Capture High Capture Year Horizon
70 1% 140 2% 1 2010
71 141 2 2011
71 143 3 2012
72 144 4 2013
73 146 5 2014
74 147 6 2015
74 149 7 2016
75 150 8 2017
76 152 9 2018
77 153 10 2019
77 155 11 2020
78 156 12 2021
79 158 13 2022
80 159 14 2023
80 161 15 2024
81 163 16 2025
82 164 17 2026
83 166 18 2027
84 167 19 2028
85 169 20 2029
85 171 21 2030
Table A- 8: AMATS Forecast Ridership for People Mover Bus Routes Serving the Dimond Center (Source: AMATS 2027 model)
AMATS Bus Estimate Horizon Year
948 2030
938 2029
929 2028
Model Forecast Year 920 2027
911 2026
902 2025
893 2024
884 2023
875 2022
866 2021
858 2020
849 2019
840 2018

Dimond Center Intermodal Facility Feasibility Study Task 2-Service Demand Estimates August 2011
Kinney Engineering, LLC
832 2017
824 2016
815 2015
Diversion to DCIF Rail Service Low (5%) High (7%)
Year 2015 41 57
Year 2030 47 66

Dimond Center Intermodal Facility Feasibility Study Task 2-Service Demand Estimates August 2011
Kinney Engineering, LLC
APPENDIX B – AMATS Model 2027 Population and Employment Maps

Dimond Center Intermodal Facility Feasibility Study Task 2-Service Demand Estimates August 2011
Kinney Engineering, LLC

Dimond Center Intermodal Facility Feasibility Study Task 2-Service Demand Estimates August 2011
Kinney Engineering, LLC