mussels to kcl solutions in different source waters › pdf › 2016abstracts › icais wednesday...
TRANSCRIPT

Mortality responses of Quagga
Mussels to KCl Solutions in Different
Source Waters
Christine
Moffitt U.S. Geological
Survey
University of Idaho
19th International Conference on Aquatic Invasive
Species 2016
Renata
Claudi RNT Consulting
Kelly
Stockton-Fiti KASF Consulting

KCL as a Control Tool?
• Disinfection of equipment, boats, or fish hauling trucks
• Prevention of settlement or establishment
• Response to introduction in open or contained waters
• Low risk to non- molluscan species, fish, vegetation, or human exposure

KCl (Potash) to control Z/Q Mussels
• Veliger zebra mussels - KCl (~ 750 mg/L) + chemical • 100% mortality in Great Lakes region
• Short exposure times (2-3 hrs)
• Showed little harm to fish with short term exposure
• Byssal zebra mussels - ~100 mg/L for 30 days • Milbrook Quarry, VA
• Lake Winnipeg and Christmas Lake, MN
• Veliger quagga mussels - >2,000 mg/L • Colorado River at WBNFH by Sykes showed no veliger
mortality
• Colorado River at LMFH by Pucherelli et al. no veliger mortality

Uncertainty in Data and Efficacy
• Few studies addressed quagga mussels
•Water quality criteria not addressed in studies of efficacy
• Temperature and time of year effects?

Objectives
• Test efficacy of KCl as a toxicant on byssal and veliger quagga mussels
•Compare responses in different water sources
• Explore response with water quality criteria such as conductivity and metals

Studies at WBNFH
• May – June, & August – Sept
• Static exposure to KCl • Byssal stage: 100 and 200 mg/L with
renewals every 48 h
• Veligers: 960 mg/L
• Tests with Colorado River water, U of I groundwater & Snake River water

Pathogen free, filtered,
dechlorinated well water
Surface water, filtered 35 µm plankton net
Columbia River Water Sources
Ground water, Moscow, ID
Surface water, Snake River, ID

Studies in Lake Ontario • October – Dec 2015
• Water and mussels from Lake Ontario Waupoos Marina
• Static exposure to KCl • Byssal stage: 100 mg/L with renewal after 48 h
• Veligers: 960 mg/L

Veliger trials – 960 mg/L
• May – June, August – Sept , October • WBNFH Colorado River, Snake River,
UI ground water, and Lake Ontario at Picton
• KCl (analytical grade) @ ~ 20°C
• Exposure times of 1, 3, 4, 5, 8, 10, 12, 24 hours
• Fast green dye used to assist assessment of mortality
• Water quality analysis • Salinity, pH, DO, cond, TDS
• Metals profile • Dissolved and total
• With and without KCl

Variations in mortality to KCl within different water sources
Probit Model Predictions
Hours of Exposure
-6 -4 -2 0 2 4 6 8 10 12 14 16
Pro
ba
bili
ty o
f M
ort
alit
y
0.0
0.1
0.2
0.3
0.4
0.5
0.6
0.7
0.8
0.9
1.0
Snake River
U of Idaho
Lake Ontario
• Colorado River little to no mortality over 24 h
• Lethal Time 50%
• UI water = 2.7 h
• ON = 3.7 h
• SR water = 5.8 h
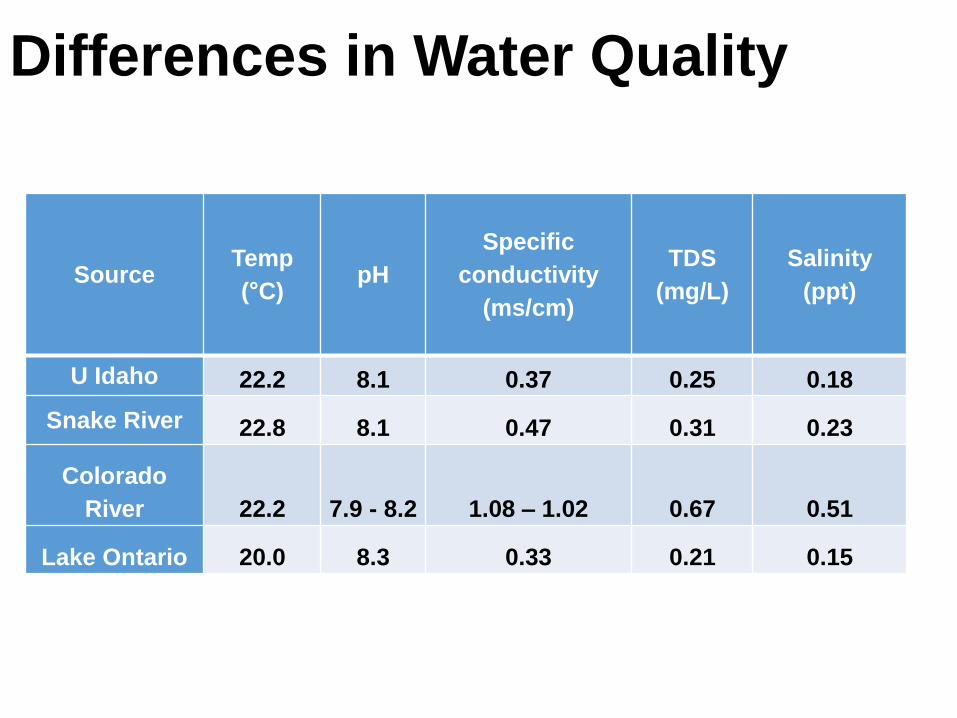
Differences in Water Quality
Source Temp
(°C) pH
Specific
conductivity
(ms/cm)
TDS
(mg/L)
Salinity
(ppt)
U Idaho 22.2 8.1 0.37 0.25 0.18
Snake River 22.8 8.1 0.47 0.31 0.23
Colorado
River 22.2 7.9 - 8.2 1.08 – 1.02 0.67 0.51
Lake Ontario 20.0 8.3 0.33 0.21 0.15
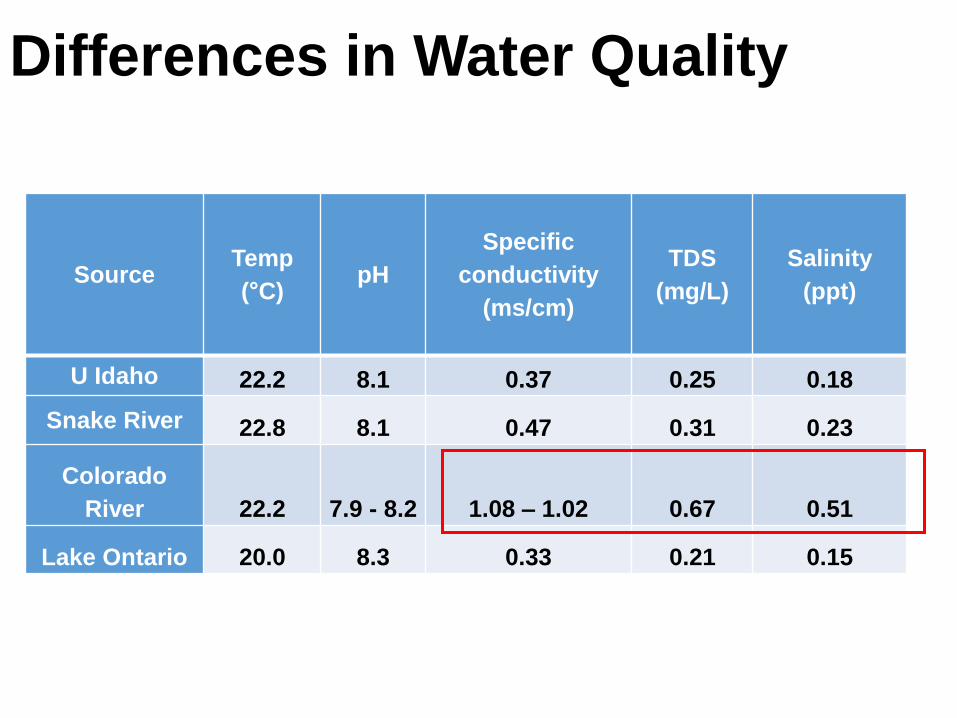
Differences in Water Quality
Source Temp
(°C) pH
Specific
conductivity
(ms/cm)
TDS
(mg/L)
Salinity
(ppt)
U Idaho 22.2 8.1 0.37 0.25 0.18
Snake River 22.8 8.1 0.47 0.31 0.23
Colorado
River 22.2 7.9 - 8.2 1.08 – 1.02 0.67 0.51
Lake Ontario 20.0 8.3 0.33 0.21 0.15

• Na+, Ca++, Mg++ higher in Colorado River water source
• No difference in K+ levels of test waters after KCl addition
Metals Profile of Water Sources
Water and Treatment
CR-C UI-C SR-C ON-C
Co
ncen
trati
on
mg
/L
0
20
40
60
80
100
120Calcium
Potassium
Sodium
Magnesium
Colorado R U of I Snake R Ontario L

Adjusted Conductivity of Snake River and Lake Ontario with NaCl Addition
Source Sp. Cond
(ms/cm)
unadjusted
Adjusted
conductivity
Adjusted
TDS
Adjusted
salinity
Colorado
River
Not adjusted
1.02 – 1.08 1.02 - 1.08 0.67 0.51
Snake River 0.47 1.04 0.68 0.52
Lake Ontario 0.33 0.91 0.59 0.45

Survival of Veligers in Lake Ontario and Snake River Water Compared with Colorado River
Veliger Survival in 960 mg/L KCl
Hours
0 5 10 15 20 25 30
Perc
en
t S
urv
ival
0
20
40
60
80
100
Snake River
Colorado River Aug-Sept
Lake Ontario

Survival Comparisons with NaCl addition Equivalent to Colorado River
Survival in
salinity
adjusted water
resembled that
in Colorado
River water
Veliger Survival in 960 mg/L KCl
Hours
0 5 10 15 20 25 30
Perc
en
t S
urv
ival
0
20
40
60
80
100
Snake River
Colorado River Aug-Sept
Snake River NaCl added
Lake Ontario
Lake Ontario NaCl added
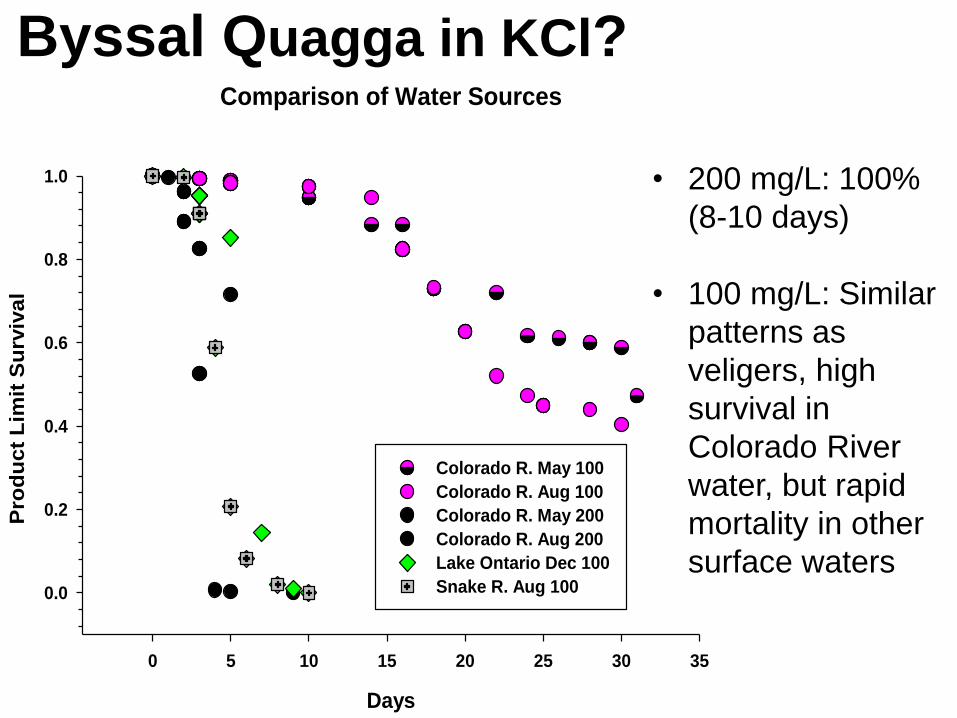
Byssal Quagga in KCl?
• 200 mg/L: 100%
(8-10 days)
• 100 mg/L: Similar
patterns as
veligers, high
survival in
Colorado River
water, but rapid
mortality in other
surface waters
Comparison of Water Sources
Days
0 5 10 15 20 25 30 35
Pro
du
ct
Lim
it S
urv
iva
l
0.0
0.2
0.4
0.6
0.8
1.0
Colorado R. May 100
Colorado R. Aug 100
Colorado R. May 200
Colorado R. Aug 200
Lake Ontario Dec 100
Snake R. Aug 100

Survival in 100 mg/L KCl
Days
0 5 10 15 20 25 30 35
Pro
du
ct
Lim
it S
urv
iva
l
0.0
0.2
0.4
0.6
0.8
1.0
Colorado R. May 100
Colorado R August 100
Lake Ontario Dec 100
Snake River Aug 100
Lake Ontario NaCl & 100 KCl
What Happens with Addition of NaCl?
Survival looks
like Colorado
River !

Survival of Controls
Days
0 5 10 15 20 25 30 35
Pro
du
ct
Lim
it S
urv
iva
l
0.0
0.2
0.4
0.6
0.8
1.0
Colorado R. May
Colorado R. Aug
Snake R. Aug
Lake Ontario Dec
Survival in Controls – no KCl?
Quagga mussels
from Colorado R
held in Snake R
water showed
significant mortality
over the 30 d

Discussion • Confirmed Sykes and Pucherelli et al. results
• Metal ion analysis and conductivity, TDS, and salinity are important water quality parameters to include in chemical toxicity trials
• Not a large seasonality effect at WBNFH

Conclusions • Na+ content of source waters may be key factor
determining mortality in KCl treatments
• Na+/K+ ion exchange membrane in quagga and zebra mussels functions similar to that of fish and other organisms • Though Na+/K+ exchange in Z/Q mussels is particularly
active (over other mollusks)
• Probability of survival of Colorado River mussels may be reduced if transported into areas of lower conductivity/salinity. Higher risk may be associated with quagga/zebra mussels adapted to low conductivity!

Acknowledgements • Funding Utah Division Wildlife Resources,
USFWS, USGS, PSMFC
• Staff and facilities at WBNFH, manager Mark Olson and Asst Mgr. Tom Frew
• Dave Parrish IDFG, and Bob Kibler USFWS for help with water collection and shipping