n e lpaa - aurora home
TRANSCRIPT

me NLpaa
Bulletin 606 March 199.Alabama Agricultural Experiment StationLowell T. Frobish, DirectorAuburn UniversityAuburn University. Alabama
-~i~
I ,

11 .1 Y ? Li br iRalph Bo' i~go rr2 1 Mcli SiAmunr University, AL 36849-5606
CONTENTS
Page
INTRODUCTION ............... ........................... 5
EXPERIMENTAL DEVELOPMENT ................................ 6
DESIGN AND METHODOLOGY .................................. 6Overall Processing Procedure ........ ................. 6Cooking Methods ........... ... ..................... 7Cooking Loss ................................ 7Proximate Analysis ....................... 7Sensory Evaluation ........... .. ..................... 8Statistical Evaluation .............................. 8
STUDY I: CONSUMER ACCEPTABILITY OF GROUND BEEF
PRODUCTS WITH VARYING FAT LEVELS ........................ 8
Design ...................................... 8Results and Discussion ............. ................. 8Conclusions ................................ ... ........ 11
STUDY II: CONSUMERS' ABILITY TO DISTINGUISH
DIFFERENCES IN GROUND BEEF PRODUCTS WITH VARYING
LEVELS OF FAT ............................................. 11Design ................................... 11Results and Discussion ............ .................. 11
C onclusions .................................. ............. 13
STUDY III: SENSORY DIFFERENCES BETWEEN OVEN AND
GRIDDLE BROILED GROUND BEEF PATTIES WITH DIFFERENT
FAT LEVELS ................................................ 13Design ................................... 13Results and Discussion ........... ................... 13C onclusions ................. .............................. 15
STUDY IV: SENSORY DIFFERENCES BETWEEN GRIDDLEBROILED AND GAS GRILL BROILED GROUND BEEF PATTIES
WITH DIFFERENT FAT LEVELS ............................... 15
Design ................................................... 15Results and Discussion ............. ................... 15
C onclusions ............................ ......... ........... 17
STUDY V: EFFECT OF GRIND SIZE ON THE SENSORY
CHARACTERISTICS OF LEAN GROUND BEEF PATTIES ........... .17
Design ................................................... 17Results and Discussion ............. ................... 18
C onclusions ......................... .. .......... ............ 18
STUDY VI: EFFECT OF THE ADDITION OF NONMEAT
INGREDIENTS ON THE SENSORY PROPERTIES OF LEAN
GROUND BEEF ...................... ........................ 19Design ................................................... 19
Results and Discussion ............. ................... 19
Conclusions .............................................. 20

PageSTUDY VII: EFFECT OF THE ADDITION OF SALT AND
HYDROLYZED VEGETABLE PROTEIN ON THE SENSORY
PROPERTIES OF LEAN GROUND BEEF PATTIES ................. 20
Design ........................... ........... 20Results and Discussion ..................... 21Conclusions ...................... ................ 22
FINAL STUDY: CHEMICAL ANALYSIS AND SENSORY EVALUATION
OF THE DEVELOPED LEAN GROUND BEEF PRODUCTS ......... 22Design ................................... 22Results and Discussion ................................. 23Conclusions ........... ........................ 26
SUM MARY ....................................... .............. 26
LITERATURE CITED ............................................ 27
FIRST PRINTING 4M, MARCH 1990
Information contained herein is available to all personswithout regard to race, color, sex, or national origin.
Advances In Lean Ground Beef ProductionDALE L. HUFFMAN and W. RUSSELL EGBERT ,2
INTRODUCTION
OVER 3 BILLION pounds of ground beef products are con-sumed annually in the United States, which accounts for 44 percentof the total fresh beef cuts available for consumption (4). These prod-ucts generally contain between 20 and 30 percent fat. A large seg-ment of today's consumer population is health conscious and is con-cerned about dietary fat. These consumers avoid meat products withhigh fat content, such as ground beef. Current trends reflect a shiftin consumers' consumption of fats, with a decrease in the intake ofvisible separable fats and an increase in consumption of low-fat ani-mal products.
A consumer climate survey has indicated that health oriented andactive life style consumers make up 50 percent of the population.These two groups of consumers are characterized by their low con-sumption of red meat. This survey indicated the U.S. population ingeneral is concerned about weight control and caloric intake (5). Astoday's consumers continue to become more healthconscious, theirdemand for lower fat ground beef products will rapidly expand.
It is important that the red meat industry develop low-fat groundbeef products tailored to meet the needs of today's diet consciousconsumers. The simple reduction of the fat in ground beef to 5-10percent would be the most efficient method of developing low-fatground beef products. However, ground beef with a fat content inthis range is generally considered less palatable than ground beefwith 20-30 percent fat. Therefore, a project was initiated to developacceptable lean ground beef products. The approach combined pres-ent knowledge about the texture, juiciness, and flavor of currentlyproduced ground beef products with changes in the technologiesused to produce these products.
'Professor and Research Associate of Animal and Dairy Sciences.2This study was funded in part by a grant from the Beef Industry Council of theNational Live Stock and Meat Board, Chicago, Illinois, and the Alabama Cattle-men's Association, Montgomery, Alabama. The contribution of nonmeat ingredientsby the Marine Colloids Division of FMC Corporation, Philadelphia, Pennsylvania,and A.C. Legg Packing Company, Birmingham, Alabama, is appreciated. Cooper-ation of John Morrell and Company, Montgomery, Alabama, is also acknowledgedwith appreciation.
6 ALABAMA AGRICULTURAL EXPERIMENT STATION
The objective of this project was to develop "lean" (90-95 percent)ground beef products with significantly reduced fat levels, which areas acceptable to the consumer in the same form as current groundbeef items.
EXPERIMENTAL DEVELOPMENT
Development of a low fat ground beef product was approached ina series of logical steps (studies), each building on the results of theprevious experiments. The first-study explored the level of fat desiredin ground beef patties based on consumer ratings. Study II was de-signed to determine consumers' ability to distinguish betweenground beef patties with varying levels of fat. The third study wasdesigned to determine the effect of cooking method on sensory prop-erties of ground beef patties and the sensory property differences be-tween ground beef products with differing fat levels. The objectivesof Study IV were the same as for Study III, however a differentmethod of cookery was used. The fifth study determined the effectof grind size on sensory traits of ground beef patties. The objectiveof Study VI was to determine the effect of various nonmeat ingredi-ents on the sensory properties of ground beef patties. Study VII de-termined the effect of the addition of salt and hydrolyzed vegetableprotein on sensory properties of lean ground beef patties. The finalstudy was designed to confirm the findings of the earlier studies andto demonstrate that the overall project objective-the developmentof a lean ground beef product with sensory properties similar tothose of a ground beef product containing 20 percent fat controlhad been accomplished.
DESIGN AND METHODOLOGY
Overall Processing Procedure
Each of the "lean" ground beef products developed was comparedto a control and was processed using manufacturing practices thatyield high quality products. Fresh beef cap meat and 50/50 beeftrimmings were each ground twice through a 1/2-inch (1.27-cm)grinder plate. Samples of both the ground cap meat and 50/50 trim-mings were taken using the "grab" method. Samples were finelyground using a Kitchenaid mixer with grinder attachments and ana-lyzed for fat content by ether extraction (2). The ground cap meat(lean component) and 50/50 trimmings (fat component) were vacuum

ADVANCES IN LEAN GROUND BEEF PRODUCTION 7
packaged in approximately 10-pound (3.0-kg) packages, frozen, andheld at -4°F (-20°C). Prior to manufacturing, the coarse ground leanand fat meat components were thawed at 41-44°F (5-7°C) for approx-imately 12 hours.
The low fat ground beef products were manufactured using the ap-propriate quantities of coarse ground lean and fat components as pre-viously formulated. The appropriate amounts of lean and fat werecombined and mixed with various combinations of the following: (1)lecithin (or other appropriate phospholipid emulsifying agents); (2)carrageenan (or other non-gel-forming food gums); and/or (3) beef ex-tract and/or other beef flavor enhancers. After the meat and nonmeatingredients had been mixed (approximately 1 minute), the productswere finely ground. These finely ground products were then madeinto 4-ounce patties using a Hollymatic (Super 54) pattie machine.Ground beef patties were stored (2 days) at 38°F (3°C)until sensoryevaluation and cooking loss analyses were completed.
Cooking Methods
Ground beef patties were: (1) Oven broiled at 350°F (177°C)for 8minutes to a well-done state using a Blodgett forced air convectionoven (G. S. Blodgett Company, Burlington, Vermont); (2) griddlebroiled to a well-done state on a Model TG-72 Special McDonald'sgrill (Wolf Range Corporation) at a temperature of 330°F (165°C) for3 1/2 minutes (2 minutes on the first side, 1 1/2 on the other); or (3)grill broiled to a well-done state on an Emberglo open hearth broiler(Model 310, Mid-Continent Metal Products Co., Chicago, Illinois) for6 minutes (4 minutes on the first side and 2 minutes on the oppositeside).
Cooking Loss
Cooking yields were determined by the difference in weight forthree patties from each treatment weighed prior to cooking and afterequilibration to room temperature 68°F (20°C). Patties evaluated forcooking loss were blotted with paper towels after cooking.
Proximate Analysis
Raw and cooked (from cooking loss determination) samples forproximate analysis were ground three times with a Kitchenaid mixerwith grinder attachments and the samples were stored frozen at -4°ESamples held at this temperature were used for determination ofmoisture, petroleum ether-extractable lipid, and protein content ofthe raw products. Moisture, lipid, and protein content of each prod-uct was determined with AOAC (2) approved methods.
8 ALABAMA AGRICULTURAL EXPERIMENT STATION
Sensory Evaluation
Cooked patties were cut into six wedges. These were held in a con-ventional oven at 104°F (40°C) until evaluated by a 9-member trainedsensory panel (1) for juiciness (initial and sustained), tenderness, fla-vor, and overall acceptability on an 8-point hedonic scale (1 = ex-tremely dry, extremely tough, extremely bland, extremely unaccept-able and 8 = extremely juicy, extremely tender, extremely intense,and extremely acceptable, respectively). Texture was rated on a 7-point hedonic scale (1 = more sandy, 4= typical of ground beef, and7 = more mushy). Panel members were selected from students, fac-ulty, and staff of the Department of Animal and Dairy Sciences.Panelists were served one wedge of each of the treatments in a ran-dom order. Unsalted crackers, apple juice, and water at room tem-perature were also served. Each treatment was evaluated once byeach panelist on three separate occasions.
Statistical Evaluation
The experimental data were statistically analyzed using the generallinear model (12) where applicable. When a significant F-value(P<0.05) was found, Tukeys' mean separation procedure (13) wasemployed to determine differences between means.
STUDY I: CONSUMER ACCEPTABILITY OF GROUNDBEEF PRODUCTS WITH VARYING FAT LEVELS
Design
Ground beef patties were formulated to contain five different lev-els of fat (5, 10, 15, 20, and 25 percent), using the cap meat and 50/50 trim as previously described. The patties were griddle broiled aspreviously described and evaluated by a 30-member untrained con-sumer-type panel. Panelists were instructed to evaluate the samplesfor overall acceptability on a 10-number descriptive analysis (1) scale(0 = dislike extremely and 10 = like extremely). The study was rep-licated three times and the data were analyzed using analysis of var-iance procedures as previously described.
Results and Discussion
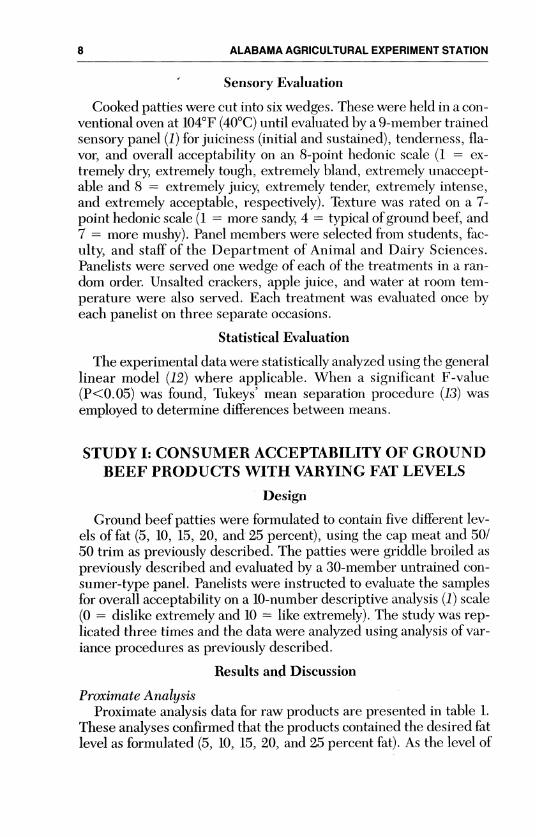
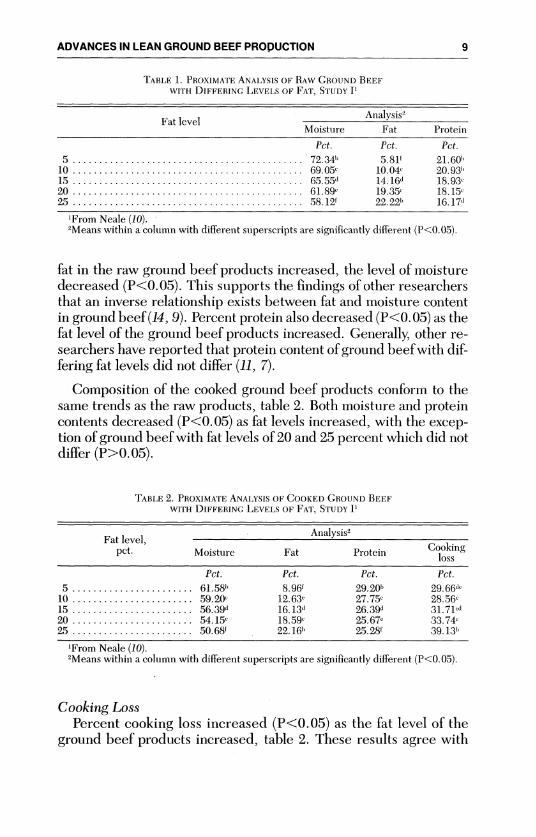
Proximate AnalysisProximate analysis data for raw products are presented in table 1.
These analyses confirmed that the products contained the desired fatlevel as formulated (5, 10, 15, 20, and 25 percent fat). As the level of
ADVANCES IN LEAN GROUND BEEF PROpUCTION 9
TABLE 1. PROXIMATE ANALYSIS OF RAW GROUND BEEFWITH DIFFERING LEVELS OF FAT, STUDY I'
Fat level Analysis'
Moisture Fat Protein
Pct. Pct. Pct.
5 ........................................ 72.34" 5.81 21.60"10 ........................................ 69.05' 10.04' 20.93"15 ......................................... 65.55d 14.16' 18.93.20 ........................................ 61.89' 19.35' 18.15'25 ........................................ 58.12' 22.22' 16.17
d
'From Neale (10)."Means within a column with different superscripts are significantly different (P<O.05).
fat in the raw ground beef products increased, the level of moisturedecreased (P<0.05). This supports the findings of other researchersthat an inverse relationship exists between fat and moisture contentin ground beef (14, 9). Percent protein also decreased (P<0.05) as thefat level of the ground beef products increased. Generally, other re-searchers have reported that protein content of ground beef with dif-fering fat levels did not differ (11, 7).
Composition of the cooked ground beef products conform to thesame trends as the raw products, table 2. Both moisture and proteincontents decreased (P<0.05) as fat levels increased, with the excep-tion of ground beef with fat levels of 20 and 25 percent which did notdiffer (P>0.05).
TABLE 2. PROXIMATE ANALYSIS OF COOKED GROUND BEEFWITH DIFFERING LEVELS OF FAT, STUDY 11
Fat level, Analysis2Cooking
pet. Moisture Fat Protein loss
Pct. Pct. Pct. Pct.5 ....................... 61.58b 8.96' 29.20' 29.66'
10 ....................... 59.20' 12.63' 27.75' 28.56'15 ....................... 56.39d 16.13" 26.39" 31.71jd20 ....................... 54.15' 18.59' 25.67' 33.74'25 ....................... 50.68' 22.16b 25.28' 39.13 '
'From Neale (10).2Means within a column with different superscripts are significantly different (P<0.05).
Cooking LossPercent cooking loss increased (P<0.05) as the fat level of the
ground beef products increased, table 2. These results agree with

ALABAMA AGRICULTURAL EXPERIMENT STATION
TABLE 3. OVERALL ACCEPTABILITY SCORES OF GROUND BEEF PATIESWITH DIFFERING LEVELS OF FAT, STUDY I
Fat level Overall acceptabilitypct. scores1, 2,3
5 ......................................................... 4.82W10 ............ . . . . . ........................................ 5 .13'e15 ........................................................ 5.77«d20 ............ . . . . . ........................................ 6.07c25 ........................................................ 5.35 d
'From Neale (10)."Overall acceptability score on a 10 to 0 scale (10 = like extremely, 0 = dislike extremely).3Means within a column with different subscripts are significantly different (P<0.05).
Overall acceptability score
6.25
6.00
5.75
5.50
5.25
5.00
4.75 I I I I5 10 15 20 25
Fat level, %
FIG. 1. Optimal overall acceptability of ground beef patties based on fat content, on a10-0 scale (10 = like extremely, 0 = dislike extremely).
10
ADVANCES IN LEAN GROUND BEEF PRODUCTION
other researchers that cooking yields are inversely related to the fatcontent of the product (8,11,9, 6).
Sensory EvaluationOverall acceptability scores for the ground beef products with dif-
fering levels of fat are presented in table 3. Panelists found groundbeef with 15 and 20 percent fat to be more desirable (P<0.05) thanground beef with 5 percent fat. Overall acceptability tended to de-crease with decreasing fat levels. Ground beef with 25 percent fatwas not different (P>0.05) from any of the other fat levels.
Conclusions
Consumer panelists gave the highest (P<0.05) ratings for overallacceptability to ground beef patties formulated to 20 percent fat, fol-lowed by patties formulated to 15 percent fat. An increase or de-crease in the fat content of ground beef patties from a fat content of20 percent resulted in a decrease in overall acceptability of the prod-ucts, figure 1. Based on consumer ratings, ground beef products for-mulated to 20 percent fat should be used as the control in the devel-opment of ground beef products with reduced fat levels.
STUDY II: CONSUMERS' ABILITY TO DISTINGUISHDIFFERENCES IN GROUND BEEF PRODUCTS WITH
VARYING LEVELS OF FAT
Design
Ground beef products were formulated to contain 12.5, 15.0, 17.5,20.0, and 22.5 percent fat using the raw materials and procedures asdescribed previously. These products were evaluated by a consumerpanel using a triangle test (3). Panelists were served three samples(two samples of one product and one of a second allotted at random)and asked to identify the different sample. All product combinationswere evaluated by a 50-member consumer panel. Differences be-tween the ground beef products were determined based on the num-ber of correct responses (3).
Results and Discussion
No difference (P>0.05) was found between ground beef with a fatlevel of 12.5 and 15.0 percent, 17.5 and 20.0 percent, and 12.5 and
11
12 ALABAMA AGRICULTURAL EXPERIMENT STATION
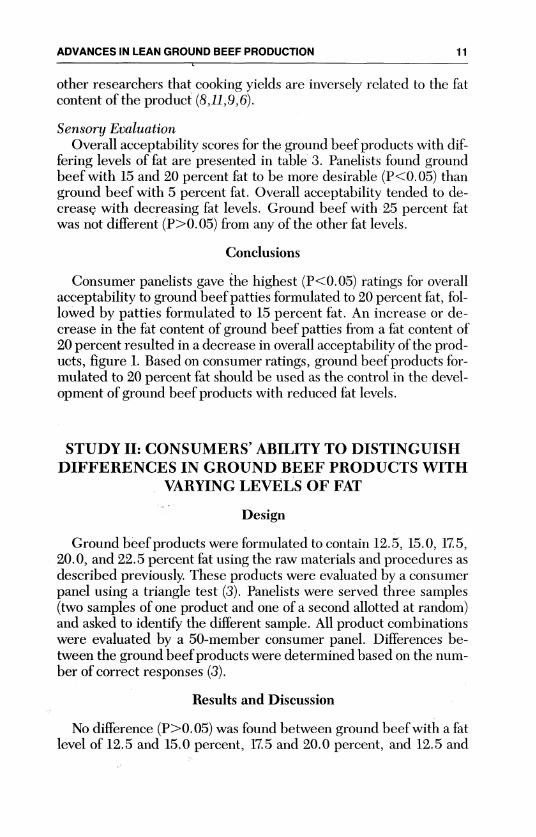
22.5 percent, table 4. This was expected for the products that dif-fered by only 2.5 percent fat, however not finding a significant differ-ence between ground beef containing 12.5 and 22.5 percent was un-expected. For this reason, the 12.5 and 22.5 percent ground beefproducts were reformulated and tested a second time with a 50-member consumer panel. The results of the second consumer panelwere similar to the first in that the sensory panel could not detect(P>0.05) a difference between the samples (could not identify the dif-ferent sample). However, panelists were able to detect differences of5 and 7.5 percent in all other cases, table 4. Panelists were also ableto detect a difference between ground beef with 15.0 percent fatcompared to 17.5 percent and 20.0 percent compared to 22.5 percent(a 2.5 percent difference).
TABLE 4. CONSUMERS' ABILITY TO DISTINGUISH BETWEEN GROUND BEEFWITH DIFFERING LEVELS OF FAT, STUDY II
Fat level Fat level', pet.pet. 15.0 17.5 20.0 22.5
12.5 .......................................... NS * ** NS15.0 .......................................... ** * **17.5...........................................NS **20.0...........................................
'NS = no significant difference (P>0.05), * = significant difference (P<0.05), **=highlysignificant difference (P<0.01).
A summary of the ability of consumers to detect fat level differ-ences is shown in table 5. Approximately 30 percent of the consumerswere able to detect a fat level difference of 2.5 percent, approximately50 percent of the consumers could detect a fat level difference of 5.0percent, about 54 percent of the consumers could detect a differenceof 7.5 percent, but only approximately 42 percent of the consumerscould detect a difference in fat of 10 percent.
TABLE 5. PERCENTAGE OF CONSUMERS ABLE TO DISTINIGUISH BETWEEN GROUND BEEFPRODUCTS WITH A GIVEN DIFFERENCE IN FAT LEVEL, STUDY II
Fat level differences, Percentage ofpct. consumers
2.5 .......................................................... 30.45.0 .......................................................... 49.37.5 .......................................................... 54.2
10.0 .......................................................... 41.8
12
Conclusions
From this study it was determined that consumers could consis-tently distinguish between ground beef products that differed by 5 to7.5 percent fat. Further research in this area could provide useful in-formation for explaining the observation that no difference (P>0.05)was detected between ground beef products containing 12.5 and22.5 percent fat (10 percent difference). Based on these results, it ap-pears that less than half of consumers are able to detect fat level dif-ferences of ground beef patties in the range of 2.5 percent to 10.0 per-cent.
STUDY III: SENSORY DIFFERENCES BETWEENOVEN AND GRIDDLE BROILED GROUND BEEF
PATTIES WITH DIFFERENT FAT LEVELS
Design
Ground beef patties containing 5, 10, 15, and 20 percent fat wereprepared using beef cap meat and 50/50 beef trimmings as describedpreviously. Patties were cooked (broiled) for sensory evaluation usingeither a gas griddle or convection oven as previously described. Pre-pared samples were served to a trained sensory panel. Panelists wereinstructed to evaluate each sample for juiciness (initial and sus-tained), tenderness, beef flavor intensity, and overall acceptability onan 8-point hedonic scale and on a 7-point hedonic scale for texture asdescribed previously. Moisture, fat, and protein content and cookingloss were determined for cooked ground beef patties. The study wasreplicated three times and the data were analyzed using analysis ofvariance procedures.
Results and Discussion
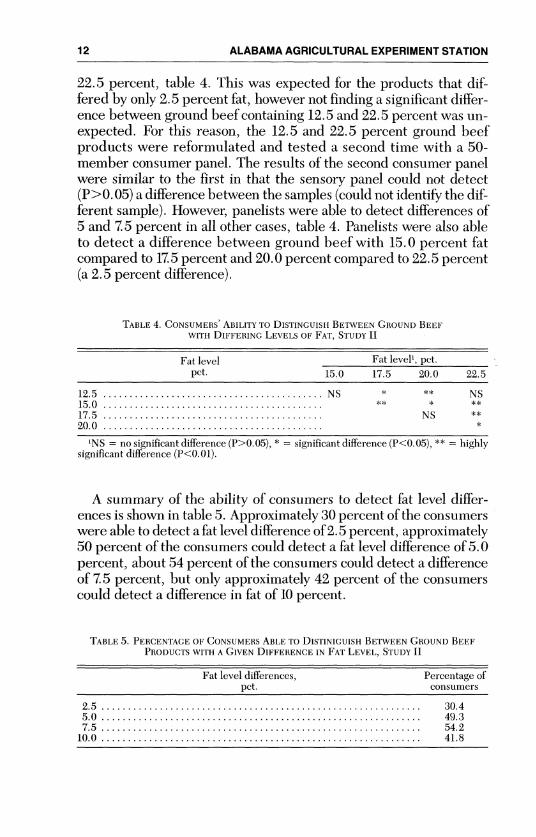
Cooking MethodNo differences were found (P>0.05) between ground beef patties
when griddle broiled compared to convection oven broiled for thesensory attributes: juiciness (initial or sustained), tenderness, or tex-ture, table 6. Ground beef patties broiled using the gas griddle, how-ever, were rated higher (P<0.05) by sensory panelists for beef flavorintensity and overall acceptability than those broiled using the con-vection oven, table 6. No differences (P>0.05) were found betweenthe two cooking methods for moisture, fat, protein, or cooking loss,table 6. However, there was a trend for patties cooked in the convec-tion oven to have greater losses from cooking than patties broiled onthe gas griddle.
ADVANCES IN LEAN GROUND BEEF PRODUCTION 13
ALABAMA AGRICULTURAL EXPERIMENT STATION
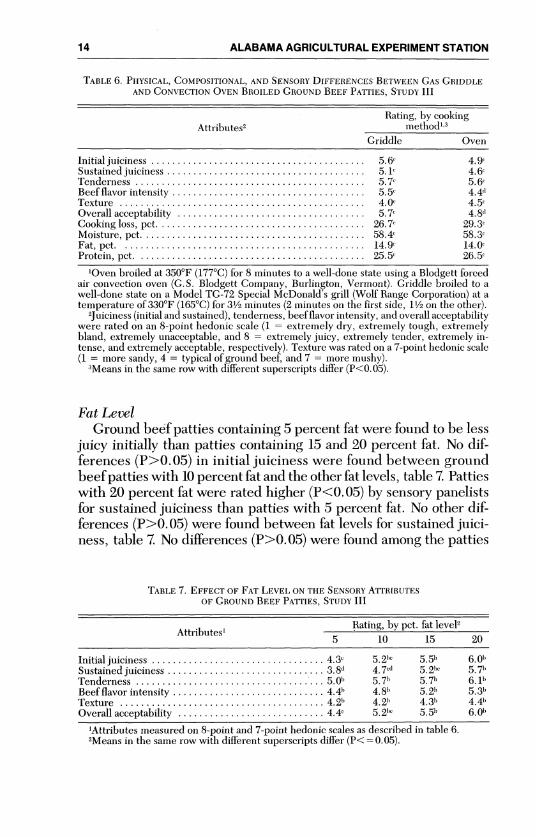
TABLE 6. PHYSICAL, COMPOSITIONAL, AND SENSORY DIFFERENCES BETWEEN GAS GRIDDLEAND CONVECTION OVEN BROILED GROUND BEEF PATTIES, STUDY III
Rating, by cookingAttributes' method' ,3
Griddle Oven
Initial juiciness ...................................... 5.6c 4.9cSustained juiciness.................................... 5. i 4.6 cTenderness ......................................... 5.7, 5.6cBeef flavor intensity ................................... 5.5 4.4 d
Texture ............................................ 4.0 4.5 c
Overall acceptability .................................. 5.7, 4.8d
Cooking loss, pet. ..................................... 26.7 29.3c
Moisture, pct. ...................................... 58.4 58.3c
Fat, pct .. .......................................... 14.9 14.0,Protein, pet . .......................................... 25.5, 26.5'
'Oven broiled at 350°F (177°C) for 8 minutes to a well-done state using a Blodgett forcedair convection oven (G.S. Blodgett Company, Burlington, Vermont). Griddle broiled to awell-done state on a Model TG-72 Special McDonald's grill (Wolf Range Corporation) at atemperature of 330°F (165°C) for 31/2 minutes (2 minutes on the first side, 11 on the other).
2Juiciness (initial and sustained), tenderness, beef flavor intensity, and overall acceptabilitywere rated on an 8-point hedonic scale (1 = extremely dry, extremely tough, extremelybland, extremely unacceptable, and 8 = extremely juicy, extremely tender, extremely in-tense, and extremely acceptable, respectively). Texture was rated on a 7-point hedonic scale(1 = more sandy, 4 = typical of ground beef, and 7 = more mushy).
3Means in the same row with different superscripts differ (P<0.05).
Fat LevelGround beef patties containing 5 percent fat were found to be less
juicy initially than patties containing 15 and 20 percent fat. No dif-ferences (P>0.05) in initial juiciness were found between groundbeef patties with 10 percent fat and the other fat levels, table 7. Pattieswith 20 percent fat were rated higher (P<0.05) by sensory panelistsfor sustained juiciness than patties with 5 percent fat. No other dif-ferences (P>0.05) were found between fat levels for sustained juici-ness, table 7. No differences (P>0.05) were found among the patties
TABLE 7. EFFECT OF FAT LEVEL ON THE SENSORY ATrRIBUTESOF GROUND BEEF PATYIES, STUDY III
AttributesRating, by pet. fat level2
5 10 15 20
Initial juiciness ................................ 4.3' 5.2' 5.5' 6.0'Sustained juiciness ............................. 3.8d 4.7«d 5.2' 5.7Tenderness ................................... 5.0' 5.7' 5.7' 6.1'Beef flavor intensity ............................ 4.4' 4.8' 5.2' 5.3'Texture ...................................... 4.2' 4.2' 4.3' 4.4'Overall acceptability ............................ 4.4' 5.2" 5.51 6.0'
'Attributes measured on 8-point and 7-point hedonic scales as described in table 6.2Means in the same row with different superscripts differ (P< 0.05).
14

from the different fat levels for tenderness, beef flavor intensity, ortexture. However, there was a trend for ground beef patties withhigher percentages of fat to have increased tenderness and beef flavorintensity. Ground beef patties containing 5 percent fat were ratedlower (P<0.05) for overall acceptability than patties containing 20percent fat. These results support the finding of Study I where pat-ties with higher percentages of fat were rated higher in overall ac-ceptability by a consumer panel than patties with lower percentagesof fat. No other differences in overall acceptability were found amongthe treatments, table 7. Overall acceptability was found to be corre-lated (r = 0.69; P<0.05) with beef flavor intensity.
Conclusions
From these results it was concluded that the gas griddle was a bet-ter method of cooking ground beef patties than the convection oven,since ground beef patties cooked on the gas griddle were rated higherin beef flavor intensity and overall acceptability. Though not signifi-cant, ground beef patties broiled on the gas griddle had lower cook-ing losses than patties cooked in the convection oven. Juiciness andoverall acceptability of ground beef patties were found to increase asthe fat content increased. Overall acceptability was also found to becorrelated with beef flavor intensity.
STUDY IV: SENSORY DIFFERENCES BETWEENGRIDDLE BROILED AND GAS GRILL BROILED
GROUND BEEF PATTIES WITH DIFFERENTFAT LEVELS
Design
Ground beef patties containing 5, 10, 15, and 20 percent fat wereprepared using beef rib cap meat and 50/50 beef trimmings as inStudy III. Patties were cooked (broiled) in preparation for sensoryevaluation using either a gas griddle or an Emberglo open hearth gasgrill as previously described. The products from each of three rep-lications were then evaluated and the statistical analysis completed asdescribed in Study III.
Results and Discussion
Cooking MethodSensory panelists detected no differences (P>0.05) between the
two cooking methods (gas griddle versus open hearth gas grill) for
ADVANCES IN LEAN GROUND BEEF PRODUCTION 15
ALABAMA AGRICULTURAL EXPERIMENT STATION
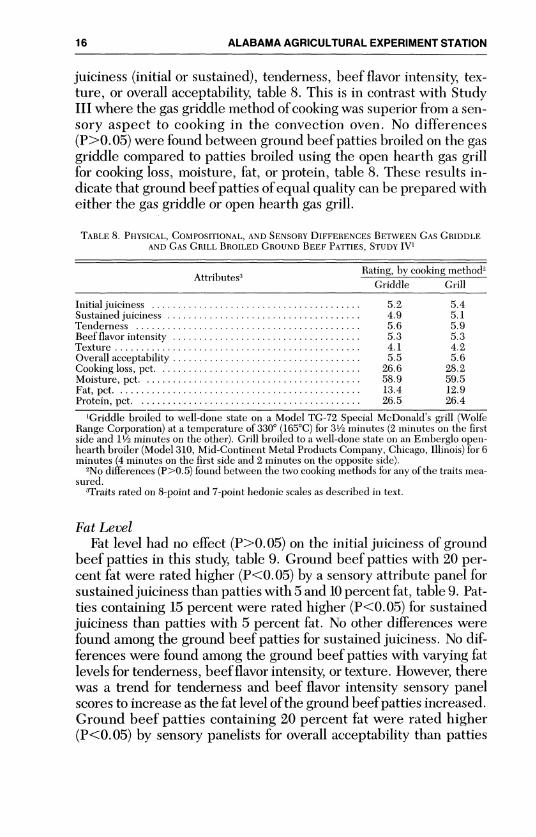
juiciness (initial or sustained), tenderness, beef flavor intensity, tex-ture, or overall acceptability, table 8. This is in contrast with StudyIII where the gas griddle method of cooking was superior from a sen-sory aspect to cooking in the convection oven. No differences(P>0.05) were found between ground beef patties broiled on the gasgriddle compared to patties broiled using the open hearth gas grillfor cooking loss, moisture, fat, or protein, table 8. These results in-dicate that ground beef patties of equal quality can be prepared witheither the gas griddle or open hearth gas grill.
TABLE 8. PHYSICAL, COMPOSITIONAL, AND SENSORY DIFFERENCES BETWEEN GAS GRIDDLEAND GAS GRILL BROILED GROUND BEEF PATTIES, STUDY IV'
Attributes Rating, by cooking method2AttributesGriddle Grill
Initial juiciness ........................................ 5.2 5.4Sustained juiciness ..................................... 4.9 5.1Tenderness ........................................... 5.6 5.9Beef flavor intensity .................................... 5.3 5.3Texture ... ........................................... 4.1 4.2Overall acceptability .................................... 5.5 5.6Cooking loss, pet . ..................................... 26.6 28.2Moisture, pct . ....................................... 58.9 59.5Fat, pct . ............................................ 13.4 12.9Protein, pct . ......................................... 26.5 26.4
'Griddle broiled to well-done state on a Model TG-72 Special McDonald's grill (WolfeRange Corporation) at a temperature of 330° (165°C) for 312 minutes (2 minutes on the firstside and 1V2 minutes on the other). Grill broiled to a well-done state on an Emberglo open-hearth broiler (Model 310, Mid-Continent Metal Products Company, Chicago, Illinois) for 6minutes (4 minutes on the first side and 2 minutes on the opposite side).
2No differences (P>0.5) found between the two cooking methods for any of the traits mea-sured.
3Traits rated on 8-point and 7-point hedonic scales as described in text.
Fat LevelFat level had no effect (P>0.05) on the initial juiciness of ground
beef patties in this study, table 9. Ground beef patties with 20 per-cent fat were rated higher (P<0.05) by a sensory attribute panel forsustained juiciness than patties with 5 and 10 percent fat, table 9. Pat-ties containing 15 percent were rated higher (P<0.05) for sustainedjuiciness than patties with 5 percent fat. No other differences werefound among the ground beef patties for sustained juiciness. No dif-ferences were found among the ground beef patties with varying fatlevels for tenderness, beef flavor intensity, or texture. However, therewas a trend for tenderness and beef flavor intensity sensory panelscores to increase as the fat level of the ground beef patties increased.Ground beef patties containing 20 percent fat were rated higher(P<0.05) by sensory panelists for overall acceptability than patties
16

ADVANCES IN LEAN GROUND BEEF PRODUCTION
TABLE 9. EFFECT OF FAT LEVEL ON THE SENSORY ATTRIBUTESOF GROUND BEEF PATTIES, STUDY V
AttributesRating, by pet. fat levelAttributes5 10 15 20
Initial juiciness ................................. 4.9' 5.2' 5.5' 5.7'Sustained juiciness ..............................
4 .5d 4.9' 5.21' 5.5b
Tenderness .................................... 5.4' 5.7' 5.9' 6.0'Beef flavor intensity ............................. 5.1' 5.1' 5.4' 5.5'Texture ....................................... 4.4' 4.3
b 4.1' 3.9'
Overall acceptability ............................ 5.3 5.4, 5.7 5.9'
'Attributes measured using 8-point and 7-point hedonic scales as shown in table 6.2Means in the same row with different superscripts differ (P<0.05).
with 5 and 10 percent fat. These results support the findings of StudyI and III where patties with higher percentages of fat were ratedhigher in overall acceptability by a consumer panel than patties withlower percentages of fat. No other differences in overall acceptabilitywere found among the ground beef patties with varying fat levels, ta-ble 9. Overall acceptability was found to be correlated (r = 0.64;P<0.05) with beef flavor intensity.
Conclusions
From these results it can be concluded that acceptable groundbeef patties both from a sensory and compositional standpoint can beprepared with either the gas griddle or open hearth gas grill. Resultsof this study indicate that juiciness (sustained) and overall accepta-bility of ground beef patties increase as the fat content increases.Sensory panelist scores for overall acceptability were found to be cor-related to beef flavor intensity.
STUDY V: EFFECT OF GRIND SIZE ON THESENSORY CHARACTERISTICS OF LEAN
GROUND BEEF PATTIES
Design
Ground beef patties were prepared with different sizes of grinderplates using beef rib cap meat and 50/50 beef trimmings as describedpreviously. The following treatments were prepared for each of threereplications: (1) control (20 percent fat) product ground through an/Vs-inch (0.32-cm) grinder plate for the final grind, (2) 10 percent fatproduct, final grind with 'A-inch plate, (3) 10 percent fat, final grind(ground twice) with 3/16-inch (0.48- cm) plate, (4) 10 percent fat, finalgrind (ground once) with 36-inch plate, (5) 10 percent fat, final grind
17

ALABAMA AGRICULTURAL EXPERIMENT STATION
(ground twice) with 3/8-inch (0.96-cm) plate, (6) 10 percent fat, finalgrind (ground once) with 3/8-inch plate. Patties were cooked (broiled)in preparation for sensory evaluation using the gas griddle as previ-ously described. Prepared samples were served to a trained sensorypanel. Panelists were instructed to evaluate each sample for juiciness(initial and sustained), tenderness, beef flavor intensity, and overallacceptability on an 8-point hedonic scale and on a 7-point scale fortexture as described previously. Data were analyzed using analysis ofvariance procedures.
Results and Discussion
Sensory panelists detected no differences (P>0.05) among theground beef patties with varying particle size for juiciness (initial andsustained), beef flavor intensity, texture, or overall acceptability, ta-ble 10. However, there was a trend for sensory panelists to rateground beef patties higher from treatment 4 (10 percent fat, groundonce through a 3/16-inch grinder plate) than most treatments for thesensory attributes (juiciness, tenderness, beef flavor intensity, andoverall acceptability) evaluated. Ground beef patties from treatment6 (ground once through a 3/8-inch grinder plate) were rated less tenderby sensory panelists than all other treatments except treatment 5(ground once through 3/8-inch grinder plate). No other differences(P>0.05) in tenderness were found among the treatments.
TABLE 10. EFFECT OF GRIND SIZE ON THE SENSORY ATTRIBUTESOF GROUND BEEF PATTIES, STUDY V
Rating, by treatment',3
Attributes21 2 3 4 5 6
Initial juiciness ...................... 5.8 5.8 5.6c 5.9 5.7, 5.4Sustained juiciness ................... 5.4 5.4 5.3, 5.9, 5.5c 5.P1Tenderness ......................... 5.7, 5.9e 5.8 5.5, 4.7«d 3.9e
a
Beef flavor intensity .................. 5.2c 5.0, 5.1 5.3 5.5c 5.0Texture .................... ........ 4.5 4.5 3.9c 4.6c 4.6c 4.5cOverall acceptability .................. 5.4 5.4 5.4 5.6e 5.2 4.8
'Treatments include (1) 20 percent fat product (control) ground through /Vs-inch (0.32-cm)grinder plate for the final grind; (2) 10 percent fat product, final grind with Vs-inch plate; (3)10 percent fat product, final grind (ground twice) with a 'A6-inch (0.48-cm) plate; (4) 10 per-cent fat product, final grind (ground once) with 3/6-inch plate; (5) 10 percent fat product, finalgrind (ground twice) with a 3/s-inch (0.96-cm) plate; (6) 10 percent fat product, final grind(ground once) with a 3 /s-inch plate.
2Attributes rated on 8-point and 7-point hedonic scales as shown in table 6.3Means in the same row with different superscripts differ (P>0.05).
Conclusions
Results from this study indicate that lean products may be im-proved through the use of a 36-inch grinder plate for the final grind.
18

ADVANCES IN LEAN GROUND BEEF PRODUCTION
No advantage appeared to be gained by grinding the lean producttwice through the 3/6-inch plate. Since a slight improvement in sen-sory attributes was found through the use of the 3/6-inch grinderplate, it was used in all further development of lean products.
.STUDY VI: EFFECT OF THE ADDITION OFNONMEAT INGREDIENTS ON THE SENSORY
PROPERTIES OF LEAN GROUND BEEF
Design
Ground beef patties were prepared using beef rib cap meat and50/50 beef trimmings as described previously. Three replications ofeach of the following treatments were prepared: (1) control (20 per-cent fat) product ground through an V/8-inch (0.32-cm) grinder platefor the final grind, (2) 10 percent fat product, final grind with a /8s-
inch plate, (3) 10 percent fat product with 0.50 percent salt, groundonce through a 3/16-inch (0.48-cm) plate, (4) 10 percent fat productwith 0.50 percent salt and 0.125 percent hydrolyzed vegetable pro-tein (HVP) added, /16-inch grind, (5) 10 percent fat product with 0.50percent salt, 0.125 percent HVP, and 0.125 percent white pepperadded, 3/16-inch grind, (6) 10 percent fat product with 0.50 percentsalt, 0.125 percent HVP, 0.125 percent extractive of red pepperadded, 3/16-inch grind, and (7) 10 percent fat product with 0.50 per-cent salt, 0.125 percent HVP, 0.125 percent white pepper, and 0.125percent extractive of red pepper added, 3/1-inch grind.
Patties were cooked (broiled) for sensory evaluation using the gasgriddle as previously described. Prepared samples were served to atrained sensory panel. Panelists were instructed to evaluate eachsample for juiciness (initial and sustained), tenderness, beef flavor in-tensity, and overall acceptability on an 8-point hedonic scale and tex-ture was rated on a 7-point hedonic scale as described previously.Data were analyzed using analysis of variance procedures.
Results and Discussion
No significant (P>0.05) differences were found among the groundbeef pattie treatments for any of the sensory traits evaluated, table11. Because seven treatments were evaluated at one sensory evalua-tion session, it might have been difficult for the sensory panelists todistinguish small differences between the treatments. However,there was a trend for lean ground beef patties with added salt andHVP to be rated higher for beef flavor intensity and overall accept-ability than ground beef patties from other treatments.
19

ALABAMA AGRICULTURAL EXPERIMENT STATION
TABLE 11. EFFECT OF THE ADDITION OF NONMEAT INGREDIENTS ON THE SENSORYATTRIBUTES OF GROUND BEEF PATTIEs, STUDY VI
Rating, by treatment,
Attributes1 2 3 4 5 6 7
Initial juiciness ..................... 6.0 5.7 5.7 5.7 5.7 5.6 5.5Sustained juiciness ................... 5.7 5.4 5.4 5.3 5.2 5.3 5.1Tenderness ........................ 5.9 6.0 5.6 5.6 5.6 5.7 5.5Beef flavor intensity .................. 5.0 4.9 5.0 5.7 5.3 5.0 5.4Texture ........................... 3.9 4.0 4.3 4.4 4.5 4.4 4.3Overall acceptability .................. 5.4 5.3 5.5 5.9 5.3 5.3 5.3
'Treatments are: (1) 20 percent fat product (control) ground through a '/-inch (0.32-cm)grinder plate; (2) 10 percent fat product ground through a 's-inch plate; (3) 10 percent fat prod-uct with 0.50 percent salt, ground once through a 3/16-inch (0.48-cm) plate; (4) 10 percent fatproduct with 0.50 percent salt and 0.125 percent hydrolyzed vegetable protein (HVP) added,3s-inch grind; (5) 10 percent fat product with 0.50 percent salt, 0.125 percent HVP, and 0.125percent white pepper added, 3s6-inch grind; (6) 10 percent fat product with 0.50 percent salt,0.125 percent HVP, 0.125 percent extractive of red pepper added, 3/16-inch grind; and (7) 10percent fat product with 0.50 percent salt, 0.125 percent HVP, 0.125 percent white pepper, and0.125 percent extractive of red pepper added, 3/16-inch grind.
2No differences (P>0.05) found between treatment means.3Attributes rated on 8-point and 7-point hedonic scales as shown in table 6.
Conclusions
Based on the trend for ground beef patties with added salt and hy-drolyzed vegetable protein (HVP) to have higher sensory scores forbeef flavor intensity and overall acceptability, further work should beinitiated to refine the level of addition. This became the objective ofthe following study VII.
STUDY VII: EFFECT OF THE ADDITION OFSALT AND HYDROLYZED VEGETABLE PROTEIN
ON THE SENSORY PROPERTIES OF LEANGROUND BEEF PATTIES
Design
The following treatments were prepared using the raw materialsand procedures as previously described: (1) control (20 percent fat)product ground through a 1/8-inch (0.32-cm) grinder plate, (2) 10 per-cent fat product ground through a 1/8-inch plate, (3) 10 percent fatproduct with 0.25 percent salt and 0.125 percent hydrolyzed vege-table protein (HVP) added, ground once through a 3/16-inch (0.48-cm)plate, (4) 10 percent fat product with 0.50 percent salt and 0.125%HVP added, 3/16-inch grind, (5) 10 percent fat product with 0.25 per-cent salt and 0.25 percent HVP added, 3/16-inch grind, and (6) 10 per-cent fat product with 0.50 percent salt and 0.25 percent hydrolyzedvegetable protein (HVP) added, 3/16-inch grind.
20

Patties were cooked (broiled) for sensory evaluation using the gasgriddle as previously described. Prepared samples were served to atrained sensory panel. Panelists were instructed to evaluate eachsample for juiciness (initial and sustained), tenderness, beef flavor in-tensity, and overall acceptability on an 8-point hedonic scale and ona 7-point scale for texture as described previously. Three replicationsof the study were completed and the data were analyzed using anal-ysis of variance procedures.
Results and Discussion
Sensory panelists detected no differences (P>0.05) between theground beef patties from the different treatments for juiciness (initialand sustained), tenderness, and texture, table 12. However, panelistsdetected differences (P<0.05) between ground beef patties for beefflavor intensity and overall acceptability. Patties from treatments 3,4, 5, and 6 had the greatest (P<0.05) beef flavor intensity and overallacceptability. Patties from treatment 4 were not different (P>0.05)from treatment 1 and patties from treatment 1 were not different(P>0.05) from treatment 2 for beef flavor intensity. No difference(P>0.05) in overall acceptability of patties from treatments 1, 4, 5,and 6 were detected by sensory panelists. No difference (P>0.05)was found between patties from treatments 1 and 2 for overall ac-ceptability. From these results it is evident that the addition of saltand HVP increases beef flavor intensity and overall acceptability oflean ground beef patties. It is also apparent that a level of 0.25 per-cent salt and 0.125 percent HVP (treatment 3) is sufficient to improve
TABLE 12. EFFECT OF THE ADDITION OF SALT AND HYDROLYZED VEGETABLE PROTEIN ONTHE SENSORY ATTRIBUTES OF GROUND BEEF PATTIES, STUDY VII
Attributes2Rating, by treament'"3
1 2 3 4 5 6
Initial juiciness ...................... 5.7 5.5 5.7, 5.4c 5.6c 5.6cSustained juiciness ................... 5.3' 5.0 5.6 5.3c 5.3c 5.4Tenderness ......................... 6.0 6.0e 5.7: 5.8& 5.6c 5.4cBeef flavor intensity .................. 4.6de 4.2c 5.7c 5.4cd 5.7 6.0CTexture ............................. 4.4 4.4 4.5 4.3 4.4 4.3Overall acceptability .................. 5.2da 4.9c 6.2c 6.0"' 5.7
d 5.8d
'Treatments are: (1) 20 percent fat product (control) ground through -inch (0.32-cm)grinder plate; (2) 10 percent fat product ground through '/8-inch plate; (3) 10 percent fat prod-uct with 0.25 percent salt and 0.125 percent hydrolyzed vegetable protein (HVP) added,ground once through 3/16-inch plate (0.48-cm); (4) 10 percent fat product with 0.50 percentsalt and 0.125 percent HVP added, 'A6-inch grind; (5) 10 percent fat product with 0.25 per-cent salt and 0.25 percent HVP added, 3A6-inch grind; and (6) 10 percent fat product with 0.50percent salt and 0.25 percent HVP added, 16-inch grind.
2Attributes rated on 8-point and 7-point hedonic scales as shown in table 6.3Means within a row bearing different superscripts differ (P<0.05).
ADVANCES IN LEAN GROUND BEEF PRODUCTION 21

ALABAMA AGRICULTURAL EXPERIMENT STATION
the beef flavor intensity and overall acceptability of lean ground beefpatties, since no further improvements were found using higher lev-els (treatments 4, 5, and 6).
Conclusions
Results from this study indicate that salt at a level of 0.25 percentand HVP at a level of 0.125 percent provide an acceptable beef flavorprofile in lean ground beef patties. Combinations of salt and HVPsimilar to these will then be used in all further development.
FINAL STUDY: CHEMICAL ANALYSIS AND SENSORYEVALUATION OF THE DEVELOPED LEAN GROUND
BEEF PRODUCTS
Prior to the initiation of the final study, the effects of lecithin andcarrageenan on the sensory properties of the developed lean groundbeef products were examined. These studies identified one carra-geenan and one lecithin as possessing the properties which could im-prove the overall acceptability of the lean ground beef product.These were studied using various levels of carrageenan and lecithinalone and in combination. It was determined that the most accept-able product could be produced using 0.05 percent carrageenan (Vas-carin SD 389, FMC Corporation, Philadelphia, Pennsylvania) alone.The addition of lecithin created flavor problems after only 2 days ofstorage under refrigerated conditions.
Design
The following treatments were prepared, and sensory evaluationand chemical analyses performed: (1) control (20 percent fat) productground through a /Vs-inch (0.32-cm) grinder plate, (2) 10 percent fatproduct ground through a -inch plate, (3) 10 percent fat productwith 0.25 percent salt and 0.125 percent hydrolyzed vegetable pro-tein (HVP) added, ground once through a 3 6-inch (0.48-cm) plate,and (4) 10 percent fat product with 0.375 percent salt, 0.188 percentHVP, 3.0 percent water, and 0.50 percent carrageenan added,ground through a 36-inch plate.
Patties were cooked (broiled) for sensory evaluation on an openhearth gas grill as previously described. Cooked samples wereserved to a trained sensory panel. Panelists were instructed to eval-uate each sample for juiciness (initial and sustained), tenderness,beef flavor intensity, and overall acceptability on an 8-point hedonic
22
scale, and texture evaluation on a 7-point hedonic scale as describedpreviously. Analysis of the ground beef products on both a raw andcooked basis for moisture, fat, protein, and ash was completed as pre-viously described. Cooking loss was also determined as describedpreviously. Data were analyzed using analysis of variance proce-dures.
Results and Discussion
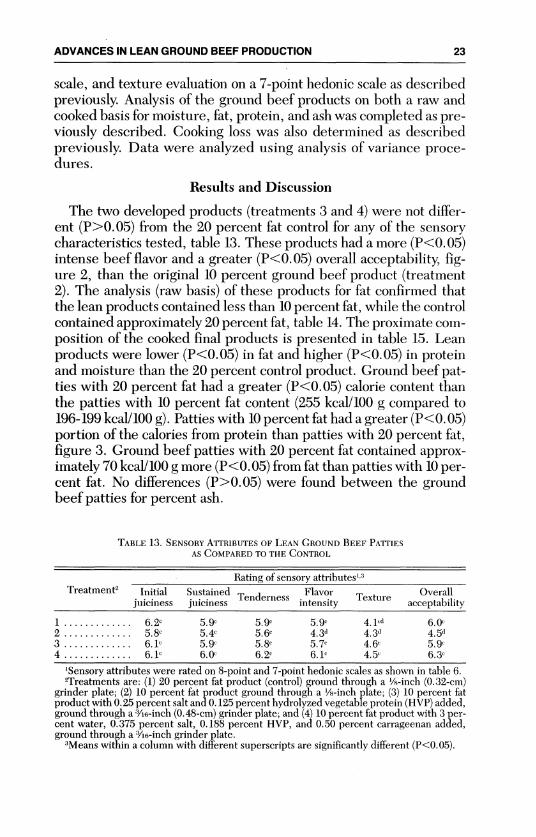
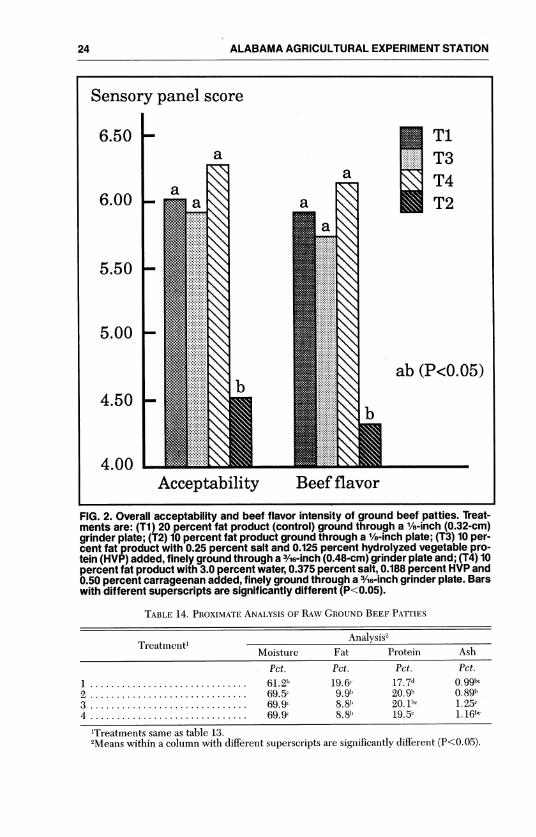
The two developed products (treatments 3 and 4) were not differ-ent (P>0.05) from the 20 percent fat control for any of the sensorycharacteristics tested, table 13. These products had a more (P<0.05)intense beef flavor and a greater (P<0.05) overall acceptability, fig-ure 2, than the original 10 percent ground beef product (treatment2). The analysis (raw basis) of these products for fat confirmed thatthe lean products contained less than 10 percent fat, while the controlcontained approximately 20 percent fat, table 14. The proximate com-position of the cooked final products is presented in table 15. Leanproducts were lower (P<0.05) in fat and higher (P<0.05) in proteinand moisture than the 20 percent control product. Ground beef pat-ties with 20 percent fat had a greater (P<0.05) calorie content thanthe patties with 10 percent fat content (255 kcal/100 g compared to196-199 kcal/100 g). Patties with 10 percent fat had a greater (P<0.05)portion of the calories from protein than patties with 20 percent fat,figure 3. Ground beef patties with 20 percent fat contained approx-imately 70 kcal/100 g more (P<0.05) from fat than patties with 10 per-cent fat. No differences (P>0.05) were found between the groundbeef patties for percent ash.
TABLE 13. SENSORY ATTRIBUTES OF LEAN GROUND BEEF PATTIESAS COMPARED TO THE CONTROL
Rating of sensory attributes,3
Treatment2 Initial Sustained Tenderness Flavor Texture Overalljuiciness juiciness intensity acceptability
1 ............. 6.21 5.9c 5.9c 5.9c 4.1«' 6.02 ............. 5.81 5.4c 5.6 4.3d 4.3d 4.5d3 ............. 6.11 5.9c 5.8c 5.7c 4.6c 5.94 ............. 6.11 6.0 6.2c 6.1e 4.5 6.3c
'Sensory attributes were rated on 8-point and 7-point hedonic scales as shown in table 6.2Treatments are: (1) 20 percent fat product (control) ground through a '/8-inch (0.32-cm)
grinder plate; (2) 10 percent fat product ground through a '/-inch plate; (3) 10 percent fatproduct with 0.25 percent salt and0.125 percent hydrolyzed vegetable protein (HVP) added,ground through a 3A6s-inch (0.48-cm) grinder plate; and (4) 10 percent fat product with 3 per-cent water, 0.375 percent salt, 0.188 percent HVP, and 0.50 percent carrageenan added,ground through a 3 6-inch grinder plate.
3Means within a column with different superscripts are significantly different (P<0.05).
ADVANCES IN LEAN GROUND BEEF PRODUCTION 23
24 AABAMA AGRICULTRLEPRMN TTO
Sensory panel score
6.50
a6.00 a
4.50
4.00
Acceptability
T3T4T2
ab (P<0.05)
Beef flavorl l
FIG. 2. Overall acceptability and beef flavor intensity of ground beef patties. Treat-ments are: (Ti) 20 percent fat product (control) ground through a 1/8-inch (0.32-cm)grinder plate; (T2) 10 percent fat product ground through a /-inch plate; (T3) 10 per-cent fat product with 0.25 percent salt and 0.125 percent hydrolyzed vegetable pro-tein (HVP) added, finely ground through a 3/16-inch (0.48-cm) grinder plate and; (T4) 10percent fat product with 3.0 percent water, 0.375 percent salt, 0.188 percent HVP and0.50 percent carrageenan added, finely ground through a 3 16-inch grinder plate. Barswith different superscripts are significantly different (P<0.05).
TABLE 14. PROXIMATE ANALYSIS OF RAW GROUND BEEF PATIES
Treatment'AnlssMoisture Fat Protein Ash
Pct. Pct. Pct. Pct.
1 ........................... 61.2') 19.6c 17.7' .99'-2 .............................. 69.5c 9.9') 20.9') 0.89')3 .............................. 69.9 ~ 8.8') 20.1'- 1.250
4 .............................. 69.9 ~ 8.8') 19.5c 1.16'-
'Treatments same as table 13.2Means within a column with different superscripts are significantly different (P<0.05).
ALABAMA AGRICULTURAL EXPERIMENT STATION24

ADVANCES IN LEAN GROUND BEEF PRODUCTION 2
TABLE 15. PROXI\IATE ANALYSIS AND CALORIE CONFENT 01 COOKED
GROUND BEEF PATIES
Components Content, by treatment'1 2 3 4
Moisture, pet......................... 56.3', 63.4'" 63.2" 62.5"Fat, pct ............................. 18.7" 10.8", 10.9") 11.4'Protein, pet........................... 21.7' 25.4'' 24.5'( 24.1'-Ash, pet............................... 1.27") 1.14') 1.25') 1.29"'Calories.. ............................. 255,- 199') 196") 199')
'Treatments same as found in tahie 13.2Means within a row with different superseripts are significantly difierent (P<0.50).:Calories measured in kcal/100 g cooked product.
Caloric content, kcaIl kcVg
175 b
150
125
a
75Fat
TiT3T4T2
aab (P<0.05)a
Protein
FIG. 3. Caloric content from fat and protein of lean ground beef patties as comparedto the control. Treatments are: (Ti) 20 percent fat product (control) ground through a/-inch (0.32-cm) grinder plate; (T2) 10 percent fat product ground through a 1/8-plate;(T3) 10 percent fat product with 0.25 percent salt and 0.125 percent hydrolyzed veg-etable protein (HVP) added, finely ground through a 3 is-inch (0.48-cm) grinder plate;and (T4) 10 percent fat product with 3.0 percent water, 0.375 percent salt, 0.188 per-cent HVP and 0.50 percent carrageenan added, finely ground through a 36-inchgrinder plate. Bars with different superscripts are significantly different (P<0.05).
25

ALABAMA AGRICULTURAL EXPERIMENT STATION
Conclusions
Ground beef products were developed that were not significantlydifferent from the control (20 percent fat, raw basis) product for anyof the sensory traits measured. The developed products were lessthan 10 percent fat (raw basis) and possessed more intense beef flavorand were more acceptable overall than the ground beef product with10 percent fat (raw basis) and no additives. The calorie savings ob-tained from the developed products over the control product wouldbe between 55 and 60 kcal/100 g serving or a caloric decrease of 22-23 percent on an "as eaten" basis with a decrease of 70 kcal/100 gfrom fat.
SUMMARY
The objective upon initiation of this project was to develop a leanground beef product with a fat content of 10 percent or less that wasas acceptable as the control (as determined by consumer panel to pos-sess the most acceptable sensory characteristics) which contained 20percent fat: Evidence from this studyindicates that this objective hasbeen accomplished. Two products were developed with sensory char-acteristics that do not differ from the control. These developed prod-ucts along with the control possess more intense beef flavor and havea greater overall acceptability than the original ground beef productcontaining 10 percent fat (untreated).
The two products developed contain approximately 40 percent lessfat than the control product (with a 20 percent fat content) on an "aseaten" basis. The caloric savings obtained from the consumption ofthese products compared to the control product are between 55 and60 kcal/100 g serving or a caloric decrease of 22-23 percent on an aseaten basis. Based on a 100-g serving, calories from the lean groundbeef are distributed as follows: 100 kcal from fat and 98 kcal from pro-tein; whereas in the control ground beef the calories are distributedin the following: 168 kcal from fat and 87 kcal from protein.
The development of lean ground beef products (10 percent fat con-tent) which possess sensory properties comparable to ground beefproducts with 20 percent fat content was accomplished through thefollowing:
(1) An increase in the particle size of the ground product throughthe use of a large-sized grinder plate.
(2) The addition of small quantities of salt and hydrolyzed vegeta-ble protein as flavor enhancers.
(3) The addition of carrageenan as a product stabilizer.
26

ADVANCES IN LEAN GROUND BEEF PRODUCTION
These newly developed lean ground beef products are tailored tomeet the needs of the diet conscious consumer. The products containless fat and calories than traditional ground beef products. Upon in-troduction of these products to the retail market, consumers willhave the opportunity to substitute the lean ground beef products forthe higher-fat ground beef products currently available.
LITERATURE CITED
(1) AMSA. 1978. Guidelines for Cookery and Sensory Evaluation of Meat. Amer-ican Meat Science Association, Chicago, Ill.
(2) AOAC. 1980. Official Methods of Analysis. 13th ed. Association of Official An-alytical Chemists, Washington, D.C.
(3) ASTM. 1968. Manual on Sensory Testing Methods. American Society for Test-ing and Materials. Philadelphia, Penn.
(4) BREIDENSTEIN, B.C. AND WILLIAMS, J.C. 1986. The Consumer Climate forRed Meat: Special Issue. American Meat Institute, Washington D.C. and theNational Live Stock and Meat Board. Chicago, Ill.
(5) BURKE MARKETING RESEARCH. 1987. The Consumer Climate for Meat Study.Prepared for the National Live Stock and Meat Board, Chicago, Ill., and theAmerican Meat Institute, Washington, D.C.
(6) HOELSCHER, L.M., SAVELL, J.W., HARRIS, J.M., CROss, H.R., AND RHEE,
K. S. 1987. Effect of Initial Fat Level and Cooking Method on Cholesterol Con-tent and Caloric Value of Ground Beef Patties. J. Food Sci. 52:883.
(7) HOLDEN, J.M., LANZA, E., AND WOLF, W.R. 1986. Nutrient Composition ofRetail Ground Beef. J. Agric. Food Chem. 34:302.
(8) KENDALL, PA., HARRISON, D.L., AND DAYTON, A.D. 1974. Quality Attri-butes of Ground Beef on the Retail Market. J. Food Sci. 39:610.
(9) KREGEL, K.K., PRUSA, K.J., AND HUGHES, K.V 1986. Cholesterol Contentand Sensory Analysis of Ground Beef as Influenced by Fat Level, Heating, andStorage. J. Food Sci. 51:1162.
(10) NEALE, M. G. 1989. An Innovative Approach to Lean Ground Beef Produc-tion. M.S. Thesis, Auburn University.
(11) ONo, K., BERRY, B.W., AND PAROCZAY, E. 1985. Contents and Retention ofNutrients in Extra Lean, Lean, and Regular Ground Beef. J. Food Sci. 50:701.
(12) SAS INSTITUTE INC. 1982. SAS User's Guide: Basic, 1982. Edition. SAS Insti-tute Inc., Cary, N.C.
(13) TUKEY, J.W. 1953. The Problem of Multiple Comparisons, Princeton Univer-sity, Princeton, N.J. Cited in: Principles and Procedures of Statistics. R.G.Steele and J.H. Torrie (Ed). McGraw-Hill Book Company, New York, N.Y.
(14) WOOLSEY, A.P. AND PAUL, PC. 1969. External Fat Cover Influence on Rawand Cooked Beef. 1. Fat and Moisture Content. J. Food Sci. 34:554.
27

AUBURN UNIVERSITY
tith ans~~ Unritu in
eVe("\ mI1 or jOI l areja.
h t1-i the aned o0 f_
ticultLlrdi pr- dulc rsin cach region in - - - --
.\Lthanw. Ev en c iizen of the State 111st a 0*stake in this research 12 -®--pr~ r;ll Since 111V 13 -
atdv'antalge from~ nexx 4andC nllOre eCtOttt1 ''
ica w\\d\S of proldu.itkg and han11dlin~gfarm 1prod-uCt dii to is V'rec tk henefits. the r- -_
t I rtstnlin PUIliC 21
Research Unit Ids. -tli
® Main Agricultural Experiment Station, Auburn.1zE. V. Smith Research Center, Shorter.1. Tennessee Valley Substation, Belle Mina.2. Sand Mountain Substation. Crossville.3. North Alabama Horticulture Substation. Cullman.4. Upper Coastal Plain Substation. Winfield.5. Forestry Unit, Fayette County.6. Chilton Area Horticulture Substation, Clanton.7, Forestry Unit, Coosa County.8. Piedmont Substation, Camp Hill9. Plant Breeding Unit, Tallassee.
10. Forestry Unit. Autauga County.11. Prattville Experiment Feld, Prattville.12, Black Belt Substation. Marion Junction.13 The Turnipseed-Ikenberry Piace. Union Springs.14. Lower Coastal Plain Substation. Camden,15. Forestry Unit, Barbour County16. Monroeville Experiment Field, Monroeville.17. Wiregrass Substation, Headland.18. Brewton Experiment Field, Brewton.19. Solon Dixon Forestry Education Center.
Covington and Escambia counties.20. Ornamental Horticulture Substation, Spring Hill.21 Cult Coast Substation, Fairhope.