naclim 20 year re-processed sea and ice surface temperatures data set gorm dybkjær, jacob høyer,...
TRANSCRIPT

NACLIM 20 year re-processedSea and Ice Surface Temperatures
data set
Gorm Dybkjær, Jacob Høyer, Rasmus Tonboe and
Steffen M Olsen
Center for Ocean and Ice, DMI
NACLIM - annual meeting, October 1-2 -Trieste 2013
Outline
• Arctic SST/IST from satellite – why
• IST/SST reprocessing data set– Status and a few technical issues
• IST/SST – existing level 2 and 3 data– Samples and comparison to other observation
• Your wishes or suggestions for the reprocessed temperature data set…
Why Arctic surface temperature climate record from satellite
• Arctic surface temperatures are important boundary condition for atmosphere, ocean and sea ice models.
• A consistent climate data set for trend analysis.
• Arctic surface temperatures are poorly represented by traditional observations.
• Traditional Arctic temperature observations are ambigeous observations.

Arctic Surface Temperature - Requested by the sea ice user community
• ESA CCI project on Sea Ice
• User survey
• 91 respondents
• IST ranking 4 out of 22 parameters.
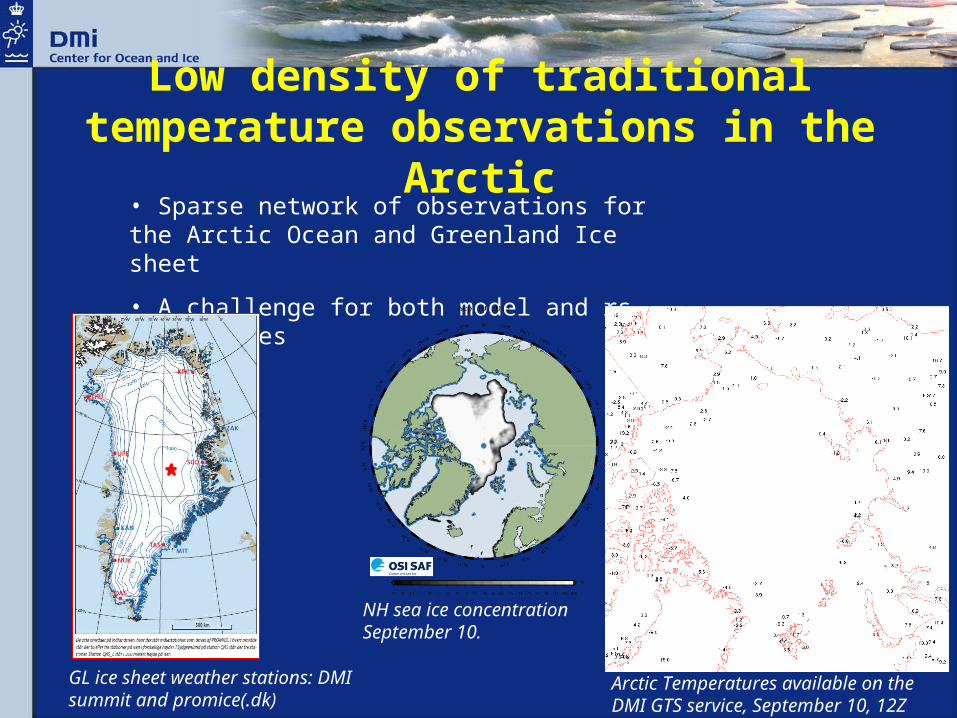
Low density of traditional temperature observations in the Arctic
• Sparse network of observations for the Arctic Ocean and Greenland Ice sheet
• A challenge for both model and rs communities
Arctic Temperatures available on the DMI GTS service, September 10, 12Z
GL ice sheet weather stations: DMI summit and promice(.dk)
NH sea ice concentration September 10.

Ambiguous surface temperature observations.
• Extreme vertical and diurnal temperature variation in sea ice (air-snow-ice )• Most Arctic Ocean temperature observations are from sea ice buoys, with limited
knowledge of actual sensor position.• No consistent relation between 2mT and Tsurf• Only IR radiometry can determine surface temperatures adequately
In situ temperatures at different depth – showing large vertical gradient even at thin snow layer.
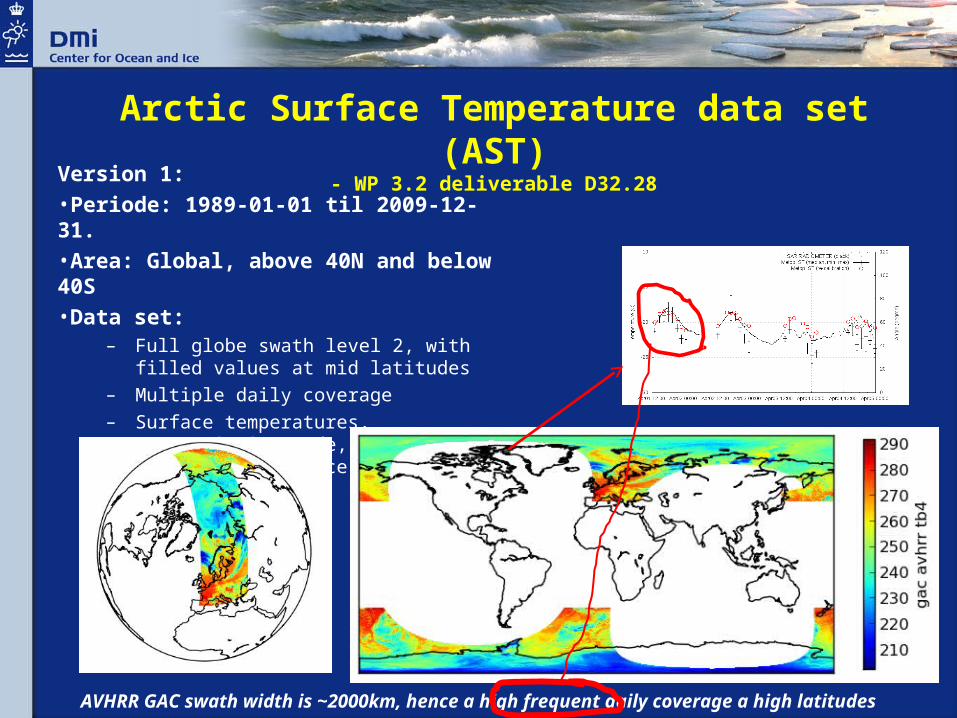
Version 1:•Periode: 1989-01-01 til 2009-12-31. •Area: Global, above 40N and below 40S•Data set:
– Full globe swath level 2, with filled values at mid latitudes
– Multiple daily coverage
– Surface temperatures, uncertainties(stde, bias), cloud and land mask, (ice concentration)
Arctic Surface Temperature data set (AST)- WP 3.2 deliverable D32.28
AVHRR GAC swath width is ~2000km, hence a high frequent daily coverage a high latitudes
Arctic Surface Temperature data set- WP 3.2 deliverable D32.28
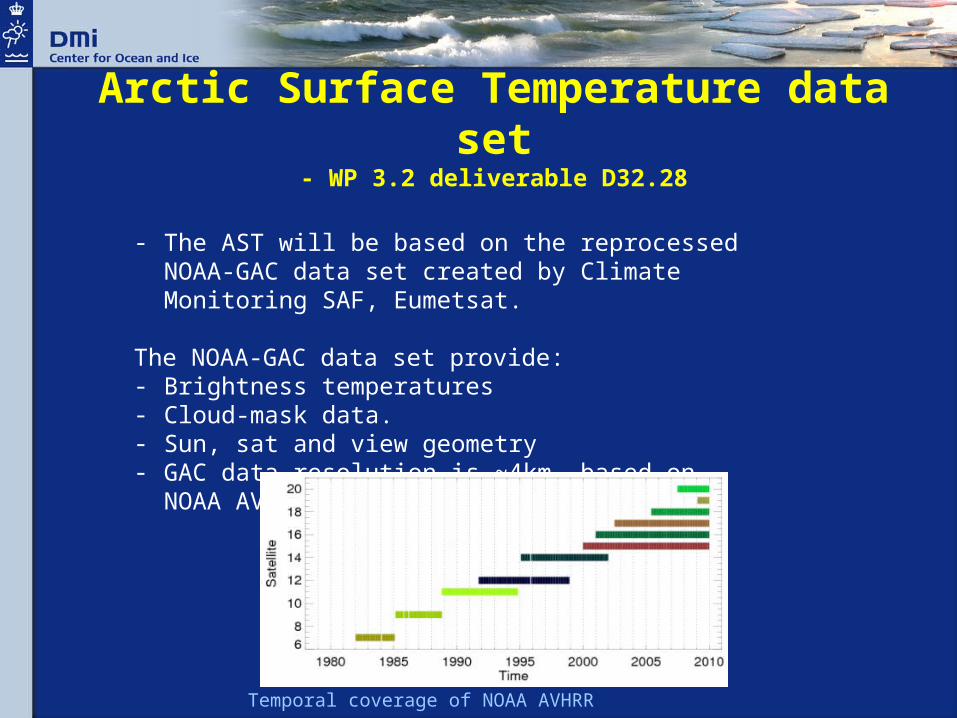
- The AST will be based on the reprocessed NOAA-GAC data set created by Climate Monitoring SAF, Eumetsat.
The NOAA-GAC data set provide:- Brightness temperatures- Cloud-mask data.- Sun, sat and view geometry- GAC data resolution is ~4km, based on NOAA AVHRR
data.
Temporal coverage of NOAA AVHRR
Integrated HL SST, IST and Marginal Ice Zone Temperature product, based on AVHRR data
• SST for HL– Split Window Algorithm– Regional calibration coefficients (separate day/night algorithms, as Le Bourgne, 2006)
• IST – Split Window algorithm (Key et al., 1992)
• MIZT – Scaled linearly between IST and SST (Vincent et al., 2008)
• Split window IST algorithm including view-angle and water vapour corretion terms: – AST = a + bT11 + d(T11-T12)sec (Key and Haefliger, 1992)
(SST is based on similar split window algorithm)
AST Algorithm description
• AST is beeing developed jointly between DMI and met.no
• Data set format will be similar to GHRSST SST data (The Group for High-Resolution Sea Surface Temperature )
• Version 1:– Expected ready second quarter 2014– Ice, Sea and Marginal Ice Zone Surface Temperatures,
Distributed uncertainties, Cloud and land masks, Sun-Satellite and view geometry
– Data volume ~17TB
• Version 2-> :– More work on distributed uncertainty and algorithm calibration (if
nessesary) and cloud filtering.
Arctic Surface Temperature data set- WP 3.2 deliverable D32.28
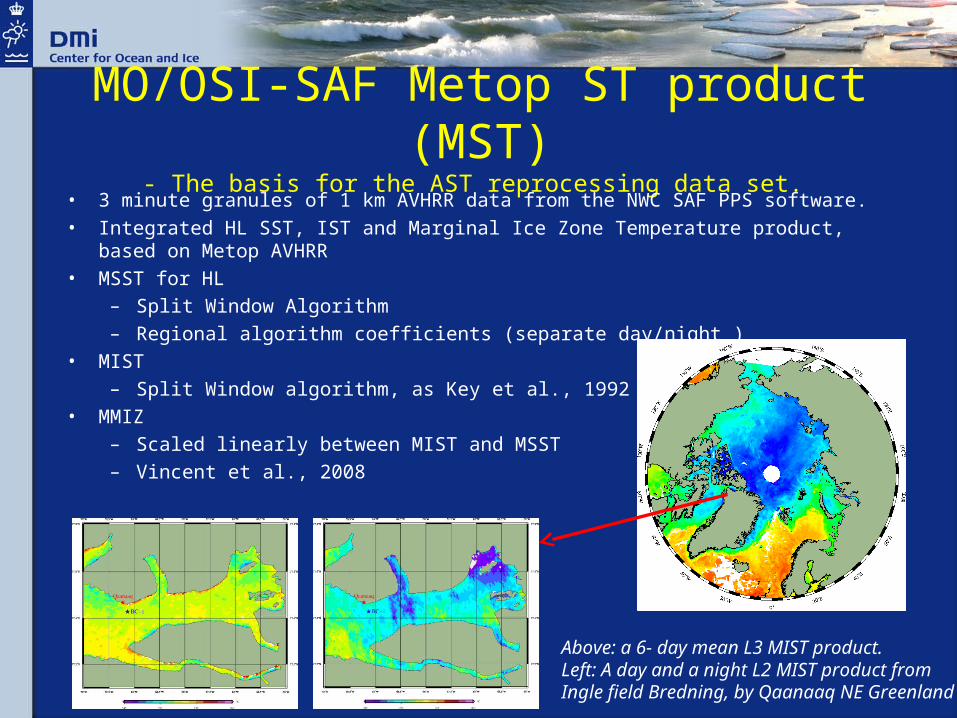
MO/OSI-SAF Metop ST product (MST)- The basis for the AST reprocessing data set.
• 3 minute granules of 1 km AVHRR data from the NWC SAF PPS software.
• Integrated HL SST, IST and Marginal Ice Zone Temperature product, based on Metop AVHRR
• MSST for HL– Split Window Algorithm– Regional algorithm coefficients (separate day/night )
• MIST – Split Window algorithm, as Key et al., 1992
• MMIZ – Scaled linearly between MIST and MSST– Vincent et al., 2008
Above: a 6- day mean L3 MIST product. Left: A day and a night L2 MIST product from Ingle field Bredning, by Qaanaaq NE Greenland
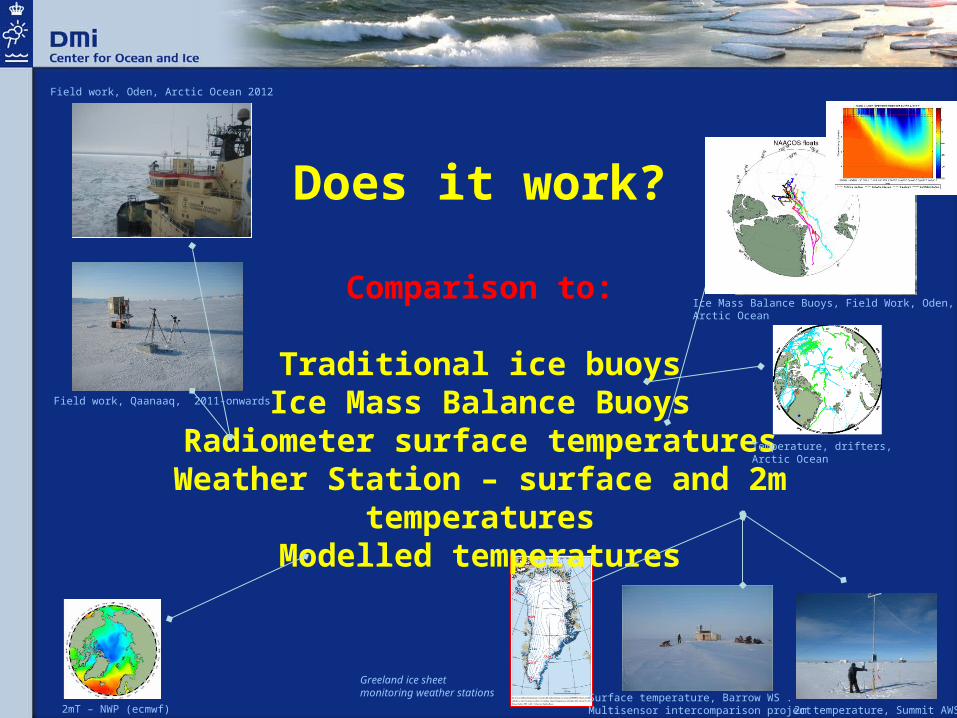
Does it work?
Comparison to:
Traditional ice buoysIce Mass Balance Buoys
Radiometer surface temperaturesWeather Station – surface and 2m temperatures
Modelled temperatures
Field work, Oden, Arctic Ocean 2012
Field work, Qaanaaq, 2011-onwards
2mT – NWP (ecmwf)Surface temperature, Barrow WS . Multisensor intercomparison project 2m temperature, Summit AWS
Temperature, drifters, Arctic Ocean
Ice Mass Balance Buoys, Field Work, Oden, Arctic Ocean
Greeland ice sheet monitoring weather stations
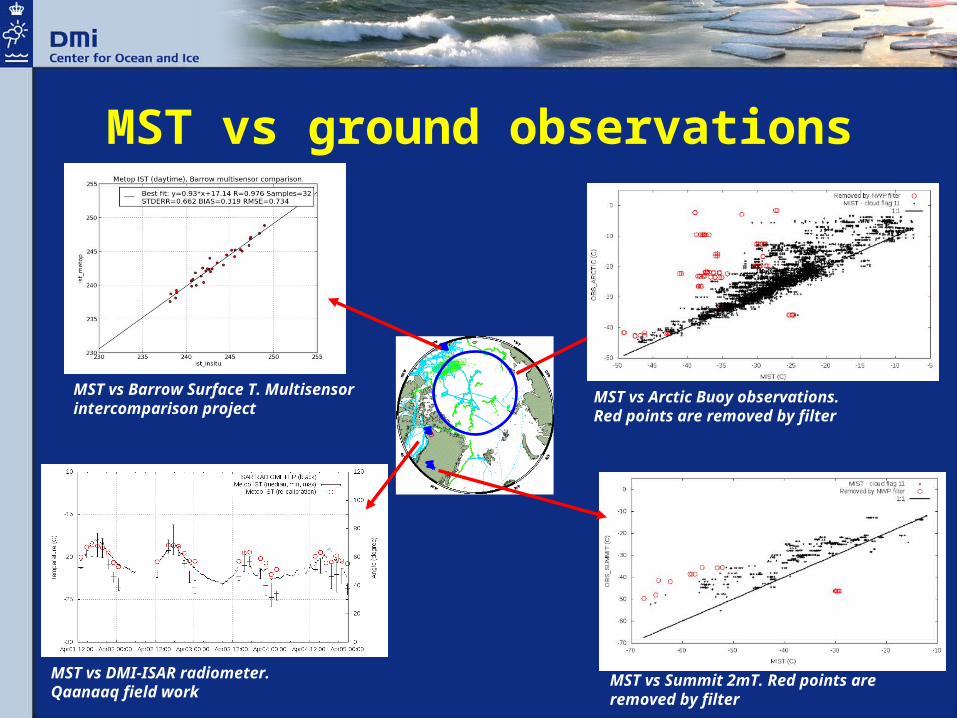
MST vs ground observations
MST vs Arctic Buoy observations. Red points are removed by filter
MST vs Barrow Surface T. Multisensor intercomparison project
MST vs Summit 2mT. Red points are removed by filter
MST vs DMI-ISAR radiometer. Qaanaaq field work
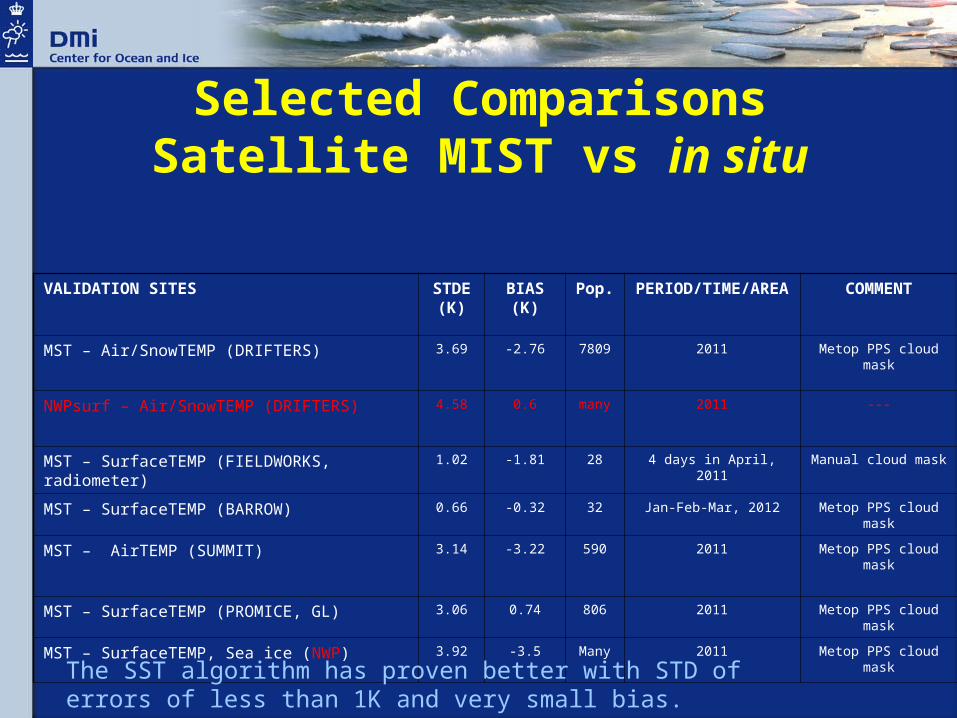
Selected ComparisonsSatellite MIST vs in situ
VALIDATION SITES STDE (K)
BIAS (K)
Pop. PERIOD/TIME/AREA COMMENT
MST – Air/SnowTEMP (DRIFTERS) 3.69 -2.76 7809 2011 Metop PPS cloud mask
NWPsurf – Air/SnowTEMP (DRIFTERS) 4.58 0.6 many 2011 ---
MST – SurfaceTEMP (FIELDWORKS, radiometer) 1.02 -1.81 28 4 days in April, 2011 Manual cloud mask
MST – SurfaceTEMP (BARROW) 0.66 -0.32 32 Jan-Feb-Mar, 2012 Metop PPS cloud mask
MST – AirTEMP (SUMMIT) 3.14 -3.22 590 2011 Metop PPS cloud mask
MST – SurfaceTEMP (PROMICE, GL) 3.06 0.74 806 2011 Metop PPS cloud mask
MST – SurfaceTEMP, Sea ice (NWP) 3.92 -3.5 Many 2011 Metop PPS cloud mask
The SST algorithm has proven better with STD of errors of less than 1K and very small bias.
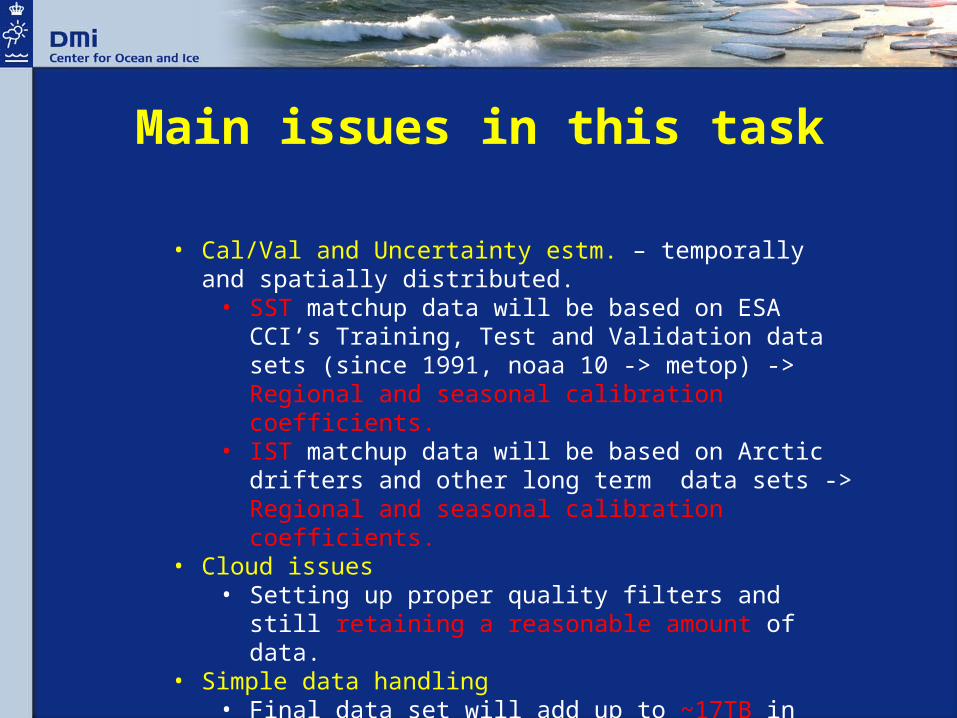
Main issues in this task
• Cal/Val and Uncertainty estm. – temporally and spatially distributed.
• SST matchup data will be based on ESA CCI’s Training, Test and Validation data sets (since 1991, noaa 10 -> metop) -> Regional and seasonal calibration coefficients.
• IST matchup data will be based on Arctic drifters and other long term data sets -> Regional and seasonal calibration coefficients.
• Cloud issues• Setting up proper quality filters and still retaining a
reasonable amount of data.• Simple data handling
• Final data set will add up to ~17TB in compressed format
You suggestions
Now is a good time to make wishes or come up with suggestions for the Arctic Surface Temperature data set - Version 1
e.g.:• Level 3?• Weekly/Monthly means?• Additional parameters in data set?• Less parameters…?• …
Summary
• We are building a 20 year reprocessed Arctic ocean and ice temperature data set
• The data set concept will be based on existing and operational level 2 Arctic ocean and ice temperature data processing system
• Validation and uncertainty estimation will be done against a wide range of in situ observations
• Major tasks are:• Uncertainties
• Cloud issues
• Simple data handling
Some Arctic Ocean temperature data sets
• Modis Aqua and Terra (since 2000)• AVHRR Polar Pathfinder dataset (reprocessing data set, since )• International Arctic Buoy Programme…• Metop_A (near real time, since 2011)• ATSR • AMSR-E • VIIRS• Advanced Spaceborne Thermal Emission and Reflection
Radiometer (ASTER)• IASI• Enhanced Thematic Mapper Plus (ETM+)
The research leading to these results has received funding from the European Union 7th Framework Programme (FP7 2007-2013), under grant agreement n.308299
NACLIM www.naclim.eu