naosite: nagasaki university's academic output...
TRANSCRIPT

This document is downloaded at: 2018-08-07T12:31:13Z
Title Experimental and Numerical Research on 3D Crack Growth in RocklikeMaterial Subjected to Uniaxial Tension
Author(s) Yang, Lei; Jiang, Yujing; Li, Shucai; Li, Bo
Citation Journal of Geotechnical and Geoenvironmental Engineering, 139(10),pp.1781-1788; 2013
Issue Date 2013-02-27
URL http://hdl.handle.net/10069/34162
Right © 2013 American Society of Civil Engineers.
NAOSITE: Nagasaki University's Academic Output SITE
http://naosite.lb.nagasaki-u.ac.jp

Experimental and Numerical Research on 3-D Crack
Growth in Rock-like Material Subjected to Uniaxial Tension
Lei Yang1, Yujing Jiang2, Shucai Li3 and Bo Li4 Abstract: Uniaxial tension experiments on pre-cracked rock-like samples and the
related numerical simulations using FRANC3D were performed to investigate the
growth mechanism of 3-D cracks in rocks under tension as well as the strength and
failure behavior of samples. Experimental results indicate that the geometrical
characteristics of pre-existing cracks, including crack dip angle, crack spacing and
crack intensity, have significant effects on the strength and failure modes of the
samples. Failure of samples resulted from the propagation of a single crack and the
coalescence of multiple cracks if the spacing between adjacent cracks is less than the
length of cracks. Distribution of mixed-mode stress intensity factors (SIFs) and
energy release rates (ERRs) along the fronts of cracks with different geometrical
characteristics was investigated numerically, and the results can provide an
interpretation for the experimental results. Based on numerical simulations of the
propagation processes of single and two parallel cracks, the growth patterns and
growth rates of 3-D cracks were studied. The simulation results of crack growth
correspond well with the experimental phenomena.
Keywords: 3-D crack growth; Geometrical distribution of crack; Uniaxial tension;
FRANC3D/BEM; Stress intensity factor (SIF); Energy release rate (ERR).
1 Lecturer, Research Center of Geotechnical and Structural Engineering, Shandong Univ., Jinan
250061, P.R. China; formerly, Ph.D. Candidate, Graduate School of Science and Technology,
Nagasaki Univ., Nagasaki 852-8521, Japan (corresponding author). E-mail: [email protected] 2 Professor, Faculty of Engineering, Nagasaki Univ., Nagasaki 852-8521, Japan. E-mail:
[email protected] 3 Professor, Research Center of Geotechnical and Structural Engineering, Shandong Univ., Jinan
250061, P.R. China. E-mail: [email protected] 4 Assistant Professor, Faculty of Engineering, Nagasaki Univ., Nagasaki 852-8521, Japan. E-mail:

Introduction
Cracks ubiquitously exist in rock masses, and play an important role in the strength
and failure behavior of rock masses. As external loading increases, cracks grow and
join with other neighboring ones, inducing stress redistribution and localized stress
concentration, which subsequently lead to the failure of rock masses (Lajtai 1974).
Therefore, the mechanism of crack growth and coalescence in rock masses remains as
a fundamental and promising problem in rock mechanics and engineering practices.
To date, extensive studies have been carried out to investigate the growth of
two-dimensional (2-D) cracks (plates with through cracks) in brittle materials under
compression (e.g., Brace and Bombolakis 1963; Lajtai 1974; Ashby and Hallam 1986;
Bobet and Einstein 1998; Bobet 2000). Since most cracks in nature are
three-dimensional (3-D internal or surface cracks), recent research has attempted to
model 3-D crack growth, which may provide a better interpretation for the rock
failure behavior (e.g., Dyskin et al. 1994, 1999, 2003; Wong et al. 2004, 2008). Those
studies have found that the propagation of 3-D cracks occurs mainly with the
extension of wrapping wing cracks in the direction of maximum compressive stress,
and with lateral extension growing in the depth direction of sample, making it much
more complex than 2-D crack cases. Those studies have also shown that the
geometrical characteristics of 3-D cracks, such as crack shape, crack location and the
crack dip angle have significant influences on the crack growth.
Comparing with the cases under compression, the crack growth in rocks subjected
to tension is more likely to cause the catastrophic failure without warning due to the
fact that rock usually has a very low tensile strength. A number of experimental and
theoretical studies based on the 2-D crack model under tension have been performed
to predict the critical stress of crack growth and the fracture angle (Palaniswamy and
Knauss 1972; Wu et al. 1977; Wu and Chang 1978; Sih 1991; Hsien-Yang and Chang
1995). Those studies provided a fundamental understanding of 2-D crack growth in
brittle solids under tension, whereas, the growth mechanism of 3-D cracks in rocks
under tension has received little attention and rare related works have been reported.
In former studies, we have conducted uniaxial tension experiments on mortar samples
containing single or two parallel 3-D internal cracks to investigate the effects of crack
dip angle and spacing on sample strength (Li et al. 2009; Yang et al. 2010a and 2011).
We proposed the growth patterns of internal cracks under tension through observing

the crack growth trace on the failure sections of samples. However, since the mortar
material is non-transparent, we could not capture the initiation and propagation
processes of cracks and their 3-D growth information through direct observation.
The numerical simulation provides an effective way to study the crack growth
process under various stress conditions and to capture the spatial fracture development.
In recent years, the boundary element method (BEM) has been well developed and
used as a powerful alternative to the finite element method (FEM) particularly in the
analysis of 3-D fracture problems, due to its inherent advantage of high efficiency. Mi
and Aliabadi (1994) adopted the dual BEM to study the 3-D crack growth by using an
incremental crack-extension analysis. Singh et al. (1998) proposed the formulation of
universal crack closure integral to evaluate the energy release rates (ERRs) and the
stress intensity factors (SIFs) around 3-D crack fronts. Cornell Fracture Group has
developed the BEM code of FRANC3D, which can automatically simulate the
propagation of 3-D cracks and has been widely applied in the fracture analysis (e.g.,
Rahman et al. 2000; Dong and De Peter 2002; Barlow and Chandra 2005).
At present, some aspects of the 3-D crack growth and coalescence in rocks under
tension, such as the spatial growth pattern of cracks, the initiation and propagation
processes of cracks, and the interaction between cracks as well as its effect on the
crack coalescence, are still not well understood. These aspects control the strength and
failure behavior of rock masses and therefore need to be investigated. To study the
growth and calescence of 3-D cracks, the effects of the geometrical characteristics of
cracks (e.g., crack dip angle, crack spacing and crack intensity) should be taken into
account. The crack dip angle affects the stress distribution around cracks and the
growth pattern of cracks. The crack spacing affects the crack interaction and the
coalescence of cracks, and the crack intensity has an obvious influence on the
mechanical properties of a fractured rock.
In this study, we briefly summarize the results of uniaxial tension experiments
obtained before, including the effects of crack dip angle, spacing and intensity on the
strengths and failure modes of mortar samples. Since the growth process of internal
cracks could not be observed directly in the non-transparent mortar samples during
experiments, as a supplement, the corresponding numerical simulations were
performed using FRANC3D. In numerical studies, the distribution of mixed-mode
SIFs and ERRs along the fronts of cracks with varying dip angles and spacing was
studied, and the propagation and coalescence processes of 3-D cracks were

numerically simulated. The numerical studies can serve as an effective complement to
experimental studies, providing more insights into the growth and coalescence
mechanisms of 3-D cracks under tension, such as the initiation position, the spatial
growth pattern, as well as the effects of cracks’ geometrical characteristics on their
growth and coalescence.
Experiments and Discussions
Preparation of Experiment
In the experiments, a new type of rock-like mortar material (a mixture of Portland
cement, fine sand and water with the mixing ratio by weight of 1: 2.34: 0.35) was
developed to simulate sandstone. Mechanical properties of the mortar material were
measured through unconfined compression and tension tests and the three-point
bending test. As shown in Table 1, this mortar material exhibits similar properties to
the typical sandstone (Farmer 1983; Atkinson and Meredith 1987).
Table 1. Physico-mechanical Properties of Mortar and Sandstone
Parameter Index Mortar Sandstone Density ρ (g/cm3) 2.3 2.1~2.4
Compressive strength σc (MPa) 35.5 20~170 Tensile strength σt (MPa) 2.8 4~25
Modulus of elasticity E (Gpa) 17.9 3~35 Poisson’s ratio ν 0.19 0.02~0.20
Fracture toughness KΙC (MPa·m0.5) 0.51 0.22~2.66
(a) Sample (b) A single crack (c) Two cracks Fig. 1. Shapes and dimensions of artificial sample and elliptical internal cracks (Unit:
mm)
End portion
End portion
Uniform portion
100
200
50
50
5050
100
Crack 20
10
Uniaxialtension
α
Horizontaldirection d

Shapes and dimensions of the artificial sample and internal crack are shown in Fig.
1. The sample has a bone-like shape to reduce the stress concentration when applying
tensile stresses on the upper and lower boundaries. The internal cracks were created
by embedding elliptical polyester films with a thickness of 0.25 mm into the
geometric centers of samples during the casting process. Polyester films were greased
and held within samples by cotton threads to model non-frictional open cracks.
Three sets of samples were processed to investigate the influences of crack dip
angle, spacing and intensity on sample strengths and failure modes, respectively.
Set-1 samples contain single cracks with varying dip angles (inclination to the
horizontal direction, Fig. 1b), ranging from 0° to 60° with an increment of 15°. Each
sample in Set-2 contains two vertically aligned parallel cracks with an inclination of
45° (Fig. 1c). The spacing d between two cracks was set as 0, 5, 10, 15, 20 and 25 mm,
respectively, so that the dimensionless spacing factor d/2a ranges from 0 to 1.25 (2a is
the length of crack long axis). Set-3 samples contain different number of vertically
aligned parallel cracks (the crack intensity ranges from 1 to 3, corresponding to the
crack number), with the crack inclination of 45° and the crack spacing of 5 mm.
Samples were uniaxially loaded using a 3000 kN servo-controlled rigid testing
device in a velocity controlled mode at a rate of 0.002 mm/s. To assure that the tensile
stress passes through the center line of sample during tests, a locating apparatus for
bonding tension tests was utilized, which can rotate freely along the axial direction of
sample and slide in the lateral direction (Yang et al. 2010a). This locating apparatus
can adjust the axial direction of sample effectively, helping improve the accuracy of
tension experiments.
Experimental Results
Uniaxial tensile stress-strain curves of the Set-1 samples and the intact sample are
shown in Fig. 2. At the beginning of loading, the curve is nonlinear due to the opening
of pre-existing crack and microcracks in the sample. After that, the curve exhibits a
large linear portion, corresponding to the elastic-deformation stage of sample (the
onset of this stage has been indicated on each curve). It can be found that the
load-deformation process of the fractured sample is primarily occupied by the large
elastic-deformation stage, which produces more than 50% of the total deformation.
After the external stress reaches the tensile strength of sample, sample fractures

abruptly with a quick drop of stress. The deformation and failure behavior of rock-like
material under tension is quite different from that under compression (Yang et al.
2010b). The existence of the pre-existing crack results in the decrease of sample
strength p, which is also affected by the crack dip angle (p decreases with the
decrease of ). As decreases, the stress component normal to the initial crack plane
increases, therefore the mode-I (opening) fracture is more likely to occur, and the
sample strength decreases. The ultimate strains of samples do not follow a certain law,
which may be due to the different geometrical distributions of pre-existing cracks and
the material’s heterogeneity.
The instantaneous fracture of the Set-1 samples occurred in the middle of the
samples and the failure sections were approximately perpendicular to the external
stress. The growth trace of internal cracks can be observed on the failure sections of
samples. In the case of a horizontal crack ( = 0°), only mode-I (opening) fracture
occurred and caused the brittle failure of the sample (Fig. 3a). The wing cracks and
0.0 0.2 0.4 0.6 0.80.0
0.4
0.8
1.2
1.6
2.0
2.4
2.8
α = 15° (2.04MPa)
α = 0° (1.94MPa)
α = 30° (2.16MPa)
α = 45° (2.33MPa)
α = 60° (2.54MPa)Intact sample (2.66MPa)
Str
ess
(MP
a)
Strain (× 10-3)
Fig. 2. Uniaxial tensile stress-strain curves of the Set-1 samples
Fig. 3. Failure sections of samples with single cracks
(① : Initial crack; ② : Wing crack; ③ : Lateral extension)
(a) Horizontal crack ( = 0°) (b) Inclined crack ( = 45°)
①
Tip of initial crack
②
② ③
③
②③
③

the lateral extension initiated from the tips of the crack long and short axes,
respectively, which propagated along the initial crack plane with the inclination and
propagation angles to the initial crack plane approximately equal to 0°. In the cases of
inclined cracks (15° ≤ ≤ 60°), the propagation trace of wing crack can be confirmed
on the failure sections of samples, indicating that the newly-generated wing crack led
to the sample failure (Fig. 3b, e.g. = 45°). The initiation of the wing crack was
approximately perpendicular to the initial crack plane. During the crack growth
process, the propagation of wing crack gradually changed to the horizontal direction,
with the propagation angle progressively approaching to the dip angle of initial crack.
The tensile stress-strain curves of the Set-2 samples with two parallel cracks are
shown in Fig. 4, indicating that the sample strength varies with the crack spacing.
When d/2a ranges from 0 to 1, p decreases as the crack spacing increases due to the
increase of the weak rock bridge zone between cracks, where the stress fields resulted
from the two cracks are strongly superposed, causing the rapid propagation and
0.0 0.2 0.4 0.6 0.8 1.00.0
0.5
1.0
1.5
2.0
2.5
d/2a = 1.25 (2.06MPa)
d/2a = 1 (1.52MPa)d/2a = 0.75 (1.59MPa)
d/2a = 0.50 (1.67MPa)d/2a = 0.25 (1.71MPa)
Stre
ss (
MP
a)
Strian (× 10-3)
d/2a = 0 (2.33MPa)
Fig. 4. Uniaxial tensile stress-strain curves of the Set-2 samples
Fig. 5. Failure sections of samples with two cracks (① : Initial crack; ② : Wing crack; ③ : Lateral extension)
(a) d/2a = 0.25: Crack coalescence
Crack coalescence region
Initial crack-1
Initial crack-2
②③
③
(b) d/2a = 1.25: Growth of one crack
①

0.0 0.2 0.4 0.6 0.8 1.00.0
0.4
0.8
1.2
1.6
2.0
2.4
2.8
I = 3 (1.44 MPa)
I = 1 (2.33MPa)
I = 2 (1.71MPa)
Str
ess
(MP
a)
Strain (× 10-3)
I = 0 (2.66MPa)
Fig. 6. Uniaxial tensile stress-strain curves of the Set-3 samples
coalescence of initial cracks. Then p increases after d/2a exceeds 1.0, due to that the
interaction effect between the two cracks gradually reduces with spacing.
Failure of the Set-2 samples mainly resulted from the growth and coalescence of
initial cracks. In the range of small crack spacing (d/2a ≤ 1), the interaction between
cracks was strong and the two cracks propagated and joined with each other, leading
to the sample failure (Fig. 5a, e.g. d/2a = 0.25). In the case that the crack spacing was
large (d/2a > 1), two cracks grew separately, and the one that grew more sufficiently
due to the material’s heterogeneity, caused the sample failure (Fig. 5b).
Set-3 samples were tested to investigate the effect of crack intensity I. The
stress-strain curves shown in Fig. 6 indicate that the sample strength and elastic
modulus decrease with the increase of crack intensity. Since the crack spacing of
Set-3 samples is small (d/2a = 0.25), initial cracks grew and joined with adjacent ones,
leading to the sample failure, similarly to the two-crack cases (Fig. 5a).
Method and Models of Numerical Simulations
Brief Description of FRANC3D/BEM
Boundary element method (BEM) is a numerical method of solving the boundary
integral equation that is mathematically equivalent to the original partial differential
equation. The most significant feature of BEM is the reduction of the dimensionality
of a problem, as it only requires the discretization of surfaces rather than the domain,
which improves the calculating efficiency to a great extent (Rizzo 1967).
The BEM code of FRANC3D/Classic Version 3.2 is a specialized and powerful
fracture analysis program, capable of accurately evaluating SIFs along 3-D crack

fronts and representing the propagation of these cracks (Carter et al. 2000; Cornell
Fracture Group 2003). FRANC3D calculates SIFs by using a displacement correlation
technique based on the interpolated values calculated at points with measured
distances from the geometric crack fronts. The displacements on the crack surface are
directly related to three modes of SIFs in forms of Eqs. (1)-(3), where COD, CSD and
CTD represent the opening, sliding and tearing displacements of a crack respectively;
KI , KII and KIII represent the SIFs for mode I, II and III fracture respectively; r
denotes the distance from a calculating point to the crack front; E and v are Young’s
modulus and Poisson’s ratio respectively (Sousa et al. 1989). After the displacements
of points around the crack front are obtained, the SIFs can be calculated.
2 1/24 (1 )(2 / ) /COD K v r E (1)
2 1/24 (1 )(2 / ) /CSD K v r E (2)
1/24 (1 )(2 / ) /CTD K v r E (3)
The crack propagation is controlled by the relative magnitudes of SIFs at the crack
front. KI is related to the opening of the crack and causes the in-plane growth of the
crack. KII produces in-plane sliding and tilting of the crack front, while KIII represents
out-of-plane tearing and produces twisting of the crack front. The propagation
direction of the complex 3-D crack can be determined by using some fracture theories
(e.g., the theory of maximum tangential stress, the theory of maximum strain energy
release rate and the theory of minimum strain energy density) integrated in the
FRANC3D framework. In this study, the theory of maximum strain energy release
rate was utilized, in the form of Eq. (4).
2 2 2 2( )(1 ) / (1 ) /ERR K K v E K v E (4)
The amount of crack extension at a certain point (Δli) was determined through the
power-law relationship between SIFs and the crack growth length, as defined by:
max max( ) / ( )i C Cl l K K K K (5)
where KImax is the maximum value of KI along the crack front; KIC is the fracture
toughness of the material; Δlmax denotes the maximum length of crack extension for
the position of KImax.
Numerical models
The uniform-section segment of the experimental sample with the same size and

Fig. 7. Meshes of the numerical model and crack (a single crack)
physico-mechanical properties was used in the numerical models. Corresponding to
the laboratory test procedure, two sets of numerical models were established to
investigate the effects of crack dip angle and spacing on the crack growth respectively.
In these models, the size and arrangement of cracks were identical to those in
experimental samples. Elliptical cracks were created by defining the coordinates of
their geometric centers, the crack inclinations, and the dimensions of cracks. The open
crack was topologically represented by a pair of faces, which use the same front edges
and vertices and form a null volume region with zero strength. Those faces, edges and
vertices can be torn apart to simulate the crack propagation if the external stress is
large enough (Carter et al. 2000). The meshes on the model surface and crack surface
are shown in Fig. 7. Meshes on the model surface are fine near the internal crack and
coarse near the upper and lower ends of the model, with a total number of 1400. On
each crack surface, 320 4-sided mapped meshes were generated to calculate the SIFs
and ERRs of cracks.
The uniaxial tensile stress was imposed on the upper boundary of model, and the
axial displacement on the lower boundary was set to be zero. To investigate the
distribution of mixed-mode SIFs and ERRs, a position angle was defined as the
angle from the crack long axis to the radial line corresponding to one particular point,
which was used to mark the point position along the crack front (Fig. 7).
The normalization of mixed-mode SIFs (KInor, KIInor and KIIInor) and ERRs (ERRnor)
along the fronts of all cracks was performed by using Eqs. (6)-(8) (Ayhan 2007),
where a and b represent the semi-lengths of long and short axes of the elliptical crack
respectively; is the uniaxial tensile stress; and v is the Poisson’s ratio of material.
90˚ θ A
B
C
Crack front

/nor RK K K , /nor RK K K , /nor RK K K (6)
1.65 1/2{ / [1 1.464( / ) ]}RK a a b (7)
2 2 2 2( )(1 ) (1 )nor nor nor norERR K K v K v (8)
Numerical Results and Discussions
Case of Single Cracks
Distribution of SIFs and ERRs
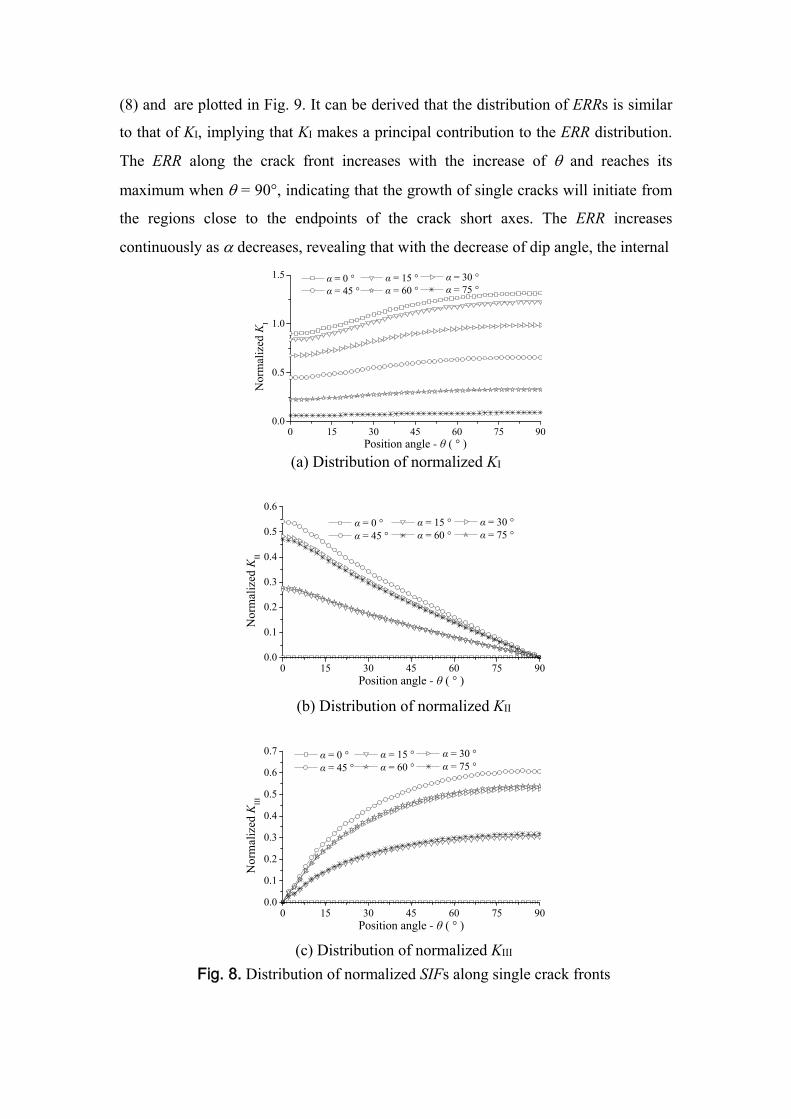
The normalized mixed-mode SIFs along single crack fronts with varying dip angles
are shown in Fig. 8. Due to the symmetry, only SIFs along 1/4 crack fronts (from the
upper endpoint of the crack long axis to the right endpoint of the crack short axis, A-B
in Fig. 7 and 0° ≤ ≤ 90°) are plotted. Fig. 8a indicates that KI increases continuously
with the increasing from 0° to 90°. The maximum and minimum values of KI are
located at the endpoints of crack short and long axes respectively. At any position
along the crack front, KI increases with the decrease of and reaches the maximum at
= 0° (the horizontal crack). Moreover, the increment of KI from the minimum value
to the maximum value for a crack becomes larger as decreases.
As shown in Fig. 8b, KII decreases approximately in a linear manner with the
increase of from 0° to 90°. At the endpoint of the crack long axis, KII reaches its
maximum, while at the endpoint of the crack short axis, KII decreases to its minimum
(0). At any position, KII increases with the increase of when 0° ≤ ≤ 45°, but
decreases after exceeds 45°. Fig. 8b also reveals that the values of KII when = 15°
and 30° are approximately equal to those when = 75° and 60° respectively.
Fig. 8c shows the distribution of KIII, demonstrating that the KIII curves are
parabolic with the maximum values located at the endpoints of the crack short axes.
At endpoints of the long axes, KIII has its minimum value equaling to zero. The
influence of on the KIII distribution is generally similar to that in the case of KII: KIII
reaches the maximum when = 45°, and KIII increases as increases from 0° to 45°,
but decreases after exceeds 45°.
The total energy release rate (ERR), which involves three modes of SIFs (Eq. 4), is
commonly utilized to determine the safety/failure conditions and to predict the growth
of 3-D cracks. The normalized ERRs along single crack fronts are calculated from Eq.
(8) and are plotted in Fig. 9. It can be derived that the distribution of ERRs is similar
to that of KI, implying that KI makes a principal contribution to the ERR distribution.
The ERR along the crack front increases with the increase of and reaches its
maximum when = 90°, indicating that the growth of single cracks will initiate from
the regions close to the endpoints of the crack short axes. The ERR increases
continuously as decreases, revealing that with the decrease of dip angle, the internal
0 15 30 45 60 75 900.0
0.5
1.0
1.5 α = 30 ° α = 75 °
α = 15 ° α = 60 °
α = 0 ° α = 45 °
Nor
mal
ized
KI
Position angle - θ ( ° ) (a) Distribution of normalized KI
0 15 30 45 60 75 900.0
0.1
0.2
0.3
0.4
0.5
0.6
α = 30 ° α = 75 °
α = 15 ° α = 60 °
α = 0 ° α = 45 °
Nor
mal
ized
KII
Position angle - θ ( ° )
(b) Distribution of normalized KII
0 15 30 45 60 75 900.0
0.1
0.2
0.3
0.4
0.5
0.6
0.7 α = 30 ° α = 75 °
α = 15 ° α = 60 °
α = 0 ° α = 45 °
Nor
mal
ized
KII
I
Position angle - θ ( ° )
(c) Distribution of normalized KIII
Fig. 8. Distribution of normalized SIFs along single crack fronts

0 15 30 45 60 75 900.0
0.3
0.6
0.9
1.2
1.5
1.8 α = 30 ° α = 75 °
α = 15 ° α = 60 °
α = 0 ° α = 45 °
Nor
mal
ized
ER
R
Position angle - θ ( ° )
Fig. 9. Distribution of normalized ERRs along single crack fronts
crack is more easily to grow, leading to the fracture of samples and the decrease of
sample strength. The numerical results of ERR distribution along single crack fronts
provide an explanation for the effect of crack dip angle on the sample strength (Fig.
2).
Propagation of Single Cracks
The tensile propagation processes of single cracks were investigated by using
FRANC3D, where 4 steps of crack propagation were simulated for each case until the
total growth size of each crack exceeded its initial size (Fig. 10). Simulation results
indicate that the propagation patterns of single cracks fall into two categories
according to the crack dip angle, including the pattern of horizontal crack ( = 0°) and
the pattern of inclined cracks (e.g. = 45°).
For the horizontal crack (Fig. 10a), only mode-I (opening) fracture occurs due to
the uniaxial tensile stress (KI ≠ 0, KII, KIII = 0), in the form of crack extension along its
initial plane. The horizontal crack starts its lateral extension from the endpoint of the
crack short axis (point B), and then generates the wing crack from the endpoint of the
long axis (point A). To investigate the growth of crack quantitatively, the growth
(a) Horizontal crack ( = 0°) (b) Inclined crack ( = 45°) Fig. 10. Propagation processes of single cracks under tension
A
B
A
B1 2 3 4
21
43
134
2
1 3 42
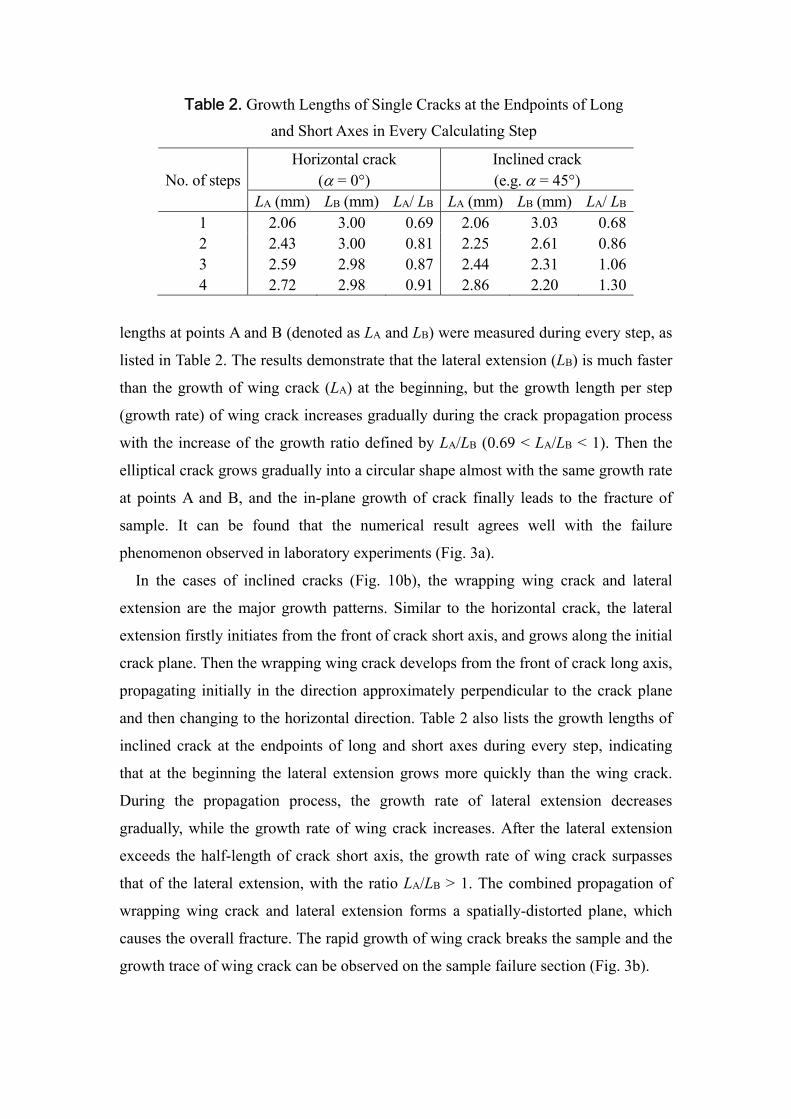
Table 2. Growth Lengths of Single Cracks at the Endpoints of Long
and Short Axes in Every Calculating Step
No. of stepsHorizontal crack
( = 0°) Inclined crack (e.g. = 45°)
LA (mm) LB (mm) LA/ LB LA (mm) LB (mm) LA/ LB 1 2.06 3.00 0.69 2.06 3.03 0.68 2 2.43 3.00 0.81 2.25 2.61 0.86 3 2.59 2.98 0.87 2.44 2.31 1.06 4 2.72 2.98 0.91 2.86 2.20 1.30
lengths at points A and B (denoted as LA and LB) were measured during every step, as
listed in Table 2. The results demonstrate that the lateral extension (LB) is much faster
than the growth of wing crack (LA) at the beginning, but the growth length per step
(growth rate) of wing crack increases gradually during the crack propagation process
with the increase of the growth ratio defined by LA/LB (0.69 < LA/LB < 1). Then the
elliptical crack grows gradually into a circular shape almost with the same growth rate
at points A and B, and the in-plane growth of crack finally leads to the fracture of
sample. It can be found that the numerical result agrees well with the failure
phenomenon observed in laboratory experiments (Fig. 3a).
In the cases of inclined cracks (Fig. 10b), the wrapping wing crack and lateral
extension are the major growth patterns. Similar to the horizontal crack, the lateral
extension firstly initiates from the front of crack short axis, and grows along the initial
crack plane. Then the wrapping wing crack develops from the front of crack long axis,
propagating initially in the direction approximately perpendicular to the crack plane
and then changing to the horizontal direction. Table 2 also lists the growth lengths of
inclined crack at the endpoints of long and short axes during every step, indicating
that at the beginning the lateral extension grows more quickly than the wing crack.
During the propagation process, the growth rate of lateral extension decreases
gradually, while the growth rate of wing crack increases. After the lateral extension
exceeds the half-length of crack short axis, the growth rate of wing crack surpasses
that of the lateral extension, with the ratio LA/LB > 1. The combined propagation of
wrapping wing crack and lateral extension forms a spatially-distorted plane, which
causes the overall fracture. The rapid growth of wing crack breaks the sample and the
growth trace of wing crack can be observed on the sample failure section (Fig. 3b).
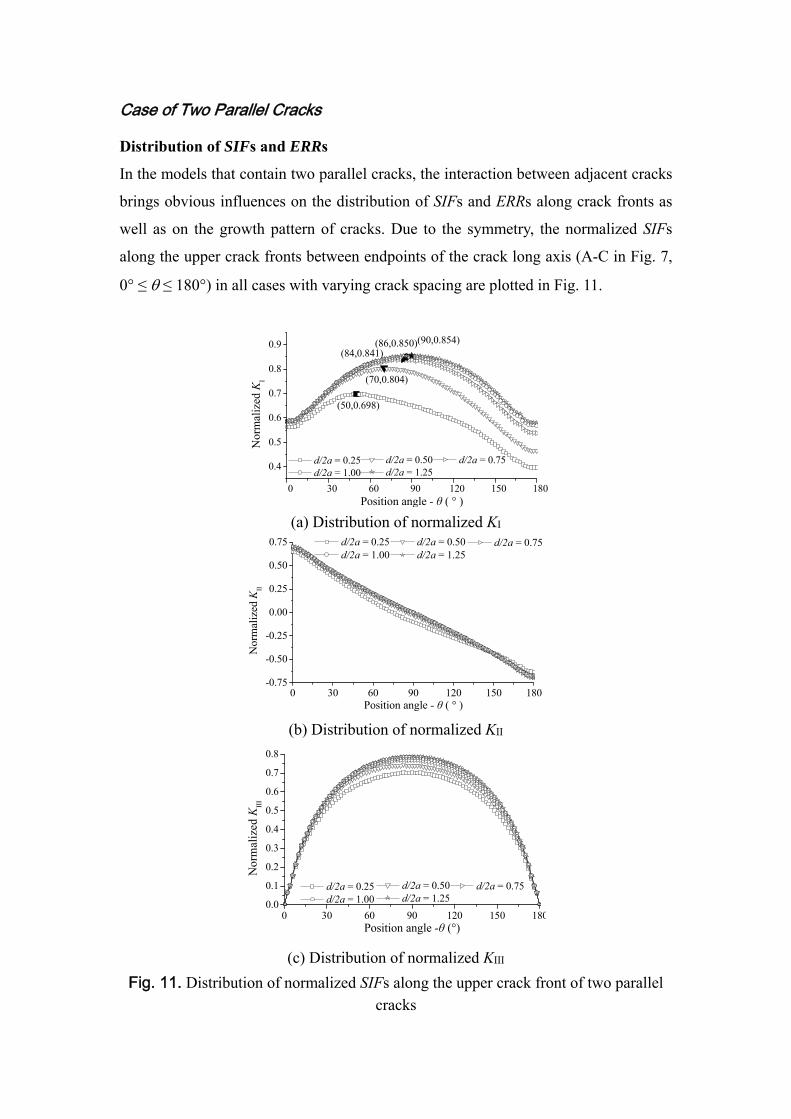
Case of Two Parallel Cracks
Distribution of SIFs and ERRs
In the models that contain two parallel cracks, the interaction between adjacent cracks
brings obvious influences on the distribution of SIFs and ERRs along crack fronts as
well as on the growth pattern of cracks. Due to the symmetry, the normalized SIFs
along the upper crack fronts between endpoints of the crack long axis (A-C in Fig. 7,
0° ≤ ≤ 180°) in all cases with varying crack spacing are plotted in Fig. 11.
0 30 60 90 120 150 180
0.4
0.5
0.6
0.7
0.8
0.9 (86,0.850)(90,0.854)(84,0.841)
(70,0.804)
d/2a = 0.75 d/2a = 0.50 d/2a = 1.25
d/2a = 0.25 d/2a = 1.00
Nor
mal
ized
KI
Position angle - θ ( ° )
(50,0.698)
(a) Distribution of normalized KI
0 30 60 90 120 150 180-0.75
-0.50
-0.25
0.00
0.25
0.50
0.75 d/2a = 0.75 d/2a = 0.50 d/2a = 1.25
d/2a = 0.25 d/2a = 1.00
Nor
mal
ized
KII
Position angle - θ ( ° )
(b) Distribution of normalized KII
0 30 60 90 120 150 1800.0
0.1
0.2
0.3
0.4
0.5
0.6
0.7
0.8
d/2a = 0.75 d/2a = 0.50 d/2a = 1.25
d/2a = 0.25 d/2a = 1.00
Nor
mal
ized
KII
I
Position angle -θ (°)
(c) Distribution of normalized KIII
Fig. 11. Distribution of normalized SIFs along the upper crack front of two parallel
cracks
0 30 60 90 120 150 1800.4
0.6
0.8
1.0
1.2
1.4
1.6(86,1.42) (90,1.44)
(84,1.39)
(76,1.27)
d/2a = 0.75 d/2a = 0.50 d/2a = 1.25
d/2a = 0.25 d/2a = 1.00
Nor
mal
ized
ER
R
Position angle - θ ( ° )
(70,1.01)
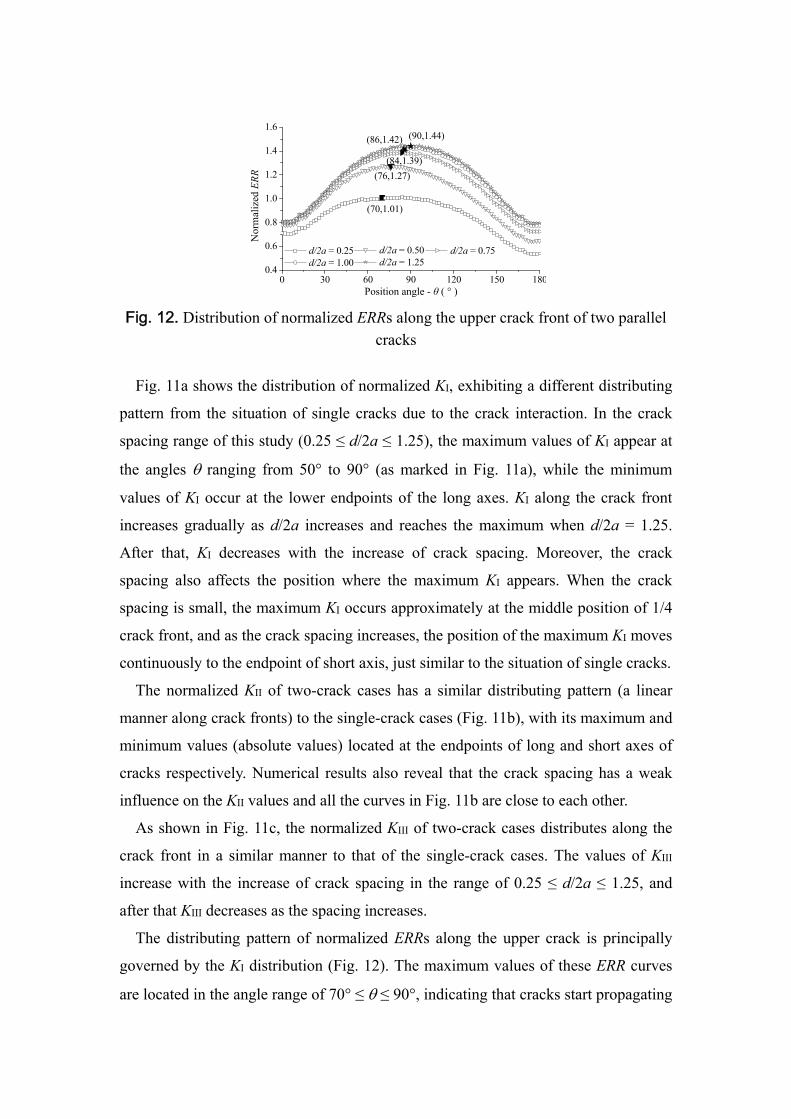
Fig. 12. Distribution of normalized ERRs along the upper crack front of two parallel
cracks
Fig. 11a shows the distribution of normalized KI, exhibiting a different distributing
pattern from the situation of single cracks due to the crack interaction. In the crack
spacing range of this study (0.25 ≤ d/2a ≤ 1.25), the maximum values of KI appear at
the angles ranging from 50° to 90° (as marked in Fig. 11a), while the minimum
values of KI occur at the lower endpoints of the long axes. KI along the crack front
increases gradually as d/2a increases and reaches the maximum when d/2a = 1.25.
After that, KI decreases with the increase of crack spacing. Moreover, the crack
spacing also affects the position where the maximum KI appears. When the crack
spacing is small, the maximum KI occurs approximately at the middle position of 1/4
crack front, and as the crack spacing increases, the position of the maximum KI moves
continuously to the endpoint of short axis, just similar to the situation of single cracks.
The normalized KII of two-crack cases has a similar distributing pattern (a linear
manner along crack fronts) to the single-crack cases (Fig. 11b), with its maximum and
minimum values (absolute values) located at the endpoints of long and short axes of
cracks respectively. Numerical results also reveal that the crack spacing has a weak
influence on the KII values and all the curves in Fig. 11b are close to each other.
As shown in Fig. 11c, the normalized KIII of two-crack cases distributes along the
crack front in a similar manner to that of the single-crack cases. The values of KIII
increase with the increase of crack spacing in the range of 0.25 ≤ d/2a ≤ 1.25, and
after that KIII decreases as the spacing increases.
The distributing pattern of normalized ERRs along the upper crack is principally
governed by the KI distribution (Fig. 12). The maximum values of these ERR curves
are located in the angle range of 70° ≤ ≤ 90°, indicating that cracks start propagating

from locations near the endpoints of the short axes. Since the average ERR on the
upper half of crack front (0 ≤ ≤ 90°) is larger than that on the lower half (90° ≤ ≤
180°), the crack grows more sufficiently from the upper half front than from the lower
half. With the increase of d/2a, the value of ERR increases and reaches its maximum
when d/2a = 1.25. Then ERR decreases after d/2a exceeds 1.25, due to the weakening
of crack interaction. The influence of crack spacing on ERR values corresponds to the
experimental results of spacing’s effect on the sample strength to some extent (Fig. 4).
As the ERR increases with crack spacing until it reaches a critical value (d/2a = 1.25
in numerical simulations and d/2a = 1 in experiments), cracks in numerical models
and laboratory samples are more easily to propagate, leading to the decrease of
sample strength. After the crack spacing exceeds the critical value, the interaction
between cracks becomes weak and cracks propagate separately in the pattern similar
to the situation of samples with single cracks, leading to the increase of sample
strength. However, the critical values are slightly different between numerical and
experimental results, which may be caused by the heterogeneity of the tested material.
Propagation of Two Parallel Cracks
The tensile propagation pattern of two parallel cracks is similar to that of a single
crack, in the form of lateral extension and growth of wing cracks (Fig. 13, e.g. d/2a =
0.25). However, due to the interaction between cracks, the initiation position and
growth rate of initial cracks are different. The propagation of two cracks initiates from
the positions at a short distance from the endpoints of short axis ( = 70° at the upper
(a) The lateral view (b) The front view
Fig. 13. Propagation of two parallel cracks (d/2a = 0.25)
C
=70°
=110°
B
B
C
A
C
C
A
A B
B
Lower initial crack
Upper initial crack

crack and = 100° at the lower crack, as marked in Fig. 13b). According to the
distribution of ERRs (Fig. 12), it can be found that with the increase of crack spacing,
the initiation positions move gradually to the endpoints of crack short axis. The
simulation results indicate that the growth rate of the upper (lower) half of the upper
(lower) crack is larger than that of the lower (upper) half, showing that the wrapping
wing cracks in the region between two initial cracks (rock bridge zone) grow more
sufficiently than those growing out of the rock bridge zone. With the propagation of
wing cracks, the rock bridge zone is continuously cut and finally the fracture occurs
throughout the rock bridge zone. This propagation process of two cracks agrees well
with the experimental observation (Fig. 5a), where the coalescence regions connecting
two initial cracks can be clearly observed.
After crack spacing exceeds the critical value (d/2a = 1.25 in numerical simulations
and d/2a = 1 in experiments), the interaction between cracks gets weaker and those
two cracks propagate separately in the manner similar to single cracks. Finally, the
one that grows more sufficiently due to the material’s heterogeneity will lead to the
fracture of the sample. Therefore, only the propagation trace of one crack can be
observed on the failure section of the sample (Fig. 5b).
Conclusions and Discussions
In this study, uniaxial tension experiments on mortar samples containing 3-D internal
cracks and their corresponding numerical simulations by using the BEM code of
FRANC3D were carried out to investigate the growth and coalescence of 3-D cracks
in the rock-like material under tension. The mechanical and failure properties of
different samples were obtained in experiments, and the mixed-mode SIFs and ERRs
along crack fronts as well as the crack growth process were investigated in numerical
studies to provide more information on the 3-D crack growth.
The mechanical and failure behavior of samples is significantly affected by the
geometrical characteristics of cracks. The sample strength decreases with the decrease
of crack dip angle and the increase of crack intensity. In the case of single cracks, the
sample failure resulted from the in-plane growth of horizontal crack or the growth of
wing cracks generated at inclined crack tips. For samples with two parallel cracks, the
sample strength decreases with the increase of crack spacing when 0 ≤ d/2a ≤ 1, and
then increases after d/2a exceeds 1. At small spacing (d/2a ≤ 1), two cracks grew and

joined together, leading to the sample failure, while at large spacing (d/2a > 1), the
crack that grew more sufficiently caused the sample failure.
The distribution of mixed-mode SIFs and ERRs along the crack fronts controls the
propagation pattern of 3-D cracks. Numerical results on samples with single cracks
indicate that KI, KII and KIII have different distributing patterns along the crack front
and these values are also affected by the crack dip angle. KI makes a principal
contribution to the ERR distribution. The ERR increases continuously as decreases,
revealing that the crack grows more easily and therefore the rock has a lower tensile
strength at a small dip angle. The propagation process of single cracks simulated
using FRANC3D indicates that the horizontal crack grows along its initial plane. The
lateral extension is quicker than the growth of wing crack; consequently, the elliptical
crack grows gradually into a circular shape and finally leads to the sample fracture.
For the inclined cracks, the lateral extension grows along the initial crack plane, and
the wrapping wing crack propagates initially in the direction approximately
perpendicular to the crack plane and then changes to the horizontal direction. After the
lateral extension exceeds the half-length of short axis, the growth rate of wing crack
surpasses that of the lateral extension. The combined propagation of the wrapping
wing crack and lateral extension forms a spatially-distorted plane, which results in the
overall fracture.
In models with two parallel cracks, the distribution of SIFs and ERRs exhibits
different characteristics from that in single crack cases, due to the interaction between
cracks. The crack interaction that varies with the crack spacing influences the values
of SIFs and ERRs along crack fronts and the positions where the maximum KI and
ERR exist. As the crack spacing increases, the ERR increases and reaches its
maximum when d/2a = 1.25 (the critical value), and then decreases after d/2a exceeds
1.25. At small spacing, wing cracks in the rock bridge zone grow sufficiently and
coalesce together to cause the overall fracture. After the crack spacing exceeds the
critical value, those two cracks propagate separately due to the weak interaction.
The numerical results correspond well with the laboratory experimental results,
except for the slight difference in the critical spacing values, which may be due to the
material’s heterogeneity. The distribution of mixed-mode SIFs and ERRs along crack
fronts and the crack growth process give an interpretation for the mechanical and
failure behavior of samples. The research results can help better understand the

growth mechanism of 3-D cracks under tension as well as the effects of crack’s
geometrical characteristics.
References
Ashby, M. F., and Hallam, S. D. (1986). “The failure of brittle solids containing small
cracks under compressive stress states.” Acta metallurgica, 34(3), 497–510.
Atkinson, B. K., and Meredith, P. G. (1987). Experimental fracture mechanics data
for rocks and minerals, in Fracture Mechanics of Rock (ed. Atkinson, B. K.),
Academic Press, London, England.
Ayhan, A. O. (2007). “Mixed mode stress intensity factors for deflected and inclined
corner cracks in finite-thickness plates.” Int. J. Fatigue, 29(2), 305–317.
Barlow, K. W., and Chandra, R. (2005). “Fatigue crack propagation simulation in an
aircraft engine fan blade attachment.” Int. J. Fatigue, 27: 1661–1668.
Bobet, A. (2000). “The initiation of secondary cracks in compression.” Eng. Fract.
Mech., 66(2), 187–219.
Bobet, A., and Einstein, H. H. (1998). “Fracture coalescence in rock-type materials
under uniaxial and biaxial compression.” Int. J. Rock Mech. Min. Sci., 35(7),
863–888.
Brace, W., and Bombolakis, E. (1963). “A note on brittle crack growth in
compression.” J. Geophys. Res., 68(12), 3709–3713.
Carter, B. J., Wawrzynek, P. A, and Ingraffea, A. R. (2000). “Automated 3D crack
growth simulation.” Int. J. Numer. Meth. Eng., 47(1–3), 229–253.
Cornell Fracture Group. (2003). FRANC3D concepts & users guide. Cornell
University, Ithaca, NY, http://www.cfg.cornell.edu/.
Dong, C. Y., and De Peter, C. J. (2002). “Numerical modeling of crack reorientation
and link-up.” Adv. Eng. Software, 33(7–10), 577–587.
Dyskin, A. V., Jewell, R. J., Joer, H., Sahouryeh, E., and Ustinov, K. B. (1994).
“Experiments on 3-d crack growth in uniaxial compression.” Int. J. Fract., 65(4),
R77–83.
Dyskin, A. V., Germanovich, L. N., and Ustinov, K. B. (1999). “A 3-D model of wing
crack growth and interaction.” Eng. Fract. Mech., 63(1), 81–110.
Dysikin, A. V., Sahouryeh, E., Jewell, R. J., Joer, H., and Ustinov, K. B. (2003).
“Influence of shape and locations of initial 3-D cracks on their growth in uniaxial

compression.” Eng. Fract. Mech., 70(15), 2115–2136.
Farmer, I. W. (1983). Engineering behaviour of rocks, 2nd Ed., Chapman & Hall,
London, England.
Hsien-Yang, Y., and Chang H. K. (1995). “Fracture mechanics of the angled elliptic
crack under uniaxial tension.” Eng. Fract. Mech., 50(1), 103–110.
Lajtai, E. Z. (1974). “Brittle fracture in compression.” Int. J. Fract., 10(4), 525–536.
Li, S. C., Yang, L., Li, M. T., and Zhang, N. (2009). “Influences of 3D internal crack
dip angle on tensile mechanical properties and fracture features of rock-like
material.” Chinese Journal of Rock Mechanics and Engineering, 28(2), 281–289.
(in Chinese)
Mi, Y., and Aliabadi, M. H. (1994). “Three-dimensional crack growth simulation
using BEM.” Comput. Struct., 52, 871–878.
Palaniswamy, K., and Knauss, W. G. (1972). “Propagations of a crack under general
in-plane tension.” Int. J. Fract. Mech., 8, 114–117.
Rahman, M. K., Hossain, M. M., and Rahman S. S. (2000). “An analytical method for
mixed-mode propagation of pressurized fractures in remotely compressed rocks.”
Int. J. Fract., 103, 243–258.
Rizzo, F. J. (1967). “An integral equation approach to boundary value problems of
classical elastostatics.” Quart. Appl. Math., 25, 83–95.
Sih, G. C. (1991). Mechanics of Fracture Initiation and Propagation. Kluwer
Academic Publishers, Culembourg, Netherlands.
Singh, R., Carter, B. J., Wawrzynek, P. A., and Ingraffea, A. R. (1998). “Universal
crack closure integral for SIF estimation.” Eng. Fract. Mech., 60(2), 133–146.
Sousa, J. L., Martha, L. F., Wawrzynek, P. A., and Ingraffea, A. R. (1989).
“Simulation of non-planar crack propagation in structures of concrete and rock.” In
Fracture of Concrete and Rock: Recent Developments (ed. Shaw, S. P., Swartz, S.
E., and Barr, B.), Elsevier Applied Science, London, England, 254–264.
Wong, R. H. C., Law, C. M., Chau, K. T., and Zhu, W. S. (2004). “Crack propagation
from 3-D surface fractures in PMMA and marble specimens under uniaxial
compression.” Int. J. Rock Mech. Min. Sci., 41(3), 360–366.
Wong, R. H. C., Guo, Y. S., Liu, L. Q., Liu, P. X., and Ma, S. P. (2008). “Nucleation
and growth of anti-wing crack from tips of strike-slip flaw.” Proc., 42nd U.S. Rock
Mechanics Symposium, San Francisco, CA, 221–321.
Wu, H. C., and Chang, K. J. (1978). “Angled elliptic notch problem in compression
and tension.” J. appl. Mech., 45, 258–262.
Wu, H. C., Yao, R. F., and Yip, M. C. (1977). “Experimental investigation of the
angled elliptic notch problem in tension.” J. appl. Mech., 44, 455–461.
Yang, L., Jiang, Y., Li, B., Li, S. C., and Li, M. T. (2010a). “Influence of 3D internal
crack spacing on strength and crack propagation pattern in rock sample subjected to
tensile stress.” Proc., 44th U.S. Rock Mechanics Symposium, Salt Lake City, Utah,
10–374.
Yang, L., Li, S. C., Guo, Y. S., Zhu, W. S., and Lin, C. J. (2010b). “Influence of space
between 3D-cracks on mechanical feature of mortar material.” Rock and Soil
Mechanics, 31(1), 32–38. (in Chinese)
Yang, L., Jiang, Y., Li, S. C., and Li, B. (2011). “Research on the propagation pattern
of 3-D initial crack in rock-like material under uniaxial tension.” Key Eng. Mater.,
452–453, 817–820.