nasa technical note - dtic. · pdf filetance in the design of those components in which the...
TRANSCRIPT
I/
SAND p
NASA TECHNICAL NOTE t NASA TN D-3185
co
!%
I.-
CONDENSATION PRESSURE DROP OF
NONWETTING MERCURY IN A
UNIFORMLY TAPERED TUBE IN 1-gAND ZERO-GRAVITY ENVIRONMENTS
/ :
by James A. Albers and Robert P. Macosko
Lewis Research Center
Cleveland, Ohio2065 615NATL AoNS A20060516165NATIONAL AERONAUTICS AND SPACE ADMINISTRATION • WASHINGTON, D. C. - JANUARY 1966

NASA TN D-3185
CONDENSATION PRESSURE DROP OF NONWETTING MERCURY IN A
UNIFORMLY TAPERED TUBE IN 1-g AND ZERO-GRAVITY
ENVIRONMENTS
By James A. Albers and Robert P. Macosko
Lewis Research CenterCleveland, Ohio
NATIONAL AERONAUTICS AND SPACE ADMINISTRATION
For sale by the Clearinghouse for Federal Scientific and Technical InformationSpringfield, Virginia 22151 - Price $2.00
CONDENSATION PRESSURE DROP OF NONWETTING MERCURY IN A UNIFORMLY
TAPERED TUBE IN 1-g AND ZERO-GRAVITY ENVIRONMENTS
by James A. Albers and Robert P. Macosko
Lewis Research Center
SUMMARY
/An experimental investigation was conducted to determine the pressure drop of non-
wetting (dropwise) condensing flow of mercury vapor in 1-g and ! ravity environ-"e
-.-.mmits. Local static pressure data were obtained for a uniformly tapered stainless-steelhorizontal tube for various flow rates, pressures, and condensing lengths.
The overall static pressure difference from inlet to interface (P 0 - Pliq)S varied
from a pressure rise of 0. 9 pound per square inch to a pressure drop of 0. 1 pound per
square inch, while the overall total pressure drop varied from 0. 0 to 1. 4 pounds per
square inch for the condensing lengths and flow rates investigated. The experimentaldata indicated that the gravity effect was negligible for all flow rates investigated.
Lockhart-Martinelli correlation predicted values for the ratio of pressure gradients
(bg within approximately ±35 percent for the high quality region of the condensing tube.
The experimental values of the ratio of pressure gradients 1b ranged up to five times
the value predicted by Lockhart-Martinelli for the low quality region of the tube. Thefog-flow theory of Koestel, et al., roughly predicted the trend of the data over the entirequality range. Experimental values of the fog-flow parameter b2x3/4 varied between
g-50 and +100 percent of the theoretical value for Weber numbers ranging from 10 to 100(high velocity region). For Weber numbers ranging from 0. 1 to 10 (low velocity region)
the experimental values varied between -50 and +165 percent of the theoretical value
INTRODUCTION
The flow characteristics of working fluids in the absence of body forces are amongthe numerous problems encountered in the design of components of Rankine cycle turbo-

generator systems. Knowledge of zero-gravity flow phenomena is of particular impor-
tance in the design of those components in which the working fluid experiences phase
changes such as occur in the condensing process. These phase changes represent a major
problem in the design of condenser components with regard to the prediction of pressure
drop. Furthermore, the existing data on pressure drop in a 1-g environment may not be
representative of the pressure drop during system operation in a weightless environment.
The pressure drop in a condenser tube is influenced by the flow regimes encountered.
Previous photographic studies at the Lewis Research Center indicated differences in the
drop distribution of nonwetting mercury condensing in straight tubes in 1-g and zero-
gravity environments (ref. 1). Under l-g conditions droplet runoff down the tube wall
was observed, resulting in a liquid accumulation in the bottom of the tube, particularly in
the low velocity region. Under zero-gravity conditions, the liquid droplets were uni-
formly distributed around the circumference of the tube and in the vapor stream. These
flow differences may influence the pressure drop in the condenser tube, which, in turn,
is important to the design of mercury condensers. As part of the overall mercury con-
densing program at NASA Lewis Research Center, the effect of weightlessness on the
pressure drop of nonwetting mercury condensing in constant diameter and uniformly
tapered tubes was studied. The zero-gravity durations were obtained in a converted
Navy bomber (AJ-2) (fig. 1) flying through a Keplerian trajectory. The effect of weight-
lessness on the pressure drop of mercury condensing in a constant diameter tube was
reported in reference 1. A continuation of this study is reported herein. Because ta-
pered tubes are currently being considered for use in condensers, particular emphasis
was given to the local pressure distribution and overall pressure difference (from inlet
to interface) in a tapered tube. This investigation compares the local pressure gradients
C-60692
Figure 1. - Zero-gravity flight facility.
2

with the analytical predictions of Lockhart-Martinelli and of Koestel et al. as discussed
in references 2 and 3, respectively.
Previous analytical studies of the two-phase flow problem have dealt with the sim-
plified flow models to derive correlations that would permit the estimation of two-phase
pressure drops (from single-phase pressure drop measurements). Lockhart-Martinelli
pressure drop correlations for two-component, two-phase, adiabatic flow are often ap-
plied to condensing (ref. 2). Lockhart-Martinelli relates the ratio of the two-phase fric-
tional pressure gradient to the pressure gradient of the vapor flowing alone. Both Hays
(ref. 4) and Kiraly (ref. 5) compared mercury condensing data with the Lockhart-
Martinelli correlations. Hays found general agreement in the high quality region of the
condensing tube. At low qualities the agreement with theory was not apparent. Kiraly's
values also showed considerable deviation from Lockhart-Martinelli for condensation
inside horizontal tapered tubes and inclined tubes of constant diameter.
Another correlation used for condensing is the fog-flow correlation reported in ref-
erence 3. This correlation assumes homogeneous flow and accounts for the reduction in
flow area due to the condensed droplets on the tube inside surface. The local Weber
number (which is a function of this reduction) is used to determine the ratio of the two-
phase frictional pressure gradient to the pressure gradient that would result if the vapor
flowed alone. Comparison of the existing data obtained by the authors of reference 3
with the fog-flow correlation showed that the theory satisfactorily predicted the trend of
the data although considerable scatter was present.
An analysis of the phenomena involved in condensing under differing gravity condi-
tions can be found in reference 6. Mercury-nitrogen two-phase flow data were presented
with the test section positioned in different orientations. The authors concluded that
pressure drop can be expected to change when going from 1 g to zero gravity under limi-
tations of Reynolds number and vapor specific volume.
SYMBOLS
A cross-sectional area, sq ft
A average cross-sectional area, sq ft
C specific heat of mercury vapor, Btu/(lb mass)(°F)
D tube outside diameter, ft
d tube inside diameter, ft
f friction factor, dimensionless
f function of
3

gc conversion factor, 32. 174 (lb mass)(ft)/(lb force)(sq sec)
h local heat transfer coefficient, Btu/(sec)(sq ft)(°F)
hfg mercury latent heat of vaporization, Btu/lb mass
k thermal conductivity, Btu/(sec)(ft)(°F)
L length, ft
I distance from condensing tube inlet, ft
Nu Nusselt number, dimensionless
P pressure, lb/sq ft
PT pressure transducer
q local heat flux, Btu/(sec)(sq ft)
4 average heat flux, Btu/(sec)(sq ft)
Re Reynolds number, dimensionless
T temperature, OF
t time, sec
u velocity, ft/sec
V velocity ratio, Uliq/ug, dimensionless
v specific volume, cu ft/lb mass
We Weber number, dimensionless
w mass flow rate, lb mass/sec
x quality, w /WT, dimensionless
tL viscosity, lb mass/(ft)(sec)
p density, lb mass/cu ft
5 average density, lb mass/cu ft
a surface tension, lb force/ft
c b Lockhart -Martinelli parameter, N/IAP/AL)TPF/(AP/AL)g, dimensionless
X two-phase flow modulus, N/(AP/AL)liq/(AP/AL)g, dimensionless
Subscripts:
c condensing
e exit
4

g mercury vapor
I local
liq liquid
N2 Nitrogen coolant
S static
sat saturated mercury vapor
sup superheated mercury vapor
T total
TP two-phase
TPF two-phase frictional
t tube
tt turbulent liquid, turbulent gas
vt viscous liquid, turbulent gas
w wall
0 inlet
0,12,36 }distance from condensing tube inlet, in.48, 60,72)
DESCRIPTION OF APPARATUS
Experimental System and Components
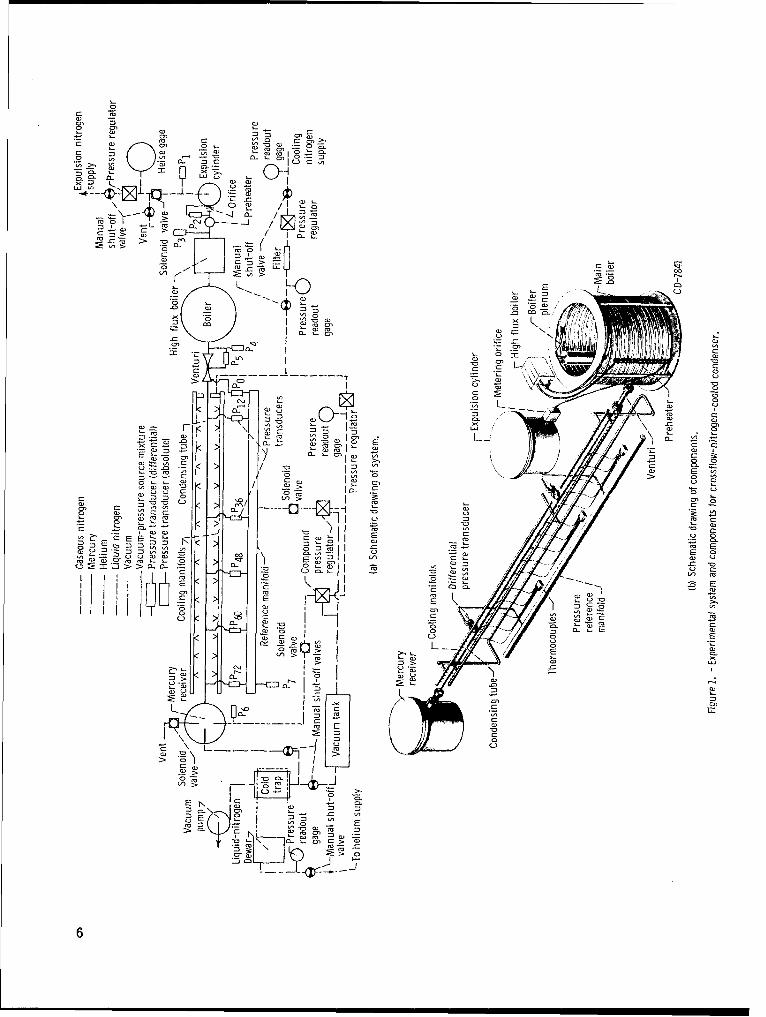
Schematics of the experimental system and components are presented in figures 2(a)
and (b). Photographs of the system components are shown in figures 2(c) and (d). For
simplicity, a single pass mercury system, with a capacity for a 90-minute continuous
run, was designed. The weight of the test package and related power equipment was ap-
proximately 2000 pounds. The mercury system consisted of an expulsion cylinder, a
liquid-flow measuring system, a preheater, a high-heat-flux boiler, and a main boiler,
a vapor flow measuring venturi, a horizontal condensing tube, and a receiver for collect-
ing the condensed mercury. The condensing tube was cooled by gaseous nitrogen jets
flowing through 0. 052-inch holes every 3/4 inch along two diametrically opposed mani-
folds located above and below the condensing tube. The nitrogen jet orifices in the cool-
ing manifolds were approximately 1 inch from the centerline of the condensing tube.
5
a,0
c:: a,0 :w3 ~ ~ ,a~,
0 20A -,G - l t oi 0':
,,~ >, ,>
c >n
o ~a.
:3 m
=3 E ac E0
04
n': >
Ln :3 -i; NJ
Ica-
-T- >-4- j

• Expulsion High flux. •,•cyl rider-bierMi
M eteri~.o~rifice -
(c) Boiler end of experimental package.
'Expulsion
,cylinder-,
L Receiver[
(d) Receiver end of experimental package.
Figure 2. - Concluded.
Approximately 250 pounds of triple-distilled mercury were stored in a stainless-
steel expulsion cylinder. A neoprene bladder was used in the cylinder to maintain the
orientation of the mercury in the container during the zero-gravity maneuver.
Boiling was accomplished in three stages. Mercury was first passed through a pre-
heater, which raised the liquid temperature to the saturation point. It then entered the
high heat flux unit where nucleate boiling raised the vapor quality to approximately 25 per-
cent. The additional heat input needed to increase the quality to about 90 percent wassupplied in the main boiler, which consisted of a single 150-foot length of flattened tubing
coiled in a 2-foot diameter helix. The power for the main boiler was applied directly tothe tubing that formed the mercury flow passage. The helical design of this unit, which
created very high lateral gravity forces on the vapor, minimized the effect of the varying
vertical gravity forces encountered during the transition from 1 g to zero gravity.The mercury vapor flow into the condenser was measured by a venturi at the conden-
ser inlet, which had a throat diameter of 0.277 inch and an exit diameter of 0.311 inch.The condenser was an 84-inch-long uniformly tapered stainless-steel (AISI 316) hori-zontal tube with a 0. 40-inch inside diameter at inlet and a 0. 15-inch inside diameter at
outlet with a 0. 025-inch wall thickness. A pressure tap was located at 0, 12, 36, 48,60, and 72 inches from the tube inlet. The exit of the condenser was equipped with a1/16-inch-diameter orifice to help damp out potential instabilities in the tube.
The mercury receiver consisted of a cylinder baffled on the inside to minimize mer-
cury movement during the zero-gravity maneuver. Receiver operating pressure wasmaintained at about 15 pounds per square inch absolute by a nitrogen gas pressure regu-
lator.
Instrumentation
The location of instrumentation of the condenser tube is shown in figure 3. Stainless-
steel inductance-type (linear variable differential transformer) pressure transducers,
capable of operating in a mercury environment up to 9000 F, were used to measure con-denser tube pressure distribution, venturi inlet pressure, and venturi pressure drop.
Each transducer in direct contact with mercury was mounted with its core axis parallelto the lateral axis of the aircraft to minimize the effects of the zero-gravity maneuver.
Differential pressure transducers used on the condensing tube were mounted with the
higher pressure sides to the tube and the low pressure sides referenced to a common,
nitrogen gas manifold. These pressure transducers were connected directly to fittingswhich were welded to the condenser tube. Low temperature variable reluctance trans-
ducers were used at all other locations in the system. A complete listing of all pressuretransducers and their respective calibration range is presented in table I.
8

84 in.
Pressure PT72 PT60 PT48 PT36 PT12
transducers Pressure
, rThermocouplesi
Flow
Thermocouples T, T2 T3 T4 T5 T6 T7 T8 T9 T10 T11 T12 T13 T14 T15 T16 T17 T18 T19
Distance fromcondenser inlet,
in. 75 7169 6765 63 59 5755 53 51 47 45 43 41 37 33 18 6
Figure 3. - Location of instrumentation on condensing tube (uniformly tapered stainless-steel tube with 0. 40 in. i. d. at inlet, 0. 15 in. i. d.at outlet, and 0. 025 in. wall thickness).
Thermocouples throughout the system were constructed of the Instrument Society ofAmerica (ISA) standard calibration K (Chromel-Alumel) wires. A shielded, sheathedthermocouple was immersed in the mercury vapor stream at the venturi inlet. Thermo-couples were spotwelded to the outside wall of the condenser and were used for indicatingthe location of the interface.
All temperature and pressure data needed for the analysis were recorded on twomultichannel oscillographs. A typical oscillograph trace showing the vertical accelera-tions during the maneuver and pressure oscillations in the condenser is presented infigure 4 (p. 10). The accelerations generated along the three axes of the aircraft weresensed by accelerometers located in the bomb bay near the geometric center of the ex-periment. The gravity levels experienced here were relayed to readout equipment on thepilot's control panel and were used for aircraft control throughout the maneuver. Thesame gravity levels were recorded on the pressure oscillograph so that a direct compar-ison with system pressures could be made.
PROCEDURE
The zero-gravity durations were obtained in a converted Navy bomber (AJ-2) flyingthrough a Keplerian trajectory. About 4 to 5 seconds of the trajectory were required todamp out pressure oscillations induced by the pullup maneuver. All the maneuversflown during the test program were analyzed, and average zero-gravity times were com-puted. From these data it was shown that for an average of 5.28 seconds per trajectory,the gravity level was within ±0. 01 g and for 12.72 seconds the gravity level was within±0. 05 g. The aircraft and zero-gravity maneuver is discussed in more detail in appen-
9

Zero-gravity line -- Vertical acceleration Pressure
Pressure7
P3672
ý-I-g line P
I I I Ii 2 3 4 5 6 7
.... I . I.7 8 9 10 11 12 13
Zero-gravity line
Pressure Vertical acceleration-'P72
• ,^/• -• ^ ̂ -.•A I_,. an^ AA/ #1-
P3 6
I I I I I I13 14 15 16 17 18 19
Time, sec
Figure 4. - Typical oscillograph trace.
10
dix A of reference 1.A good comparison between 1-g and zero-gravity data points was obtained by taking
the 1-g points in the aircraft while in level flight and the zero-gravity points immediately
after without changing conditions. The aircraft accelerometers were zeroed with thecondenser tube leveled to ensure good 1-g data while in flight. The zero-gravity data
shown in table II was taken from oscillograph traces at points that represented the end of
the longest segment of good zero-gravity.
Before initiating flow through the system, the mercury lines were evacuated to 0. 06torr and the mercury boilers brought to operating temperature. Mercury flow throughthe system was initiated and maintained by pressurizing the gas side of the bladder in the
expulsion cylinder with regulated gaseous nitrogen. The liquid flow rate was monitored
by observation of the pressure drop across a calibrated orifice located at the preheaterinlet. Startup mass flow was set at 0. 03 pound per second, and mercury vapor was al-lowed to purge the system for approximately 5 minutes to remove any remaining non-
condensables from the lines. The receiver pressure was increased to a constant value(between 14 and 15 psia), and the nitrogen coolant flow was regulated to locate the inter-face at the desired location. During the 1-g and zero-gravity runs the tube skin temper-atures were scanned using a manual selector switch to determine location of the interfacewithin approximately ±1 inch. This was easily determined since the tube wall tempera-
ture dropped rapidly in the liquid region of the tube. Data were recorded for mercurymass flow rates of 0. 025 to 0. 05 pound per second, and condenser inlet vapor tempera-tures corresponding to approximately 3000 F superheat. Boiler performance tests indi-cated low quality (x w wg/wT) for vapor saturation temperature at the boiler outlet. Itwas necessary in this system to raise the vapor temperature to 3000 F superheat to min-
imize liquid carryover.
Prior to every flight, a complete calibration of pressure and temperature instrumen-tation was carried out (see appendix A).
METHOD OF ANALYSIS
In the condensing process the static pressure drop is the sum of the frictional pres-sure drop and the pressure recovery (due to the momentum decrease). The frictionaltwo-phase pressure drop between two pressure taps was determined by subtracting the
calculated pressure recovery (due to momentum decrease) from the measured local staticpressure difference. A force balance between two pressure taps of a tapered tube can be
expressed as
11
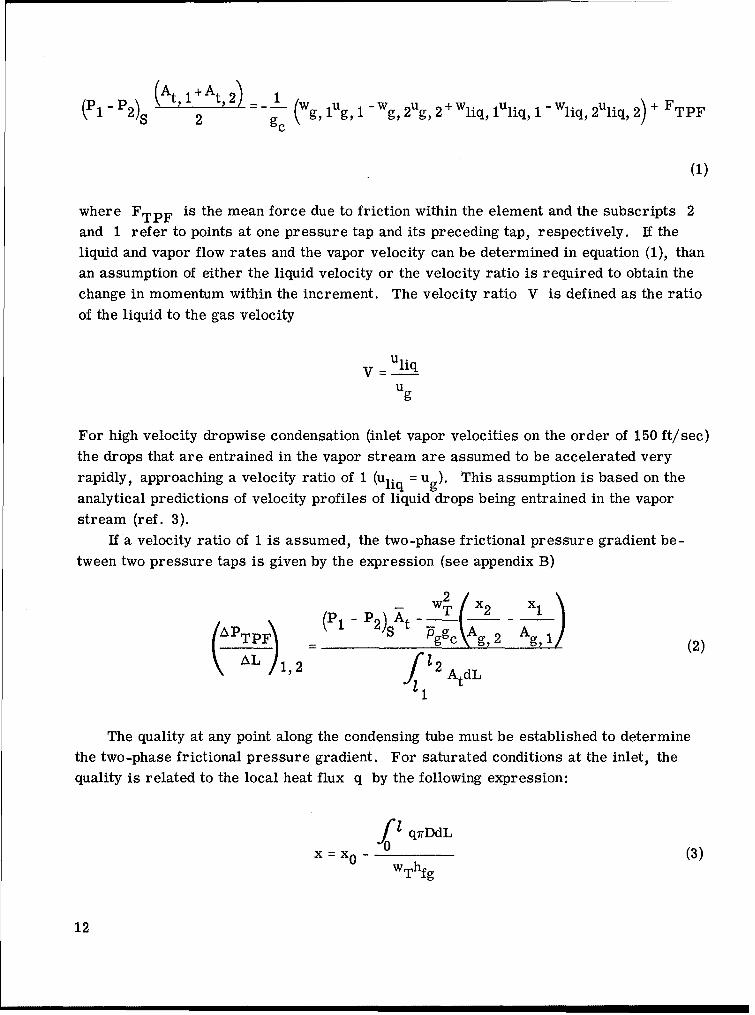
(P1 -P2S (At) 1+A At = 1 (g, lug, 1 Wg, 2Ug, 2+wliq , 1uliq 1- Wiq, 2uliq, 2)+ FTPF2 gc
(1)
where FTPF is the mean force due to friction within the element and the subscripts 2
and 1 refer to points at one pressure tap and its preceding tap, respectively. If theliquid and vapor flow rates and the vapor velocity can be determined in equation (1), thanan assumption of either the liquid velocity or the velocity ratio is required to obtain the
change in momentum within the increment. The velocity ratio V is defined as the ratio
of the liquid to the gas velocity
V = uliquUg
For high velocity dropwise condensation (inlet vapor velocities on the order of 150 ft/sec)the drops that are entrained in the vapor stream are assumed to be accelerated very
rapidly, approaching a velocity ratio of 1 (Uliq = ug). This assumption is based on the
analytical predictions of velocity profiles of liquid drops being entrained in the vapor
stream (ref. 3).
If a velocity ratio of 1 is assumed, the two-phase frictional pressure gradient be-tween two pressure taps is given by the expression (see appendix B)
_____ s gt •cAT 2 Ag((A F) (P1 - P2 )SA t -1
L1,j2 12 AtdL
The quality at any point along the condensing tube must be established to determine
the two-phase frictional pressure gradient. For saturated conditions at the inlet, the
quality is related to the local heat flux q by the following expression:
fO1 qiiDdL
x = x0 - fI idL(3)WThfg
12
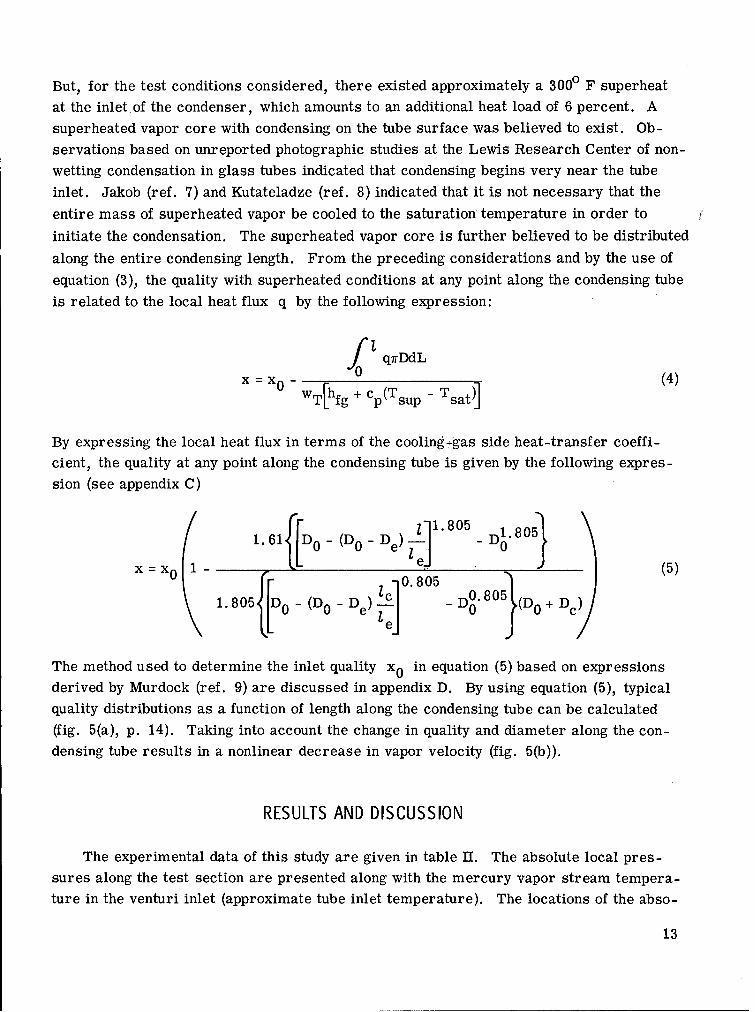
But, for the test conditions considered, there existed approximately a 3000 F superheat
at the inlet of the condenser, which amounts to an additional heat load of 6 percent. A
superheated vapor core with condensing on the tube surface was believed to exist. Ob-
servations based on unreported photographic studies at the Lewis Research Center of non-
wetting condensation in glass tubes indicated that condensing begins very near the tube
inlet. Jakob (ref. 7) and Kutateladze (ref. 8) indicated that it is not necessary that the
entire mass of superheated vapor be cooled to the saturation temperature in order to
initiate the condensation. The superheated vapor core is further believed to be distributed
along the entire condensing length. From the preceding considerations and by the use of
equation (3), the quality with superheated conditions at any point along the condensing tube
is related to the local heat flux q by the following expression:
fX = XO - f0 qffDdL(4
x=x 0 - WT[hfg + cp(Tsup - Tsa)] (4)
By expressing the local heat flux in terms of the cooling-gas side heat-transfer coeffi-cient, the quality at any point along the condensing tube is given by the following expres-
sion (see appendix C)
: (Do_ D~~e]_l1. 805 D.0 5) li° e! .01x =x 0 - 1. 805[D (D O D 01805 805
fD e) -•e(-D-"D80] -D0 +De
The method used to determine the inlet quality x0 in equation (5) based on expressions
derived by Murdock (ref. 9) are discussed in appendix D. By using equation (5), typical
quality distributions as a function of length along the condensing tube can be calculated
(fig. 5(a), p. 14). Taking into account the change in quality and diameter along the con-
densing tube results in a nonlinear decrease in vapor velocity (fig. 5(b)).
RESULTS AND DISCUSSION
The experimental data of this study are given in table II. The absolute local pres-
sures along the test section are presented along with the mercury vapor stream tempera-
ture in the venturi inlet (approximate tube inlet temperature). The locations of the abso-
13

1.0 i
.1 Z'ero gravity,•' 8 _ i E. Inter-
S-.8 Ta
00S6-- o - - - - -- ,
4 . Condensing•:, . .... • • • length, -
ý1 2-- (a) Vapor mass flow rate, 0. 0291 pound per second.
Inter-
(a) Typical quality distributions for various condensing face
lengths. -240 - -- -~ - - -Vapor mass flow -
rate, 0 0
200 Wg,lb mass/sec
U 0.045 I••)b Vapor mass flow rate, 0. 0373 pound per second.- 160 pon e eod
.036- - -U
S120 ------ '- -
S026-Inter-----.026---- - .8 - -face
4- -- - - - -.8
S0 12 24 36 48 60 72
0 12 24 36 4S 60 72 Distance from condensing tube inlet, Ex 12, in.Distance from condensing tube inlet, Ix 12, in. (c) Vapor mass flow rate, 0. 0488 pound per second.
Wb) Typical axial velocity distributions for various con- Figure 6. - Typical distributions of local static pressuredensing lengths and flow rates. drop for 1-g and zero-gravity environments.
Figure 5. - Typical quality and velocity distributions alongcondensing tube (inlet quality, xo, 0.90).
lute pressures are identified by the subscripts to the letter P, which denote the distance
from the inlet of the tube. The condenser inlet pressure P 0 was calculated from the
venturi exit pressure and the losses due to the change in diameter from 0. 31 inch (venturi
exit) to the tube inlet diameter of 0. 40 inch. The position of the liquid-vapor interface is
given as the distance from the condenser inlet (condensing length). The calculated flow
rates of the mercury liquid entering the boiler, the vapor flow rate out of the boiler, and
the tube inlet quality are tabulated.
Measured Local Static Pressure Drop and Overall Pressure Difference
Typical distributions of local static pressure drop are presented in figure 6. These
distributions were obtained from the difference between the inlet absolute pressure and
14

the measured absolute local static pressures along the condensing tube. A single curve
was drawn because of the small spread between the 1-g and zero-gravity data points.
This separation was within the accuracy of the instrumentation. In general, the local
static pressure drop increased over the first half of the condensing length because of the
high friction losses resulting from high vapor velocities and increased effective wall
roughness caused by drop formation. In the last half of the condensing length, however,
the pressure rise due to momentum decrease exceeds the pressure loss due to friction.
This results in a net decrease in the local static pressure drop and, consequently, a
relatively small overall static pressure rise. For the curves presented in figure 6 the
inlet dynamic heads varied no more than 3 percent from each other. With the inlet con-
ditions approximately the same there was no discernible difference between the distribu-
tions of local static pressure drop for 1-g and zero-gravity environments.
The effect of gravity on the measured overall static pressure difference (P 0 - Pliq)•S
for various inlet velocities is presented in figure 7. The overall static pressure differ-
ence (P 0 - Pliq)S was obtained by subtracting the average static pressure in the liquid
leg from the inlet static pressure. Examination of figure 7 indicates little difference be-
tween the 1-g and zero-gravity conditions, although the majority of zero-gravity points
fall slightly above the 1-g points. For condensing lengths from 45 to 71 inches and vapor
inlet flow rates from 0. 026 to 0. 048 pound
mass per second the values of
(Po - Pliq)S ranged between a pressure
0- U rise of 0.9 pound per square inch and a- -0-I3J- pressure drop of 0.1 pound per square
~-• -. E] inch.
, (a) Vapor mass flow rate, 0. 026 to 0. 028 pound per second, pres-, sure at condensing tube inlet, 12. 5 to 20. 5 pounds per square The overall total pressure drop was
inch absolute; temperature at condensing tube inlet, 980* to obtained by adding the inlet dynamic=¢ 1050' F. otie yadn h ne yai0 -1go I 1 pressure to (P 0 - Pliq)S, the dynamic
'U_ pressure in the liquid portion being neg-
-0 Zerogravity_ ligible (fig. 8, p. 16). The overall total
~. -1.6 -l--g- -pressure drop varied from 0.0 to 1.4;5 (b) Vapor mass flow rate, 0.035 to 0.038 pound per second; pres- pounds per square inch for the condensing
"sure at condensing tube inlet, 15. 2 to 17. 2 pounds per squareinch absolute; temperature at condensing tube inlet, 10100 to lengths and weight flows considered.1080' F.
0
1t 1 0 0 R 1 R I1I Comparison of Experimental Data with44 48 52 56 60 64 68 72
Condensing length, 1x 12, in. Lockhart-Martinelli Correlation(c) Vapor mass flow rate 0. 044 to 0. 048 pound per second; pres-
sure at condensing tube inlet, 14. 5 to 18. 5 pounds per square The Lockhart-Martinelli correlationinch absolute, temperature at condensing tube inlet, 10000 to11000 F. relates two-phase frictional pressure
Figure 7. - Effect of gravity on overall static pressure difference, gradient to the frictional pressure gra-
15
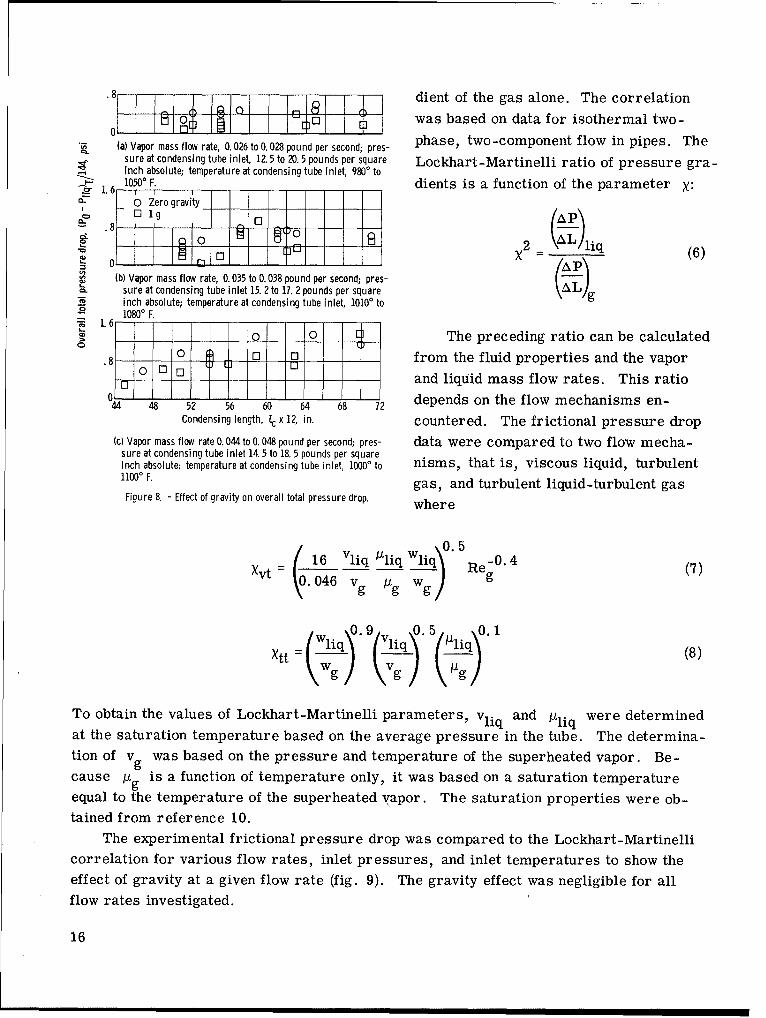
.8 Q, I U I dient of the gas alone. The correlation
01BE or iEE Jo H was based on data for isothermal two-
'• (a) Vapor mass flow rate, 0.026 to 0.028 pound per second; pres- phase, two-component flow in pipes. Thesure at condensing tube inlet, 1Z 5 to 20. 5 pounds per square Lockhart-Martinelli ratio of pressure gra-inch absolute; temperature at condensing tube inlet, 9800 to
S10500 F. dients is a function of the parameter X:1.6.. 0 Zero gravity _I
'Ig /AD\CL .8 0 "9 _ 8 2 ___ýLliS0C3] (6)
0 (b) Vapor mass flow rate, 0. 035 to 0. 038 pound per second; pres-sure at condensing tube inlet 15. 2 to 17. 2 pounds per square"inch absolute; temperature at condensing tube inlet, 10100 to10800 F.
S1.6- - - - - - - - - - - -
I I. 1 The preceding ratio can be calculated
.8- 0 from the fluid properties and the vapor'--- and liquid mass flow rates. This ratio
44 48 52 56 0 64 68 72 depends on the flow mechanisms en-Condensing length, Ic x 12, in. countered. The frictional pressure drop
(c) Vapor mass flow rate 0. 044 to O. 048 pound per second; pres- data were compared to two flow mecha-sure at condensing tube inlet 14. 5 to 18. 5 pounds per squareinch absolute; temperature at condensing tube inlet, Ioo' to nisms, that is, viscous liquid, turbulent1100' F. gas, and turbulent liquid-turbulent gas
Figure 8. - Effect of gravity on overall total pressure drop. where
Xvt 616 Vliq /'liq Wi'_ Re 0 .4
\v .046 V g wR (7)
(wt )iq 9 (vhiqN /1iq (8)
To obtain the values of Lockhart-Martinelli parameters, Vliq and #liq were determined
at the saturation temperature based on the average pressure in the tube. The determina-tion of vg was based on the pressure and temperature of the superheated vapor. Be-cause 11g is a function of temperature only, it was based on a saturation temperatureequal to the temperature of the superheated vapor. The saturation properties were ob-tained from reference 10.
The experimental frictional pressure drop was compared to the Lockhart-Martinellicorrelation for various flow rates, inlet pressures, and inlet temperatures to show theeffect of gravity at a given flow rate (fig. 9). The gravity effect was negligible for allflow rates investigated.
16

o Zero gravity - The Lockhart-Martinelli corre-
20 lation generally predicts 4g withing
Turbulent approximately ±35 percent for theI0• liqud,
S turbulent high quality, high vapor Reynolds^S1 I - number region of the condenser (i.e.,
low values of the parameter X). The
r- -Viscous liquid, ratio of condensing pressure gradientsturbulent gas ) both for 1-g and zero-gravity
-LLockhart-Martinelli ranged up to 5 times the value pre-
.6 'dicted by Lockhart-Martinelli for the(a) Vapor mass flow rate, 0. 026 to 0. 028 pound per second; pressure at con- low quality region of the tube (i. e.
densing tube inlet, 12. 5 to 20. 5 pounds per square inch absolute; tem-perature at condensing tube inlet, 9800 to 10500 F. high value of the Lockhart-Martinelli
0 -parameter X).. A similar result is
20 0 reported in reference 3. This devia-
STurbulent tion may result partly from the factE 10 luid, that the flow regimes in dropwise
~ 8 turbulent-6 gas-\ condensing are significantly different
S 4------ r- from the two-component, two-phase
adiabatic flow model assumed by2 IIIus liquid,- Lockhart-Martinelli. It can be con-
Lockhart-Martinelli cluded that the Lockhart-Martinelli1 _4 ._-curves, We.2.8=C ,correlation is not very applicable to
condensing (with an approximately(bW Vapor mass flow rate, 0. 035 to 0. 038 pound per second, pressure at con-
densing tube inlet, 15. 2 to 17. 2 pounds per square inch absolute; tern- constant heat flux) over the entireperature at condensing tube inlet, 10100 to 10800 F.4o quality range.
20 1_Turbulent
liquid, Comparison of Experimental Data10 C turbulent8 I I [as6 0-1 s with Fog-Flow Correlation
Irý r II 111• ,,,4--- II .• '-R I" U_
2 Vscous liquid, For high velocity condensingII . :-Loturbulent gas (inlet vapor velocity on the order of
I _5_,_ Lckhart-Marteli .150 ft/sec) the entrained drop size is
.6 l I 1 1 considered to be on the order of 0. 01
.004.006 .01 .02 .04 .06 .01 .2 .4 .6 flow modulus, X inch in diameter. The flow regime
(ci Vapor mass flow rate, 0.044 toO. 048 pound per second; pressure at con- approaches a fog-flow condition indensing tube inlet, 14. 5 to 18. 5 pounds per square inch absolute; tern- which the vapor and liquid can beperature at condensing tube inlet, 10000 to 11000 F.
Figure 9. - Comparison of experimental data with Lockhart-Martinelli cor- treated as a homogeneous flow. Therelation. fog-flow regime of Koestel, et al., in
17
reference 3 is based on a zero-gravity flow model, and this correlation considers thereduction in the flow area due to the condensed droplets on the tube surface. This flow
model assumes that a drop grows to a particular size called the critical drop diameter
5c, which is then entrained in the vapor stream (ref. 3), where
dm = d - 26c (9)
and dm is the diameter of the flow passage remaining when condensed drops form onthe wall.
The fog-flow correlation expresses a fog flow parameter 42x3/4 as a function ofg
Weber number
4x3/ 4 =f(We)-f ( dPgug (10)9 ~~ lV9;iqj
Both the fog-flow parameter 42x3/ 4 and the Weber number are expressed as a functiong
of the ratio of tube to fog-flow diameter:
2 8Edgug a (11)
2 ~~~ jq (d) -(d ) 3
and
:2X3/4 d (12)
where E a is an experimental constant (0. 0464) that accounts for the effects of dropdeformation, contact angle, and surface condition (ref. 6).
The theoretical relation between the fog-flow parameter and the Weber number wasobtained from equations (11) and (12). Experimental values of We and x3/4 e
gcalculated from the experimental pressure measurements and the local mercury condi-tions in the tube.
The experimental data were compared with the fog-flow theory for various flow
rates, inlet pressures, and inlet temperatures (fig. 10). The gravity effect was negli-gible for all flow rates investigated.
18

0 Zero-gravity
10-i
6 Theoretical, ref. 3-III
I I I I tI 1 11 1 I ih,
.4 .
(at Vapor mass flow rate, 0. 026 to 0. 028 pound per second; pressure at condensing tube inlet, 12.5 to 20. 5 pounds persquare inch absolute; temperature at condensing tube inlet, 9800 to 10500 F.
.0 - f-
.6 T er I ti al r .3
(b) Vapor mass flow rate, 0. 035 to 0. 038 pound per second; pressure at condensing tube inlet, 1 5. to 17.25 pounds persquare inch absolute; temperature at condensing tube inlet, 18010 to 1080' F.
6- Theoretical, ref. 3-
02 40 68100 2
.8 - i' •
- I I0 IL iE C 1
.4W n e g,
(b) Vapor mass flow rate, 0. 035 to O. 038 pound per second; pressure at condensing tube inlet, 15. 2 to 18. 2 pounds persquare inch absolute; temperature at condensing tube inlet, 10100 to 10800 F.
101
6- Theoretical, ref. 3 ,
i.4 - II I-O
.02 .04 .06.08.1 .2 .4 .6 .8 1 2 4 6 8 10 20 40 60 80100 200 400
Weber number, dpgug/2gcoliq
(c) Vapor mass flow rate, 0. 044 to 0. 048 pound per second; pressure at condensing tube inlet, 14. 5 to 18. 5 pounds per
square inch absolute; temperature at condensing tube inlet, 10000 to 11000 F.
Figure 10. - Comparison of experimental data with fog-flow correlation.
19

The fog-flow theory roughly predicts the trend of the data over the entire qualityrange. Experimental values of the fog-flow parameter 4)x3/4 varied between -50 and
g+100 percent of the theoretical value for Weber numbers ranging from 10 to 100 (high ve-locity region). For Weber numbers ranging from 0. 1 to 10 (low velocity region) the ex-
perimental values varied between -50 and +165 percent of the theoretical value. Thespread in data in the last half of the condensing length can be attributed to the low vaporvelocities resulting in small frictional pressure gradients. For example, a 2 percenterror in one pressure pickup in this region of the condensing tube can result in a 40 per-
cent change in the frictional pressure gradient.
SUMMARY OF RESULTS
An experimental study of the pressure drop of nonwetting mercury vapor condensingin a uniformly tapered tube in 1-g and zero-gravity environments yielded the followingprincipal results:
1. The gravity effect was negligible for all flow rates investigated.2. The overall static pressure difference (P0 - PliqaS varied from a pressure rise
of 0. 9 pound per square inch to a pressure drop of 0. 1 pound per square inch, while theoverall total pressure drop varied from 0. 0 to 1. 4 pounds per square inch for the con-densing lengths and flow rates investigated.
3. Lockhart-Martinelli correlation predicts values for the ratio of pressure gradientsDg within approximately ±35 percent for the high quality region of the condensing tube.
The values of 4g ranged up to five times the value predicted by Lockhart-Martinelli for
the low quality region of the tube.
4. The fog-flow theory of Koestel, et al. roughly predicts the trend of the data overthe entire quality range. Experimental values of the fog-flow parameter cD2x3/4 varied
between -50 and +100 percent of the theoretical value for Weber numbers ranging from10 to 100 (high velocity region). For Weber numbers ranging from 0. 1 to 10 (low velocityregion) the experimental values varied between -50 and +165 percent of the theoretical
value.5. Better agreement with the data was found with the fog-flow theory than with the
Lockhart-Martinelli correlation.
Lewis Research Center,
National Aeronautics and Space Administration,
Cleveland, Ohio, September 20, 1965.
20

APPENDIX A
CALIBRATION
All differential pressure transducers were calibrated simultaneously by pressurizing
the mercury system with gaseous nitrogen through the venturi. The low pressure sides
of the transducers were all referenced to atmospheric pressure, and a selected range of
gage pressure was applied to the system. Desired oscillograph and readout gage spans
were adjusted, and recorder runs were made over the calibration range so that trans-
ducer calibration curves could be plotted.
The absolute pressure transducers were also calibrated simultaneously by applying
pressure to the entire system. In order to zero these transducers, the system was first
pumped to a vacuum (1 torr). All other transducers in the system were calibrated indi-
vidually.Every high-temperature transducer was calibrated in the system at room tempera-
ture before each test run. For the high-temperature transducers in the vapor region,
the operating temperature of the diaphragms was estimated to be a maximum of approxi-
mately 3000 F. The change in output caused by operating at these temperatures was
approximately 0. 5 percent of the maximum output of the transducers and was considered
sufficiently small to neglect when reducing the data.
Temperature indicators on the main control panel needed only periodic inspection
for accuracy. The mercury vapor temperature was read on one indicator, and condens-
ing tube wall temperatures were read on a similar indicator by utilizing a selector
switch for rapid scanning. Other system temperatures, used mainly for system opera-
tion and control, were read out either on controllers or on the temperature oscillograph.
21
APPENDIX B
LOCAL PRESSURE GRADIENT FOR TAPERED TUBE
When an element of a tapered tube is considered (fig. 11), the sum of forces in theaxial direction is:
(P1 + P2 ) 1PIAt 1I 2 (At 1 - Ati 2 ) - P 2 At 2 g
X (wg, lUg, 1 - Wg, 2ug, 2 + Wliq, luliq, 1 - wliq, 2uliq, 2) + FTPF (B1)
where FTPF is the mean force due to friction within the element. Assuming a velocityratio of one (ug, 1 = uliq, 1' ug, 2 Uliq, 2) and simplifying yield
(i- P 2 )SAt~ 1 At, 2) I- [(w, 1, +wliq, )ug, 1 - (W g, 2 + Wliq, 2)ug, 2] + F TPF2 gc
(B2)
But
wT Wg + wliq
WgI and
PIAt' Ixi P2At' 2x2 At 1 + At, 2Figure 11. - Element of tapered tube. 2
Thus equation (B2) becomes
(P1 - P2)sAt =- (Ug, I ug, 2) + FTPF (B3)
If the density changes are assumed small within the increment, the change in velocities
becomes
22
Ug, Ug, 2 =1 ) (B4)
and
= Pg, 1 + Pg, 2
2
Substituting equation (B4) into equation (B3) and changing signs yield
- P 2 )Sxt =gi)+ FTpF (B5);5Cgc 2 Ag, 1
where
A- AtAg=
1-x Pg +1x Pliq
and FTPF is defined as
APTPF f AtdL
l1
Then solving for the two-phase frictional pressure gradient APTPF/AL results in
T/ x2 x
(P PXAT l_AL 1, 2f12 AtdL
where the subscripts 2 and 1 refer to points at one pressure tap and its preceding tap,respectively.
23

The Fanning equation was used to determine the frictional pressure gradient due to
gas alone. It is expressed as
Apg_ _ 4fpgg (B7)
\ AL / d2gc
where f is the friction factor for turbulent flow in a smooth tube and is expressed as
(see ref. 11)
f = 0. 046 (B8)
Reg 2
and
4 WTX
ug - 4wpTd2 (B9)
Substituting equations (B8) and (B9) into equation (B7) and integrating to obtain a meanfrictional pressure gradient from one pressure tap to the following pressure tap yield the
following result:
/APg 0.0 9 2 WT w2 12 2
0_ ( T2 A x~ Pge~dL (BlO)\~ ) ,1, 2 Re 0.2 dg 5
For small changes of Reynolds number and density between pressure taps the frictionalpressure gradient due to gas alone becomes
/APg 0.92w2 Z2/ ~2
(,AL '1, 2 /I e02A j d 5
9c 9 1
where
24

0.2 (Re0.2)+1 (Re0 2)2go 2
The preceding integral was evaluated by numerical integration every inch along the tubelength because the diameter and quality are now functions of length.
Equations (B6) and (Bl) were used to determine the ratio of the two-phase frictionalpressure gradient to the gas phase pressure gradient, where
(\ AL /I2(121l2 (B12)
1, 2
25

APPENDIX C
DETERMINATION OF QUALITY AS FUNCTION OF LENGTH FOR TAPERED TUBE
The quality at any point I along the condensing tube is related to the local heat fluxq by the following expression:
00 q7DdL (C)WT[hfg + Cp(Tsup - Tsad]
The heat flux at any point I along the tube is expressed as
q = hN2(Tw - TN2) (C2)
If the wall temperature and the coolant temperature are both assumed nearly constant
along the condensing tube length (small pressure changes), the average heat flux can be
expressed as
i= (Tw-TN2)hN (C3)
The cooling gas side heat-transfer coefficient is determined from Hilbert's equation for
gas flowing perpendicular to cylinders (ref. 11)
Nu=BRen ( 2 (C4)
where B and n are dimensionless constants depending on the value of Re. Assumingthat the mass velocity PN2 uN2 and 11N2 of the nitrogen coolant are constant along the
condensing tube yields22
h N2DNu = B'Dn N (C5)
kN2
26

where
B ' B= P 2 U---_2_
\ n/
Assuming kN constant and solving for hN giveN2 h2
h N B"Dn - B"Dn-1 (C6)N2 D
where
BT = kN2B,
Similarly, the average cooling side heat-transfer coefficient becomes
hN = B"Dn-1=B" fIc Dn-ldL (C7)
2 0o
From equation (C3) and (C7) the integrated heat flux can be expressed as
= (Tw - TN 2B" 1- J•1c Dn-ldL (C8)
Dividing equation (C6) by (07) yields
hN2 I cDn- 1-_ (09)
hN2 I c DJn- dL
and solving for hN givesh2
27
S LcDn-IhN2 = hN2 C (C 10)
of c Dn-1 dL
0
Placing equation (C3) into equation (C01) results in
h N qDn (Cli)2 f TN jcni'
0
The heat flux at any point along the tube is determined by equation (C2) and (ClI). Then
q = i (C12)
f c Dn-1 dL
The average heat flux can be expressed as
-= wTX0[hfg + Cp(Tsup - Tsat)•(C 13)
where
(Do + D)
2
Equating the average heat flux in equation (C13) to the integrated heat flux defined inequation (C8) and then substituting equation (C13) into (C12) yield the following expres-sion for local heat flux:
28

q = WTXo[hfg + Cp(Tsup - Tsat)]Dn-1 (C14)
iDfJ DnP- dL
The quality can be expressed as a function of the diameter by placing (C14) into equa-tion (Cl) and simplifying:
Jf Dn-ID dL
x =x 0 - x0 (C15)J Dn- 1 dL
0
or
x= XO( 1 Il ) (C016)iY f-0Dn-dL .
0
where the diameter varies linearly along the tube
D = C 1 + C 2 L (C17)
Then the quality is expressed as a function of length:fi N
]0 (C1 + C 2L)ndLx = x0 1 (C018)
) ?Jc (C1 + C2 L)n-1 dL
0
Since from the table of integrals
(a + bx)c - (a + bx)c+l
(c + 1)b
29
then
(C I + C2L )n+1l
= (n + 1)C2 J0xx0 1- (C19)
D ( c 1 + C 2 L ) n C L
nC 2 JWhen the limits of integration are inserted, equation (C19) is expressed as
[(= ,I)n+l -C(20)CI +n2 +1 + C2 e)n -C1
nC 2
where
C1 = Do
C2 -(Do - D) (C21)le
5 (Do + D)
2
Substituting equation (C21) into (C20) yields the following
2n 0 - (Do - De) ]l e
x 1 -e (C22)
(n+ 1) [ - (Do- De) - D (Do+ Dd)
30
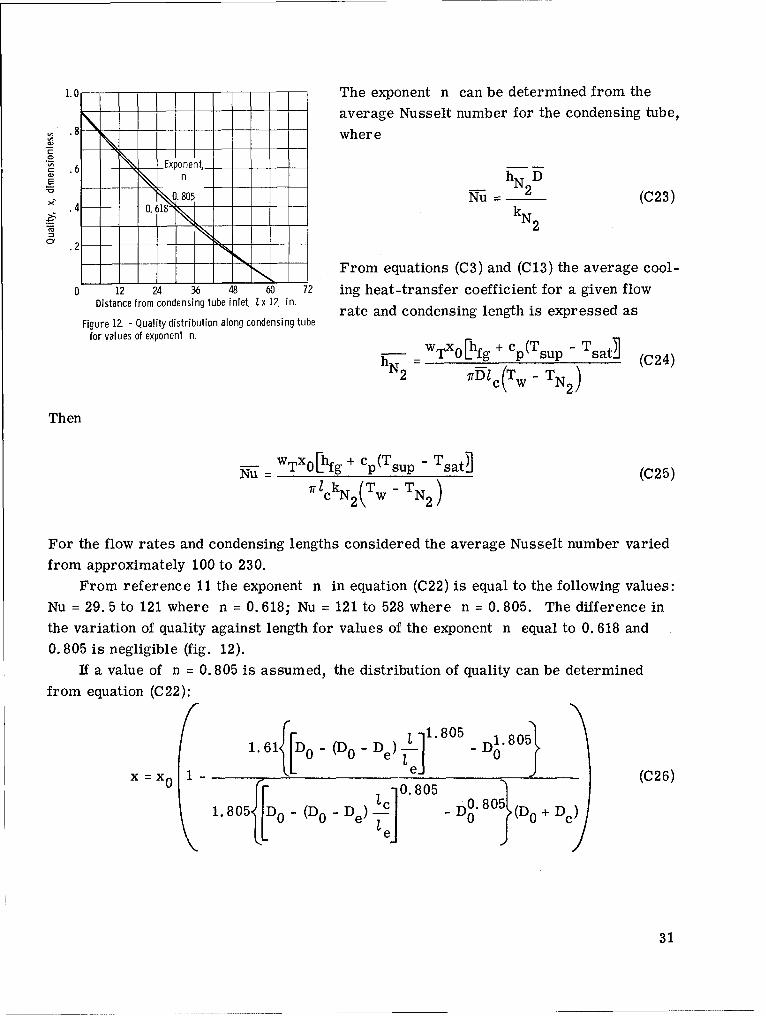
1.0 The exponent n can be determined from the-- average Nusselt number for the condensing tube,
where
. 6 E x p o n e n t _ h N 2 D
""0.805 2u k (C23)-'1 .4 0.618-• kN2
2C:Y .2
S -From equations (C3) and (C13) the average cool-
0 12 24 36 t8 60 72 ing heat-transfer coefficient for a given flowDistance from condensing tube inlet, I x 12, in. rate and condensing length is expressed as
Figure 12 - Quality distribution along condensing tubefor values of exponent n. =wTx0[hfg , p(Tsup - Tsad
hN2 TDlc(Tw - TN2 ) (C24)
Then
w XFhf g+ C T -T= T0g c p(Tsup Tsatd (C25)
7 ckN2 (Tw - TN2 )
For the flow rates and condensing lengths considered the average Nusselt number varied
from approximately 100 to 230.From reference 11 the exponent n in equation (C22) is equal to the following values:
Nu = 29. 5 to 121 where n =0. 618; Nu = 121 to 528 where n = 0.805. The difference inthe variation of quality against length for values of the exponent n equal to 0. 618 and
0.805 is negligible (fig. 12).If a value of n = 0. 805 is assumed, the distribution of quality can be determined
from equation (C22):
1. 61 [O - (Do - De) - D1 805(
x =x 0 1- -[1 e- ( 026)
1.805f - (D0 - De) c" - DO. 80 (D0 + Dc)
31

APPENDIX D
DETERMINATION OF CONDENSER INLET QUALITY
Determination of inlet quality requires measurement of inlet vapor flow rate andtotal flow rate. The total flow rate was determined from the pressure drop AP 2 acrossa calibrated orifice at the preheater inlet. Vapor flow rate at the condenser inlet wasmeasured by means of a venturi meter. Such measurements, however, involve determin-
ing the contribution of liquid carryover to the measurement. An investigation of theamount of liquid content that significantly affects pressure readings was made by Murdock(ref. 9). He derived expressions (based on experimental data) for total flow rate andtwo-phase pressure drop through an orifice meter. The total flow through an orificemeter is given by the expression
WT = KgYgAth 2c APTPPg (DI)
x+ 1.26(1 - X)KgYg Pg
Kliq Pliq
where
Ath cross-sectional area of throat, sq ft
K flow coefficient, dimensionless
Y net expansion factor, dimensionless
Because of the low values of vapor-to-liquid-density ratios for mercury (3V10- 4 ), thesecond term of the denominator can be neglected for the high inlet qualities considered(85 percent and above). Equation (D1) when solved for inlet quality becomes
x= KgYgAth ýF2gc APTPPg (D2)
wT
In a like manner the relation between %fA-g and V--PTp becomes (see ref. 9)
VA_--PT P
l--g 1.26KgYg(1 - x) Pg (D3)
xKliq Yliq
32

For qualities 85 percent or above the two-phase pressure drop is equal to the one-phase
pressure drop because of the low value of the vapor-to-liquid-density ratio for mercury.
Then equation (D3) reduces to
APg = APTp (D4)
Thus, the influence of liquid carryover on the measured pressure drop was small and
can be neglected. The inlet quality can then be expressed as
x= Kg YgAth V2gc APgpg (D5)wT
where the numerator of equation (D5) is the standard equation for calculating the vaporflow rate through a venturi (ref. 12). If steady flow through the boiler is assumed, the
inlet quality can be expressed as the ratio of the vapor flow rate out of the boiler (meas-ured by the venturi) to the total liquid flow rate into the boiler. Previous boiler per-
formance tests indicated no liquid holdup in the boiler. Then
x0 = -- (D6)WT
It is assumed that the liquid droplets in the venturi do not vaporize because of the
small pressure drop through the venturi (2 to 3 psi), short residence time, and high sur-
face tension of the liquid droplets.
33

REFERENCES
1. Albers, James A.; and Macosko, Robert P.: Experimental Pressure-Drop Investi-
gation of Nonwetting, Condensing Flow of Mercury Vapor in a Constant-Diameter
Tube in 1-G and Zero-Gravity Environments. NASA TN D-2838, 1965.
2. Lockhart, R.W. ; and Martinelli, R. C. : Proposed Correlation of Data for IsothermalTwo-Phase, Two-Component Flow in Pipes. Chem. Eng. Prog., vol. 45, no. 1,1949, pp. 39-48.
3. Koestel, Alfred; Gutstein, Martin U.; and Wainwright, Robert T.: Study of Wetting
and Nonwetting Mercury Condensing Pressure Drops. NASA TN D-2514, 1964.
4. Hays, L.: Investigation of Condensers Applicable to Space Power Systems. Pt. 1.Direct Condensers. NASA CR-51397, 1962.
5. Kiraly, R.J.; and Koestel, A.: The SNAP-II Power Conversion System Topical
Report No. 8. Mercury Condensing Research Studies. Rept. No. ER-4442,
Thompson Ramo Wooldridge, Inc., May 31, 1961.
6. Jaenke, C.T.; Koestel, A.; and Reitz, J.G.: The SNAP-II Power Conversion Sys-tem Topical Report No. 13. Orbital Force Field Boiling and Condensing Experi-
ments (Offbace). Rept. No. ER-4670, Thompson Ramo Wooldridge, Inc., Oct.
1962.
7. Jakob, Max: Heat Transfer in Evaporation and Condensation, II. Mech. Eng., vol.
58, no. 11, Nov. 1936, pp. 729-739.
8. Kutateladze, S.S. (S. J. Rimshaw, trans.): Heat Transfer in Condensation and Boil-
ing. Rept. No. TR-3770, AEC, 1952, pp. 53-60.
9. Murdock, J.W. : Two-Phase Flow Measurement with Orifices. J. Basic Eng.(ASME Trans.), ser. D, vol. 84, no. 2, Dec. 1962, pp. 419-433.
10. Weatherford, W.D., Jr.; Tyler, J.C.; and Ku, P.M. : Properties of InorganicEnergy-Conversion and Heat-Transfer Fluids for Space Applications. Rept. No.
TR 61-96, WADD, Nov. 1961.
11. McAdams, W.H.: Heat Transmission. Third ed., McGraw-Hill Book Co., Inc.,
1954.
12. Anon.: Power Test Codes - Instruments and Apparatus. ASME, 1959, pt. S, ch. 4.
34
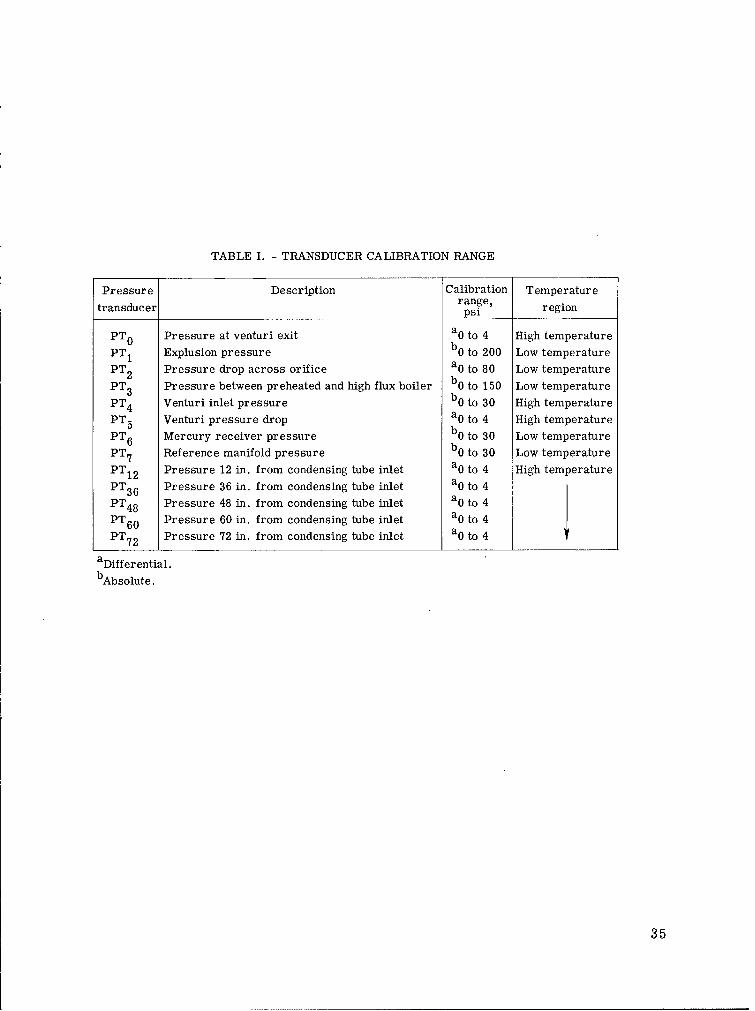
TABLE I. - TRANSDUCER CALIBRATION RANGE
Pressure Description Calibration Temperaturetransducer range,psi region
PT 0 Pressure at venturi exit a 0 to 4 High temperature
PT 1 Explusion pressure b 0 to 200 Low temperature
PT 2 Pressure drop across orifice a 0 to 80 Low temperature
PT3 Pressure between preheated and high flux boiler b 0 to 150 Low temperature
PT 4 Venturi inlet pressure b 0 to 30 High temperature
PT 5 Venturi pressure drop a 0 to 4 High temperature
PT 6 Mercury receiver pressure b 0 to 30 Low temperature
PT 7 Reference manifold pressure b 0 to 30 Low temperature
PT 1 2 Pressure 12 in. from condensing tube inlet a0 to 4 High temperature
PT 3 6 Pressure 36 in. from condensing tube inlet a0 to 4
PT 4 8 Pressure 48 in. from condensing tube inlet a0 to 4
PT 6 0 Pressure 60 in. from condensing tube inlet a 0 to 4
PT 7 2 Pressure 72 in. from condensing tube inlet a0 to 4
a Differential.
bAbsolute.
35

TABLE I1. - EXPERIMENTAL DATA
Gravity Point Condensing Liquid mass Vapor mass Inlet Static pressure, PS/144, psia
level, identifi- length, flow rate, flow rate, quality, bg's cation c x 12, Wliql Wg1 0 P 1 2 P3 6 P4 8 P6 0 P 7 2 Temperature
in. at condensinglb/sec lb/sec tube inlet,
TOP
(a) OF
1 1 51 0.0418 0.0386 0.92 19.29 18.54 18.50 18.80 19.70 19.50 1020
0 1A 51 .0488 .0442 .91 18.96 18.10 18.33 18.85 19.10 18.80 1040
1 2 51 .0415 .0372 .90 16.50 15.80 15.95 16.70 17.25 17.15 1040
0 2A 51 .0469 .0418 .89 16.60 16.05 16.10 16.90 16.65 16.35 10500 3A 41 .0426 .0357 .84 15.74 15.53 15.73 16.43 16.48 16.37 1070
1 4 43 .0396 .0361 .91 15.69 15.52 15.62 16.18 16.73 16.53 1060
0 4A 41 .0400 .0352 .88 15.67 15.45 15.55 16.25 16.45 16.25 1050
1 5 47 .0417 .0367 .88 15.73 15.48 15.33 15.78 16.69 16.50 1050
1 6 57 .0417 .0376 .90 15.30 14.94 14.54 14.67 15.28 16.16 1050
1 7 63 .0386 .0365 .94 16.10 15.58 15.21 15.11 15.68 16.65 1020
0 7A 63 .0423 .0360 .85 16.24 15.73 15.43 15.43 16.07 16.48 1040
1 8 59 .0404 .0371 .92 16.77 16.31 15.90 15.67 16.30 17.25 1060
0 8A 61 .0405 .0365 .90 16.77 16.20 15.78 15.58 16.20 17.00 1060
1 9 53 .0386 .0350 .91 15.19 14.93 14.63 14.73 16.18 15.98 10700 9A 53 .0414 .0370 .89 15.61 15.16 14.94 15.04 16.18 15.98 1080
1 10 49 .0399 .0360 .90 14.97 14.79 14.68 14.91 16.08 15.88 1070
0 10A 45 .0408 .0367 .90 15.36 15.00 14.95 15.25 16.20 16.00 10801 11 42 .0396 .0360 .91 14.53 14.38 14.76 15.43 15.88 15.78 1080
0 11A 41 .0407 .0362 .89 15.08 14.75 15.06 15.72 15.95 15.75 1080
1 12 37 .0398 .0362 .91 16.15 16.05 16.40 16.82 17.00 16.80 1080
0 12A 41 .0413 .0367 .89 15.53 15.15 15.43 16.13 16.36 16.16 1080
1 13 43 .0385 .0351 .91 15.48 15.10 15.20 16.00 16.60 16.40 1080
0 13A 45 .0402 .0366 .91 15.40 15.00 14.90 15.10 16.05 15.85 1080
1 14 65 .0291 .0272 .94 18.23 18.10 17.75 17.70 17.93 18.42 10100 14A 65 .0280 .0280 1.00 18.85 18.68 18.23 18.26 18.80 18.85 1020
1 15 69 .0299 .0260 .87 17.43 17.44 17.08 16.85 17.20 17.70 10200 15A 69 .0288 .0288 1.00 18.95 18.62 18.17 18.08 18.37 18.84 1030
1 16 55 .0300 .0263 .88 17.77 17.64 17.40 17.51 17.88 18.04 1020
0 16A 55 .0290 .0265 .91 19.02 18.85 18.47 18.64 19.00 19.05 10301 17 49 .0300 .0267 .89 18.79 18.71 18.55 18.90 18.96 18.93 1020
0 17A 49 .0290 .0260 .90 19.70 19.57 19.37 19.72 19.77 19.87 1040
1 18 43 .0300 .0261 .87 18.30 18.25 18.18 18.46 18.50 18.69 10400 18A 43 .0294 .0265 .90 19.97 19.81 19.58 19.96 19.93 19.97 10401 19 45 .0300 .0268 .89 19.44 19.31 19.22 19.53 19.68 19.85 1020
0 19A 45 .0296 .0266 .90 20.19 19.98 19.90 20.21 20.15 20.18 1040
aNumber designates trajectory; A, middle portion of trajectory; B, late portion of trajectory.bcorrected.
36

TABLE If. - Continued. EXPERIMENTAL DATA
Gravity Point Condensing Liquid mass Vapor mass inlet Static pressure, PS/1 4 4
, psia
level, identifi- length, flow rate, flow rate, quality,
g's cation 1
c x 12, Wliq, Wg, x0 bP0 P12 P 3 6 P 4 8 P 6 0 P 7 2 Temperature
in. lb/sec lb/sec at condensing
tube inlet,TO,
(a) OF
1 20 39 0.0300 0.0270 0.90 18.78 18.70 18.65 18.83 18.78 18.85 1020
0 20A 37 .0291 .0252 .87 20. 19 20.07 19.92 20.17 20.10 20.18 1040
1 21 41 .0300 .0273 .91 20.17 19.59 19.49 19.65 19.60 19.71 1020
0 21A 43 .0293 .0266 .91 20. 53 20.48 20.21 20.53 20.51 20.54 1040
1 22 63 .0514 .0464 .90 21.68 21.20 20.49 20.35 21.02 22.35 1040
0 22A 64 .0504 .0452 .90 22.20 21.78 20.99 20.89 21.68 22.68 1060
1 23 67 .0501 .0454 .91 22.80 22.18 21.42 21.19 21.78 23.16 1090
0 23A 71 .0507 .0456 .90 20.81 20.16 19.26 18.95 19.54 21.08 1100
1 24 55 .0500 .0455 .91 19.43 19.05 18.65 18.83 20.41 20.29 1030
0 24A 55 .0513 .0462 .90 19.51 18.91 18.51 18.79 20.03 19.94 1040
1 25 51 .0506 .0463 .92 20.88 20.58 20.42 21.47 20.72 20.52 1020
1 26 65 .0408 .0375 .92 16.04 15.67 15.02 14.70 15.30 16.59 955
0 26A 71 .0387 .0377 .97 16.51 16.08 15.54 15.15 15.68 16.82 1000
0 26B 71 .0389 .0404 1.00 16.67 16.05 15.21 14.90 15.42 16.72 1000
1 27 71 .0394 .0376 .95 16.22 15.90 15.00 14.62 15.00 16.70 1030
1 28 61 .0410 .0389 .94 15.20 14.75 14.10 13.80 14.45 15.95 1040
0 28A 61 .0394 .0375 .95 15.75 15.40 14.70 14.60 15.60 16.20 1040
0 28B 61 .0396 .0372 .94 15.99 15.53 14.81 14.63 15.40 16.24 1040
1 29 57 .0414 .0376 .91 15.86 15.70 15.02 15.02 lb. 03 16.05 1010
0 29A 57 .0402 .0380 .94 15.50 15.20 14.45 14.38 15.80 15.13 1020
0 29B 57 .0402 .0379 .97 15.60 15.18 14.55 14.48 15.90 15.83 1040
1 30 51 .0402 .0372 .93 15.53 15.40 14.97 15.16 16.26 16.26 1030
0 30A 51 .0410 .0373 .91 15.81 15.44 15.09 15.31 16.42 16.40 1040
0 30B 51 .0410 .0377 .92 15.58 15.30 14.90 15.13 16.13 16.08 1040
1 31 63 .0405 .0373 .92 15.73 15.53 14.75 14.44 15.08 16.46 1040
0 31 63 .0405 .0364 .90 16.06 15.55 14.80 14.45 14.85 16.25 1040
1 32 63 .0305 .0274 .90 12.81 12.58 12.23 12.08 12.58 13.06 1000
0 32 61 .0300 .0282 .94 13.54 13.10 12.80 12.65 13.15 13.57 1020
1 33 55 .0305 .0263 .87 13.53 13.30 13.10 13.10 13.70 13.70 1020
0 33 55 .0308 .0278 .90 13.78 13.41 13.08 13.20 14.02 13.82 1030
1 34 51 .0305 .0265 .87 12.44 12.22 12.15 12.18 13.20 13.05 1030
0 34 51 .0301 .0270 .90 13.88 13.63 13.53 13.53 14.28 14.08 1040
1 35 43 .0312 .0276 .88 12.85 12.75 12.73 12.93 13.47 13.35 1010
0 35 44 .0311 .0270 .87 13.84 13.50 13.58 13.92 14.12 14.10 1020
1 36 41 .0316 .0282 .89 12.64 12.51 12.67 12.84 13.28 13.13 980
aNumber designates trajectory; A, middle portion of trajectory; B, late portion of trajectory.
bCorrected.
37
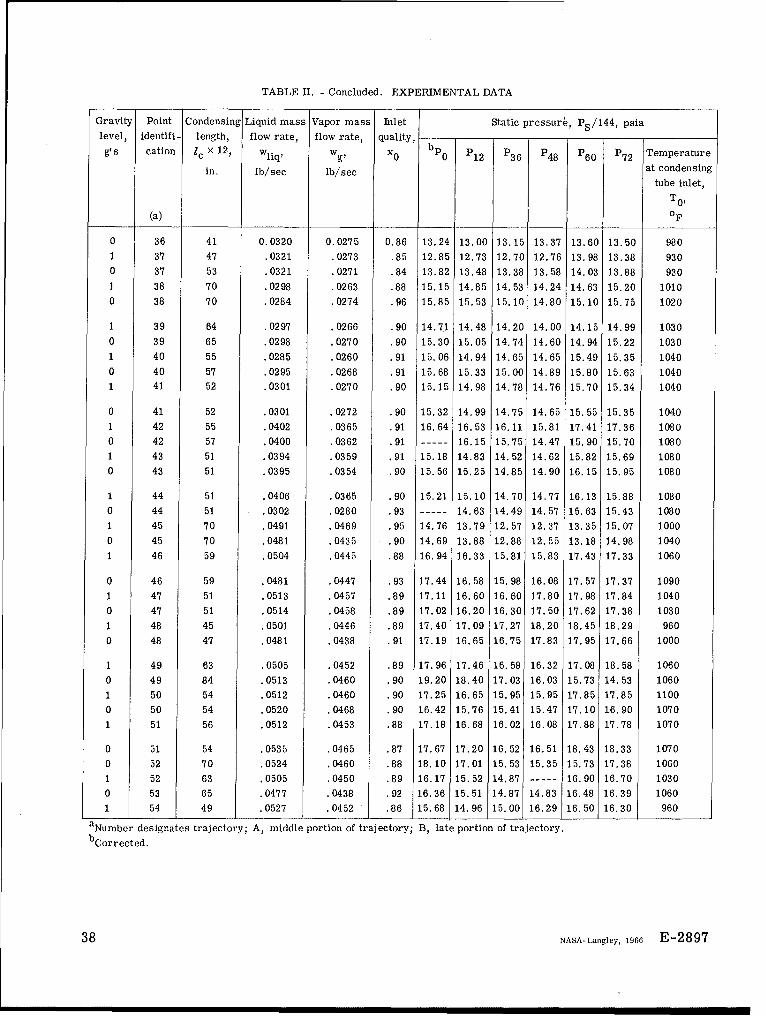
TABLE II. - Concluded. EXPERIMENTAL DATA
Gravity Point Condensing Liquid mass Vapor mass Inlet Static pressure, PS/14 4
, psia
level, identifi- length, flow rate, flow rate, quality,
g's cation 'c × 12, Wliq, Wg, x0 bP0 P12 P36 P48 P60 P72 Temperature
in. lb/sec lb/sec at condensing
tube inlet,To,
(a) oF
0 36 41 0.0320 0.0275 0.86 13.24 13.00 13.15 13.37 13.60 13.50 980
1 37 47 .0321 .0273 .85 12.85 12.73 12.70 12.76 13.98 13.38 930
0 37 53 .0321 .0271 .84 13.82 13.48 13.38 13.58 14.03 13.88 930
1 38 70 .0298 .0263 .88 15.15 14.85 14.53 14.24 14.63 15.20 1010
0 38 70 .0284 .0274 .96 15.85 15.53 15.10 14.80 15.10 15.75 1020
1 39 64 .0297 .0266 .90 14.7.1 14.48 14.20 14.00 14.15 14.99 1030
0 39 65 .0298 .0270 .90 15.30 15.05 14.74 14.60 14.94 15.22 1030
1 40 55 .0285 .0260 .91 15.06 14.94 14.65 14.65 15.49 15.35 1040
0 40 57 .0295 .0268 .91 15.68 15.33 15.00 14.89 15.80 15.63 1040
1 41 52 .0301 .0270 .90 15.15 14.98 14.78 14.76 15.70 15.34 1040
0 41 52 .0301 .0272 .90 15.32 14.99 14.75 14.65 15.55 15.35 1040
1 42 55 .0402 .0365 .91 16.64 16.53 16.11 15.81 17.41 17.36 1080
0 42 57 .0400 .0362 .91 16.15 15.75 14.47 15.90 15.70 1080
1 43 51 .0394 .0359 .91 15.18 14.83 14.52 14.62 15.82 15.69 1080
0 43 51 .0395 .0354 .90 15.56 15.25 14.85 14.90 16.15 15.95 1080
1 44 51 .0406 .0365 .90 15.21 15.10 14.70 14.77 16.13 15.88 1080
0 44 51 .0302 .0280 .93 14.63 14.49 14.57 15.63 15.43 1080
1 45 70 .0491 .0469 .95 14.76 13.79 12.57 12.37 13.35 15.07 1000
0 45 70 .0481 .0435 .90 14.69 13.88 12.88 12.55 13.18 14.98 1040
1 46 59 .0504 .0445 .88 16.94 16.33 15.81 15.83 17.43 17.33 1060
0 46 59 .0481 .0447 .93 17.44 16.58 15.98 16.08 17.57 17.37 1090
1 47 51 .0513 .0457 .89 17.11 16.60 16.60 17.80 17.98 17.84 1040
0 47 51 .0514 .0458 .89 17.02 16.20 16.30 17.50 17.62 17.38 1030
1 48 45 .0501 .0446 .89 17.40 17.09 17.27 18.20 18.45 18.29 960
0 48 47 .0481 .0438 .91 17.19 16.65 16.75 17.83 17.95 17.66 1000
1 49 63 .0505 .0452 .89 17.96 17.46 16.58 16.32 17.08 18.58 1060
0 49 84 .0513 .0460 .90 19.20 18.40 17.03 16.03 15.73 14.53 1060
1 50 54 .0512 .0460 .90 17.25 16.65 15.95 15.95 17.85 17.85 1100
0 50 54 .0520 .0468 .90 16.42 15.76 15.41 15.47 17.10 16.90 1070
1 51 56 .0512 .0453 .88 17.18 16.68 16.02 16.08 17.88 17.78 1070
0 51 54 .0535 .0465 .87 17.67 17.20 16.52 16.51 18.43 18.33 1070
0 52 70 .0524 .0460 .88 18.10 17.01 15.53 15.35 15.73 17.38 1060
1 52 63 .0505 .0450 .89 16.17 15.52 14.87 ------ 16.90 16.70 1030
0 53 65 .0477 .0438 .92 16.36 15.51 14.87 14.83 16.48 16.39 1060
1 54 49 .0527 .0452 .86 15.68 14.96 15.00 16.29 16.50 16.30 960
aNumber designates trajectory; A, middle portion of trajectory; B, late portion of trajectory.
bCorrected.
38 NASA-Langley, 1966 E-2897

"the a r•;ullah a ac (/ru us/h cli uS the ited,:(• States shall be;uldacted .O a.1 i( eou/i/F illb . . . fL the i X/l.lcani of e human /1 n,'uw -
ige of I', '.1i ) r : 211' 1 (2 ,/hs am i t) c 4 /acw . The Adl ;iiui iratio11,! r t : .fr/ //5 w ,s !.:t~ti '/aii/; / e eial
(1/ ii rovi, I ? iul 'f t zvidc211 Pt ;cttc, i- 1 l , t/111t( i
NA i' ,A j iE(INA.'\11' ý ANaD S IA( Ac 211 Ow 1958
NASA SCIENTIFIC AND TECHNICAL PUBLICATIONS
TEC HNICAL REPORTS: Scientific and technical information consideredimportant, complete, and a lasting contribution to existing knowledge.
"TECHNIC(AL NOIES: Information less broad in scope but neverthelessof importance as a contributih1 to existing knotwledge.
TECHNICAL MEMORANDUMS: Information receiving limited distri-bution because of preliminary data, securiy classification, or other reasons.
CONTRACTOR REPORTS: Technical information generated in con-nection with a NASA contract or grant and released under NASA auspices.
TECHNICAL TRANSLATlONS: Itnfornmation published in a foreignlanguage considered to merit: NASA distribution in English.
'ITECIINICAL REPRINIS: Information derived from NASA activitiesamd initially published in the form of Journal articles.
SPECIAL PUBLICATIONS: Information derived from or of valute toNASA activities bUt not necessarily reporting the results of individualNASA-programmed scientific efforts. Publications include conferenceproceedings, monograplls, data compilations, hatizlbooks, sourcebiooks,mid special bibliographics.
Details on the availability of tihese publications may be obtainedi frain:
SCIENTIFIC AND TECHNICAL INFORMATION DIVISION
NATIONAL AERONAUTICS AND SPACE ADMINISTRATION
"9/!Olislgton, .C, 20546