national transit database (mb) and trolleybus (tb). table 43.03. ready-to-use sampling plans for bus...
TRANSCRIPT

NATIONAL TRANSIT DATABASE
SAMPLING MANUAL U.S. Department of Transportation Federal Transit Administration March 31, 2009
TABLE OF CONTENTS
SECTION 10 – GENERAL DIRECTIONS ............................................................................... 2 SECTION 40 – READY-TO-USE SAMPLING PLANS ........................................................... 3 Subsection 41 – General Directions ............................................................................................... 3 Subsection 43 – Sampling Plans .................................................................................................... 4 SECTION 50 – TEMPLATE SAMPLING PLANS ................................................................... 7 Subsection 51 – General Directions ............................................................................................... 7 Subsection 52 – Options ................................................................................................................ 7 Subsection 53 – Input Data .......................................................................................................... 10 Subsection 54 – Usage ................................................................................................................ 12 Subsection 55 – Selecting a Sampling Plan ................................................................................. 12 Subsection 56 – Revision ............................................................................................................ 14 Subsection 57 – Certification ...................................................................................................... 18 SECTION 60 – DATA COLLECTION.................................................................................... 19 Subsection 61 – General Directions ............................................................................................. 19 Subsection 63 – Selecting a Sample at Random ........................................................................... 19 Subsection 65 – Collecting Data from the Random Sample ......................................................... 22 Subsection 67 – Correcting Errors in the Raw Sample Data......................................................... 28 SECTION 70 – ESTIMATION WITHOUT 100% UPT ......................................................... 34 Subsection 71 – General Directions ............................................................................................. 34 Subsection 73 – Non-Scheduled Services .................................................................................... 35 Subsection 75 – Rail Services...................................................................................................... 36 Subsection 77 – Bus Services ...................................................................................................... 38 Subsection 79 – Estimating Service-Consumed Data ................................................................... 39 SECTION 80 – ESTIMATION WITH 100% UPT ................................................................. 41 Subsection 81 – General Directions ............................................................................................. 41 Subsection 83 – APTL Option ..................................................................................................... 42 Subsection 85 – PPMT Option .................................................................................................... 44 SECTION 90 – APPENDIXES ................................................................................................. 47 Appendix 91 – Definitions .......................................................................................................... 47 Appendix 92 – Distance-Based Survey Sheet .............................................................................. 54 Appendix 93 – Load-Based Survey Sheet for Demand Response ................................................. 57 Appendix 94 – Load-Based Survey Sheet for Commuter Vanpool ............................................... 59 Appendix 95 – Load-Based Survey Sheet for Fixed-Route Service .............................................. 62 Appendix 96 – Daily Log Sheet for Commuter Vanpool ............................................................. 64 Appendix 97 – Full Table of Contents ......................................................................................... 65 Appendix 98 – Table of Random Numbers .................................................................................. 69
2
SECTION 10 – GENERAL DIRECTIONS § 10.01 What is the purpose of this Sampling Manual?
(a) It suggests procedures for obtaining annual data on unlinked passenger trips (UPT) and passenger miles traveled (PMT) for the National Transit Database (NTD) through random sampling according to the requirements in the NTD Reporting Manual.
(b) In the event of a conflict between the requirements in the Reporting Manual and this Sampling Manual, the requirements of the Reporting Manual are definitive.
(c) When it is possible to obtain annual UPT and PMT data according to the requirements in the Reporting Manual by using other methods not specified in this Sampling Manual, then you may do so.
§ 10.03 What procedures does this Sampling Manual cover?
(a) Development of sampling plans with two options: (1) Section 40 on ready-to-use sampling plans. (2) Section 50 on agency-developed sampling plans with agency sample data.
(b) Collection of sample data in Section 60. (c) Estimation of annual service-consumed data with two options:
(1) Both UPT and PMT if you do not report 100% counts of UPT. (2) PMT if you report 100% counts of UPT.
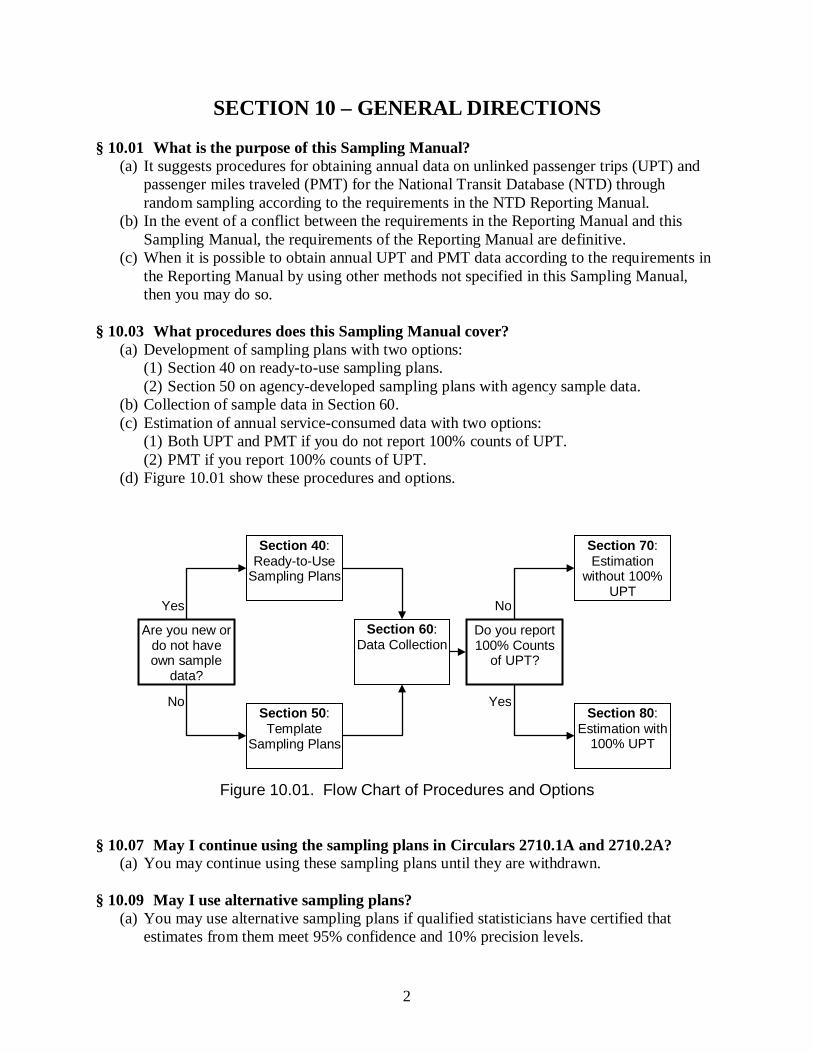
(d) Figure 10.01 show these procedures and options.
Figure 10.01. Flow Chart of Procedures and Options § 10.07 May I continue using the sampling plans in Circulars 2710.1A and 2710.2A?
(a) You may continue using these sampling plans until they are withdrawn. § 10.09 May I use alternative sampling plans?
(a) You may use alternative sampling plans if qualified statisticians have certified that estimates from them meet 95% confidence and 10% precision levels.
Are you new or do not have own sample
data?
Section 40: Ready-to-Use
Sampling Plans
Section 50: Template
Sampling Plans
Section 60: Data Collection
Do you report 100% Counts
of UPT?
Section 70: Estimation
without 100% UPT
Section 80: Estimation with
100% UPT
Yes
No Yes
No

3
SECTION 40 – READY-TO-USE SAMPLING PLANS
Subsection 41 – General Directions § 41.01 Under what conditions may I use ready-to-use sampling plans?
(a) New Mode – If you will be sampling and reporting for the first time this current report year for a particular mode that you do not already operate. For example, you would meet this condition if you will add light rail (LR) service this year, but you have not operated this service previously, or
(b) New Type of Service – If you will be sampling and reporting this current report year for a particular type of service for the first time. For example, you would meet this condition if you previously directly operated all of your motorbus (MB) service, but will contract out part or all of that service to a private entity for this year, or
(c) No Sample Data – If you have reported your service to the NTD before through random sampling, but no longer have the original raw sample data.
§ 41.03 If I am using a ready-to-use sampling plan this year, may I use it again for my next
report year? (a) You should not use it again if your next report year is your mandatory sampling year.
After you have collected the sample data from this year, you should develop a template sampling plan with that sample data for your next report year.
(b) You may use it again for the next report year if that year is not a mandatory sampling year.
§ 41.05 For what modes are ready-to-use sampling plans available?
(a) For non-scheduled services, they are available for demand responsive (DR) and commuter vanpool. You should not use the ready-to-use sampling plans for commuter vanpool if your vanpool service does not serve commuters exclusively.
(b) For scheduled services, they are available for bus services (motorbus (MB) and trolleybus (TB)), commuter rail (CR), and other rail modes.
§ 41.07 What sampling options are available?
(a) The available sampling options vary in: (1) the unit of sampling and measurement, (2) efficiency options, and (3) sampling frequency.
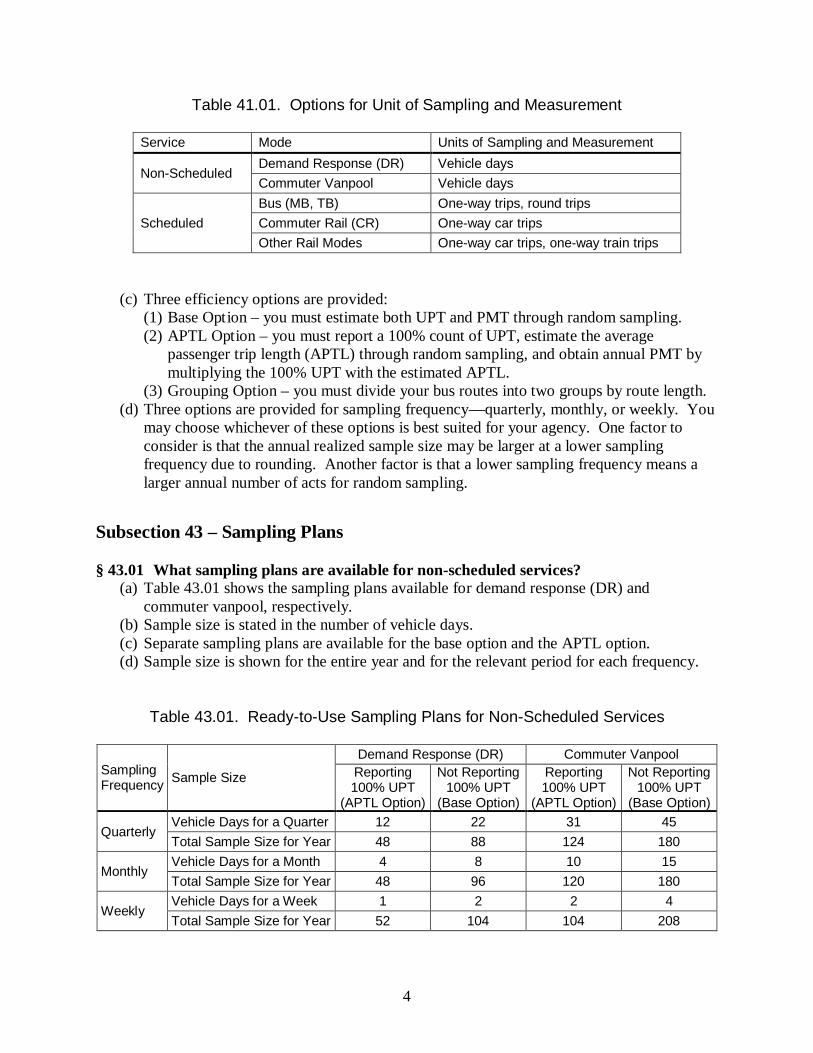
(b) The particular unit of sampling and measurement used in these ready-to-use sampling plans varies by mode and whether the service is scheduled (Table 41.01). (1) For non-scheduled services, the unit is in vehicle days. (2) For bus services (MB and TB), separate sampling plans are available with units in
one-way trips and in round trips. (3) For commuter rail, the unit is in one-way car trips. (4) For other rail modes, separate sampling plans are available in units of one-way car
trips and one-way train trips.
4
Table 41.01. Options for Unit of Sampling and Measurement
Service Mode Units of Sampling and Measurement
Non-Scheduled Demand Response (DR) Vehicle days Commuter Vanpool Vehicle days
Scheduled Bus (MB, TB) One-way trips, round trips Commuter Rail (CR) One-way car trips Other Rail Modes One-way car trips, one-way train trips
(c) Three efficiency options are provided: (1) Base Option – you must estimate both UPT and PMT through random sampling. (2) APTL Option – you must report a 100% count of UPT, estimate the average
passenger trip length (APTL) through random sampling, and obtain annual PMT by multiplying the 100% UPT with the estimated APTL.
(3) Grouping Option – you must divide your bus routes into two groups by route length. (d) Three options are provided for sampling frequency—quarterly, monthly, or weekly. You
may choose whichever of these options is best suited for your agency. One factor to consider is that the annual realized sample size may be larger at a lower sampling frequency due to rounding. Another factor is that a lower sampling frequency means a larger annual number of acts for random sampling.
Subsection 43 – Sampling Plans § 43.01 What sampling plans are available for non-scheduled services?
(a) Table 43.01 shows the sampling plans available for demand response (DR) and commuter vanpool, respectively.
(b) Sample size is stated in the number of vehicle days. (c) Separate sampling plans are available for the base option and the APTL option. (d) Sample size is shown for the entire year and for the relevant period for each frequency.
Table 43.01. Ready-to-Use Sampling Plans for Non-Scheduled Services
Sampling Frequency Sample Size
Demand Response (DR) Commuter Vanpool Reporting 100% UPT
(APTL Option)
Not Reporting 100% UPT
(Base Option)
Reporting 100% UPT
(APTL Option)
Not Reporting 100% UPT
(Base Option)
Quarterly Vehicle Days for a Quarter 12 22 31 45 Total Sample Size for Year 48 88 124 180
Monthly Vehicle Days for a Month 4 8 10 15 Total Sample Size for Year 48 96 120 180
Weekly Vehicle Days for a Week 1 2 2 4 Total Sample Size for Year 52 104 104 208

5
§ 43.03 What ready-to-use sampling plans are available for bus services?
(a) Table 43.03 shows the available ready-to-use sampling plans for bus services, including motorbus (MB) and trolleybus (TB).
Table 43.03. Ready-to-Use Sampling Plans for Bus (MB and TB) Services
Sampling Frequency
Sample Size for Period and Year
One-Way Trips Round Trips Reporting 100% UPT
(APTL Option) Not
Reporting 100% UPT
(Base Option)
Reporting 100% UPT (APTL Option)
Not Reporting 100% UPT
(Base Option)
With Route Grouping
Without Route
Grouping
With Route Grouping
Without Route
Grouping (1) (2) (3) (4) (5) (6)
Quarterly Trips for a Quarter 52 78 138 39 59 103 Total Sample Size for Year 208 312 552 156 236 412
Monthly Trips for a Month 18 27 46 13 20 35 Total Sample Size for Year 216 324 552 156 240 420
Weekly Trips for a Week 4 6 11 3 5 8 Total Sample Size for Year 208 312 572 156 260 416
(b) Sampling plans are provided separately for one-way trips and round trips. (c) The number of one-way trips in a sampling plan based on round trips is about 50%
greater than the number of one-way trips in a sampling plan based on one-way trips. A sampling plan based on round trips requires a larger number of one-way trips because the pair of one-way trips making up a round trip are not selected randomly or independently.
(d) If you choose the base option: (1) use column (3) to find the sample size in one-way trips, and (2) use column (6) to find the sample size in round trips.
(e) If you choose the APTL option, you may choose one of two options: (1) With Route Grouping – Use column (1) to find the sample size in one-way trips and
column (4) to find the sample size in round trips. In using this option, you must divide your routes into two groups on the basis of route length and do sampling and estimation separately for each group. For example, if you operate 10 routes, put the 5 routes with the shortest route distances in the group of short routes and the other 5 routes in the group of long routes.
(2) Without Route Grouping - If you prefer not to deal with grouping your routes, use column (2) to find the sample size in one-way trips and use column (5) to find the sample size in round trips.
§ 43.05 How does grouping of my bus routes affect sampling and estimation procedures?
(a) You must do your sampling and estimation separately for individual route groups. For details, refer to: (1) Subsection 63 on sampling. (2) Subsection 83 on estimation.

6
§ 43.07 What sampling plans are available for commuter rail?
(a) Table 43.05 shows the available ready-to-use sampling plans for commuter rail (CR). (b) Sample size is in one-way car trips. (c) Separate sampling plans are available for the base option and the APTL option.
Table 43.05. Ready-to-Use Sampling Plans for Commuter Rail (CR)
Sampling Frequency Sample Size for Period and Year
Reporting 100% UPT
(APTL Option)
Not Reporting 100% UPT
(Base Option)
Quarterly One-Way Car Trips for a Quarter 8 80 Total Sample Size for Year 32 320
Monthly One-Way Car Trips for a Month 3 27 Total Sample Size for Year 36 324
Weekly One-Way Car Trips for a Week 1 7 Total Sample Size for Year 52 364
§ 43.09 What sampling plans are available for other rail modes?
(a) Table 43.07 shows the available ready-to-use sampling plans for other rail modes, including light rail (LR), heavy rail (HR), monorail (MR), and automated guideway (AG).
(b) Separate sampling plans are available for one-way train trips and one-way car trips. (c) Separate sampling plans are available for the base option and for the APTL option.
Table 43.07. Ready-to-Use Sampling Plans for Other Rail Modes
Sampling Frequency
Sample Size for Period and Year
One-Way Train Trips One-Way Car Trips Reporting 100% UPT
(APTL Option)
Not Reporting 100% UPT
(Base Option)
Reporting 100% UPT
(APTL Option)
Not Reporting 100% UPT
(Base Option)
Quarterly Trips for a Quarter 6 45 12 72 Total Sample Size for Year 24 180 48 288
Monthly Trips for a Month 2 15 4 24 Total Sample Size for Year 24 180 48 288
Weekly Trips for a Week 1 4 1 6 Total Sample Size for Year 52 208 52 288

7
SECTION 50 – TEMPLATE SAMPLING PLANS
Subsection 51 – General Directions § 51.01 Under what conditions should I develop a template sampling plan for next year?
(a) If you have previously been using a ready-to-use sampling plan and the next report year is your mandatory sampling year;
(b) If you have previously been using a sampling plan, but it is not based on the conditions of your service;
(c) If you have previously been using a template sampling plan, but you must revise it for your next sampling year according to Subsection 56; or
(d) If you previously have been using an alternative sampling plan, but would like to: (1) improve your sampling efficiency, (2) change the unit of sampling and measurement, or (3) use a different sampling frequency.
§ 51.03 Does this Manual have a companion tool that I may use?
(a) Yes, this companion tool is an Excel template, “The NTD Sampling Template.xls.” (b) It is specifically designed for you to develop template sampling plans. (c) You may download a copy of this template from the NTD homepage
at www.ntdprogram.gov. § 51.05 What is the scope of this template?
(a) You may use it for any mode of transit service, such as motorbus (MB), that is explicitly recognized by the NTD.
(b) You may use it for any type of service, such as directly operated (DO), that is explicitly recognized by the NTD.
(c) You may use it with sample data in any unit of sampling and measurement. § 51.07 Do I need to have knowledge of statistics to use this template?
(a) You do not need any knowledge of statistics to use this template. (b) You must follow the steps exactly as described.
Subsection 52 – Options § 52.01 What types of options does this template provide in its sampling plans?
(a) Unit of sampling and measurement – the unit of service at which you do sampling, data collection, and estimation.
(b) Efficiency options – ways to reduce your annual sample size. (c) Sampling frequency – how frequently you do sampling.
§ 52.03 Must I pick a specific unit of sampling and measurement to use this template?
(a) You must pick a specific unit of sampling and measurement before you start using this template. The type of sample data you have available will often dictate your choice of a unit for sampling and measurement.

8
(1) For non-scheduled services, such as demand response (DR) or vanpool (VP), the unit of sampling and measurement is typically the vehicle day.
(2) For bus services, including motorbus (MB) and trolley bus (TB), you must decide if the unit will be a one-way bus trip or a round-trip bus trip. It is a common practice to use a one-way bus trip as the unit of sampling and measurement.
(3) For rail services, you must decide if the unit will be a one-way car trip, a round-trip car trip, a one-way train trip, or a round-trip train trip. It is a common practice to use one-way passenger car trip as the unit of sampling and measurement.
(b) The sample data you enter into this template will all be in this unit. (c) The resulting sampling plan from this template will also be in this unit. (d) The expansion factors you are going to use to expand your sample will also be in this unit
if you are going to estimate both UPT and PMT with your sample data. § 52.05 What options does this template provide on sampling frequency?
(a) This template provides you with three options for sampling frequency – quarterly, monthly, and weekly. For example, if weekly sampling requires 4 one-way bus trips per week, you must select at least 4 one-way bus trips at random from the full list of one-way bus trips that you expect to operate during a particular week.
(b) You may choose whichever sampling frequency option is best for your agency. § 52.07 What should I consider in choosing a sampling frequency?
(a) Your cycle of minor schedule changes during a year. For example, quarterly sampling may be appropriate if you routinely adjust your schedule every three months.
(b) The scale of your operation and the method you will be using to select a sample. For example, it may become difficult to select a sample for an entire quarter if the number of service units involved in a quarter is too large for a spreadsheet to handle.
(c) The realized annual sample size. The realized annual sample size can be larger than the initial annual sample size due to rounding in allocating the initial annual sample to each frequency level. This is particularly true for weekly sampling when the initial annual sample size is relatively small. For example, if the initial annual sample size is 55 and you choose weekly sampling, the weekly sample size would be 2 and the realized annual sample size would be 104.
§ 52.09 What efficiency options does the template include?
(a) The template includes a number of options for you to consider in improving your sampling efficiency: (1) The base option. (2) The APTL option. (3) The PPMT option. (4) The grouping option.
(b) You may use the base option if you are going to estimate both UPT and PMT (i.e., you will not be using 100% counts for either UPT or PMT), and
(c) Any of the other three options has the potential to improve your sampling efficiency over the base option: (1) Sampling plans under the APTL option are based on how APTL in absolute terms
varies across your service units.

9
(2) Sampling plans under the PPMT option are based on how APTL relative to average route length varies across your service units.
(3) Sampling plans under the grouping option are based on the idea that relevant statistical variation may be smaller across service units within sub-segments of your service than across all service units of your entire service.
(d) Additional options become available when service grouping is combined with each of the other three efficiency options.
§ 52.11 Which of these efficiency options are available to me?
(a) The base option is available to you if you have data on PMT from your sample. But it is not recommended in most cases if a 100% count of annual UPT is available and reliable.
(b) The APTL option is available to you if you meet the following two criteria: (1) you are going to report a 100% count of annual UPT, and (2) you have data on both UPT and PMT from your sample data.
(c) The PPMT option is available to you if you meet all of the following criteria: (1) you are going to report a 100% count of annual UPT, (2) you have data on both UPT and PMT from your sample data, (3) your service is a fixed-route service, (4) you have your 100% count of annual UPT for each route, and (5) you have data on annual total vehicle revenue miles and annual total vehicle revenue
one-way trips for each route. (d) The grouping option is available to you as long as you have some basis for dividing your
service into two or more groups. § 52.13 How do I divide my scheduled service if I want to consider the grouping option?
(a) Grouping is usually by route when there is a small number of routes or by groups of routes that are similar.
(b) You are going to determine the similarity of service units on your expectations from your prior knowledge of your service.
(c) The most efficient grouping depends on other efficiency options you consider: (1) If your sampling plan follows the base option, define groups so that within each
group, they are similar with respect to PMT per service unit. For example, you may group heavily used long routes separately from lightly used shorter routes.
(2) If your sampling plan follows the APTL option, define your groups so that within each group they have similar APTL. For example, if your express route customers travel particularly long distances, you may separate your express and local services as two groups. As another example, if some of your local routes are particularly longer than the other local routes, you may further divide your local service into two groups.
(3) If your sampling plan follows the PPMT option, define your groups so that the routes within each group are similar with respect to the fraction of a route’s length that passengers typically ride. For example, if on some routes passengers tend to ride most of length of the route (as is the case for some express routes) while on other routes passengers tend to ride for only a small part of the route’s full length, separate those routes into different groups. Consider another example. If a system has a mix of radial routes (routes with one end in the downtown), diagonal routes (routes that pass through the downtown), and crosstown routes (routes that don’t pass through the

10
downtown), the average fraction of route length that passengers ride tends to be smaller on the diagonal and crosstown routes and longer on the radial routes. In this case, radial routes could be grouped separately from diagonal and crosstown routes.
§ 52.15 How do I group my vanpool service if I serve commuters only?
(a) You should base the grouping of your service on the registered round-trip distance of each vanpool.
(b) In most cases you will only need two groups with the longer routes in one group and the shorter routes in another group.
§ 52.17 What should I consider in general when I consider grouping my service?
(a) Strike a balance between the number of groups and the potential reduction in necessary sample size. In most cases, you will only want to deal with two or three groups.
(b) You may try different ways of grouping your service and choose one particular grouping based on its efficiency improvement and your administrative convenience.
(c) The grouping option may be used for administrative convenience alone: (1) You may treat your different contractors of service for a given mode as separate
groups when each is responsible for sampling and collecting data. (2) You may treat your operational divisions as separate groups if each is responsible for
sampling and collecting data. (3) You may treat your commuter vanpool separately from your other vanpool services.
Subsection 53 – Input Data § 53.01 What data must I have to use this template?
(a) You must have a set of sample data collected recently from your service for the mode and type of service for which you would like to have a new template sampling plan. (1) The sample data must be at the unit of sampling and measurement you have chosen
for your sampling plan. For example, if your sampling plan is in one-way bus trips, the sample data should show the UPT and PMT and other identification information for each one-way bus trip in your sample.
(2) Follow the instructions in the template for details on data items required and how they should be entered into the template.
(b) You should use your NTD sample if it is available and you have not made major changes to your service since the data were collected.
(c) Otherwise, you may use data that have been collected for non-NTD purposes: (1) One good source of non-NTD sample data for scheduled services is a comprehensive
operational analysis (COA). Typically, all trips or a large portion of all trips on your schedule are checked by ride-checkers or by APCs during a concentrated period.
(2) Make sure that the non-NTD source of sample data has the required information for using this template. For example, between-stop distances often are not collected during COA ride checks, and the resulting ride check data would not be useful if you do not have pre-determined between-stop distances for your entire service.
(d) If you do not have a set of sample data recently collected from your service for the mode and type of service, then you should use one of the other types of sampling plans, such as ready-to-use sampling plans.

11
§ 53.03 What other data do I need to use this template?
(a) If you want to consider the grouping option, you must have data: (1) on the size of each service group in the number of service units operated during the
period for which the sample data were collected, and (2) on the expected size of each service group for future sampling years. (3) Follow the instructions in the template on how you should enter the information on
group size. (b) If you want to consider combining the grouping option with the APTL option, you must
enter into the template whether you will have reliable 100% counts of UPT for each service group for estimating your annual PMT. Follow the instructions in the template on where you should enter this information. Your input affects several things: (1) The efficiency of your sampling plan. In general your sampling plan is more efficient
if you will have reliable 100% counts of UPT by service group. (2) How you should estimate your annual PMT. For example, you will need to estimate
your annual PMT separately for each service group if you have 100% counts of UPT by service group. Refer to Subsection 83 for more guidance on estimation.
(3) The information you need to get from the template for determining whether you need to revise your template sampling plan. Refer to Subsection 56 for more guidance on revision of sampling plans.
§ 53.05 What sample data should I use to develop template sampling plans for next year?
(a) If you are not sampling this year, you should use the sample data from your most recent previous sampling year.
(b) If you are sampling this year, you should use the sample data from this year. It is critical that you process your sample data as they become available. The objective is that you can apply the companion template of this Manual to the cumulative sample data any time during this year. Refer to Section 60 for processing your sample data. (1) If you are familiar with the companion template of this Manual, you should wait until
a couple of weeks before the end of this year to use the template. It is fine if you miss a few service units in your annual NTD sample for this purpose. Note that you will still need to use the full sample to estimate your annual service-consumed data for NTD reporting.
(2) If you are not familiar with the companion template, you should start learning to use the companion template with your sample data from this year. Once you become familiar with the template, you should still wait until a couple of weeks before the end of this year to use the template.
§ 53.07 How does this template deal with fluctuations in sample data from one year to
another for a given service? (a) The measured statistical variation in APTL or any relevant characteristic of your service
fluctuates from one year to another. (b) Such fluctuations can occur from minor changes in your service or changes in how
people use your service even if you do not adjust your service. (c) Fluctuations can also occur due to errors in data collection as a result of sampling. (d) This template has built in a 25% margin of safety against such fluctuations.

12
(e) This margin of safety is equivalent to increasing the minimum precision level from 10% to 9% at the same 95% confidence level.
§ 53.09 Why do such annual fluctuations in sample data require a margin of safety?
(a) FTA’s 95% confidence and 10% precision levels are imposed on your estimates of annual service-consumed data.
(b) The template, on the other hand, can only impose these requirements on your template sampling plans, but not on the estimates you develop with data collected according to your template sampling plans.
(c) Whether the estimates of annual service-consumed data from the sample data collected according to the template sampling plans meet FTA’s requirements depends on how the sample data fluctuate over time: (1) If the statistical variation is greater in the sample data used to develop your template
sampling plan, your estimates will meet FTA’s requirements. (2) If the statistical variation is smaller in the sample data used to develop your template
sampling plan, your estimates may not meet FTA’s requirements. The margin of safety is built in to prevent such violations from happening.
Subsection 54 – Usage and Output § 54.01 How do I use this template?
(a) You must choose Enable Macros upon opening the template. (b) You must follow the instructions provided in the template. (c) This template is illustrated with actual sample data in “The NTD Sampling Template
with Sample Data.xls.” (d) This illustrated template is available for download at the NTD
webpage: www.ntdprogram.gov. § 54.03 What does the template output include?
(a) The output includes a set of several sampling plans as a result of the input data you have entered.
(b) The sampling plans in this set differ in their efficiency options and sampling frequency. (c) The number of sampling plans in this set varies with the efficiency options that your
input data allow. It ranges from 3 sampling plans if you only consider the base option to 18 sampling plans if you consider all four efficiency options.
(d) The set of sampling plans changes when you change some or all of your input data.
Subsection 55 – Selecting a Sampling Plan § 55.01 What should I consider in selecting one from the set of template sampling plans?
(a) You should consider all four elements of a sampling plan: (1) unit of sampling and measurement, (2) efficiency options, (3) sampling frequency, and (4) necessary sample size.
13
(b) You should consider tradeoffs among the following characteristics of sampling plans: (1) sampling cost – it is closely related to the necessary sample size and to the unit of
sampling and measurement. (2) complexity of sampling plans – the grouping and PPMT options, for example, make
sampling and estimation more complex. (3) administrative convenience – how a sampling plan matches your institutional
arrangements for sampling purposes. § 55.03 Should I keep a copy of the used template that contains my sample data and my
chosen template sampling plan? (a) Yes, you should keep a copy of the used template that contains your sample data and the
final sampling plans, including the sampling plan you have chosen. It is useful later for several purposes.
(b) You may need it for NTD requirements on record keeping. (c) You may also need it for the following purposes:
(1) Get information about the sample data for determining whether you need to revise your template sampling plan. Refer to Subsection 56 for guidance on that.
(2) Remind you what you have entered into the template on whether you will have reliable 100% count of UPT by service group if your template sampling plan is based on the APTL option with service grouping. Refer to Subsection 83 for guidance on estimation under the APTL option.
§ 55.05 How does my choice of efficiency options affect my choice of estimation methods?
(a) Your choice of an efficiency option determines your method of estimation. (b) Follow the guidance on estimation in:
(1) Section 70 if you choose the base option. (2) Subsection 83 if you choose the APTL option. (3) Subsection 85 if you choose the PPMT option.
§ 55.07 May I change template sampling plans from one report year to another?
(a) Suppose that: (1) you have developed a set of final template sampling plans with sample data from a
previous sampling year, and (2) you are using one of these template sampling plans this year.
(b) The answer depends on whether you are required to revise your current sampling plan for next year. Refer to Subsection 56 on how you may determine the need for revision.
(c) You may change to a different sampling plan from the current set of final template sampling plans if you are not required to revise your current sampling plan.
(d) You must not change to a different sampling plan from the current set of final template sampling plans if you are required to revise your current sampling plan.
§ 55.09 May I change sampling plans during a report year?
(a) You should not change sampling plans during the same report year if you have not made major changes to your service.
(b) You should increase the necessary sample size by 50% with the same template sampling plan you used during the first part of the year if you have made major changes to your

14
service. For example, if you were sampling 4 one-way bus trips each week before the major changes, you should change to sample 8 one-way bus trips each week after those changes.
(c) Table 55.01 shows this guidance in a tabular format.
Table 55.01. Tabular Guidance on Changing Sampling Plans in a Report year
If you then you should by have not made major changes to your service
not change your sampling plan during a report year
you have made major changes to your service
adjust your sampling plan during a report year
increasing the necessary sample size by 50%
§ 55.11 How should I implement a template sampling plan?
(a) You must not implement a template sampling plan at a unit that is smaller than the unit used in developing the original sampling plan. For example, if your plan is to sample 3 round trips per week, you must not implement it by sampling 3 one-way trips per week.
(b) You may choose to sample and measure at a unit that is greater than the unit used in developing the original template sampling plan. For example, if your plan is to sample 4 one-way trips per week, you may implement it by sampling 4 round trips per week instead.
(c) You may only want to do (b) during the first year of implementing a template sampling plan. For example, once you have the sample data in round trips from the first year, you should use the sample data from the first year to develop a new template sampling plan in round trips for future years.
Subsection 56 – Revision § 56.01 When does this subsection apply to me?
(a) When you have used a template sampling plan for at least one year, or (b) When you have been using a template sampling plan for the first time this year.
§ 56.03 Why do I need to consider revision?
(a) Your service and the traveling habits of your customers change naturally over time. (b) The sampling plans produced by this template are only certified to meet FTA’s
requirements of 95% confidence with 10% precision for certain sampling cycles, presuming no major changes in your service.
(c) After this time, or after major changes in your service, a new template sampling plan must be developed to maintain certification of compliance with the FTA requirements.
§ 56.05 Under what conditions should I revise my template sampling plan?
(a) If your next sampling year is your mandatory revising year, or (b) If you have made major changes to your service since you started using the current
template sampling plan.

15
§ 56.07 How do I know if next year is a mandatory revising year for me?
(a) If you are required to sample every year, every 6th
(b) If you are required to sample every 3
year is your mandatory revising year. For example, if you used your 2008 NTD sample to develop a template sampling plan, report year 2014 is your mandatory revising year.
rd year, every 9th
(c) Follow the Reporting Manual to determine when it is your mandatory revising year.
year is your mandatory revising year. For example, if you used your 2008 NTD sample to develop a template sampling plan, report year 2017 is your mandatory revising year. In other words, you may use a template sampling plan for a maximum of 8 years without considering whether you need to revise your template sampling plan.
§ 56.09 What are considered major changes to my service?
(a) A major change is any change you make to your service that is likely to lead to major changes in the statistical variation in a relevant quantity of your service.
(b) The relevant quantity of your service varies with the sampling options you choose. It is PMT if you choose the base option, APTL if you choose the APTL option, etc.
(c) The following are examples of a major change: (1) Making transfers fare free for all passengers. (2) Adding or cutting express routes to the base of all local service. (3) Expanding or contracting your service by at least 25% in vehicle revenue miles. (4) Service restructuring that affects at least 25% of your service in vehicle revenue miles.
§ 56.11 What information do I need to determine whether I must revise my current
template sampling plan? (a) You need information from two samples:
(1) The base sample is what you used in developing your current template sampling plan. Suppose it is 2008 and you are using a template sampling plan you developed with your 2006 NTD sample. Your 2006 NTD sample in this case is the base sample.
(2) The current sample is what you would use to develop a new template sampling plan if you must revise your current template sampling plan. Suppose it is 2008, you are sampling this year, and you are going to use your 2008 NTD sample to develop a new template sampling plan. Your 2008 NTD sample in this case is the current sample.
(b) You will need two pieces of information from each of these two samples: (1) The annual sample size, and (2) The statistical variation that is the basis of your template sampling plans. For
example, if your template sampling plan is based on the APTL option, the statistical variation in APTL is what you need to get from the two samples.
§ 56.13 How do I get these two pieces of information from my samples?
(a) How you obtain these pieces of information depends on the sampling options in the two related sampling plans as mentioned above. To distinguish the two sampling plans, they are repeated here: (1) Your current template sampling plan from the base sample. (2) The new template sampling plan that you could develop with your current sample.

16
(b) Use “Template for the NTD Sampling Manual.xls” that you used to develop your current sampling plan with your base sample. This template must have the data from your base sample that you entered when developing your current sampling plan. (1) Use the Revision Worksheet in this template. (2) The sample size you need from the Revision Worksheet is located in cell D5. For
example, the sample size in the example shown in Figure 56.01 is 549. (3) The statistical variation you need from the Revision Worksheet depends on the
efficiency options you have chosen for the current template sampling plan. For example, you must use the value in cell D12 of Figure 56.01 (=1,195) if your template sampling plan is based on the APTL option with service grouping and if you have chosen to use your 100% UPT count by group in developing your sampling plan.
Figure 56.01. Layout of Revision Worksheet
(c) Enter your current sample into the companion template as if you were going to develop a new template sampling plan. Once you have applied the companion template to your current sample, the steps you should take to get the two pieces of information are identical to (b) above.
(d) You must use the statistical variation for the same efficiency options for both samples. For example, if your current sampling plan is based on the base option with no grouping, you must get the statistical variation for this combination of efficiency options for both samples.
§ 56.15 How should I use these two pieces of information?
(a) Calculate the ratio of the statistical variation for the current sample in the numerator to the statistical variation for the base sample in the denominator.

17
(b) If the calculated ratio is smaller than 1.00, you may continue using the current sampling plan for your next sampling year.
(c) If the ratio is greater than 1.00, you must locate a critical value in Table 56.01 corresponding to the sample sizes of your base and current samples. The rows correspond to the sample size for the base sample, and the columns correspond to the sample size for the current sample. (1) If the ratio does not exceed the critical value, you may continue using the current
customized sampling plan for your next sampling year. (2) If the ratio is greater than the critical value, you must use the current sample to
develop a new customized sampling plan for your next sampling year.
Table 56.01. Critical Values by Base and Current Sample Sizes
Size of Base
Sample Size of Current Sample
25 30 35 40 45 50 75 100 150 200 300 400 600 25 1.98 1.95 1.92 1.90 1.88 1.86 1.82 1.80 1.78 1.77 1.76 1.75 1.74 30 1.90 1.86 1.83 1.81 1.79 1.78 1.73 1.71 1.69 1.67 1.66 1.66 1.65 35 1.84 1.80 1.77 1.75 1.73 1.72 1.67 1.65 1.62 1.61 1.60 1.59 1.58 40 1.80 1.76 1.73 1.70 1.69 1.67 1.62 1.60 1.57 1.56 1.55 1.54 1.53 45 1.77 1.73 1.69 1.67 1.65 1.64 1.59 1.56 1.53 1.52 1.51 1.50 1.49 50 1.74 1.70 1.67 1.64 1.62 1.61 1.56 1.53 1.50 1.49 1.47 1.47 1.46 75 1.67 1.62 1.59 1.56 1.54 1.52 1.47 1.44 1.41 1.39 1.38 1.37 1.36
100 1.63 1.58 1.55 1.52 1.50 1.48 1.42 1.39 1.36 1.34 1.33 1.32 1.31 150 1.59 1.54 1.51 1.48 1.46 1.44 1.38 1.35 1.31 1.29 1.27 1.26 1.25 200 1.57 1.52 1.49 1.46 1.44 1.42 1.36 1.32 1.28 1.26 1.24 1.23 1.22 300 1.55 1.51 1.47 1.44 1.42 1.40 1.33 1.30 1.26 1.23 1.21 1.20 1.18 400 1.54 1.50 1.46 1.43 1.41 1.39 1.32 1.28 1.24 1.22 1.19 1.18 1.16 600 1.54 1.49 1.45 1.42 1.40 1.38 1.31 1.27 1.23 1.20 1.18 1.16 1.14
(d) Figure 56.03 shows these steps in a flow chart format.
Figure 56.03. Flow Chart on Plan Revision
Ratio of Statistical Variation
You may continue to use your template sampling plan
Determine sample sizes for both base and current
samples
You must revise your template sampling plan
Ratio <=1
Ratio<= Critical Value
Determine critical value from Table
57.01
No
No
Yes Yes

18
(e) Table 56.03 shows three examples of how these steps work:
(1) In example 1, the ratio of current to base statistical variations (0.90) is smaller than 1.00. In this case, you may continue using your current customized sampling plan.
(2) In example 2, the ratio (1.04) is greater than 1.00 but smaller than the critical value (1.34). The critical value is for a base sample of 100 and a current sample of 200. You may continue using your current customized sampling plan.
(3) In example 3, however, the ratio (1.20) is greater than the critical value (1.18). You must use your current sample to develop a new customized sampling plan.
Table 56.03. Illustrative Examples of Determining the Need for Revision
Measure Sample Example 1 Example 2 Example 3
Sample Size Base 558 100 400 Current 208 245 400
Statistical Variation Base 13,829 6,250 2,500 Current 11,000 6,500 3,000
Ratio of Current to Base Statistical Variations 0.90 1.04 1.20 Critical Value N/A 1.34 1.18 Ratio > Critical Value N/A No Yes
Subsection 57 – Certification § 57.01 How do I certify my template sampling plan?
(a) You must certify that that your template sampling plan meets FTA’s 95% confidence and 10% precision levels through your annual reporting process.
(b) You should follow the current Reporting Manual on how exactly you may do that. (c) This certification of your template sampling plan through the annual reporting process is
conditional: (1) Your template sampling plan must use the 25% margin of safety according to
Subsection 53. (2) You revise your template sampling plans over time according to Subsection 56.

19
SECTION 60 – DATA COLLECTION
Subsection 61 – General Directions § 61.01 What are the basic elements of collecting sample data?
(a) Selecting a sample at random according to your sampling plan (Subsection 63). (b) Collecting data from the random sample (Subsection 65). (c) Identifying and correcting any errors in the sample data (Subsection 67).
§ 61.03 What criteria does this section cover to ensure that estimates of annual service-
consumed data meet FTA’s 95% confidence and 10% precision levels? (a) Your sampling process covers your entire service. (b) You select your sample at random. (c) Your data-collection process is designed to avoid errors from happening. (d) Your data-collection is designed to identify and correct errors when they occur.
Subsection 63 – Selecting a Sample at Random § 63.01 What are the basic elements of selecting a sample at random?
(a) Choosing a method with which you select a sample at random. (b) Developing lists of service units that you expect to operate:
(1) A single list of all services if your sampling plan is not based on service grouping. (2) One list for each service group if your sampling plan is based on service grouping.
(c) Selecting a sample at random from each list with the chosen method. § 63.03 What method may I use for random sampling?
(a) You may use the commonly used method based on a table of random numbers. (b) You may use any other method for random sampling as long as it meets these two criteria:
(1) sampling under the method is random. (2) sampling under the method is without replacement. Without replacement means that
the method will not select the same service unit more than once. § 63.05 What is a table of random numbers?
(a) It is a list of integers whose frequency and sequence of appearance in the list have been determined entirely by chance.
(b) For convenience and simplicity in use, published tables of random numbers usually appear in the form of separate columns of five-digit numbers. Both rows and columns may be consecutively numbered for easy reference. Table 63.01 shows an example.
(c) Appendix 98 is a comprehensive table of random numbers you may use for random sampling if you choose to use this method.

20
Table 63.01. Example of a Table of Random Numbers
Rows (1) (2) (3) (4) (5) 1 10480 15011 01$536 02011 81647 2 22368 46573 25595 85393 30995 3 24130 48360 22527 97265 76393 4 42167 93093 06243 61680 07856 5 37570 39975 81837 16656 06121
§ 63.07 What is the list of all service units that I expect to operate?
(a) It is the amount of revenue service that you expect to operate. (b) It is measured with the following characteristics:
(1) It is in the unit of sampling and measurement of the sampling plan you have chosen. (2) It is for the period corresponding to the sampling frequency that you have chosen for
your sampling plan. (3) It is for each of the service groups you have defined if your sampling plan is based on
service grouping. (c) For scheduled services, the list must include:
(1) all service units that are listed on the schedule, and (2) all service units that are not on the schedule but are expected to be operated, such as
trippers, shuttles, and other special operations. (d) It would be the number of one-way bus trips you expect to operate in a week by your
express routes, for example, if: (1) you have chosen weekly sampling for motorbus (MB), (2) your sampling plan involves service grouping, and (3) you use express routes as one of the groups.
§ 63.09 How do I develop the list of all service units for using a table of random numbers?
(a) Suppose that: (1) you have chosen weekly sampling for your vanpool service, (2) your sampling plan requires 2 vanpool-days per week, (3) you want to select a random sample for next week, and (4) you have 101 vanpools and each of them is expected to operate every day next week.
(b) One way to develop the list would be to assign a serial number of four-digits to each vanpool-day for all 707 combinations of vanpools and service days. The first digit would represent the day of week with 1 for Monday and 7 for Sunday. The other three digits would represent vanpool numbers ranging from 001 through 101.
(c) The vanpool numbers may differ from what you use for your internal purposes. Make sure that you have a one-to-one list between the internal vanpool numbers and the new serial numbers if they differ.
(d) The serial numbers on a given day must be consecutive without any gaps. (e) Write down just the first and the last for each day of week so that you will know the
range of numbers. For example, the range for Monday is 1001-1101. (f) You should summarize these serial numbers in a summary table as in Table 63.03.

21
Table 63.03. Example of a Summary Table of Serial Numbers
Day of Week Range of Serial Numbers 1 (Monday) 1001-1101
2 2001-2101 3 3001-3101 4 4001-4101 5 5001-5101 6 6001-6101 7 7001-7101
§ 63.11 How do I use a table of random numbers?
(a) Suppose that: (1) you have 101 vanpools that are expected to operate every day of next week, (2) you have numbered the vanpool days for all vanpools as shown in Table 63.03, and (3) your sampling plan for your vanpool service requires 2 vanpool days per week.
(b) You must work with a constant length of digits from a table of random numbers for sampling. This constant length is given by the number of digits in the longest serial number you have assigned to members of the list of all service units. (1) This constant length would be 4 for the example in Table 63.03 because all serial
numbers are four-digits long. (2) This constant length would be 5 if your serial numbers vary in length, ranging from
one to five digits. (c) You must combine adjacent digits from the table of random numbers as needed to obtain
a two-, three-, or four-digit number, or any other length number from the table. (1) You may choose to work with rows or columns in combining adjacent digits. You
may start with any row if you choose to work with rows. You may start with any column if you choose to work with columns. You may also choose to work from right to left or from left to right if you choose to work with rows.
(2) If you choose to work with rows and to start with row 1, for example, the first 9 four-digit numbers from Table 63.01 would be:
1048, 0480, 4801, 8015, 0150, 1501, 5011, 0110, and 1101.
(d) You must continue forming four-digit numbers until you find two four-digit numbers
from the table of random numbers that are in the summary table of serial numbers (Table 63.03). In the above example, these two numbers are 1048 and 1101. That is, you should select vanpools 48 and 101 and collect sample data from them on Monday of next week.
(e) Once you are done sampling for a week, you should mark where you stopped forming four-digit numbers in the table of random numbers. For example, the symbol, $, has been inserted between digits 1 and 5 in row 1 and column 3 of Table 63.01. You should start the above process for a later week after that mark.
(f) Once you are done sampling for a year, you should mark where you stopped forming four-digit numbers in the table of random numbers.

22
(1) If you number your service units exactly as for a previous sampling year, you should start the above process for a new sampling year after the last mark of your previous sampling year.
(2) If you number your service units with a different approach, you may start the above process anywhere in the table of random numbers.
§ 63.13 What are the pros and cons of using a table of random numbers?
(a) Using a table of random numbers for random sampling has the following advantages: (1) It is applicable to all situations. (2) You do not need to list explicitly all service units.
(b) It has the following disadvantages: (1) You must number your service units consecutively without gaps, at least within each
subset of your service units. Subsets are formed by route, type of service days, etc. (2) You may not be able to take advantage of the serial numbers you have already
assigned to your service units for internal purposes. (3) It can be difficult to use if the serial numbers have a large number of digits.
§ 63.15 What information should I keep from my sampling process?
(a) You should have an auditable record of your sampling process. That record should cover the following: (1) A written description of the sampling plan. (2) A written procedure for your method of selecting a sample at random. (3) The list of all service units from which you selected a sample at random for each act
of sampling. For example, you should have 52 such lists if you did weekly sampling for an entire year.
(4) The random sample.
Subsection 65 – Collecting Data from the Random Sample § 65.01 What method may I use to collect the sample data?
(a) One common method involves one or more ride checkers observing and recording passenger activities while riding in a transit vehicle.
(b) An increasingly common method uses APCs to record passenger activities instead. (c) You may use one of these or any other method to collect the data from each service unit
of your random sample as long as your method meets these criteria: (1) it obtains data from direct measurement or direct observation without passenger
intercept, (2) it provides data you must have to determine PMT for each service unit, and (3) it meets the requirements on measurement accuracy in the NTD Reporting Manual.
§ 65.03 What approach may I use to determine PMT for each service unit of my sample?
(a) You may use the load-based approach. It determines PMT by multiplying the number of passengers onboard a transit vehicle between each pair of consecutive stops by the distance between these stops.
(b) You may also use the distance-based approach. It determines PMT by keeping track of the distance traveled by each passenger carried by a service unit of your random sample.

23
§ 65.05 What data items must I collect to use the load-based approach for scheduled
services? (a) You must collect the required data items separately for each one-way vehicle trip in your
service unit. (1) If your service unit is a round-trip bus trip, for example, it has two one-way vehicle
trips. (2) If a service unit is a one-way train trip with three passenger cars, for example, it has
three one-way vehicle trips. (b) The following data items are required for each one-way vehicle trip:
(1) the number of people who boarded at each stop, (2) the number of people who alighted at each stop, (3) the distance between any pair of consecutive stops at which boardings or alightings
occurred, (4) the number of people onboard the vehicle between any pair of consecutive stops, (5) the number of people who stayed on from the previous one-way vehicle trip, and (6) the number of people who remained on the vehicle at the last stop.
§ 65.07 What data must I collect to use the load-based approach for non-scheduled
services? (a) For commuter vanpool, the following data items are required for each direction of
commuting: (1) the number of people who boarded at each pick-up location, (2) the number of people who alighted at each drop-off location, and (3) the distance between any pair of consecutive stops at which pick-up or drop-off
occurred. (b) For demand response, you must collect the required data items continuously during the
entire vehicle day sampled: (1) the odometer reading at each pick-up location, (2) the number of people onboard between each pair of consecutive locations at which
pick-up or drop-off occurred, and (3) the odometer reading at each drop-off location.
(c) You should treat non-commuter vanpool as demand response for data collection. § 65.09 How should I determine between-stop distances for the load-based approach?
(a) You should avoid using maps to estimate between-stop distances under all circumstances. (b) For services without designated stops, including demand response (DR), jitney (JT),
vanpool (VP), or fixed-route services without designated stops: (1) If available, you should always use the onboard odometer to determine the between-
stop distances for each service unit in your random sample. You should make sure that the vehicles for the sampled service unit have a working odometer onboard before they start for the sampled service unit.
(2) If your vehicle does not have an onboard odometer, you should determine the distance by retracing the path and the stops by automobile.
(3) You should record your odometer readings at least to one-tenth of a mile.

24
(c) For ferryboat (FB), aerial tramway (TR) and all rail services, you may want to pre-determine the between-station distances for all routes and directions.
(d) For fixed-route services with designated stops, you should use one of two approaches: (1) pre-determine the between-stop distances for all routes and directions, or (2) record the onboard odometer readings at individual stops.
(e) You may use different methods to pre-determine the between-stop distances: (1) use an up-to-date GIS of your network of routes and stops, or (2) record the odometer readings while you drive through all of your routes and related
deviations and directions. (f) If you pre-determine between-stop distances, you must keep them updated to reflect any
changes in your services. § 65.11 What additional data should I collect to identify each service unit of my sample?
(a) You must record the date and the type of service days for all cases. (b) For commuter rail (CR), heavy rail (HR), and light rail (LR), you must also record the
weekday time period that you will be reporting to the NTD for weekdays. (c) If your sampling plan is based on the PPMT option, you must record route identification. (d) If your sampling plan is based on service grouping, you should also record information
that is necessary to determine group membership of each service unit in the random sample.
§ 65.13 When do I use the different approaches to determining PMT?
(a) The load-based approach is applicable to all circumstances. Under conditions of heavy loads or high boarding volumes, however, extra care must be taken to maintain the required level of measurement accuracy.
(b) The distance-based approach is useful under several circumstances. For examples: (1) All passengers board and alight at the same locations, such as inclined plane (IP),
tramways (TR), and most ferryboat (FB) operations. (2) Services with a small number of passengers who board and alight at a small number
of stops, such as demand response. (3) Services with a small number of frequent passengers who board and alight at a small
number of stops, such as commuter vanpool. (4) Any service with a ticketing system that keeps track of the origin and destination for
every boarding with a known distance. § 65.15 What instrument should I use to collect the data for the distance-based approach?
(a) You may use any instrument that you have designed as long as you can use it to record the required data items correctly.
(b) If you use human ride checkers, the instrument may be a piece of paper and a pencil or it may be a hand-held device.
(c) Appendix 92 provides an example of both blank and filled-out paper instruments for the distance-based approach.
§ 65.17 What instrument should I use to collect data for the load-based approach?
(a) You may use any instrument that you have designed as long as you can record the required data items correctly.

25
(b) If you use APCs, the instrument would be computer software and hardware that records the counts and other data items transmitted from the APCs.
(c) If you use human ride checkers, the instrument may be a piece of paper and a pencil or it may be a hand-held device.
(d) If you use a hand-held device, it is critical that the unit accepts counts of boardings and alightings that may not be equal for a one-way vehicle trip.
(e) The instrument you design may take slightly different formats for different services. Three examples of blank and filled-out instruments are shown as appendices: (1) demand response – Appendix 93. (2) commuter vanpool – Appendix 94. (3) fixed-route services – Appendix 95.
(f) If you are going to use one of these example instruments, you should study it carefully before reading the following guidance.
§ 65.19 What pre-survey procedures should I follow if I use a paper instrument and
human ride checkers? (a) You should use an appropriate survey sheet for each service unit selected in the sample.
This survey sheet may be one of those from the appendices or one that you have designed, but it is important that you select a survey sheet that is designed for the service to be surveyed.
(b) For non-scheduled services, including demand response (DR) and vanpool (VP), a survey sheet should be used for each driver of the survey vehicle during an entire day.
(c) For scheduled services, a survey sheet should be used for each one-way vehicle trip of your service unit that you have chosen for your sampling plan.
(d) The ride checker(s) should carry several extra survey sheets in the event that extra sheets are needed.
(e) You should learn about the likely load and boarding volumes for each service unit to be surveyed. (1) You may need to use more than one ride checker under conditions of high loads and
high boarding volumes. (2) If more than one ride checker is used, the separate survey sheets should also be
identified with the door(s) that each ride checker is responsible for. (f) If you rely on the onboard odometer to determine the between-stop distances, make sure
that it works properly. If you cannot fix a malfunctioning odometer in time for a ride check, use a different vehicle with a working odometer.
(g) Before going into the field, the survey supervisor should fill in the data items that identify the service unit to be surveyed. If your service unit has more than one one-way vehicle trips, identify each one-way vehicle trip separately.
(h) If you rely on pre-determined between-stop distances, the survey supervisor should also use the survey sheet(s) in Appendix 95 to: (1) Fill in the stop numbers in column (7) and stop descriptions in column (8) for all
stops. (2) Cross out column (9) to avoid confusion in the field.
(i) You should write the page numbers in the box in the lower right-hand corner of each survey sheet if you use more than one survey sheet for a given one-way vehicle trip.

26
§ 65.21 What manual survey procedures should I follow for demand response (DR) with the distance-based approach?
(a) You may use the survey sheet for the distance-based approach in Appendix 92. (b) You must record individual trips by each pair of origin and destination. The filled-out
form in Appendix 92 illustrates three cases of pick-up and drop-off patterns: (1) The first pick-up illustrates the “one origin-many destinations” case. The driver
picked up 16 passengers at 1020 J Street. He immediately distributed these passengers according to their three drop-off destinations under item (8).
(2) The second pick-up illustrates the “one origin-one destination” case. At the next pick-up address, 506 10th Street, 17 passengers boarded and all were driven to the same destination. Here, a single line records all the necessary information.
(3) The last two pick-ups illustrate a “many origins-one destination” case. Here, the driver records the pick-up addresses and repeats the destinations; that is, he handles each as an individual trip.
(c) You must record the odometer readings for each pick-up and drop-off. (1) Item (7), “Pick-Up Odometer Reading,” should be recorded immediately upon
picking up the passenger(s). (2) Item (8), “Drop-Off Odometer Reading,” should be recorded immediately upon
dropping off the passengers. (3) You should also record the odometer readings to at least one-tenth of a mile when the
odometer allows. (d) You should use additional pages if a service unit involves more stops than are given on a
page. You should write the page numbers in the box in the lower right-hand corner. (e) As an alternative to data recording by the driver, the driver can call in the information to
the dispatcher if you have two-way radio communications on all vehicles. (1) When the driver arrives at a pick-up point, he can call in items (5)-(8). (2) When he arrives at each destination, he can call in item (9) and verify how many
passengers were dropped off at that destination. § 65.23 What manual survey procedures should I follow for demand response (DR) with
the load-based approach? (a) You may use the survey sheet for the load-based approach for demand response in
Appendix 93. (b) For each pick-up or drop-off, you must record the following:
(1) whether it is a pick-up or drop-off in column (5), (2) a description of the location in column (6), (3) the odometer reading in column (7), and (4) the leaving load in column (8).
(c) The filled-out form in Appendix 93 shows the recorded information for the example shown in Appendix 92. The leaving load at the last drop-off location should be 0.
(d) You should record the odometer readings to at least one-tenth of a mile. (e) You should use additional pages if a service unit involves more stops than are given on a
page. You should write the page numbers in the box in the lower right-hand corner. (f) As an alternative to data recording by the driver, the driver can call in the information to
the dispatcher if you have two-way radio communications on all vehicles. Before leaving each pick-up or drop-off location, the driver can call in items (5)-(8).

27
§ 65.25 What manual survey procedures should I follow for commuter vanpool with the
load-based approach? (a) Suppose that you have chosen to sample on a monthly basis. (b) Before a new month starts, you should communicate with the driver of each sampled
vanpool about the days on which he must collect sample data during the new month. (c) For each sampled vanpool day, the driver should fill in the identification data before he
leaves home, including the date, the day of week, and the vanpool number. (d) The driver is required to record the travel data, including the van odometer reading
whenever any rider gets on or off the van along with the number of riders who get on the van and the number of riders who get off the van. This recording is to be done separately for travel to work and travel from work. The filled-out form in Appendix 94 shows the travel data for a vanpool of 6 riders with a round-trip-distance of 78 miles. The driver picks up all 5 riders at a single location but drops them off at three different locations in the morning. In the afternoon, the process reverses itself. (1) Once the driver gets on the van in the morning, he should enter 1 in the ON column
(6) and record the odometer reading at 29,366.0 in column (8). (2) He then leaves for picking-up 5 fellow vanpoolers at another location. Once they get
on the van, he should enter 5 in (6), and record the odometer reading at 369.1 in (8) before departing that location.
(3) At the first drop-off location, 3 vanpoolers get off. Before leaving, the driver should enter 3 in the OFF column (7), and record the odometer reading at 395.3 in (8).
(4) One vanpooler gets of the van at each of the next two drop-off locations. Before leaving these locations, the driver should enter 1 in the OFF column, and record the odometer reading at 396.8 and 397.5, respectively.
(5) Finally, the driver arrives at his own destination. Before he leaves the van, he should record the odometer reading again at 405.0.
(e) The day after each sample day, you should communicate with each driver involved in collecting sample data to determine if he actually recorded the sample data. Sample data may be not recorded for a variety of reasons. (1) If the data were collected, the driver should send the filled-out survey sheet
immediately, (2) If the driver forgot to collect the data, he should be asked to collect the data next day, (3) If the driver refused to collect the data or the vanpool has been terminated, a
replacement vanpool day should be selected at random. § 65.27 What instructions should I give my ride checkers if I do not use pre-determined
between-stop distances for fixed-route services? (a) Take enough copies of the survey sheet in Appendix 95 or an alternative sheet. (b) Use separate survey sheets for separate one-way vehicle trips if your service unit has
more than one one-way vehicle trip. (c) Use additional survey sheets if needed for a given one-way trip. (d) Board the transit vehicle at the beginning point of the service unit and position yourself
so that you can observe the doors for which you are responsible. (e) Before the vehicle leaves the beginning point, record:
(1) Stop #1 in column (7),

28
(2) stop description of the beginning point in column (8), (3) odometer reading to at least one-tenth of a mile in column (9), (4) number of passengers who have stayed onboard from the last trip (13), and (5) number of passengers boarded in (10), including the passengers who have stayed
onboard from the last trip in (e)(4). (f) When the vehicle leaves the beginning point, record the number of passengers onboard in
column (12), including any passengers who have stayed onboard from the last trip. (g) Only at points where the vehicle stops during the service unit, record:
(1) stop number in (7), (2) stop description in (8), (3) odometer reading (from the driver) in (9), (4) passengers boarded in (10), and (5) passengers alighted in (11).
(h) Between stops, count the number of passengers on board (12). You should record this number as the leaving load. For example, between stops 2 and 3 you should record this number in the row for stop 2 rather than in the row for stop 3.
(i) At the end point of each one-way trip, record the number of passengers who will stay on board to the next trip in column (14) and in column (11) as passengers alighted.
§ 65.29 What steps should I take if I fail to collect the sample data from a particular unit?
(a) You may fail to collect the required sample data from any particular unit in your sample: (1) The unit may be canceled for a variety of operational reasons. (2) The rider checker(s) may fail to show up for the unit. (3) The rider checker(s) may fail to collect the data.
(b) You must replace the missed unit as soon as possible on the same type of service days: (1) If the rest of the sampling period (a week, a month, or a quarter) has at least one
service day of the same type as the missed service unit, select one service unit from the next service day of the same type. For example, if the missed service unit is on the second Monday of a month and your sampling is monthly, you should get a replacement unit from the third Monday of the month.
(2) If the rest of the sampling period does not have any service day of the same type left, select one service unit from the first service day of the same type during the next sampling period. For example, if the missed service unit is on a Monday and your sampling is weekly, you should get a replacement unit from the next Monday.
(c) The replacement unit must be selected at random in all cases.
Subsection 67 – Correcting Errors in the Raw Sample Data § 67.01 What steps should I take after I have collected the sample data?
(a) Design a format for recording your sample data. (b) Enter the raw data. (c) Process the entered data. (d) Identify errors in the entered data. (e) Identify sources of the data errors, if any. (f) Correct the data errors, if any.

29
(g) What you should do within each step depends on your situation. To be specific, the following example is used for the rest of this subsection: (1) you collect sample data with human ride checkers from one-way bus trips with
designated stops, (2) you use the load-based approach to determining PMT, (3) you use pre-determined between-stop distances, and (4) you have collected sample data from a route whose longest one-way trip is 4 miles.
§ 67.03 What should I consider in designing the format for data recording?
(a) The data items you have collected to determine PMT. The exact data items depend on your service and the approach you have taken to determine PMT.
(b) The data items that identify the service units in your sample. (c) A format that is easy for data analysis. (d) Suppose that you have designed a format in Table 67.01. With this format, you enter the
field data (7)-(14) as they appear on the field survey sheet shown in the filled-out form in Appendix 95. Item (8) is not shown due to space limit. The identification data items at the top of the survey sheet (1)-(6) are repeated for each stop of this one-way trip.
Table 67.01. Example Format for Data Recording
Date Day of Week
Time Period
Route No.
Trip No. Direction
Stop Sequence
Distance to Next Stop
No. of Pass.
Boarded
No. of Pass.
Alighted
No. of Pass. On
Board (Leaving
Load)
No. of Pass. from
Previous Trip (Stop 1
only)
No. of Pass. Continuing to Next Trip (Last Stop
only) (1) (2) (3) (4) (5) (6) (7) (9) (10) (11) (12) (13) (14)
10/13/05 Thur Midday 11 408 Outbound 1 0.3 20 0 20 2 10/13/05 Thur Midday 11 408 Outbound 2 0.7 2 1 21 10/13/05 Thur Midday 11 408 Outbound 3 0.6 0 2 19 10/13/05 Thur Midday 11 408 Outbound 4 0.3 1 3 17 10/13/05 Thur Midday 11 408 Outbound 5 0.5 1 10 8 10/13/05 Thur Midday 11 408 Outbound 6 0.8 0 2 6 10/13/05 Thur Midday 11 408 Outbound 7 0.2 0 1 5 10/13/05 Thur Midday 11 408 Outbound 8 0.1 0 2 3 10/13/05 Thur Midday 11 408 Outbound 9 0.1 0 2 1 10/13/05 Thur Midday 11 408 Outbound 10 0.3 0 0 1 10/13/05 Thur Midday 11 408 Outbound 11 0.1 0 0 1 10/13/05 Thur Midday 11 408 Outbound 12 0.0 0 1 1 1
§ 67.05 When should I enter my sample data?
(a) You should have the sample data from each service unit entered immediately after your ride checker(s) has come back from the field.
(b) This has a number of advantages: (1) reducing the chance of loss of information, (2) increasing the chance of correcting data errors, if any, (3) being ready to use the cumulative sample data any time during the sampling year, and (4) minimizing the rush at the end of the year.

30
§ 67.07 How should I process the entered data? (a) You should process the data as follows immediately after you have entered them. If your
service unit has more than one one-way vehicle trip, you should process the data for individual one-way vehicle trips: (1) Sum the number of passengers boarded at individual stops in column (10) of Table
67.01 to get the total number of passengers boarded. It is 24 in this case. (2) Sum the number of passengers alighted at individual stops in column (11) of Table
67.01 to get the total number of passengers alighted. It is 24 in this case. (3) Calculate the load between every pair of two consecutive stops. Table 67.03 shows
an example and the formulas for calculating leaving loads and arriving loads. (4) Calculate PMT for each pair of consecutive stops by multiplying the calculated load
with the between-stop distance. Table 67.03 also shows the calculation of PMT with both leaving loads and arriving loads.
(5) Calculate total PMT. It is 47.8 miles in this case. (6) Divide total PMT by the total number of passengers boarded to get APTL. It is 1.99
miles in this case. (7) Calculate vehicle trip length by summing up the pre-determined between-stop
distances in column (9). It is 4.0 miles in this case. (b) If your sampling plan is based on the PPMT option, you should also process the data as
follows immediately to calculate the ratio of PMT to PPMT for each service unit: (1) Calculate the average route length for each route. (2) Calculate PPMT by multiplying UPT by average route length. (3) Divide PMT by PPMT to get the ratio for each service unit. (4) Follow Subsection 85 on calculating average route length and PPMT.
§ 67.09 How may I use the processed data to identify potential errors in the sample data?
(a) Compare vehicle trip length with the longest actual length of the route. Vehicle trip length must not exceed the longest route length.
(b) Compare APTL with vehicle trip length and route length. APTL must not exceed either. (c) Compare the total number of passengers boarded with the total number of passengers
alighted. They must be equal. (d) Examine the calculated load at the end point of the trip. It must be zero for leaving loads. (e) If calculated, examine the PMT to PPMT ratio for each service unit. It must not exceed 1.
§ 67.11 How do I identify the sources of any errors?
(a) If you have identified any error from the previous step, you should start with the calculations you did in processing the sample data to determine if an error is a calculation error or an error in the sample data.
(b) Check if you have correctly calculated loads, PMT, and APTL. (c) Check if you have used between-stop distances and loads consistently:
(1) If you use leaving loads, you must use the distance to the next stop. The distance should be zero for the ending point of a one-way trip.
(2) If you use arriving loads, you must use the distance from the previous stop. The distance should be zero for the beginning point of a trip.
(d) Check the pre-determined between-stop distances you entered. (e) Compare your calculated load with the observed load from the field.

31
Table 67.03. Calculation of Loads and PMT
Load Type
Stop Sequence
Distance to Next Stop
No. of Pass.
Boarded
No. of Pass. Alighted
No. of Pass. from Previous
Trip
Calculated Load PMT
Leav
ing
Load
1 0.3 20 0 2 20 6.0 2 0.7 2 1 21 14.7 3 0.6 0 2 19 11.4 4 0.3 1 3 17 5.1 5 0.5 1 10 8 4.0 6 0.8 0 2 6 4.8 7 0.2 0 1 5 1.0 8 0.1 0 2 3 0.3 9 0.1 0 2 1 0.1 10 0.3 0 0 1 0.3 11 0.1 0 0 1 0.1 12 0.0 0 1 0 0.0
Total 4.0 24 24 2 N/A 47.8 Load for Stop 1 = Current Boarding Load for Other Stops = Previous Load + Current Boarding - Current Alighting
Arr
ivin
g Lo
ad
Stop Sequence
Distance from Previous Stop
No. of Pass.
Boarded
No. of Pass. Alighted
No. of Pass. from Previous
Trip
Calculated Load PMT
1 0.0 20 0 2 0 0.0 2 0.3 2 1 20 6.0 3 0.7 0 2 21 14.7 4 0.6 1 3 19 11.4 5 0.3 1 10 17 5.1 6 0.5 0 2 8 4.0 7 0.8 0 1 6 4.8 8 0.2 0 2 5 1.0 9 0.1 0 2 3 0.3 10 0.1 0 0 1 0.1 11 0.3 0 0 1 0.3 12 0.1 0 1 1 0.1
Total 4.0 24 24 2 N/A 47.8 Load for Stop 1 = 0 Load for Other Stops = Previous Load + Previous Boarding - Previous Alighting
§ 67.13 How do I correct any errors?
(a) Table 67.05 shows an example of sample data for a one-way trip where PMT is based on calculated leaving loads. The first row of Table 67.07 shows the vehicle trip length, PMT, UPT, APTL, and the ratio of PMT/PPMT for this trip.
(b) It has the following errors: (1) Vehicle trip length > route length.
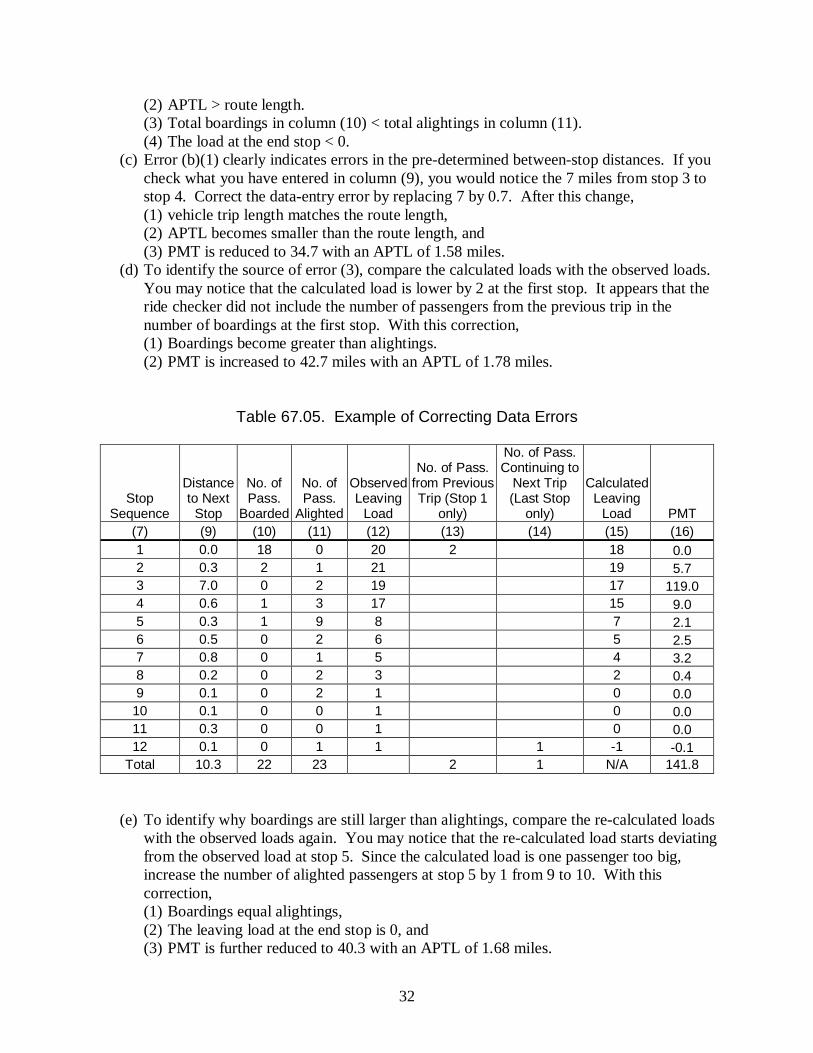
32
(2) APTL > route length. (3) Total boardings in column (10) < total alightings in column (11). (4) The load at the end stop < 0.
(c) Error (b)(1) clearly indicates errors in the pre-determined between-stop distances. If you check what you have entered in column (9), you would notice the 7 miles from stop 3 to stop 4. Correct the data-entry error by replacing 7 by 0.7. After this change, (1) vehicle trip length matches the route length, (2) APTL becomes smaller than the route length, and (3) PMT is reduced to 34.7 with an APTL of 1.58 miles.
(d) To identify the source of error (3), compare the calculated loads with the observed loads. You may notice that the calculated load is lower by 2 at the first stop. It appears that the ride checker did not include the number of passengers from the previous trip in the number of boardings at the first stop. With this correction, (1) Boardings become greater than alightings. (2) PMT is increased to 42.7 miles with an APTL of 1.78 miles.
Table 67.05. Example of Correcting Data Errors
Stop Sequence
Distance to Next
Stop
No. of Pass.
Boarded
No. of Pass.
Alighted
Observed Leaving
Load
No. of Pass. from Previous Trip (Stop 1
only)
No. of Pass. Continuing to
Next Trip (Last Stop
only)
Calculated Leaving
Load PMT (7) (9) (10) (11) (12) (13) (14) (15) (16) 1 0.0 18 0 20 2 18 0.0 2 0.3 2 1 21 19 5.7 3 7.0 0 2 19 17 119.0 4 0.6 1 3 17 15 9.0 5 0.3 1 9 8 7 2.1 6 0.5 0 2 6 5 2.5 7 0.8 0 1 5 4 3.2 8 0.2 0 2 3 2 0.4 9 0.1 0 2 1 0 0.0
10 0.1 0 0 1 0 0.0 11 0.3 0 0 1 0 0.0 12 0.1 0 1 1 1 -1 -0.1
Total 10.3 22 23 2 1 N/A 141.8
(e) To identify why boardings are still larger than alightings, compare the re-calculated loads with the observed loads again. You may notice that the re-calculated load starts deviating from the observed load at stop 5. Since the calculated load is one passenger too big, increase the number of alighted passengers at stop 5 by 1 from 9 to 10. With this correction, (1) Boardings equal alightings, (2) The leaving load at the end stop is 0, and (3) PMT is further reduced to 40.3 with an APTL of 1.68 miles.

33
(f) You should also check the consistency between between-stop distances and the calculated loads. Column (9) is based on the distance from the previous stop, but the calculated load is the leaving load. Correcting this error leads to a final PMT of 47.8 with an APTL of 1.99 miles.
(g) Table 67.07 also shows vehicle trip distance, PMT, UPT, APTL, and ratio PMT/PPMT for the cumulative corrections in (c), (d), (e), and (f).
Table 67.07. Impacts of Correcting Errors
Error Corrections Vehicle Trip Length PMT UPT APTL PMT/PPMT No corrections 10.3 141.8 22 6.45 0.63 §69.13 (c) 4.0 34.7 22 1.58 0.39 §69.13 (c) + (d) 4.0 42.7 24 1.78 0.44 §69.13 (c) + (d) + (e) 4.0 40.3 24 1.68 0.42 §69.13 (c) + (d) + (e) + (f) 4.0 47.8 24 1.99 0.50
§ 67.15 What should I do if I fail to correct the data errors for a particular service unit?
(a) You should treat the service unit as if it were missed for data collection. (b) You should follow the guidance in §65.29 for getting a replacement unit.
§ 67.17 What steps should I take after I have identified and corrected errors in my data?
(a) You should stack the corrected sample data from the field as shown in Table 67.01 in one or more worksheets. These worksheets along with the survey sheets become an auditable record of your sample data.
(b) You should enter the summary data at the level of your unit of sampling and measurement in a separate worksheet. These summary data are ready for developing new sampling plans or for estimating service-consumed data for the NTD.
(c) Table 67.09 shows how that summary worksheet looks with the column headings and the summary sample data for one service unit.
Table 67.09. Example of Summary Sample Data
Date Day of Week
Time Period
Route No.
Trip No. Direction Vehicle Trip
Length UPT PMT
(1) (2) (3) (4) (5) (6) 10/13/05 Thur Midday 11 408 Outbound 4.0 24 47.8

34
SECTION 70 – ESTIMATION WITHOUT 100% UPT
Subsection 71 – General Directions § 71.01 What service-consumed data must I estimate without 100% UPT?
(a) You must estimate both UPT and PMT. (b) The following table shows the data items you must estimate.
Table 71.01. Service-Consumed Data Items without 100% UPT
If your mode is you must estimate
commuter rail (CR), heavy rail (HR), or light rail (CR)
• annual total UPT and PMT • average daily UPT and PMT by type of service days • annual total UPT by weekday time period
Any other mode • annual total UPT and PMT • average daily UPT and PMT by type of service days
§ 71.03 What do I need to do in general to get estimates of these data items?
(a) You must determine sample averages. (b) You must determine expansion factors. (c) You must combine the expansion factors and sample averages to get the corresponding
estimates of service-consumed data. § 71.05 What is a sample average?
(a) A sample average is the sample total divided by the number of service units in the sample. (b) It may be calculated for the entire annual sample, by the type of service day, or for
specific weekday time periods. (c) Sample averages are used to estimate service-consumed data when your sampling plan is
based on the base option. § 71.07 What is an expansion factor?
(a) A measure of actual services operated during a given period. (b) It is used to convert sample averages to totals in the given period. The total number of
one-way bus trips operated during an entire report year is an example of an expansion factor in actual services operated; when multiplied by sample average PMT per one-way bus trip, it yields a measure of annual total PMT.
§ 71.09 How is the guidance organized?
(a) The guidance is separate in three subsections for three modal groups to reduce confusion over the different units of sampling and measurement that are typically used for these three modal groups: (1) Non-scheduled services, including demand response (DR), vanpool (VP), jitney (JT),
or público (PB) (Subsection 73).

35
(2) Rail services, including heavy rail (HR), commuter rail (CR), light rail (LR), monorail (MR), automated guideway (AG) (Subsection 75).
(3) Bus services, including motorbus (MB) or trolley bus (TB) (Subsection 77). (b) Subsection 79 contains the guidance on combining expansion factors and sample
averages to get estimates of service-consumed data.
Subsection 73 – Non-Scheduled Services § 73.01 What expansion factor should I use for non-scheduled service?
(a) You should use your 100% count of vehicle days as the expansion factor. (b) For estimating annual total PMT and UPT:
(1) Use annual total count of vehicle days if your sampling plan is not based on grouping. (2) Use annual total count of vehicle days by group if your sampling plan is based on
grouping. (c) For estimating average daily PMT and UPT by type of service days, use annual total
count of vehicle days by type of service days. § 73.03 What sample average should I use for non-scheduled service?
(a) You must use the ratio of sample total PMT over sample total vehicle days as the sample average to estimate PMT.
(b) You must use the ratio of sample total UPT over sample total vehicle days as the sample average to estimate UPT.
(c) For estimating annual total PMT and UPT: (1) Use the sample averages for the entire sample if you do not group your service. (2) Use the sample averages for each group if your sampling plan is based on grouping.
(d) For estimating average daily PMT and UPT by type of service days, use the sample averages by type of service days.
§ 73.05 How do I determine annual vehicle days actually operated for non-scheduled
services? (a) You should use a spreadsheet or some other mechanism to record the daily number of
passengers carried by individual vehicles in your fleet for an entire year. (a) Figure 73.01 shows an example of such a spreadsheet with the following assumptions:
(1) your fiscal year runs from July 1 through June 30, (2) you operate every day, and (3) your fleet has 100 vehicles.
(b) Once you have such a spreadsheet, you can easily determine the daily number of vehicles operated by type of service days in two steps: (1) For any one operating date, count the number of vehicles in the fleet that carried at
least one passenger on that date. (2) Summarize the daily number of vehicles operated by type of service days.
(c) You can also use such a spreadsheet to determine the number of vehicles operated for each group if your sampling plan is based on service grouping.

36
B C D E F G H I J ··· CZ DA 1
Date Month Day of Week
Daily Passengers Carried by Vehicle No. 2 1 2 3 4 5 6 ··· 100 Total 3 7/1/09 July Wed 4 7/2/09 July Thu 5 7/3/09 July Fri 6 7/4/09 July Sat ··· ··· ··· ···
367 6/30/10 June Wed 368 Total
Figure 73.01. Daily Passenger Count Worksheet for Non-Scheduled Services
Subsection 75 – Rail Services § 75.01 What expansion factor should I use for rail services?
(a) The unit of sampling and measurement you have chosen for your sampling plan determines the expansion factor you should use.
(b) While you could have chosen any unit of sampling measurement for your sampling plan, it most likely is one of the following: (1) One-way car trips. (2) One-way train trips. (3) Round-trip car trips. (4) Round-trip train trips.
(c) The following assumes that your sampling plan is based on one-way car trips. (d) For estimating annual total PMT and UPT:
(1) Use annual total one-way car trips if your sampling plan is not based on grouping. (2) Use annual total one-way car trips by group if your sampling plan is based on
grouping. (e) For estimating average daily PMT and UPT by type of service days, use annual total one-
way car trips by type of service days. (f) For estimating annual total UPT for heavy rail (HR), commuter rail (CR), light rail (LR)
by weekday time period, use annual total one-way car trips by weekday time period. § 75.03 What sample average should I use for rail services?
(a) The unit of sampling and measurement you have chosen for your sampling plan determines the sample average you should use.
(b) While you could have chosen any unit of sampling measurement for your sampling plan, it most likely is one of the following: (1) One-way car trips. (2) One-way train trips. (3) Round-trip car trips. (4) Round-trip train trips.
(c) Assuming that your unit of sampling and measurement is in one-way car trips, Table 75.01 shows the sample averages you should use.

37
Table 75.01. Sample Averages for Rail Services If the service-consumed measure is
and if the measure is
and if your sampling plan is and if your mode is
then you should calculate the following sample average
UPT
for annual total
not based on grouping UPT/one-way car trip
based on grouping UPT/one-way car trip by group
for daily average UPT/one-way car trip by type of service days
by weekday time period
commuter rail (CR), heavy rail (HR), or light rail (LR)
UPT/one-way car trip by weekday time period
PMT for annual total
not based on grouping PMT/one-way car trip
based on grouping PMT/one-way car trip by group
for daily average PMT/one-way car trip by type of service days
§ 75.05 What steps should I follow to calculate sample averages?
(a) Aggregate the field sample data to the individual service units in your sample after you have identified and corrected any errors in the data.
(b) If the unit of sampling and measurement for your sampling plan is one-way car trips, sum these quantities over individual one-way car trips in the sample to get sample totals: (1) by type of service days, (2) by weekday time period, and (3) by group if your sampling plan is based on service grouping.
(c) Count the number of one-way car trips in the sample: (1) by type of service days, (2) by weekday time period, and (3) by group if your sampling plan is based on service grouping.
(d) Divide sample totals by the number of one-way car trips by type of service days, by weekday time period, or by service group if applicable.
§ 75.07 How should I determine annual services actually provided as expansion factors?
(a) You should measure annual services actually provided in the unit of sampling and measurement you have chosen for your sampling plan.
(b) For estimating annual totals of service-consumed data, you should follow these steps: (1) Start with your schedule. (2) When the schedule is changed by policy or by emergency conditions, the count from
the schedule must be adjusted accordingly. (3) You must also include added services such as trippers and other special operations.

38
(4) If your sampling plan is based on service grouping, you must also count annual services actually provided for each group.
(c) For estimating service-consumed data by type of service days, you should also start your schedule, and exclude scheduled services on atypical days.
(d) For estimating annual total UPT for commuter rail (CR), heavy rail (HR), or light rail (LR) by weekday time period, you should start with your weekday schedule, and exclude scheduled services on atypical weekdays.
Subsection 77 – Bus Services § 77.01 What expansion factor should I use for bus services?
(a) The unit of sampling and measurement you have chosen for your sampling plan determines the expansion factor you should use.
(b) While you could have chosen any unit of sampling measurement for your sampling plan, it most likely is in one-way bus trips or in round-trip bus trips.
(c) The following assumes that your sampling plan is based on one-way bus trips. (d) For estimating annual total PMT and UPT:
(1) Use annual total one-way bus trips if your sampling plan is not based on grouping. (2) Use annual total one-way bus trips by group if your sampling plan is based on
grouping. (e) For estimating average daily PMT and UPT by type of service days, use annual total one-
way bus trips by type of service days. § 77.03 What sample average should I use for bus services?
(a) The unit of sampling and measurement you have chosen for your sampling plan determines the sample average you should use.
(b) While you could have chosen any unit of sampling measurement for your sampling plan, it most likely is in one-way bus trips or in round-trip bus trips.
(c) Assuming that your unit of sampling and measurement is in one-way bus trips, Table 77.01 shows the sample averages you should use.
Table 77.01. Sample Averages for Bus Services
If the service-consumed measure is
and if the measure is
and if your sampling plan is
then you should calculate the following sample average
UPT for annual total not based on grouping UPT/one-way car trip
based on grouping UPT/one-way car trip by group
for daily average UPT/one-way car trip by type of service days
PMT for annual total not based on grouping PMT/one-way car trip
based on grouping PMT/one-way car trip by group
for daily average PMT/one-way car trip by type of service days

39
§ 77.05 What steps should I follow to calculate sample averages?
(a) Aggregate the field sample data to the individual service units in your sample after you have identified and corrected any errors in the data.
(b) If the unit of sampling and measurement for your sampling plan is one-way bus trips, sum these quantities over individual one-way bus trips in the sample to get sample totals: (1) by type of service days, (2) by group if your sampling plan is based on service grouping.
(c) Count the number of one-way bus trips in the sample: (1) by type of service days, (2) by group if your sampling plan is based on service grouping.
(d) Divide sample totals by the number of one-way bus trips by type of service days or by service group if applicable.
§ 77.07 How should I determine annual services actually provided as expansion factors?
(a) You should measure annual services actually provided in the unit of sampling and measurement you have chosen for your sampling plan.
(b) For estimating annual totals of service-consumed data, you should follow these steps: (1) Start with your schedule. (2) When the schedule is changed by policy or by emergency conditions, the count from
the schedule must be adjusted accordingly. (3) You must also include added services such as trippers and other special operations. (4) If your sampling plan is based on service grouping, you must also count annual
services actually provided for each group. (c) For estimating service-consumed data by type of service days, you should also start with
your schedule, and exclude scheduled services on atypical days.
Subsection 79 – Estimating Service-Consumed Data § 79.01 How should I estimate the annual total of my service-consumed data?
(a) If your sampling plan is not based on service grouping, you should multiply your sample average for the entire sample with the annual total of your corresponding expansion factor to get an estimate of the annual total.
(b) If your sampling plan is based on service grouping, you should take a two-step approach: (1) Multiply your sample average with your corresponding expansion factor for each
group, and (2) Sum the above products across all groups to get your annual total.
§ 79.03 How should I estimate average daily of service-consumed data by type of service
days? (a) If you operate your service only on weekdays, all you need to do is to divide your
estimated annual total by the number of typical weekday days of service. (b) If you operate your service on Saturdays, Sundays, or both as well, you should take the
following two steps: (1) Multiply your sample average(s) for each type of service days with the corresponding
expansion factor to get the annual total for each type of service days.

40
(2) Divide the annual total for each type of service days by the corresponding number of typical days for each type of service days.
§ 79.05 How should I estimate annual total UPT for each weekday period for commuter
rail, heavy rail, and light rail? (a) For each of the weekday periods, you should simply multiply the sample average you
have calculated for that period by the corresponding expansion factor to get an estimate of the annual total for that weekday period.
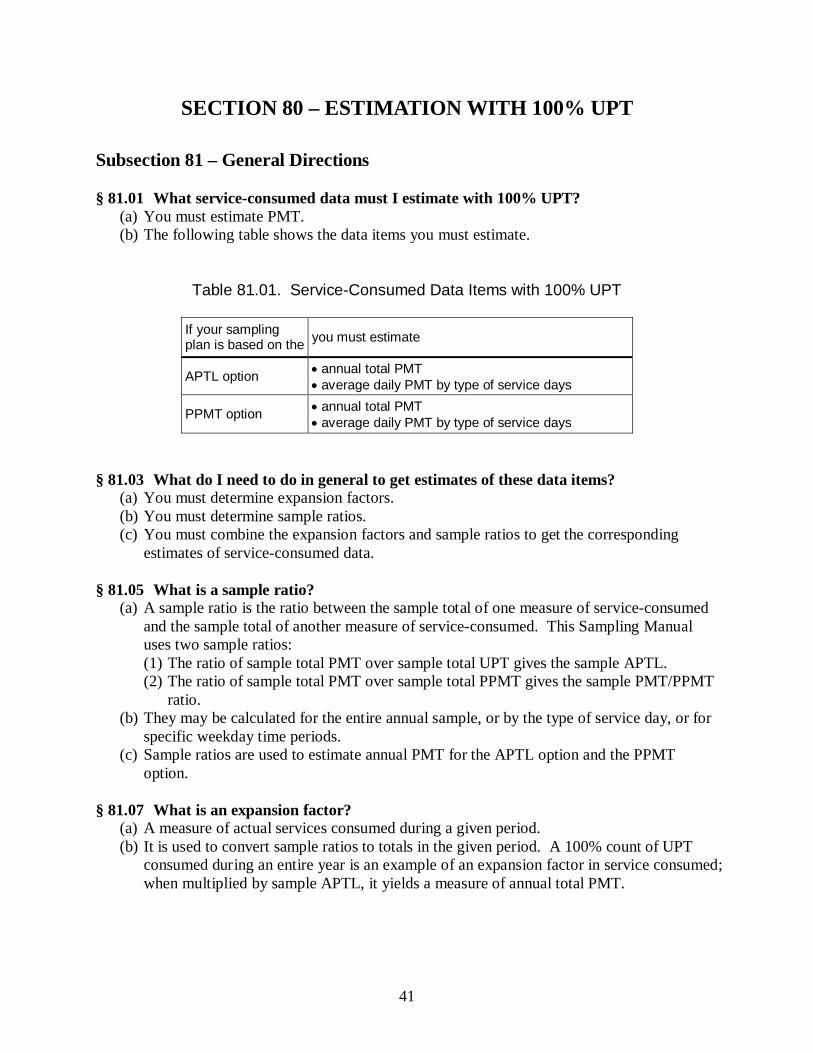
41
SECTION 80 – ESTIMATION WITH 100% UPT
Subsection 81 – General Directions § 81.01 What service-consumed data must I estimate with 100% UPT?
(a) You must estimate PMT. (b) The following table shows the data items you must estimate.
Table 81.01. Service-Consumed Data Items with 100% UPT
If your sampling plan is based on the you must estimate
APTL option • annual total PMT • average daily PMT by type of service days
PPMT option • annual total PMT • average daily PMT by type of service days
§ 81.03 What do I need to do in general to get estimates of these data items?
(a) You must determine expansion factors. (b) You must determine sample ratios. (c) You must combine the expansion factors and sample ratios to get the corresponding
estimates of service-consumed data. § 81.05 What is a sample ratio?
(a) A sample ratio is the ratio between the sample total of one measure of service-consumed and the sample total of another measure of service-consumed. This Sampling Manual uses two sample ratios: (1) The ratio of sample total PMT over sample total UPT gives the sample APTL. (2) The ratio of sample total PMT over sample total PPMT gives the sample PMT/PPMT
ratio. (b) They may be calculated for the entire annual sample, or by the type of service day, or for
specific weekday time periods. (c) Sample ratios are used to estimate annual PMT for the APTL option and the PPMT
option. § 81.07 What is an expansion factor?
(a) A measure of actual services consumed during a given period. (b) It is used to convert sample ratios to totals in the given period. A 100% count of UPT
consumed during an entire year is an example of an expansion factor in service consumed; when multiplied by sample APTL, it yields a measure of annual total PMT.

42
Subsection 83 – APTL Option § 83.01 What expansion factor should I use for the APTL option?
(a) You must use your 100% count of UPT as the expansion factor. (b) For estimating average daily PMT by type of service days, use your annual total 100%
count of UPT by type of service days. (c) For estimating annual total PMT:
(1) Use your annual total 100% count of UPT if your sampling plan is not based on grouping.
(2) Use your annual total 100% count of UPT by service group if your sampling plan is based on grouping and you have reliable 100% counts of UPT by service group and have entered information into the template accordingly in developing your current template sampling plan. Refer to cell M52 of the Input Worksheet in the template you used in developing your current template sampling plan, and it should be 1.
(3) Use your annual total 100% count of UPT if your sampling plan is based on grouping but you do not have reliable 100% counts of UPT by service group and you have entered information into the template accordingly in developing your current template sampling plan. Refer to cell M52 of the Input Worksheet in the template you used in developing your current template sampling plan, and it should be 0.
§ 83.03 What sample ratio should I use for the APTL option?
(a) You must use the sample APTL as the sample ratio. (b) Use sample APTL by type of service days for estimating average daily PMT by type of
service days. (c) For estimating annual total PMT:
(1) Use sample APTL for the entire sample if you do not group your service. (2) Use sample APTL for each group if your sampling plan is based on grouping and you
have reliable 100% counts of UPT by service group and have entered information into the template accordingly in developing your current template sampling plan. Refer to cell M52 of the Input Worksheet in the template you used in developing your current template sampling plan, and it should be 1.
(3) Use weighted sample APTL for the entire sample if your sampling plan is based on grouping but you do not have reliable 100% counts of UPT by service group and you have entered information into the template accordingly in developing your current template sampling plan. Refer to cell M52 of the Input Worksheet in the template you used in developing your current template sampling plan, and it should be 0.
§ 83.05 How should I determine the APTL from my sample?
(a) You must determine the sample APTL for a given sample as the ratio of sample total PMT over sample total UPT for the following cases: (1) for the entire sample, (2) by type of service days, or (3) by service group.
(b) You must not determine the sample APTL as the average of the APTL across individual service units in the sample.

43
(c) To determine the weighted sample APTL for an entire sample as required by question §83.03(c)(3), you should follow these steps: (1) Determine each group’s size in the number of service units actual operated. (2) Compute each group’s share of the number of service units actually operated. These
shares must sum to 1. (3) Determine each group’s sample size in the number of service units in the sample. (4) Determine each group’s sample total UPT. (5) Determine each group’s sample total PMT. (6) Compute each group’s sample average for UPT. (7) Compute each group’s sample average for PMT. (8) Sum the product of each group’s share of the number of service units actually
operated and its sample average UPT (9) Sum the product of each group’s share of the number of service units actually
operated and its sample average PMT (10) Compute the ratio of the result from (9) to the result from (8). This ratio gives the
weighted sample APTL. (11) Table 83.01 shows these steps with an example.
Table 83.01. Example of Estimating Weighted Sample APTL
Step Description Service Groups
Short Routes Medium Routes Long Routes 1 Group size in service units 109,685 331,033 35,325 2 Group size in shares 0.2304 0.6954 0.0742 3 Sample size 116 386 47 4 Sample total UPT 1,157 8,181 1,592 5 Sample total PMT 3,989 42,966 7,003 6 Sample average UPT 10.0 21.2 33.9 7 Sample average PMT 34.4 111.3 149.0 8 Weighted sample average UPT 19.55 9 Weighted sample average PMT 96.38 10 Weighted sample APTL 4.93
§ 83.07 How should I estimate annual total PMT for the APTL option?
(a) If your sampling plan is not based on service grouping, you should multiply your sample APTL for the entire annual sample with your corresponding annual expansion factor (i.e., 100% count of annual UPT) to get an estimate of the annual total PMT.
(b) You should take a two-step approach if your sampling plan is based on service grouping and you have reliable 100% counts of UPT by service group: (1) Multiply your sample APTL with your corresponding expansion factor for each group,
and (2) Sum the above products across all groups to get your annual total PMT.
(c) If your sampling plan is based on service grouping but you do not have reliable 100% counts of UPT by service group, you should multiple your weighted sample APTL as computed in question §83.05 with your 100% count of annual UPT.

44
(d) If your sampling plan is based on service grouping, refer to cell M52 of the Input Worksheet in the template you used in developing your template sampling plan for what you have entered into cell M52 on whether you have reliable 100% count of UPT by service group.
§ 83.09 How should I estimate average daily PMT by type of service days?
(a) If you operate your service only on weekdays, all you need to do is to divide your estimated annual total PMT by the number of typical weekday days of service.
(b) If you operate your service on Saturdays, Sundays, or both as well, you should take the following two steps: (1) Multiply your sample average APTL for each type of service days with the
corresponding 100% count of UPT to get the annual total PMT for each type of service days.
(2) Divide the estimated annual total PMT for each type of service days by the corresponding number of typical days for each type of service days.
Subsection 85 – PPMT Option § 85.01 What expansion factor should I use for the PPMT option?
(a) You must use your 100% count of PPMT as the expansion factor. (b) For estimating annual total PMT:
(1) Use annual total PPMT if your sampling plan is not based on grouping. (2) Use annual total PPMT by group if your sampling plan is based on grouping.
(c) For estimating average daily PMT by type of service days, use annual total PPMT by type of service days.
§ 85.03 How do I determine annual total PPMT?
(a) Suppose that: (1) Your unit of sampling and measurement is one-way bus trips, and (2) You are going to estimate annual total PMT.
(b) You should do the following for each route: (1) Determine the annual number of vehicle revenue miles for the report year. (2) Determine the annual number of vehicle revenue one-way trips for the report year. (3) Divide the annual number of vehicle revenue miles by the annual number of vehicle
revenue one-way trips to get the average route length. (4) Multiply your route-level 100% counts of UPT with the calculated average route
length to get route-level PPMT. (c) You should sum the calculated route-level PPMT across all routes to get your annual
PPMT for all routes. (d) Table 85.01 illustrates how you may accomplish (b) and (c).

45
Table 85.01. Calculating Annual Total PPMT for All Operating Routes
Route Number Route Name
Annual Revenue
Trips
Annual Revenue
Miles
Average Route
Length
100% UPT
100% PPMT
90 Blue Line 3,869 9,975 2.58 22,866 58,952 50 Red Line 3,286 10,310 3.14 23,634 74,148 14 Prospect 1,643 10,690 6.51 24,506 159,446 12 Beechcrest 1,643 11,835 7.20 27,131 195,435 17 College 3,286 30,666 9.33 70,298 656,036 37 Park 100 1,325 22,733 17.16 52,112 894,068 8 Washington 3,392 61,077 18.01 140,012 2,521,072 19 Castleton 1,696 32,916 19.41 75,457 1,464,491 26 Keystone 1,378 28,505 20.69 65,344 1,351,666 10 10th St. 3,339 69,897 20.93 160,231 3,354,198
Total 10,729,514
(e) If your sampling plan is based on service grouping, you must also determine PPMT for each group. Suppose, for example, that you have grouped your short routes into one group and your longer routes into another. Table 85.03 illustrates how you may use route-level information on annual revenue miles, annual revenue trips, and annual UPT to determine PPMT for each group.
Table 85.03. Calculating Annual Total PPMT by Route Group
Route Group
Route Number
Annual Revenue
Trips
Annual Revenue
Miles
Average Route
Length
100% UPT
100% PPMT
Sho
rt R
oute
s 90 3,869 9,975 2.58 22,866 58,952 50 3,286 10,310 3.14 23,634 74,148 14 1,643 10,690 6.51 24,506 159,446 12 1,643 11,835 7.20 27,131 195,435 17 3,286 30,666 9.33 70,298 656,036
Total 1,144,018
Long
Rou
tes 37 1,325 22,733 17.16 52,112 894,068
8 3,392 61,077 18.01 140,012 2,521,072 19 1,696 32,916 19.41 75,457 1,464,491 26 1,378 28,505 20.69 65,344 1,351,666 10 3,339 69,897 20.93 160,231 3,354,198
Total 9,585,496 § 85.05 How should I get the sample total of PPMT for each service unit?
(a) You should follow the guidance for question § 85.03 to determine the average route length for each route.

46
(b) Identify the route for each one-way trip in your service units in the sample. (c) Multiply the sample UPT by the average route length for each one-way trip to get sample
PPMT for each one-way trip. (d) Sum the trip-level PPMT for all one-way trips in a service unit to get sample PPMT for
each service unit. § 85.07 What sample ratio should I use for the PPMT option?
(a) You must use the ratio of sample total PMT over sample total PPMT as the sample ratio. (b) For estimating annual total PMT:
(1) Use sample PMT/PPMT ratio for the entire sample if you do not group your service. (2) Use sample PMT/PPMT for each group if your sampling plan is based on grouping.
(c) For estimating average daily PMT by type of service days, use the sample PMT/PPMT ratio by type of service days.
§ 85.09 How should I determine the PMT/PPMT ratio for a sample?
(a) You must determine the sample PMT/PPMT ratio for a given sample as the ratio of sample total PMT over sample total PPMT.
(b) You must not determine the sample ratio as the average of the PMT/PPMT ratio for individual service units in the sample.
§ 85.11 How should I estimate annual total PMT for the PPMT option?
(a) You should multiply your sample PMT/PPMT ratio for the entire annual sample with the annual total of your PPMT to get an estimate of the annual total PMT if your sampling plan is not based on service grouping, or
(b) You should take a two-step approach if your sampling plan is based on service grouping: (1) Multiply your sample PMT/PPMT ratio with your corresponding annual total PPMT
for each group, and (2) Sum the above products across all groups to get your annual total PMT.
§ 85.13 How should I estimate average daily PMT by type of service days?
(a) If you operate your service only on weekdays, all you need to do is to divide your estimated annual total PMT by the number of typical weekday days of service.
(b) If you operate your service on Saturdays, Sundays, or both as well, you should take the following two steps: (1) Multiply your sample PMT/PPMT ratio for each type of service days with the
corresponding annual total PPMT to get the annual total PMT for each type of service days.
(2) Divide the annual total PMT for each type of service days by the corresponding number of typical days for each type of service days.

47
SECTION 90 – APPENDIXES
Appendix 91 – Definitions § 91.01 What do the sampling-related terms mean?
Alternative sampling plan
. A sampling plan that reflects the conditions of your service, and is independently developed and certified by a qualified statistician to meet FTA’s 95% confidence and 10% precision levels. It is one of two forms of customized sampling plans. The other form is template sampling plans.
Base sample
. The sample data that you used in developing your current customized sampling plan.
Confidence level
. The chance of an estimate of service-consumed data obtained through random sampling falling within a particular range of the true value. FTA requires a minimum level of 95% confidence for estimates of annual UPT and annual PMT reported to the NTD. A particular confidence level is only meaningful when it is stated with a particular precision level.
Current sample
. The sample data that you are collecting with your current customized sampling plan and you may use to develop a new customized sampling plan for your future sampling years.
Customized sampling plan.
A sampling plan that reflects the conditions of your service and meets FTA’s 95% confidence and 10% precision levels. It is either a template sampling plan or an alternative sampling plan. It differs from a ready-to-use sampling plan or a transitional sampling plan in that it takes account of the specific characteristics of your service.
Efficiency option
. A characteristic of a sampling plan that affects its sampling efficiency.
Initial annual sample size
. The annual necessary sample size of a template sampling plan that is determined from the companion spreadsheet template before it is allocated to each quarter, month, or week. This can differ from the realized annual sample size for a given set of sample data.
Mandatory revising year
. A report year for which you must consider whether you need to revise your customized sampling plan.
Mandatory sampling year
. A report year for which you must estimate a measure of annual service-consumed data through random sampling if you do not report a 100% count of that measure.
Margin of safety. A percent increase in the statistical variation of your sample data in developing a customized sampling plan. For example, if the statistical variation of your sample is S and the margin of safety is 25%, you must use 1.25S as the statistical variation in

48
developing your customized sampling plan. A margin of safety of 25% is used automatically for all template sampling plans. If you develop alternative sampling plans, you should also use this margin of safety. The objective is to counter the potential fluctuations in the statistical variation in a sample from one year to another due to sampling and other reasons. Major change to a service
. Any change to your service that is likely to lead to major changes in how your customers use your service. Examples of major changes include making transfers fare free; adding or cutting express routes; expanding or contracting your service by more than 25% in vehicle revenue miles; or restructuring your service affecting more than 25% of your service in vehicle revenue miles.
Necessary sample size
. The sample size that meets FTA’s minimum 95% confidence and 10% precision levels and uses a 25% margin of safety.
Precision level
. The degree of errors in an estimate of service-consumed data obtained through random sampling that is stated in percentage terms relative to the true value. FTA requires a minimum of 10% precision for estimates of annual service-consumed data reported to the NTD. A particular precision level is only meaningful if it is stated with a particular confidence level.
Qualified statistician
. An individual who has an adequate working knowledge and education in statistics for determining if an alternative sampling plan meets FTA's 95% confidence and 10% precision levels.
Random sampling
. Selection of one or more service units at random from a list of service units to be operated.
Ready-to-use sampling plan
. A sampling plan that has been developed specifically for this Sampling Manual with sample data from a variety of transit agencies. It does not necessarily reflect the conditions of your service. Ready-to-use sampling plans have limited applicability.
Realized annual sample size
. The annual necessary sample size of a template sampling plan that is based on quarterly, monthly, or weekly sampling. For example, if you choose weekly sampling and your template sampling plan requires 3 one-way trips per week, the realized annual sample size would be 156 one-way trips.
Sample size
. The number of service units that are sampled, and for which unlinked passenger trips and passenger miles traveled are measured.
Sampling efficiency
. The degree to which a sampling plan minimizes the necessary sample size for meeting FTA’s confidence and precision levels. Sampling plans that take advantage of certain characteristics of your service can sometimes require a smaller necessary sample size. A smaller necessary sample size reduces the time and cost of sampling, data collection, and data processing.

49
Sampling frequency
. The number of times per year that a sample is drawn; in this Manual, sampling frequency is quarterly, monthly, or weekly. For example, if your sampling plan requires 10 service units per month, before the current month ends you must select at least 10 at random from the full list of all service units to be operated during the next month.
Sampling plan
. A plan for selecting service units at random, for collecting sample data, and for estimating annual service-consumed data that meets FTA’s 95% confidence and 10% precision levels. Each sampling plan consists of four elements: a unit of sampling and measurement, a set of efficiency options, a sampling frequency, and a necessary sample size.
Sampling without replacement
. Selection of a sample of service units at random without the chance of a single service unit being selected more than once.
Sampling year
. Any report year for which you obtained annual UPT, annual PMT, or both through random sampling that meet FTA’s 95% confidence and 10% precision levels. It can be a mandatory sampling year or an intermediate report year for which you choose to sample.
Service grouping
. One efficiency option for which you divide your service into two or more groups with the objectives of reducing within-group differences and increasing between-group differences. For example, separating your bus routes into express routes and local routes is likely to reduce differences in average passenger trip length across one-way bus trips within each group.
Service unit
. An amount of revenue travel by a single transit vehicle, a set of transit vehicles, or a component of a transit vehicle. For non-scheduled services, it is typically one vehicle day. For scheduled bus services it is typically either a one-way bus run or else a round-trip bus run. For rail services, it is either a one-way car run, a one-way train run, or a round-trip car run or a round-trip train run.
Statistical variation
. The degree of differences in a quantity across the full list of service units operated during a given period, such as differences in PMT across all one-way trips of a bus service in a full report year. A larger variation requires a greater sample size to meet given confidence and precision levels.
Table of random numbers
. A list of integers whose frequency and order of appearance in the list have been determined entirely by chance. It is the basis of a commonly used method of random sampling.
Template sampling plan
. A sampling plan that is developed with the companion template of this Sampling Manual.
Transitional sampling plan
. A sampling plan for bus services that you may use within the first 6 years of implementing this Manual to help you with the transition from UMTA C 2710.1A.
Unit of sampling and measurement. A service unit you choose for your sampling plan.

50
§ 91.03 What do the data-collection terms mean? Arriving load
. The number of passengers onboard a transit vehicle as it arrives at a stop.
Automatic passenger counter
. An automated means of counting passengers as they board or alight transit vehicles with treadle mats, infrared beams, or other devices placed by the doors of a transit vehicle.
Calculated load
. The number of passengers onboard a transit vehicle as it arrives at or leaves a stop that you calculate from data on boardings and alightings at individual stops. It should equal the observed load.
Commuter vanpool
. A common form of vanpool service (VP) that comprises vans, small buses and other vehicles operating as a ridesharing arrangement, providing transportation to a group of workers commuting directly between their homes and their regular work sites within the same geographical area. The vehicles would not be in revenue service during the working hours of the participating workers.
Distance-based approach
. A method to obtain PMT that keeps track of the distance traveled by every passenger.
Hand-held device
. A small electronic device that may be used by ride-checkers to enter sample data while onboard a transit vehicle.
Internal sample
. A sample of service units you select at random according to a sampling plan that meets your own statistical requirements. Typically such an internal sample is collected to estimate monthly UPT for internal planning purposes.
Leaving load
. The number of passengers onboard a transit vehicle as it leaves a stop.
Load-based approach
. A method to obtain PMT that is based on the boardings and alightings at individual stops.
NTD sample
. The sample of service units you select at random according to your sampling plan that meets FTA’s 95% confidence and 10% precision levels for reporting to the NTD.
Observed load
. The number of passengers onboard a transit vehicle as observed directly by a ride-checker while onboard that transit vehicle.
Ride check
. A method of collecting sample data with one or more persons observing and recording passenger activities while riding in a transit vehicle.
Stop
. Any spatial location at which a transit vehicle allows passengers to board or alight from the vehicle.
Vehicle trip length. The total distance traveled by a transit vehicle during a one-way trip for scheduled services. For example, the cumulative distance traveled from the beginning point

51
to the end point of a particular alignment of a route is the vehicle trip length for this trip. The vehicle trip length may vary by direction and alignment for a given route.
§ 91.05 What do the estimation-related terms mean? 100% count
. A method of obtaining service-consumed data. This term also often refers to the results of a 100% count. For UPT, it involves counting passengers each time they board a transit vehicle in revenue service, such as through a registering farebox. For PMT, it involves recording the distance traveled by all passengers. A 100% count of PMT is typically only possible for systems that have only two stops, for rail systems that record entry and exit from the system, or for rail systems that rely upon destination-based tickets.
Average passenger trip length (APTL)
. The average distance traveled for an unlinked passenger trip. It is calculated as PMT divided by UPT.
Average route length
. The average length of a route actually traveled by vehicles in scheduled services. It is calculated by dividing the annual vehicle revenue miles by the number of annual vehicle revenue one-way trips for that route.
Expansion factor
. A measure of actual services operated or consumed during a given period. It is used to convert a sample average to the total of service-consumed data during that period. It varies with sampling plans. The total number of one-way bus trips operated during an entire report year is an example of an expansion factor; when multiplied by the sample average PMT per one-way bus trip derived from annual NTD sample, it yields a measure of annual total PMT.
Passenger miles traveled (PMT)
. The total distance traveled by all passengers during a given period.
Potential passenger miles traveled
. The maximum number of passenger miles that could have been traveled by all passengers along a given fixed route during a year (or some other time period.) It is calculated by multiplying a 100% count of UPT times the average route length of that route during that period.
Sample average
. The sample total divided by the number of service units in the sample. It may be calculated for the entire annual sample, or by the type of service day, or for specific weekday time periods. For example, dividing the total PMT in an annual NTD sample by the total number of one-way bus trips in the annual NTD sample gives a sample average PMT.
Sample data
. The data collected from a sample of service units according to a sampling plan that meets FTA’s 95% confidence and 10% precision levels.
Sample ratio. The ratio of the sample total for one measure of service-consumed over the sample total for another measure of service-consumed. For example, the ratio of the sample data for PMT over the sample total for UPT gives the sample APTL. It may be calculated for the entire annual sample, or by the type of service days, or for individual service group if your sampling plan is based on service grouping.

52
Sample total
. The sum total of all data across the service units in a random sample. For example, if you are sampling for PMT, the PMT sample total is the sum of the PMT collected for each of the one-way bus trip in the sample. It may be calculated for the entire annual sample, or by the type of service day, or for specific weekday time periods.
Service-consumed data
. Passenger miles traveled and unlinked passenger trips.
Type of service days
. Weekdays, Saturdays, or Sundays. For scheduled services, service days in a report year are classified according to the schedule operated on that day. If a weekday that is a holiday is served with a Sunday schedule, that weekday is considered to be a Sunday. For non-scheduled services, service days are the actual days of a week regardless of whether they are a holiday or not.
Typical day
. For your scheduled services, it is a day on which you operate your normal, regular schedule and there are no anomalies such as extra service added for a special event or reduced service as a result of weather or interruption. For your non-scheduled services, it is any day of operation.
Unlinked passenger trips (UPT)
. The number of passengers who board transit vehicles in revenue service. Passengers are counted each time they board a vehicle, no matter how many vehicles they use to travel from their origin to their destination.
Weekday time periods
. Weekday AM Peak, Weekday Midday, Weekday PM Peak, and Weekday Other. The Reporting Manual instructs how you should define the start and end points of each period.
§ 91.07 What do the reporting terms mean? Auditable record
. Documentation of information collected and processes used in collecting that information that demonstrates your compliance with NTD requirements. Such
documentation may also help quality control within your agency when your NTD staff change over time. First-time reporting
. Reporting of a particular service to the NTD for the first time.
Intermediate report year
. A report year for which you are not required to estimate annual service-consumed data through random sampling.
§ 91.09 What abbreviations for general terms are used in this Manual? APTL
. Average passenger trip length in miles
APC
. Automatic passenger counter
FTA
. Federal Transit Administration

53
NTD
. National Transit Database
PMT
. Passenger miles traveled
PPMT
. Potential passenger miles traveled
UPT
. Unlinked passenger trips
§ 91.11 What abbreviations for NTD modes are used in this Manual? AG
. Automated guideway
CR
. Commuter rail
DR
. Demand response
HR
. Heavy rail
JT
. Jitney
LR
. Light rail
MB
. Motorbus
MR
. Monorail
PB
. Público
VP
. Vanpool

54
Appendix 92 – Distance-Based Survey Sheet
Distance-Based Survey Sheet
(1) Survey Date _________________ (2) Day of Week _____________________
(3) Survey Vehicle No. ___________ (4) Driver No. _______________________
(5) (6) (7) (8) (9)
No. of Pass. Pick-UP Location
Pick-UP Odometer Reading
Drop-Off Location Drop-Off
Odometer Reading
Page

55
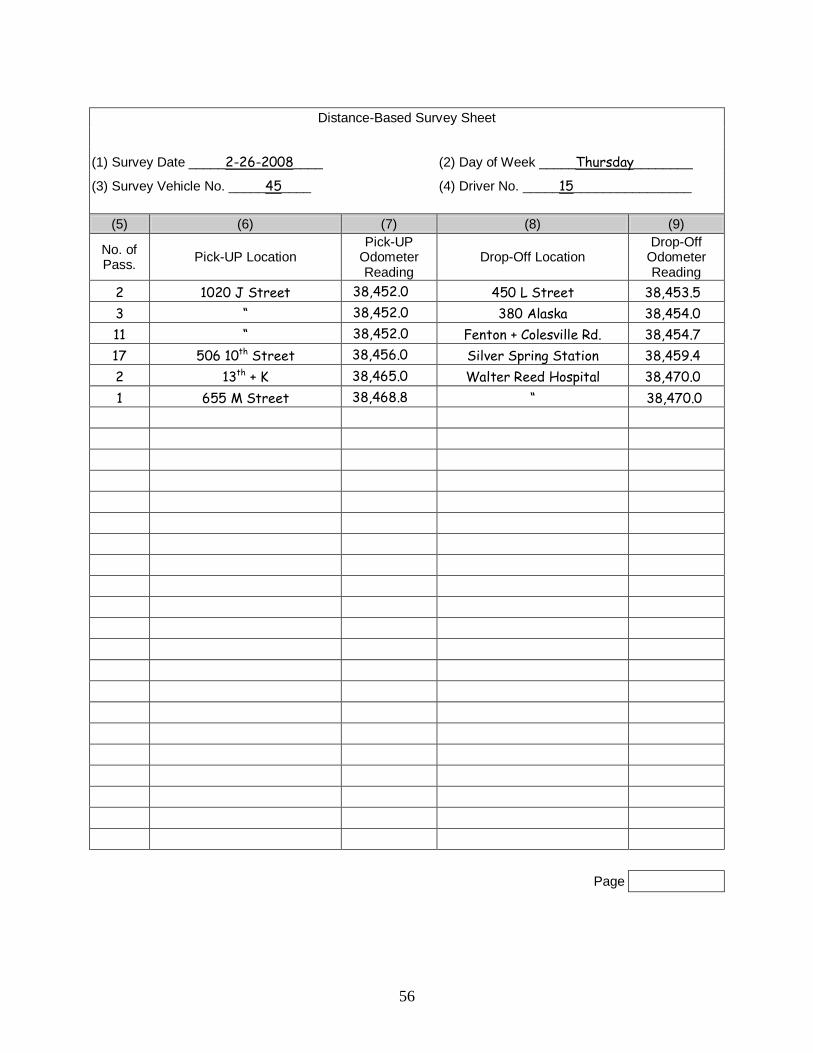
56
Distance-Based Survey Sheet
(1) Survey Date _____2-26-2008 ____ (2) Day of Week _____Thursday________
(3) Survey Vehicle No. _____45 ____ (4) Driver No. _____15________________
(5) (6) (7) (8) (9)
No. of Pass. Pick-UP Location
Pick-UP Odometer Reading
Drop-Off Location Drop-Off
Odometer Reading
2 1020 J Street 38,452.0 450 L Street 38,453.5 3 “ 38,452.0 380 Alaska 38,454.0 11 “ 38,452.0 Fenton + Colesville Rd. 38,454.7 17 506 10th 38,456.0 Street Silver Spring Station 38,459.4 2 13th 38,465.0 + K Walter Reed Hospital 38,470.0 1 655 M Street 38,468.8 “ 38,470.0 Page

57
Appendix 93 – Load-Based Survey Sheet for Demand Response
Load-Based Survey Sheet for Demand Response
(1) Survey Date _______________________ (2) Day of Week _______________________
(3) Vehicle No. ________________________ (4) Driver No. _________________________
(5) (6) (7) (8) Activity Location Description Odometer Reading Leaving Load
1 584.9 2 585.1 3 585.7 4 585.8 5 586.3 6 586.7 7 586.9 8 587.3 9 587.5
10 587.8 11 588.2 12 589.0 13 589.9 14 590.3 16 590.6 17 593.2 18 594.5
Page

58
Load-Based Survey Sheet for Demand Response
(1) Survey Date _____2/26/2008 (2) Day of Week ______________ Thursday__________
(3) Vehicle No. _____54 (4) Driver No. ______________________ 15__________________
(5) (6) (7) (8) Activity Location Description Odometer Reading Leaving Load Pick-up 1020 J Street 38,452.0 16 Drop-off 450 L Street 38,453.5 14 Drop-off 380 Alaska 38,454.0 11 Drop-off Fenton + Colesvill Rd 38,454.7 0 Pick-up 506 10th Street 38,456.0 17 Drop-off Silver Spring Station 38,459.4 0 Pick-up 13th + K 38,465.0 2 Pick-up 655 M Street 38,468.6 3 Drop-off Walter Reed Hospital 38,470.0 0
6 586.7 7 586.9 8 587.3 9 587.5
10 587.8 11 588.2 12 589.0 13 589.9 14 590.3 16 590.6 17 593.2 18 594.5
Page
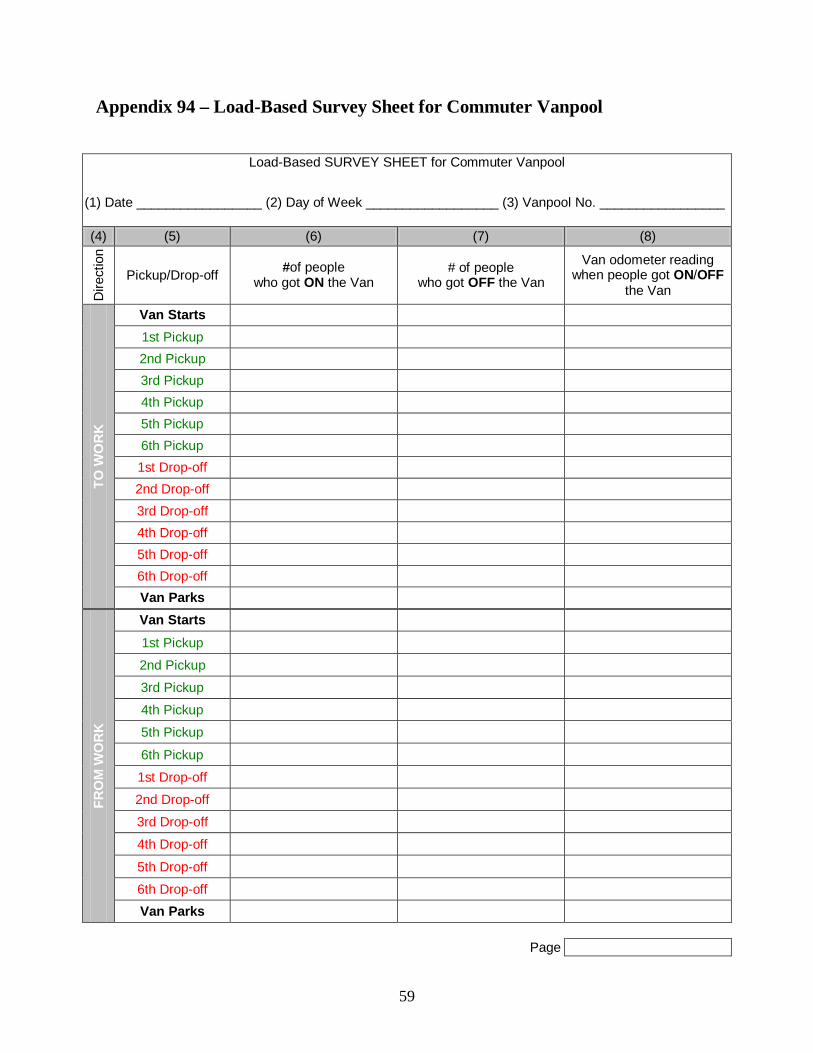
59
Appendix 94 – Load-Based Survey Sheet for Commuter Vanpool
Load-Based SURVEY SHEET for Commuter Vanpool
(1) Date _________________ (2) Day of Week __________________ (3) Vanpool No. _________________ (4) (5) (6) (7) (8)
Dire
ctio
n
Pickup/Drop-off #of people who got ON the Van
# of people who got OFF the Van
Van odometer reading when people got ON/OFF
the Van
TO W
OR
K
Van Starts 1 29366.0 1st Pickup 5 29369.1 2nd Pickup 3rd Pickup 4th Pickup 5th Pickup 6th Pickup 1st Drop-off 3 29395.3 2nd Drop-off 1 29396.8 3rd Drop-off 1 29397.5 4th Drop-off 5th Drop-off 6th Drop-off Van Parks 1 29405.0
FRO
M W
OR
K
Van Starts 1 29405.0
1st Pickup
2nd Pickup
3rd Pickup
4th Pickup 1 29412.5
5th Pickup 1 29413.2
6th Pickup 3 29414.7
1st Drop-off
2nd Drop-off
3rd Drop-off
4th Drop-off
5th Drop-off
6th Drop-off 5 29440.9 Van Parks 1 29444.0
Page

60

61
Load-Based SURVEY SHEET for Commuter Vanpool
(1) Date ____2-26-2008____ (2) Day of Week _____Thursday_____ (3) Vanpool No. _____28706_______ (4) (5) (6) (7) (8)
Dire
ctio
n
Pickup/Drop-off #of people who got ON the Van
# of people who got OFF the Van
Van odometer reading when people got ON/OFF
the Van
TO W
OR
K
Van Starts 1 29,366.0 1st Pickup 5 369.1 2nd Pickup 3rd Pickup 4th Pickup 5th Pickup 6th Pickup 1st Drop-off 3 395.3 2nd Drop-off 1 396.8 3rd Drop-off 1 397.5 4th Drop-off 5th Drop-off 6th Drop-off Van Parks 1 405.0
FRO
M W
OR
K
Van Starts 1 29,405.0 1st Pickup 2nd Pickup 3rd Pickup 4th Pickup 1 412.5 5th Pickup 1 413.2 6th Pickup 3 414.7 1st Drop-off 2nd Drop-off 3rd Drop-off 4th Drop-off 5th Drop-off 6th Drop-off 5 440.9 Van Parks 1 444.0
Page

62
Appendix 95 – Load-Based Survey Sheet for Fixed-Route Service
Load-Based Survey Sheet for Fixed-Route Service
(1) Date ___________________ (2) Day of Week ____________________ (3) Time Period ____________________
(4) Route No. ____________________ (5) Trip No. ___________________ (6) Direction ______________________
(7) (8) (9) (10) (11) (12) (13) (14)
Stop ID Stop Description
Odometer Reading (to
10thNo. of Pass.
Boarded of a
mile)
No. of Pass.
Alighted
No. of Pass. On
Board (Leaving
Load)
No. of Pass. from Previous
Trip (Stop 1 only)
No. of Pass. Continuing to Next Trip (Last Stop
only)
Page

63
Load-Based Survey Sheet for Fixed-Route Service
(1) Date ____10-13-2005_____ (2) Day of Week _____Thursday_______ (3) Time Period _____Midday_________
(4) Route No. _____11_____________ (5) Trip No. _____408___________ (6) Direction _____Outbound_________
(7) (8) (9) (10) (11) (12) (13) (14)
Stop ID Stop Description
Odometer Reading (to
10th of a mile)
No. of Pass.
Boarded
No. of Pass.
Alighted
No. of Pass. On
Board (Leaving
Load)
No. of Pass. from Previous
Trip (Stop 1 only)
No. of Pass. Continuing to Next Trip (Last Stop
only) 1 Plaza 41,214.8 20 0 20 2 2 City Hall 215.1 2 1 21 3 Bloxham / Adams 215.8 0 2 19 4 FAMU # 1 216.4 1 3 17 5 FAMU # 2 216.7 1 10 8 6 FAMU # 3 217.2 0 2 6 7 Lake Bradford / Kissimmee 218.0 0 1 5 8 Indian River / Levy 218.2 0 2 3 9 Hillsborough / Levy 218.3 0 2 1 10 Alumin Village / Levy 218.4 0 0 1 11 Iamonia / Levy 218.7 0 0 1 12 Iamonia / McCaskill 218.8 0 1 1 1
Page

64
Appendix 96 – Daily Log Sheet for Commuter Vanpool
Daily Log Sheet for Commuter Vanpool
(1) Month __August 2008__________ (2) Vanpool No. ____578___________
(3) (4) (5) (6)
Date No. of Riders to Work No. of Riders from Work Total One-Way Trips
1 ///// // ///// / 13 2 3 4 5 6 7 8 9 10 11 12 13 14 15 16 17 18 19 20 21 23 24 25 26 27 28 29 30 31

65
Appendix 97 – Full Table of Contents
SECTION 10 – GENERAL DIRECTIONS ............................................................................... 2 § 10.01 What is the purpose of this Sampling Manual? ................................................................ 2 § 10.03 What procedures does this Sampling Manual cover? ....................................................... 2 § 10.07 May I continue using the sampling plans in Circulars 2710.1A and 2710.2A? ................. 2 § 10.09 May I use alternative sampling plans? ............................................................................. 2 SECTION 40 – READY-TO-USE SAMPLING PLANS ........................................................... 3 Subsection 41 – General Directions ............................................................................................ 3 § 41.01 Under what conditions may I use ready-to-use sampling plans? ....................................... 3 § 41.03 If I am using a ready-to-use sampling plan this year, may I use it again for my next
report year? ..................................................................................................................... 3 § 41.05 For what modes are ready-to-use sampling plans available? ............................................ 3 § 41.07 What sampling options are available? .............................................................................. 3 Subsection 43 – Sampling Plans.................................................................................................. 4 § 43.01 What sampling plans are available for non-scheduled services? ....................................... 4 § 43.03 What ready-to-use sampling plans are available for bus services? .................................... 5 § 43.05 How does grouping of my bus routes affect sampling and estimation procedures? ........... 5 § 43.07 What sampling plans are available for commuter rail? ..................................................... 6 § 43.09 What sampling plans are available for other rail modes?.................................................. 6 SECTION 50 – TEMPLATE SAMPLING PLANS ................................................................... 7 Subsection 51 – General Directions ............................................................................................ 7 § 51.01 Under what conditions should I develop a template sampling plan for next year? ............ 7 § 51.03 Does this Manual have a companion tool that I may use? ................................................ 7 § 51.05 What is the scope of this template? .................................................................................. 7 § 51.07 Do I need to have knowledge of statistics to use this template? ........................................ 7 Subsection 52 – Options .............................................................................................................. 7 § 52.01 What types of options does this template provide in its sampling plans? .......................... 7 § 52.03 Must I pick a specific unit of sampling and measurement to use this template? ................ 7 § 52.05 What options does this template provide on sampling frequency? .................................... 8 § 52.07 What should I consider in choosing a sampling frequency? ............................................. 8 § 52.09 What efficiency options does the template include? ......................................................... 8 § 52.11 Which of these efficiency options are available to me? .................................................... 9 § 52.13 How do I divide my scheduled service if I want to consider the grouping option?............ 9 § 52.15 How do I group my vanpool service if I serve commuters only? .................................... 10 § 52.17 What should I consider in general when I consider grouping my service? ...................... 10 Subsection 53 – Input Data ....................................................................................................... 10 § 53.01 What data must I have to use this template?................................................................... 10 § 53.03 What other data do I need to use this template? ............................................................. 11 § 53.05 What sample data should I use to develop template sampling plans for next year? ......... 11 § 53.07 How does this template deal with fluctuations in sample data from one year to another
for a given service? ....................................................................................................... 11 § 53.09 Why do such annual fluctuations in sample data require a margin of safety? ................. 12

66
Subsection 54 – Usage and Output ........................................................................................... 12 § 54.01 How do I use this template?........................................................................................... 12 § 54.03 What does the template output include? ......................................................................... 12 Subsection 55 – Selecting a Sampling Plan .............................................................................. 12 § 55.01 What should I consider in selecting one from the set of template sampling plans? ......... 12 § 55.03 Should I keep a copy of the used template that contains my sample data and my chosen
template sampling plan? ................................................................................................ 13 § 55.05 How does my choice of efficiency options affect my choice of estimation methods? ..... 13 § 55.07 May I change template sampling plans from one report year to another? ....................... 13 § 55.09 May I change sampling plans during a report year? ....................................................... 13 § 55.11 How should I implement a template sampling plan? ...................................................... 14 Subsection 56 – Revision ........................................................................................................... 14 § 56.01 When does this subsection apply to me? ........................................................................ 14 § 56.03 Why do I need to consider revision? .............................................................................. 14 § 56.05 Under what conditions should I revise my template sampling plan?............................... 14 § 56.07 How do I know if next year is a mandatory revising year for me? .................................. 15 § 56.09 What are considered major changes to my service? ....................................................... 15 § 56.11 What information do I need to determine whether I must revise my current template
sampling plan? .............................................................................................................. 15 § 56.13 How do I get these two pieces of information from my samples? ................................... 15 § 56.15 How should I use these two pieces of information? ....................................................... 16 Subsection 57 – Certification .................................................................................................... 18 § 57.01 How do I certify my template sampling plan? ................................................................ 18 SECTION 60 – DATA COLLECTION.................................................................................... 19 Subsection 61 – General Directions .......................................................................................... 19 § 61.01 What are the basic elements of collecting sample data? ................................................. 19 § 61.03 What criteria does this section cover to ensure that estimates of annual service-
consumed data meet FTA’s 95% confidence and 10% precision levels? ........................ 19 Subsection 63 – Selecting a Sample at Random ....................................................................... 19 § 63.01 What are the basic elements of selecting a sample at random? ....................................... 19 § 63.03 What method may I use for random sampling? .............................................................. 19 § 63.05 What is a table of random numbers? .............................................................................. 19 § 63.07 What is the list of all service units that I expect to operate? ........................................... 20 § 63.09 How do I develop the list of all service units for using a table of random numbers? ....... 20 § 63.11 How do I use a table of random numbers? ..................................................................... 21 § 63.13 What are the pros and cons of using a table of random numbers? .................................. 22 § 63.15 What information should I keep from my sampling process? ......................................... 22 Subsection 65 – Collecting Data from the Random Sample .................................................... 22 § 65.01 What method may I use to collect the sample data? ....................................................... 22 § 65.03 What approach may I use to determine PMT for each service unit of my sample? ......... 22 § 65.05 What data items must I collect to use the load-based approach for scheduled services? . 23 § 65.07 What data must I collect to use the load-based approach for non-scheduled services? .... 23 § 65.09 How should I determine between-stop distances for the load-based approach? .............. 23 § 65.11 What additional data should I collect to identify each service unit of my sample? .......... 24 § 65.13 When do I use the different approaches to determining PMT? ....................................... 24

67
§ 65.15 What instrument should I use to collect the data for the distance-based approach? ......... 24 § 65.17 What instrument should I use to collect data for the load-based approach? .................... 24 § 65.19 What pre-survey procedures should I follow if I use a paper instrument and human ride
checkers? 25 § 65.21 What manual survey procedures should I follow for demand response (DR) with the
distance-based approach? .............................................................................................. 26 § 65.23 What manual survey procedures should I follow for demand response (DR) with the
load-based approach? .................................................................................................... 26 § 65.25 What manual survey procedures should I follow for commuter vanpool with the load-
based approach? ............................................................................................................ 27 § 65.27 What instructions should I give my ride checkers if I do not use pre-determined
between-stop distances for fixed-route services?............................................................ 27 § 65.29 What steps should I take if I fail to collect the sample data from a particular unit? ......... 28 Subsection 67 – Correcting Errors in the Raw Sample Data .................................................. 28 § 67.01 What steps should I take after I have collected the sample data? .................................... 28 § 67.03 What should I consider in designing the format for data recording? ............................... 29 § 67.05 When should I enter my sample data?............................................................................ 29 § 67.07 How should I process the entered data? ......................................................................... 30 § 67.09 How may I use the processed data to identify potential errors in the sample data? ......... 30 § 67.11 How do I identify the sources of any errors? .................................................................. 30 § 67.13 How do I correct any errors? ......................................................................................... 31 § 67.15 What should I do if I fail to correct the data errors for a particular service unit? ............ 33 § 67.17 What steps should I take after I have identified and corrected errors in my data? ........... 33 SECTION 70 – ESTIMATION WITHOUT 100% UPT ......................................................... 34 Subsection 71 – General Directions .......................................................................................... 34 § 71.01 What service-consumed data must I estimate without 100% UPT? ................................ 34 § 71.03 What do I need to do in general to get estimates of these data items? ............................. 34 § 71.05 What is a sample average? ............................................................................................. 34 § 71.07 What is an expansion factor? ......................................................................................... 34 § 71.09 How is the guidance organized? .................................................................................... 34 Subsection 73 – Non-Scheduled Services .................................................................................. 35 § 73.01 What expansion factor should I use for non-scheduled service? ..................................... 35 § 73.03 What sample average should I use for non-scheduled service? ....................................... 35 § 73.05 How do I determine annual vehicle days actually operated for non-scheduled services? 35 Subsection 75 – Rail Services .................................................................................................... 36 § 75.01 What expansion factor should I use for rail services? ..................................................... 36 § 75.03 What sample average should I use for rail services? ...................................................... 36 § 75.05 What steps should I follow to calculate sample averages? .............................................. 37 § 75.07 How should I determine annual services actually provided as expansion factors? .......... 37 Subsection 77 – Bus Services .................................................................................................... 38 § 77.01 What expansion factor should I use for bus services? .................................................... 38 § 77.03 What sample average should I use for bus services? ...................................................... 38 § 77.05 What steps should I follow to calculate sample averages? .............................................. 39 § 77.07 How should I determine annual services actually provided as expansion factors? .......... 39

68
Subsection 79 – Estimating Service-Consumed Data............................................................... 39 § 79.01 How should I estimate the annual total of my service-consumed data? .......................... 39 § 79.03 How should I estimate average daily of service-consumed data by type of service days? 39 § 79.05 How should I estimate annual total UPT for each weekday period for commuter rail,
heavy rail, and light rail? ............................................................................................... 40 SECTION 80 – ESTIMATION WITH 100% UPT ................................................................. 41 Subsection 81 – General Directions .......................................................................................... 41 § 81.01 What service-consumed data must I estimate with 100% UPT? ..................................... 41 § 81.03 What do I need to do in general to get estimates of these data items? ............................. 41 § 81.05 What is a sample ratio?.................................................................................................. 41 § 81.07 What is an expansion factor? ......................................................................................... 41 Subsection 83 – APTL Option .................................................................................................. 42 § 83.01 What expansion factor should I use for the APTL option? ............................................. 42 § 83.03 What sample ratio should I use for the APTL option? .................................................... 42 § 83.05 How should I determine the APTL from my sample? .................................................... 42 § 83.07 How should I estimate annual total PMT for the APTL option? ..................................... 43 § 83.09 How should I estimate average daily PMT by type of service days? .............................. 44 Subsection 85 – PPMT Option .................................................................................................. 44 § 85.01 What expansion factor should I use for the PPMT option? ............................................. 44 § 85.03 How do I determine annual total PPMT? ....................................................................... 44 § 85.05 How should I get the sample total of PPMT for each service unit?................................. 45 § 85.07 What sample ratio should I use for the PPMT option? ................................................... 46 § 85.09 How should I determine the PMT/PPMT ratio for a sample? ......................................... 46 § 85.11 How should I estimate annual total PMT for the PPMT option? .................................... 46 § 85.13 How should I estimate average daily PMT by type of service days? .............................. 46 SECTION 90 – APPENDIXES ................................................................................................. 47 Appendix 91 – Definitions ......................................................................................................... 47 § 91.01 What do the sampling-related terms mean?.................................................................... 47 § 91.03 What do the data-collection terms mean?....................................................................... 50 § 91.05 What do the estimation-related terms mean? .................................................................. 51 § 91.07 What do the reporting terms mean? ............................................................................... 52 § 91.09 What abbreviations for general terms are used in this Manual? ...................................... 52 § 91.11 What abbreviations for NTD modes are used in this Manual? ........................................ 53 Appendix 92 – Distance-Based Survey Sheet ........................................................................... 54 Appendix 93 – Load-Based Survey Sheet for Demand Response ............................................ 57 Appendix 94 – Load-Based Survey Sheet for Commuter Vanpool ......................................... 59 Appendix 95 – Load-Based Survey Sheet for Fixed-Route Service ......................................... 62 Appendix 96 – Daily Log Sheet for Commuter Vanpool ......................................................... 64 Appendix 97 – Full Table of Contents ...................................................................................... 65 Appendix 98 – Table of Random Numbers .............................................................................. 69

69
Appendix 98 – Table of Random Numbers

70
NTD Sampling Manual Appendix 98 1-31-2009 Page 2 of 15
Rows Columns (1) (2) (3) (4) (5) (6) (7) (8) (9) (10)
1 10480 15011 01536 02011 81647 91646 69179 14194 62590 36207 2 22368 46573 25595 85393 30995 89198 27982 53402 93965 34095 3 24130 48360 22527 97265 76393 64809 15179 24830 49340 32081 4 42167 93093 06243 61680 07856 16376 39440 53537 71341 57004 5 37570 39975 81837 16656 06121 91782 60468 81305 49684 60672 6 77921 06907 11008 42751 27756 53498 18602 70659 90655 15053 7 99562 72905 56420 69994 98872 31016 71194 18738 44013 48840 8 96301 91977 05463 07972 18876 20922 94595 56869 69014 60045 9 89579 14342 63661 10281 74553 18103 57740 84378 25331 12566
10 85475 36857 53342 53988 53060 59533 38867 62300 08158 17983
11 28918 69578 88231 33276 70997 79936 56865 05859 90106 31595 12 63553 40961 48235 03427 49626 69445 18663 72695 52180 20847 13 09429 93969 52636 92737 88974 33488 36320 17617 30015 08272 14 10365 61129 87529 85689 48237 52267 67689 93394 01511 26358 15 07119 97336 71048 08178 77233 13916 47564 81056 97735 85977
16 51085 12765 51821 51259 77452 16308 60756 92144 49442 53900 17 02368 21382 52404 60268 89368 19885 55322 44819 01188 65255 18 01011 54092 33362 94904 31273 04146 18594 29852 71585 85030 19 52162 53916 46369 58586 23216 14513 83149 98736 23495 64350 20 07056 97628 33787 09998 42698 06691 76988 13602 51851 46104
21 48663 91245 85828 14346 09172 30168 90229 04734 59193 22178 22 54164 58492 22421 74103 47070 25306 76468 26384 58151 06646 23 32639 32363 05597 24200 13363 38005 94342 28728 35806 06912 24 29334 27001 87637 87308 58731 00256 05834 15398 46557 41135 25 02488 33062 28834 08751 19731 92420 60952 61280 50001 67658
26 81525 72295 04839 96423 24878 82651 66566 14778 76797 14780 27 29676 20591 68086 26432 46901 20849 89768 81536 86645 12659 28 00742 57392 39064 66432 84673 40027 32832 61362 98947 96067 29 05366 04213 25669 26422 44407 44048 37937 63904 45766 66134 30 91921 24618 64117 94305 26766 25940 39972 22209 71500 64568
31 00582 04711 87917 77341 42206 35126 74087 99547 81817 42607 32 00725 69884 62797 56170 86324 88072 76222 36086 84637 93161 33 69011 65795 95876 55293 18988 27354 26575 08625 40801 59920 34 25976 57948 29888 88604 67917 48708 18912 82271 65424 69774 35 09763 83473 73577 12908 30883 18317 28290 35797 05998 41688
36 91567 42595 27958 30134 04024 86385 29880 99730 55536 84855 37 17955 56349 90999 49127 20044 59931 06115 20542 18059 02008 38 46503 18584 18845 49618 02304 51038 20655 58727 28168 15475 39 92157 89634 94824 78171 84610 82834 09922 25417 44137 48413 40 14577 62765 35605 81263 39667 47358 56873 56307 61607 49518
NTD Sampling Manual Appendix 98
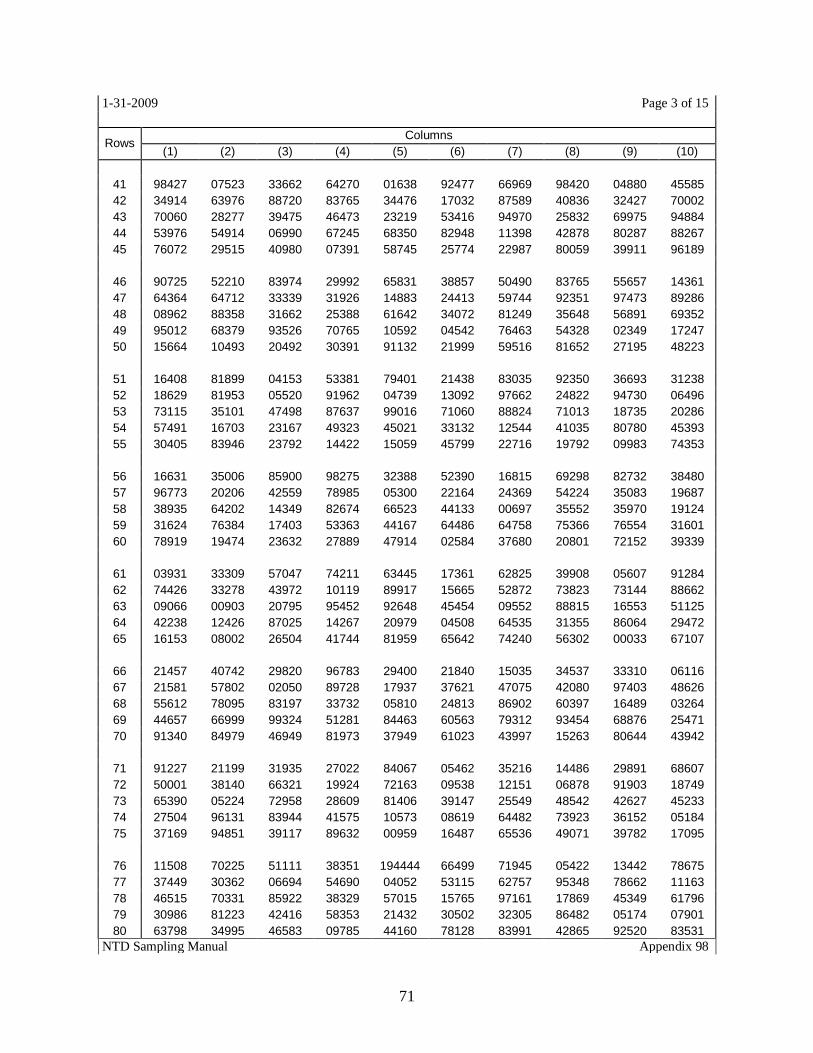
71
1-31-2009 Page 3 of 15
Rows Columns (1) (2) (3) (4) (5) (6) (7) (8) (9) (10)
41 98427 07523 33662 64270 01638 92477 66969 98420 04880 45585 42 34914 63976 88720 83765 34476 17032 87589 40836 32427 70002 43 70060 28277 39475 46473 23219 53416 94970 25832 69975 94884 44 53976 54914 06990 67245 68350 82948 11398 42878 80287 88267 45 76072 29515 40980 07391 58745 25774 22987 80059 39911 96189
46 90725 52210 83974 29992 65831 38857 50490 83765 55657 14361 47 64364 64712 33339 31926 14883 24413 59744 92351 97473 89286 48 08962 88358 31662 25388 61642 34072 81249 35648 56891 69352 49 95012 68379 93526 70765 10592 04542 76463 54328 02349 17247 50 15664 10493 20492 30391 91132 21999 59516 81652 27195 48223
51 16408 81899 04153 53381 79401 21438 83035 92350 36693 31238 52 18629 81953 05520 91962 04739 13092 97662 24822 94730 06496 53 73115 35101 47498 87637 99016 71060 88824 71013 18735 20286 54 57491 16703 23167 49323 45021 33132 12544 41035 80780 45393 55 30405 83946 23792 14422 15059 45799 22716 19792 09983 74353
56 16631 35006 85900 98275 32388 52390 16815 69298 82732 38480 57 96773 20206 42559 78985 05300 22164 24369 54224 35083 19687 58 38935 64202 14349 82674 66523 44133 00697 35552 35970 19124 59 31624 76384 17403 53363 44167 64486 64758 75366 76554 31601 60 78919 19474 23632 27889 47914 02584 37680 20801 72152 39339
61 03931 33309 57047 74211 63445 17361 62825 39908 05607 91284 62 74426 33278 43972 10119 89917 15665 52872 73823 73144 88662 63 09066 00903 20795 95452 92648 45454 09552 88815 16553 51125 64 42238 12426 87025 14267 20979 04508 64535 31355 86064 29472 65 16153 08002 26504 41744 81959 65642 74240 56302 00033 67107
66 21457 40742 29820 96783 29400 21840 15035 34537 33310 06116 67 21581 57802 02050 89728 17937 37621 47075 42080 97403 48626 68 55612 78095 83197 33732 05810 24813 86902 60397 16489 03264 69 44657 66999 99324 51281 84463 60563 79312 93454 68876 25471 70 91340 84979 46949 81973 37949 61023 43997 15263 80644 43942
71 91227 21199 31935 27022 84067 05462 35216 14486 29891 68607 72 50001 38140 66321 19924 72163 09538 12151 06878 91903 18749 73 65390 05224 72958 28609 81406 39147 25549 48542 42627 45233 74 27504 96131 83944 41575 10573 08619 64482 73923 36152 05184 75 37169 94851 39117 89632 00959 16487 65536 49071 39782 17095
76 11508 70225 51111 38351 194444 66499 71945 05422 13442 78675 77 37449 30362 06694 54690 04052 53115 62757 95348 78662 11163 78 46515 70331 85922 38329 57015 15765 97161 17869 45349 61796 79 30986 81223 42416 58353 21432 30502 32305 86482 05174 07901 80 63798 34995 46583 09785 44160 78128 83991 42865 92520 83531
NTD Sampling Manual Appendix 98

72
1-31-2009 Page 4 of 15
Rows Columns
(1) (2) (3) (4) (5) (6) (7) (8) (9) (10)
81 82486 84846 99254 67632 43218 50076 21361 64816 51202 88124 82 21885 32906 92431 09060 64297 51674 64126 62570 26123 05155 83 60336 98782 07408 53458 13564 59089 26445 29789 85205 41001 84 43937 46891 24010 25560 86355 33941 25786 54990 71899 15475 85 97656 63175 89303 16275 07100 92063 21942 18611 47348 20203
86 03299 01221 05418 38982 55758 92237 26759 86367 21216 98442 87 79626 06486 83574 17668 07785 76020 79924 25651 83325 88428 88 85636 68335 47539 03129 65651 11977 02510 261113 99457 68645 89 18039 14367 61337 06177 12143 46609 32989 74014 64708 00533 90 08362 15656 60627 36478 65648 16764 53412 09013 07832 41574
91 79556 29068 04142 16268 15387 12856 66227 38358 22478 73373 92 92608 82674 27072 32534 17075 27698 98204 63863 11951 34648 93 23982 25835 40055 67006 12293 02753 14827 23235 35071 99704 94 09915 96306 05908 97901 28395 14186 00821 80703 70426 75647 95 59037 33300 26695 62247 69927 76123 50842 43834 86654 70959
96 42488 78077 69882 61657 34136 79180 97526 43092 04098 73571 97 46764 86273 63003 93017 31204 36692 40202 35275 57306 55543 98 03237 45430 55417 63282 90816 17349 88298 90183 36600 78406 99 86591 81482 52667 61582 14972 90053 89534 76036 49199 43716 100 38534 01715 94964 87288 65680 43772 39560 12918 86537 62738
101 13284 16834 74151 92027 24670 36665 00770 22878 02179 51602 102 21224 00370 30420 03883 94648 89428 41583 17564 27395 63904 103 99052 47887 81085 64933 66279 80432 65793 83287 34142 13241 104 00199 50993 98603 38452 87890 94624 69721 57484 67501 77638 105 60578 06483 28733 37867 07936 98710 98539 27186 31237 80612
106 91240 18312 17441 01929 18163 69201 31211 54288 39296 37318 107 97458 14229 12063 59611 32249 90466 33216 19358 02591 54263 108 35249 38646 34475 72417 60514 69257 12489 51924 86871 92446 109 38980 46600 11759 11900 46743 27860 77940 39298 97838 95145 110 10750 52745 38749 87365 58959 53731 89295 59062 39404 13198
111 36247 27850 73958 20673 37800 63835 71051 84724 52492 22342 112 70994 66986 99744 72438 01174 42159 11392 20724 54322 36923 113 99638 94702 11463 18148 81386 80431 90628 52506 02016 85151 114 72055 15774 43857 99805 10419 76939 25993 03544 21560 83471 115 24038 65541 85788 55835 38835 59399 13790 35112 01324 39520
116 74976 14631 35908 28221 39470 91548 12854 30166 09073 75887 117 35553 71628 70189 26436 63407 91178 90348 55359 80392 41012 118 35676 12797 51434 82976 42010 26344 92920 92155 58807 54644 119 74815 67523 72985 23183 02446 63594 98924 20633 58842 85961 120 45246 88048 65173 50989 91060 89894 36036 32819 68559 99221
NTD Sampling Manual Appendix 98
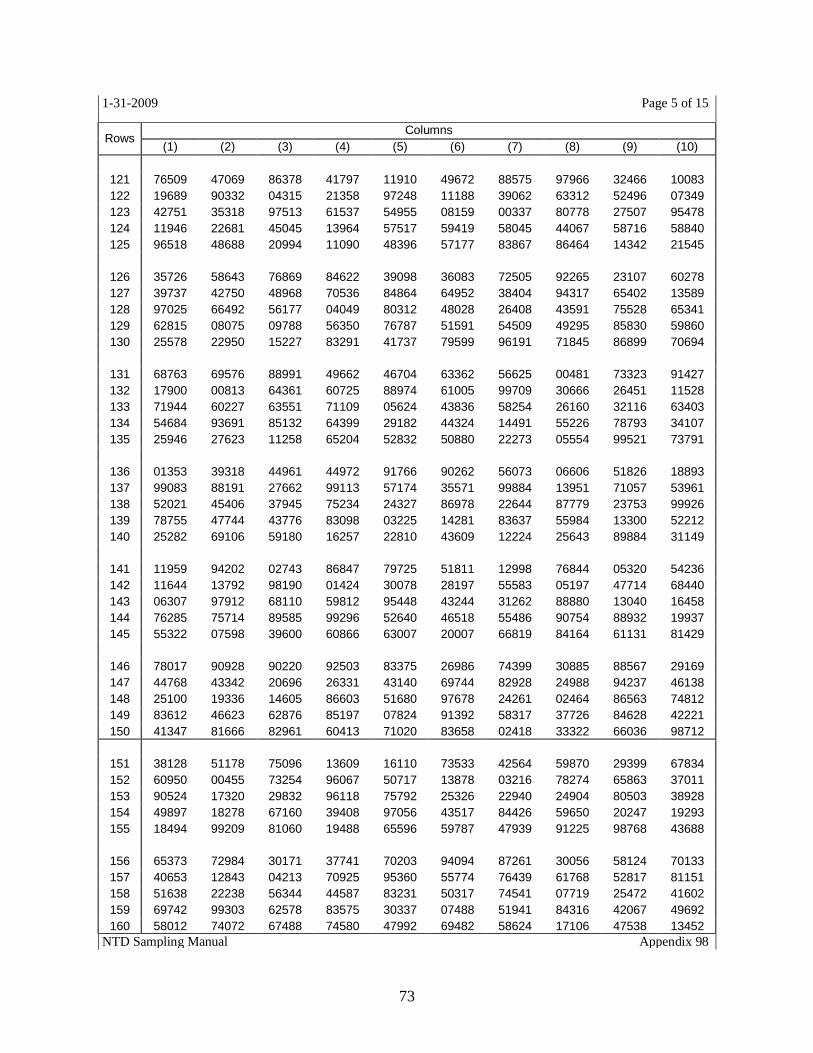
73
1-31-2009 Page 5 of 15
Rows Columns
(1) (2) (3) (4) (5) (6) (7) (8) (9) (10)
121 76509 47069 86378 41797 11910 49672 88575 97966 32466 10083 122 19689 90332 04315 21358 97248 11188 39062 63312 52496 07349 123 42751 35318 97513 61537 54955 08159 00337 80778 27507 95478 124 11946 22681 45045 13964 57517 59419 58045 44067 58716 58840 125 96518 48688 20994 11090 48396 57177 83867 86464 14342 21545
126 35726 58643 76869 84622 39098 36083 72505 92265 23107 60278 127 39737 42750 48968 70536 84864 64952 38404 94317 65402 13589 128 97025 66492 56177 04049 80312 48028 26408 43591 75528 65341 129 62815 08075 09788 56350 76787 51591 54509 49295 85830 59860 130 25578 22950 15227 83291 41737 79599 96191 71845 86899 70694
131 68763 69576 88991 49662 46704 63362 56625 00481 73323 91427 132 17900 00813 64361 60725 88974 61005 99709 30666 26451 11528 133 71944 60227 63551 71109 05624 43836 58254 26160 32116 63403 134 54684 93691 85132 64399 29182 44324 14491 55226 78793 34107 135 25946 27623 11258 65204 52832 50880 22273 05554 99521 73791
136 01353 39318 44961 44972 91766 90262 56073 06606 51826 18893 137 99083 88191 27662 99113 57174 35571 99884 13951 71057 53961 138 52021 45406 37945 75234 24327 86978 22644 87779 23753 99926 139 78755 47744 43776 83098 03225 14281 83637 55984 13300 52212 140 25282 69106 59180 16257 22810 43609 12224 25643 89884 31149
141 11959 94202 02743 86847 79725 51811 12998 76844 05320 54236 142 11644 13792 98190 01424 30078 28197 55583 05197 47714 68440 143 06307 97912 68110 59812 95448 43244 31262 88880 13040 16458 144 76285 75714 89585 99296 52640 46518 55486 90754 88932 19937 145 55322 07598 39600 60866 63007 20007 66819 84164 61131 81429
146 78017 90928 90220 92503 83375 26986 74399 30885 88567 29169 147 44768 43342 20696 26331 43140 69744 82928 24988 94237 46138 148 25100 19336 14605 86603 51680 97678 24261 02464 86563 74812 149 83612 46623 62876 85197 07824 91392 58317 37726 84628 42221 150 41347 81666 82961 60413 71020 83658 02418 33322 66036 98712
151 38128 51178 75096 13609 16110 73533 42564 59870 29399 67834 152 60950 00455 73254 96067 50717 13878 03216 78274 65863 37011 153 90524 17320 29832 96118 75792 25326 22940 24904 80503 38928 154 49897 18278 67160 39408 97056 43517 84426 59650 20247 19293 155 18494 99209 81060 19488 65596 59787 47939 91225 98768 43688
156 65373 72984 30171 37741 70203 94094 87261 30056 58124 70133 157 40653 12843 04213 70925 95360 55774 76439 61768 52817 81151 158 51638 22238 56344 44587 83231 50317 74541 07719 25472 41602 159 69742 99303 62578 83575 30337 07488 51941 84316 42067 49692 160 58012 74072 67488 74580 47992 69482 58624 17106 47538 13452
NTD Sampling Manual Appendix 98

74
1-31-2009 Page 6 of 15
Rows Columns
(1) (2) (3) (4) (5) (6) (7) (8) (9) (10)
161 18348 19855 42887 08279 43206 47077 42637 45606 00011 20662 162 59614 09193 58064 29086 44385 45740 70752 05663 49081 26960 163 75688 28630 39210 52897 62748 72658 98059 67202 72789 01869 164 13941 77802 69101 70061 35460 34576 15412 81304 58757 35498 165 96656 86420 96475 86458 54463 96419 55417 41375 76886 19008
166 03363 82042 15942 14549 38324 87094 19065 67590 11087 68570 167 70366 08390 69155 25496 13240 57407 91407 49160 07379 34444 168 47870 36605 12927 16043 53257 93796 52721 73120 48025 76074 169 79504 77606 22761 30518 28373 73898 30550 76684 77366 32276 170 46967 74841 50923 15339 37755 98995 40162 89561 69199 42257
171 14558 50769 35444 59030 87516 48193 02945 00922 48189 04724 172 12440 25057 01132 38611 28135 68089 10954 10097 54243 06460 173 32293 29938 68653 10497 98919 46587 77701 99119 93165 67788 174 10640 21875 72462 77981 56550 55999 87310 69643 45124 00349 175 47615 23169 39571 56972 20628 21788 51736 33133 72696 32605
176 16948 11128 71624 72754 49084 96303 27830 45817 67867 18062 177 21258 61092 66634 70335 92448 17354 83432 49608 66520 06442 178 15072 48853 15178 30730 47481 48490 41436 25015 49932 20474 179 99154 57418 09858 65671 70655 71479 63520 31357 56968 06729 180 08759 61089 23706 32994 35426 36666 63988 98844 37533 08269
181 67323 57839 61114 62192 47547 58023 64630 34886 98777 75442 182 09255 13986 84834 20764 72206 89393 34548 93438 88730 61805 183 36304 74712 00374 10107 85061 69228 81969 92216 03568 39630 184 15884 67429 86612 47367 10242 44880 12060 44309 46629 55105 185 18745 32031 35303 08134 33925 03004 59929 95418 04917 57596
186 78934 40086 88292 65728 38300 42323 64068 98373 48971 09049 187 17626 02944 20910 57662 60161 38579 24580 90529 52303 50436 188 27117 61399 50967 41399 81636 16663 15634 79717 94696 59240 189 93995 18678 90012 63645 85701 85269 62263 68331 00389 72571 190 67392 89421 09623 80725 62620 84162 87368 29560 00519 84545
191 04910 12261 37566 80016 21245 69377 50420 85658 55263 68667 192 81453 20283 79929 59839 23875 13245 46808 74124 74703 35769 193 19480 75790 48539 83703 15537 48885 02861 86587 74539 65227 194 21456 13162 74608 81011 55512 07481 93551 72189 76261 91206 195 09406 20912 46189 76376 25538 87212 20748 12831 57166 35026
196 09866 07414 55977 16419 01101 69343 13305 94302 80703 57910 197 86541 24681 23421 13521 28000 94917 07423 57523 97234 63951 198 10414 96941 06205 72222 57167 83902 07460 69507 20600 08858 199 49942 06683 41479 58982 56288 42853 92196 20632 62045 78812 200 23995 68882 42291 23374 24299 27024 67460 94703 40937 16961
NTD Sampling Manual Appendix 98

75
1-31-2009 Page 7 of 15
Rows Columns
(1) (2) (3) (4) (5) (6) (7) (8) (9) (10)
201 78994 36244 02673 25475 84953 61793 50243 63423 69309 80308 202 04909 58485 70686 93930 34880 73059 06823 80257 44193 08337 203 46582 73570 33004 51795 86477 46736 60460 70345 37322 19987 204 29242 89792 88634 60285 07190 07795 27011 85941 01852 43096 205 68104 81339 97090 20601 78940 20228 22803 96070 10251 62711
206 17516 02182 82504 19880 93747 80910 78260 25136 62018 62919 207 50711 94789 07171 02103 99057 98775 37997 18325 88281 61091 208 39449 52409 75095 77720 39729 03205 09313 43545 43786 70443 209 75629 82729 76916 72657 58992 32756 01154 84890 04107 17469 210 01020 55151 36132 51971 32155 60735 64857 35424 25257 93844
211 08337 89989 24260 08618 66798 25889 52860 57375 52815 43539 212 76829 47229 19706 30094 69430 92399 98749 22081 52564 90431 213 39708 30641 21267 56501 95182 72442 21445 17276 90344 33199 214 89836 55817 56747 75195 06818 83043 47403 58266 52630 75573 215 25903 61370 66081 54076 67442 52964 23823 02718 28786 06121
216 71345 03422 01015 68025 19703 77313 04555 83425 46763 95315 217 61454 92263 14647 08473 34124 10740 40839 05620 62418 73374 218 80376 08909 30470 40200 46558 61742 11643 92121 22294 26648 219 45144 54373 05505 90074 24783 86299 20900 15144 26506 53770 220 12191 88527 58852 51175 11534 87218 04876 85584 78465 82182
221 62936 59120 73957 35969 21598 47287 39394 08778 38036 30140 222 31588 96798 43688 12611 01714 77266 55079 24690 84716 77732 223 20787 96048 84726 17512 39450 43618 30629 24356 05294 34236 224 45603 00745 84635 43079 52724 14262 05750 89373 79088 38088 225 31606 64782 34027 56734 09365 20008 93559 78384 99219 61747
226 10452 33074 76718 99556 16026 00013 78411 95107 10786 44886 227 37016 64633 67301 50949 91298 74968 73631 57397 08632 04762 228 66725 97865 25409 37498 00816 99262 14471 10332 19035 21695 229 07380 74438 82120 17890 40963 55757 13492 68294 87170 49468 230 71621 57688 58256 47702 74724 89419 08025 68519 95188 54788
231 03466 13263 23917 20417 11315 52805 33072 07723 87876 75258 232 12692 32931 97387 34832 53775 91674 96549 37635 91118 31062 233 52192 30941 44998 17833 94563 23062 95725 38463 03665 49189 234 569691 72529 66063 73570 86860 68125 40436 31303 79330 59083 235 74952 43041 53869 15677 78598 43520 97521 83248 52173 17636
236 18752 43693 32867 53017 22661 39610 03796 02622 78267 24503 237 61691 04944 43111 28325 82319 65589 66048 98498 46941 81427 238 49197 63948 38947 60207 70667 39843 60607 15328 09528 17277 239 19436 87291 71684 74859 76501 93456 95714 92518 10683 75617 240 39143 64893 14606 13543 09621 68301 69817 52140 03976 48795
NTD Sampling Manual Appendix 98

76
1-31-2009 Page 8 of 15
Rows Columns
(1) (2) (3) (4) (5) (6) (7) (8) (9) (10)
241 82244 67549 76491 09761 74494 91307 64222 66592 67270 38593 242 55847 56155 42878 23708 97999 40131 52360 90390 73108 40475 243 94095 95970 07826 25991 37584 56966 68623 83454 49461 97707 244 11751 69469 25521 44097 07511 88976 30122 67542 54825 03274 245 69902 08995 27821 11758 64989 61902 32121 28165 21326 97375
246 21850 25352 25556 92161 23592 43294 10479 37879 21825 11453 247 75850 46992 25165 55906 62339 88958 91717 15756 78817 35541 248 29648 22086 42581 85677 20251 390641 65786 80689 49066 14456 249 82740 28443 42734 25518 82827 35825 90288 32911 79666 52959 250 36842 42092 52075 83926 420875 71500 69216 01350 92846 84792
251 89429 26726 15563 94972 78739 04419 60523 31022 23728 37647 252 43427 25412 25587 21276 44426 17369 29010 45337 90245 92053 253 58575 81958 51846 02676 67781 95137 88430 78260 66962 31812 254 61888 71246 24246 23487 78639 92006 63846 92263 33212 26516 255 73891 47025 40937 71907 26827 98865 38882 25757 26662 91441
256 40938 73894 40854 15997 55293 95033 31736 75068 91314 75293 257 98053 43567 17292 86908 71364 06089 92394 73691 57883 09983 258 59774 29138 46993 39836 99596 59050 25419 04130 54632 17223 259 09765 07548 63043 59782 81449 13652 94420 74460 46707 94303 260 38991 64502 24770 29209 82909 66610 84418 66214 26001 78685
261 25622 27100 56128 62145 82388 45197 97609 83942 01120 71717 262 21864 74120 66231 82306 91784 33177 17681 18963 07216 49288 263 81171 75639 60863 49562 28846 81581 10249 23190 53440 32357 264 69874 52803 28544 51569 56090 44558 42095 92311 57915 13368 265 27848 51107 05761 02159 53911 01952 59273 32250 39647 29908
266 69407 69736 75375 31488 67528 84234 76462 13628 21286 13736 267 29418 03091 06364 13151 40663 43633 87954 69800 24773 62596 268 38222 31231 79415 44558 62490 26936 49682 16307 98535 44822 269 94720 83796 93251 03568 62484 29140 14152 37044 90398 92042 270 45275 16852 02284 41361 73733 61486 33189 08907 41159 08147
271 97260 09552 82626 42915 45847 87401 13339 53850 34931 00602 272 01990 65259 60684 78175 43825 45211 86287 78190 02431 66251 273 24633 42314 81192 50253 67516 59076 92006 65676 87343 89231 274 98071 52677 74920 74461 52266 26967 68284 31612 40335 28865 275 34101 79442 88403 48541 13010 16596 72001 38546 76305 22119
276 77186 93967 25918 66403 73837 73445 86663 15929 08237 05647 277 23114 05481 42335 51396 60823 22680 50459 05429 35227 92559 278 59988 49944 41038 99977 16348 41119 51548 19511 90148 65604 279 11852 42254 82304 05588 75165 20179 94198 25700 33473 59554 280 59992 87922 56299 01700 07003 97507 69260 53349 86947 27517
NTD Sampling Manual Appendix 98
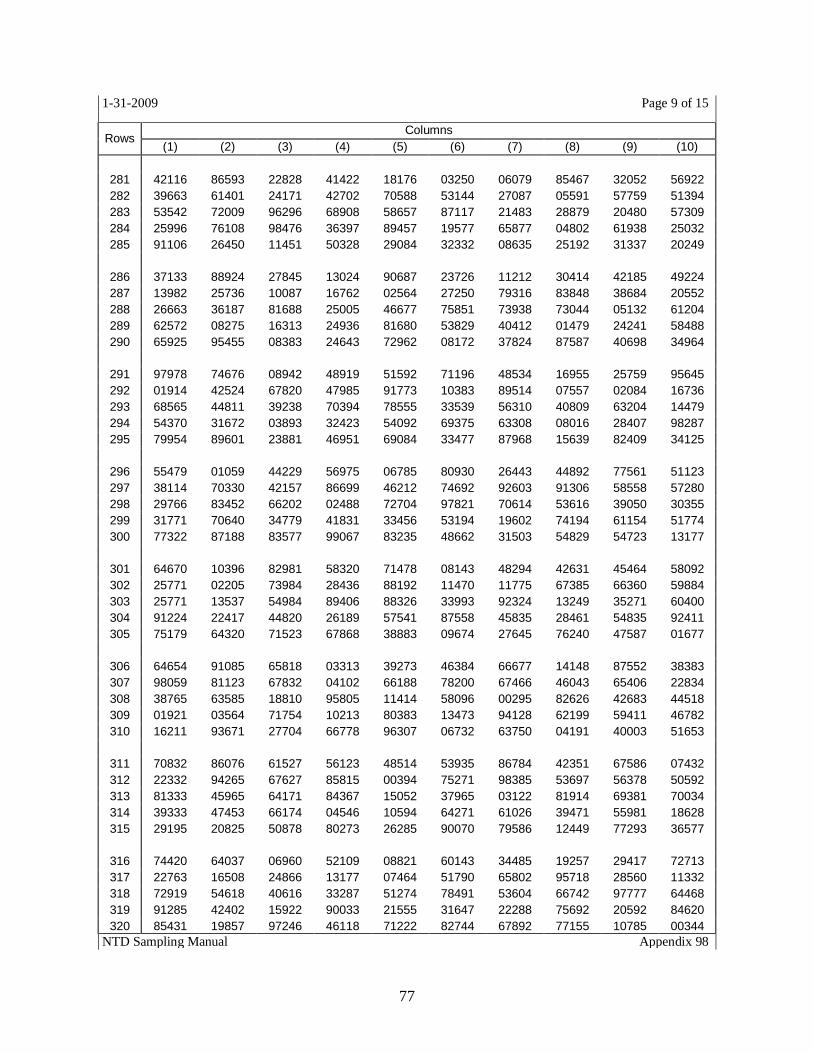
77
1-31-2009 Page 9 of 15
Rows Columns
(1) (2) (3) (4) (5) (6) (7) (8) (9) (10)
281 42116 86593 22828 41422 18176 03250 06079 85467 32052 56922 282 39663 61401 24171 42702 70588 53144 27087 05591 57759 51394 283 53542 72009 96296 68908 58657 87117 21483 28879 20480 57309 284 25996 76108 98476 36397 89457 19577 65877 04802 61938 25032 285 91106 26450 11451 50328 29084 32332 08635 25192 31337 20249
286 37133 88924 27845 13024 90687 23726 11212 30414 42185 49224 287 13982 25736 10087 16762 02564 27250 79316 83848 38684 20552 288 26663 36187 81688 25005 46677 75851 73938 73044 05132 61204 289 62572 08275 16313 24936 81680 53829 40412 01479 24241 58488 290 65925 95455 08383 24643 72962 08172 37824 87587 40698 34964
291 97978 74676 08942 48919 51592 71196 48534 16955 25759 95645 292 01914 42524 67820 47985 91773 10383 89514 07557 02084 16736 293 68565 44811 39238 70394 78555 33539 56310 40809 63204 14479 294 54370 31672 03893 32423 54092 69375 63308 08016 28407 98287 295 79954 89601 23881 46951 69084 33477 87968 15639 82409 34125
296 55479 01059 44229 56975 06785 80930 26443 44892 77561 51123 297 38114 70330 42157 86699 46212 74692 92603 91306 58558 57280 298 29766 83452 66202 02488 72704 97821 70614 53616 39050 30355 299 31771 70640 34779 41831 33456 53194 19602 74194 61154 51774 300 77322 87188 83577 99067 83235 48662 31503 54829 54723 13177
301 64670 10396 82981 58320 71478 08143 48294 42631 45464 58092 302 25771 02205 73984 28436 88192 11470 11775 67385 66360 59884 303 25771 13537 54984 89406 88326 33993 92324 13249 35271 60400 304 91224 22417 44820 26189 57541 87558 45835 28461 54835 92411 305 75179 64320 71523 67868 38883 09674 27645 76240 47587 01677
306 64654 91085 65818 03313 39273 46384 66677 14148 87552 38383 307 98059 81123 67832 04102 66188 78200 67466 46043 65406 22834 308 38765 63585 18810 95805 11414 58096 00295 82626 42683 44518 309 01921 03564 71754 10213 80383 13473 94128 62199 59411 46782 310 16211 93671 27704 66778 96307 06732 63750 04191 40003 51653
311 70832 86076 61527 56123 48514 53935 86784 42351 67586 07432 312 22332 94265 67627 85815 00394 75271 98385 53697 56378 50592 313 81333 45965 64171 84367 15052 37965 03122 81914 69381 70034 314 39333 47453 66174 04546 10594 64271 61026 39471 55981 18628 315 29195 20825 50878 80273 26285 90070 79586 12449 77293 36577
316 74420 64037 06960 52109 08821 60143 34485 19257 29417 72713 317 22763 16508 24866 13177 07464 51790 65802 95718 28560 11332 318 72919 54618 40616 33287 51274 78491 53604 66742 97777 64468 319 91285 42402 15922 90033 21555 31647 22288 75692 20592 84620 320 85431 19857 97246 46118 71222 82744 67892 77155 10785 00344
NTD Sampling Manual Appendix 98

78
1-31-2009 Page 10 of 15
Rows Columns
(1) (2) (3) (4) (5) (6) (7) (8) (9) (10)
321 40778 12451 14921 51464 45331 75822 46859 66829 35803 27645 322 88903 46592 60637 65231 08778 86813 47819 19218 46837 89671 323 29830 24899 85457 19548 83355 52479 77801 01596 48890 56104 324 22832 47422 08073 10107 46772 92299 42975 86376 27869 52954 325 75159 14809 11930 83531 51239 86298 72661 63015 98804 98491
326 99390 08217 56276 09263 82685 30451 25742 41105 74711 42007 327 68622 80897 08902 10867 91379 30068 84289 45020 92459 03831 328 92393 95901 41179 72129 72502 91097 09488 84896 37720 68104 329 53122 66033 38229 51879 29925 45574 53938 72801 64067 76328 330 43251 11941 86631 93264 53433 70281 55000 24550 74751 32855
331 16613 24901 34866 75002 55163 68300 20070 36953 39378 71191 332 12010 60852 92603 70393 17989 95755 14672 58786 41996 02893 333 85528 97879 27814 08219 02908 71582 31439 00360 72264 87245 334 32590 55079 33556 83169 92087 77939 53792 78795 58159 86394 335 91934 30650 16449 15805 61551 38689 59179 85485 18537 70496
336 80614 10150 09389 61892 79477 14522 40270 45744 29582 29717 337 62398 12034 90764 52872 22285 50592 42505 80560 38213 18917 338 02222 46811 05145 67916 15184 02636 59078 57773 21259 86090 339 08690 31785 61664 61322 24149 21471 23328 03093 31266 14840 340 61187 73897 66168 12885 73191 89432 65414 41886 75911 35708
341 12324 61149 85643 64999 63738 46671 25408 69313 54455 04917 342 47635 42279 98620 70677 52386 50904 97403 03931 42090 28179 343 70965 00390 08878 75373 70276 71889 86953 37931 23286 20508 344 58764 15262 96814 54548 00042 19721 78869 85937 36639 29135 345 07429 05609 31207 50254 68389 07714 92268 64698 32823 60122
346 15665 28659 54952 53217 76898 88931 25786 55912 85269 29212 347 64208 53232 99459 43605 04553 48451 68154 49436 49891 65524 348 17952 73276 52567 48489 64264 24220 55498 97548 98437 26033 349 60531 43217 39999 38615 97195 76928 87688 99010 90189 12522 350 76692 39999 43254 68110 88053 88727 14187 98623 84225 78440
351 06433 80674 24520 18222 10610 05794 37515 48619 62866 33963 352 39298 47829 72648 37414 75755 04717 29899 78817 03509 78673 353 89884 59651 67533 68123 17730 95862 08034 19473 63971 37271 354 61512 32155 51906 61662 64130 16688 37275 51262 11569 08697 355 99653 47635 12506 88535 36553 23757 34209 55803 96275 26130
356 95913 11085 13772 76638 48423 25018 99041 77529 81360 18180 357 55864 44004 13122 44115 01601 50541 00147 77685 58788 33016 358 35334 82410 91601 40617 72876 33967 73830 15405 96554 88265 359 57729 88646 76487 11622 96297 24160 09903 14047 22917 60718 360 86648 89317 63677 70119 94739 25875 38829 68377 43918 77653
NTD Sampling Manual Appendix 98

79
1-31-2009 Page 11 of 15
Rows Columns
(1) (2) (3) (4) (5) (6) (7) (8) (9) (10)
361 30574 06039 07967 32422 76791 39725 53711 93385 13421 67957 362 81307 13114 83580 79974 45929 85113 72268 09858 52104 32014 363 02410 96385 79007 54939 21410 86980 91772 93307 34116 49516 364 18969 87444 52233 62319 08598 09066 95288 04794 01534 92058 365 87863 80514 66860 62297 80198 19347 73234 86265 49096 97021
366 68397 10538 15438 62311 72844 60203 46412 65943 79232 45702 367 28529 45247 58729 10854 99058 18260 38765 90038 94209 04055 368 44285 09452 15867 70418 57012 72122 36634 97283 95943 78363 369 86229 22510 33571 23309 57040 29285 67870 21913 72958 75637 370 84842 05748 90894 61658 15001 94055 36308 41161 37341 81838
371 56970 10799 52098 04184 54967 72938 56834 23777 98392 31417 372 83125 58077 60490 44369 66130 72936 69848 59973 08144 61070 373 55503 21383 02464 26141 68779 66388 75242 82690 74099 77885 374 47019 06683 33203 29608 54553 25971 69573 83854 24715 48866 375 84828 61152 79526 29554 84580 37859 28504 61980 34997 41825
376 68921 31331 79227 05748 51276 57143 31926 99915 45821 97702 377 36458 28285 30424 98420 72925 40729 22337 48293 86847 43186 378 95752 96065 36847 87729 81679 59126 59437 33225 31280 41232 379 26768 02513 58454 56958 20575 76746 49878 06846 32828 24425 380 42613 72456 43636 58085 06766 60227 96414 32671 45587 79620
381 95457 12176 65482 25596 02678 54592 63607 82096 21913 75544 382 95276 67524 63564 95958 39750 64379 46059 51666 10433 10945 383 66954 51574 64776 92345 95110 59448 77249 54044 67942 24145 384 17457 44151 14113 62462 02798 54977 48349 66738 60184 75679 385 03704 23322 83214 59337 01695 60666 97410 55064 17427 89180
386 21538 16997 33210 60337 27976 70661 08250 69599 60264 84549 387 57178 16739 98310 70348 11317 71623 55510 64756 87759 92354 388 31048 40058 94953 55866 96283 46620 52087 80817 74533 68407 389 69799 83300 16498 80733 96422 58078 99643 39847 96884 84657 390 90595 65017 59231 17772 67831 33317 00520 90401 41700 95510
391 13570 34761 98939 78784 09977 29398 93896 78227 90110 81378 392 15340 88760 57477 13898 48431 72936 78160 87240 52716 87697 393 64079 07733 36512 56186 99098 48850 72527 08486 10951 26832 394 63491 84886 67118 62063 74958 20946 28147 39338 32169 03713 395 92003 76568 41034 28260 79708 00770 88643 21188 01850 69689
396 52360 46658 66511 04172 73085 11795 52594 13287 82531 04388 397 74622 12142 68355 65635 21828 39539 18988 53609 04001 19648 398 04157 50979 61343 64315 70836 82857 35335 87900 36194 31567 399 86003 60070 66241 32836 27573 11479 94114 81641 00496 36058 400 41268 80187 20351 09636 84668 42486 71303 19512 50277 71508
NTD Sampling Manual Appendix 98

80
1-31-2009 Page 12 of 15
Rows Columns
(1) (2) (3) (4) (5) (6) (7) (8) (9) (10)
401 05073 90103 85167 53900 19720 41488 57476 39458 16621 69774 402 93320 80269 56684 39192 53220 74539 26393 00787 94490 23386 403 18806 70257 96424 13606 14356 76599 25390 63236 04513 16358 404 22253 45923 29815 18578 23316 30896 64771 11220 86218 75956 405 93640 45982 40011 74142 29106 45729 43406 21457 04301 39651
406 47630 45980 76619 57138 57492 00030 77897 76236 64990 35985 407 01781 55061 07455 47083 71870 90597 10151 59606 96919 31174 408 69694 45054 33587 03664 95007 31567 25334 26433 75002 67607 409 51236 05052 26503 94651 29874 73492 88941 08488 09418 08173 410 89445 51039 73837 26720 38650 47322 68474 95047 20404 41577
411 40867 96834 02162 41517 88937 26099 56047 49164 35127 64916 412 92946 56944 93407 05010 54896 33173 30548 23667 43171 47849 413 75898 02275 90768 31902 52114 36634 46803 97970 92216 55398 414 22729 21695 90824 80500 09332 54667 46696 38166 02005 24615 415 28733 62663 23644 16416 47135 39137 62190 31032 58702 03805
416 51323 37770 42114 79742 59905 38480 25293 32993 36946 62701 417 69325 65551 49927 68073 56979 49454 79451 60753 70872 07422 418 11333 60801 36992 76128 27959 41306 93543 15926 99159 27102 419 86347 03703 36778 72501 95229 65735 14269 50220 77270 68604 420 73452 36179 82893 92262 43850 31888 71151 40682 49775 63628
421 75483 74009 73699 05870 36804 89338 73891 40740 98753 74566 422 73302 84917 75122 34085 86208 98399 79433 61960 01720 87458 423 42785 24350 05933 65282 12832 75382 29826 33197 81781 53542 424 40429 33209 58622 09308 38098 55947 12001 73526 23170 13721 425 92876 58271 99325 12301 72957 22690 62705 73892 01974 77759
426 32951 39844 99126 94838 48715 36586 42076 15283 19280 29166 427 099772 28139 48130 73301 35915 90923 19255 75242 84655 30163 428 78459 91322 50072 77941 65046 78363 21951 42319 46472 67617 429 14419 96517 99075 43664 81119 63487 95589 51785 07398 23245 430 97769 50967 24427 21011 92226 44380 23422 10654 43617 80504
431 09175 37545 39088 06879 21277 05153 81855 84043 35307 59465 432 52062 95519 54087 14072 50953 63477 64635 34552 75243 70222 433 70558 85169 01086 97202 10390 01819 88167 21851 87837 85287 434 22553 61317 08968 67521 16627 48855 97263 94242 93354 72446 435 95216 75263 60351 02643 00063 20824 67468 89441 84055 47035
436 49087 61399 47781 32173 96672 04528 15881 46764 20115 03226 437 24808 79068 70787 43106 97133 37236 77888 48451 20788 44648 438 89879 79942 43781 05069 80143 59176 47392 70372 26899 16228 439 61178 79295 58926 21977 28435 32631 23062 31822 70462 05965 440 37444 56047 23208 34710 12147 28558 58817 98807 56776 08129
NTD Sampling Manual Appendix 98

81
1-31-2009 Page 13 of 15
Rows Columns
(1) (2) (3) (4) (5) (6) (7) (8) (9) (10)
441 99633 00363 16853 20789 87674 03938 36077 41012 08813 51168 442 87363 59239 42023 78056 51254 95644 90527 41398 74996 94977 443 23923 87269 85277 34727 78036 74471 12157 11655 25194 47557 444 45610 26370 13094 34500 36750 54517 85011 26567 04021 32485 445 44166 80095 08286 38126 48834 73423 13617 08853 16286 16023
446 81876 27486 53925 22330 37168 97954 11967 03309 97096 64221 447 79400 83852 52174 42577 18553 14023 69629 61913 41050 69689 448 42799 46647 36718 49704 17150 07935 62372 39933 20838 27652 449 09302 36408 64569 93033 95645 56791 14830 81699 45057 85796 450 88078 81456 17242 84590 93660 34619 51965 85618 36558 54410
451 85018 23508 91507 76455 54941 72711 39406 94620 27963 96478 452 11904 73678 08272 62941 02349 71389 45605 60947 60775 73181 453 75344 98489 86268 73652 98210 44546 27174 27499 53523 63110 454 65566 65614 01443 07607 11826 91326 29664 01603 23156 89223 455 51872 72294 95432 53555 96810 17100 35066 00815 01552 06392
456 03805 37913 98633 81009 81060 33449 68055 83844 90942 74857 457 21055 78685 71250 10329 56135 80647 51404 06626 10042 93629 458 48977 36794 56054 59243 57361 65304 93258 56760 63348 24949 459 93077 72941 92779 23581 24548 56415 61927 64416 29934 00755 460 84533 26564 91583 83411 66504 02036 02922 63569 17906 38076
461 11338 12903 14514 27585 45068 05520 56321 22693 35089 07694 462 23858 68500 92274 87026 99717 01542 72990 43413 59744 44595 463 94096 74920 25822 98026 05394 61840 83089 09224 78530 33996 464 83160 82362 09350 98536 38155 42661 02363 67625 34683 95372 465 97425 47335 69709 01386 74319 04318 99387 86874 12549 38369
466 83951 11954 24317 20345 18134 90062 10761 54548 49505 52685 467 93085 35203 05740 03206 92012 42710 34650 73236 66167 21788 468 33762 83193 58045 89880 78101 44392 53767 15220 66319 72953 469 49665 85397 85137 30496 23469 42846 94810 16151 08029 50554 470 37541 82627 80051 72521 35342 56119 97190 43635 84249 61254
471 22145 85304 35348 82854 55846 18076 12415 30193 42776 85611 472 27153 08662 61078 52433 22184 33998 87436 37430 45246 11400 473 00301 49425 66682 25442 83668 66236 79655 88312 93047 12088 474 43815 43272 73778 63469 50083 70696 13558 98995 58159 04700 475 14689 86482 74157 46012 97765 27552 49617 51734 20849 70198
476 16680 55936 82453 19532 49988 13176 94219 88698 41755 56216 477 86938 60429 01137 86168 78257 86249 46134 51865 09836 73966 478 33944 29219 73161 46061 30946 22210 79302 40300 08852 27528 479 16045 67736 18608 18198 19468 76358 69203 02760 28625 70476 480 37044 52523 25627 63107 30806 80857 84383 78450 26245 91763
NTD Sampling Manual Appendix 98

82
1-31-2009 Page 14 of 15
Rows Columns
(1) (2) (3) (4) (5) (6) (7) (8) (9) (10)
481 61471 45322 35340 35132 42163 69332 98851 50252 56911 62693 482 47422 21296 16785 66393 39249 51463 95963 07929 66728 47761 483 24133 39719 14484 58613 88717 29289 77360 09030 39605 87507 484 67253 67064 10748 16006 16767 57345 42285 56670 88445 85799 485 62382 76941 01635 35829 77516 98468 51686 48140 13583 94911
486 98011 16503 09201 03523 87192 66483 55649 36764 86132 12463 487 37366 24386 20654 85117 74078 64120 04643 14351 71381 28133 488 73587 83993 54176 05221 94119 20108 78101 81276 00835 63835 489 33583 68291 50547 96085 62180 27453 18567 55524 86088 00069 490 02878 33223 39199 49536 56199 05993 71201 78852 65889 32719
491 91498 41673 17195 33175 04994 09879 70337 11861 69032 51915 492 91127 19815 30219 55591 21725 43827 78862 67699 01009 07050 493 12997 55013 18662 81724 24305 37661 18956 50064 39500 17450 494 96098 13651 15393 69995 14762 69734 89150 93126 17700 94400 495 97627 17837 10472 18983 28387 99781 52977 01657 92602 41043
496 40064 47981 31484 76603 54088 91095 00010 13800 76690 75133 497 16239 68743 71374 55863 22672 91609 51514 98135 42870 48578 498 58354 24913 20435 30965 17453 65623 93058 08313 99293 00990 499 52567 65085 60220 84641 18273 49604 47418 90974 83965 62732 500 06236 29052 91392 07551 83532 68130 56970 33273 61993 88407
501 88188 99345 94118 40373 50387 24802 81352 61640 56614 71506 502 05200 50533 59428 02797 16833 10038 18901 40743 99449 49825 503 82828 41316 92617 31346 89263 06589 07121 07151 23905 98435 504 71006 99318 19269 35233 79183 78538 06326 62715 28701 52809 505 05937 00875 32264 82808 00229 03868 71072 11519 44876 34508
506 06021 04370 93070 90737 05354 68427 25554 11165 00123 80338 507 54789 10960 44023 57857 56556 83993 70787 28193 65872 33723 508 90400 05707 29128 14859 84117 72206 53740 00464 51853 78852 509 51424 01651 99970 73521 82356 03297 36288 93531 69269 84798 510 79743 88757 43370 86536 07166 06401 14413 23643 21527 91902
511 77418 00322 98854 51507 00565 33066 65791 47857 32483 38493 512 17580 49302 16408 05678 75532 46218 74359 77556 82242 00134 513 15489 45559 28548 64330 42126 43145 81287 73884 69312 03395 514 56342 66773 18536 32600 73958 75993 84250 19254 06677 54192 515 20202 19216 23762 47856 04623 70728 86657 70801 53719 25214
516 84877 51708 69357 67914 55372 97225 52837 46723 00256 96221 517 01647 00311 44989 21900 96079 15793 13148 01433 78721 02647 518 45652 89311 45302 74539 32045 86727 40595 55953 93448 07805 519 79975 06153 08932 59185 71386 19070 87098 19392 13899 56096 520 49744 54713 37053 77467 15348 03383 96086 93295 12413 55774
NTD Sampling Manual Appendix 98

83
1-31-2009 Page 15 of 15
Rows Columns
(1) (2) (3) (4) (5) (6) (7) (8) (9) (10)
521 40922 94903 29638 46870 14108 84391 87313 65969 43349 85142 522 53319 48020 77444 51447 07916 99506 83504 22290 63835 45589 523 76682 10559 85446 56236 85919 76388 59850 03262 60347 31077 524 48869 97229 69581 84581 71728 45150 16901 88717 62688 24822 525 95961 19279 38078 17473 43945 21562 90937 52140 73771 56084
526 16521 25945 94076 91281 92272 41233 58614 18912 58454 34011 527 78282 26332 44072 55104 16895 98311 56005 23331 21939 03463 528 43473 39179 53174 43498 72674 13087 54261 01844 45738 93150 529 06513 31352 09177 21367 64725 23784 18125 74873 83971 92678 530 48734 39737 03448 99009 98136 34562 30339 93143 07350 94289
531 54832 70111 48339 75270 11652 41697 43277 58089 70520 96997 532 55844 69515 22658 75438 83086 41325 04694 40359 28351 53492 533 42829 54398 93338 90705 00626 87752 93482 27726 51835 23966 534 81128 63461 10925 44382 73365 98875 77605 27351 49177 36914 535 62885 26354 10368 78026 00186 46783 02059 98892 98061 15330
536 19525 10375 27010 42791 49471 90607 98103 31752 04842 13693 537 26570 99202 73924 59888 01827 93314 63949 35394 12989 05867 538 04772 17749 01537 96036 02102 02622 06007 52239 61201 57415 539 49129 12491 62552 64323 44856 29045 76871 80449 81351 73642 540 19937 75104 57780 95871 94547 53541 77723 54114 90290 62627
541 52571 67962 72775 28480 87411 12075 45177 08796 99297 48807 542 54943 80723 81195 84069 28144 48106 04169 16575 62665 97861 543 16375 88048 29625 08111 92924 53335 09525 88290 17679 08945 544 38745 91458 30363 95005 55854 38628 13599 73065 40870 82576 545 09937 17776 86425 88916 80594 28347 08092 64255 55604 78635
546 30097 47192 27960 15937 42080 61048 14358 44508 72683 51088 547 02410 60124 62825 42947 74590 89730 16073 28184 30078 92578 548 44804 80165 19442 72194 76910 40274 93861 06568 92482 70037 549 37352 79142 51032 58844 03167 57351 51850 92810 35331 78995 550 60640 14199 48263 71533 94235 42431 44114 90993 41149 06159
551 91610 78188 70960 63990 75601 40719 30421 61611 99904 32812 552 33703 90322 64835 44919 05944 55157 21524 15227 96909 44592 553 30613 74952 51132 01915 92747 64951 17012 64161 18296 22851 554 29975 89868 94738 17752 35156 35749 10367 07684 36188 18510 555 28551 90707 88916 19509 25625 58104 32586 86679 50720 94953
556 20969 99570 91291 90700 21916 81825 44394 42880 01547 85590 557 52666 19174 39615 99505 63213 21069 10634 12952 12234 90511 558 30680 19655 63348 58629 18425 84903 42508 32307 84115 27156 559 00849 74917 97758 16379 58678 44947 05585 56941 85104 20285 560 14110 06927 01263 54613 16439 11458 18593 64952 29372 74461