nber working paper series biases in the ipo … · several theories have ... (1982) assert that...
TRANSCRIPT
NBER WORKING PAPER SERIES
BIASES IN THE IPO PRICING PROCESS
Michelle LowryG. William Schwert
Working Paper 8586http://www.nber.org/papers/w8586
NATIONAL BUREAU OF ECONOMIC RESEARCH1050 Massachusetts Avenue
Cambridge, MA 02138November 2001
The Bradley Policy Research Center, William E. Simon Graduate School of Business Administration,University of Rochester, provided support for this research. We are indebted to Jay Ritter for the use of hisdata. We received helpful suggestions from Harry DeAngelo, Craig Dunbar, B. Espen Eckbo, Jean Helwege,Tim Loughran, Alexander Ljungqvist, Vojislav Maksimovic, Jay Ritter, Jerold Warner, Ivo Welch, JeroldZimmerman, and seminar participants at the University of Rochester. The views expressed herein are thoseof the authors and not necessarily those of the National Bureau of Economic Research.
© 2001 by Michelle Lowry and G. William Schwert. All rights reserved. Short sections of text, not toexceed two paragraphs, may be quoted without explicit permission provided that full credit, including ©notice, is given to the source.

Biases in the IPO Pricing ProcessMichelle Lowry and G. William SchwertNBER Working Paper No. 8586November 2001JEL No. G32, G24, G14
ABSTRACT
By investigating the entire IPO pricing process, beginning when the offering is filed, the paper
contributes to the existing literature along four dimensions. First, price updates during the registration
period are predictable based on firm and offer-specific characteristics known at the time the offer is filed.
Second, price updates reflect market movements prior to the initial filing date as well as during the
registration period. Third, positive and negative information learned during the registration period affect
the offer price asymmetrically. Finally, public and private information learned during the registration
period have different effects on the offer price. While a number of the biases that we uncover are
consistent with one or more theories regarding IPOs, many remain a puzzle.
Michelle Lowry G. William SchwertSmeal College of Business Simon School of BusinessPenn State University University of RochesterUniversity Park, PA 16802 Rochester, NY [email protected] and NBER

Lowry & Schwert, Biases in IPO Pricing
1
1. Introduction
The pricing of Initial Public Offerings (IPOs) is one of the more puzzling phenomena in
finance. Prior empirical evidence shows that underwriters do not fully incorporate all available
information into the IPO offer price in an unbiased way. The first day returns of IPOs average
approximately 15%, indicating that there is a systematic downward bias in the offer price
compared with the price in the secondary trading market. Further, the size of these initial returns
varies predictably across firms. Prior literature has found that initial returns are significantly
related to certain firm- and offer-specific characteristics, to the price update between the
expected offer price stated in the preliminary prospectus and the final offer price, and to market
returns before the IPO.
The process of pricing an IPO generally begins months before the offer price is set. Yet
the majority of the existing IPO pricing literature has only focused on price changes between the
offer price and the secondary market price. The objective of this paper is to examine the entire
IPO pricing process, beginning at the time the issue is filed. By including more of the
information that potentially contributes to the pricing of new issues, we hope to increase our
understanding of the apparent biases in IPO pricing.
Several theories have been advanced to explain the predictability in initial returns, and we
wish to see whether these theories can explain the dynamics of the entire IPO pricing process.
We focus on two of the more popular theories of IPO underpricing. First, Beatty and Ritter
(1986), Rock (1986), and Baron (1982) assert that underpricing results from information
asymmetry between the various parties involved in the IPO. Issues that are characterized by
greater uncertainty are more underpriced to compensate for the higher costs of learning about

Lowry & Schwert, Biases in IPO Pricing
2
these firms’ true values. Many papers, including Beatty and Ritter (1986), Megginson and Weiss
(1991), and Koh and Walter (1989), find empirical support for the importance of information
asymmetry as a determinant of underpricing. Second, Benveniste and Spindt (1989) posit that
underpricing is related to the information underwriters obtain from informed investors during the
registration period. Underwriters compensate these investors for the information they provide by
only partially incorporating it into the offer price, thus allowing the informed investors to earn
especially high returns on the first day the IPO firm trades. Consistent with this theory,
Lundqvist and Wilhelm (2001) find that institutions who reveal more valuable information
during the registration period are rewarded with higher allocations when such information is
positive. Also, Cornelli and Goldreich (2001) and Hanley (1993) show that this private
information learned during the registration period is only partially incorporated into the offer
price.
In examining the entire IPO pricing process, our empirical analysis builds on prior work
along four dimensions. While some of our findings are understandable based on existing
theories, others remain a puzzle.
We begin our analysis of the IPO pricing process at the time the offering is filed. To file
an IPO, the company must register with the Securities and Exchange Commission (SEC) a
preliminary prospectus containing basic information on the company and the proposed offering.
Either in this preliminary prospectus or in an amended prospectus, the company provides a range
of prices within which it expects to price the issue. The percent difference between the midpoint
of this preliminary price range and the final offer price represents the price update. We find that
the price update is significantly related to information that is publicly available when the IPO is
filed, such as the underwriter rank, the industry of the IPO firm, and the exchange on which the
Lowry & Schwert, Biases in IPO Pricing
3
stock will be listed. It seems that firm- and offer-specific characteristics can explain the price
update in much the same way that they explain the initial return. While the ability of such
variables to explain the initial return has been generally interpreted as supporting the information
asymmetry hypothesis, it is difficult to reconcile their ability to explain the price update with the
same theory. In fact, this puzzling relation between the price update and firm- and offer-specific
characteristics does not seem consistent with the existing theories of IPO pricing. Our findings
suggest that underwriters do not incorporate all available information when setting the range of
expected offer prices.
Second, we examine the relation between the price update and general movements in
market prices. For a sample of IPOs, we collect the date of the first prospectus containing the
range of expected offer prices. Conceptually, the price update should be related to information
that becomes available between the release of this prospectus and the setting of the final offer
price, typically the day before the offering. Thus, we expect market returns over this period to be
most strongly related to the price update. Consistent with Loughran and Ritter (2000), we find
that companies and their underwriters do adjust the offer price in response to recent market
movements. However, we find that market returns over fixed intervals before the IPO have
higher explanatory power than those that are linked to the time between the initial revelation of
the expected price range and the offer date. Specifically, our results show that market returns
over the three months before the offer are reliably related to the price update. We note that this
is a substantially longer period of time than the three weeks over which Loughran and Ritter
measure market returns. Further, given that the registration period averages only two months,
these findings raise further questions about how companies and their investment bankers set the
range of expected offer prices that is stated in the preliminary or amended prospectus. The

Lowry & Schwert, Biases in IPO Pricing
4
existing theories of IPO pricing do not seem to provide an adequate explanation for this
phenomenon.
Third, we allow for the possibility that positive information learned during the
registration period is not incorporated into the pricing of an IPO in the same manner as negative
information. Benveniste and Spindt’s (1989) partial updating theory asserts that underwriters
only partially incorporate positive information they receive regarding firm value into the offer
price, thus providing compensation (in the form of higher initial returns) to the investors who
provided them with this information. However, both underwriters and investors should want to
avoid losses on overpriced issues, suggesting that negative information should be fully
incorporated into the offer price. Consistent with this intuition, our empirical analysis shows
significant differences in the effects of positive versus negative information on the pricing of
IPOs. Investment bankers appear to incorporate negative information more fully into the offer
price than positive information.
Finally, we compare the effects of public versus private information learned during the
registration period on the pricing of an IPO. Loughran and Ritter note that under Benveniste and
Spindt’s partial updating theory, private information should be only partially incorporated into
the offer price, but public information should be fully incorporated. Following Loughran and
Ritter, we use market returns to proxy for public information. Our results are generally
consistent with Benveniste and Spindt’s theory. We find that public information is fully
incorporated into the offer price, but private information is only partially incorporated. As
discussed in more detail later, this finding contrasts with the findings of Loughran and Ritter
(2000) and to some extent those of Benveniste, Wilhelm and Yu (2000).
Lowry & Schwert, Biases in IPO Pricing
5
In summary, our results on the predictability of the price update, the asymmetry of
positive versus negative information, and the extent to which public versus private information is
incorporated into the offer price provide new evidence on the complexity of the IPO pricing
process. While our results do not ‘reject’ any of the existing theories of IPO pricing, they show
that no single existing theory comes close to explaining the numerous biases that exist.
Section 2 discusses the data that we use to examine the price updates and initial returns.
Sections 3 and 4 investigate the predictability of the price update and the initial return,
respectively. In section 5 we conduct various robustness tests. Section 6 summarizes the results
of the paper.
2. Data
To examine the biases in the pricing of IPOs, we obtain data on all firms that went public
between 1985 and 1999 from the Securities Data Corporation (SDC). Unit IPOs, closed end
funds, real estate investment trusts (REITs), and American Depositary Receipts (ADRs) are
excluded. Section 2.1 defines our IPO pricing measures as well as the explanatory variables that
we use in our empirical tests. Section 2.2 investigates the issue of sample selection, which
potentially affects our empirical analysis.
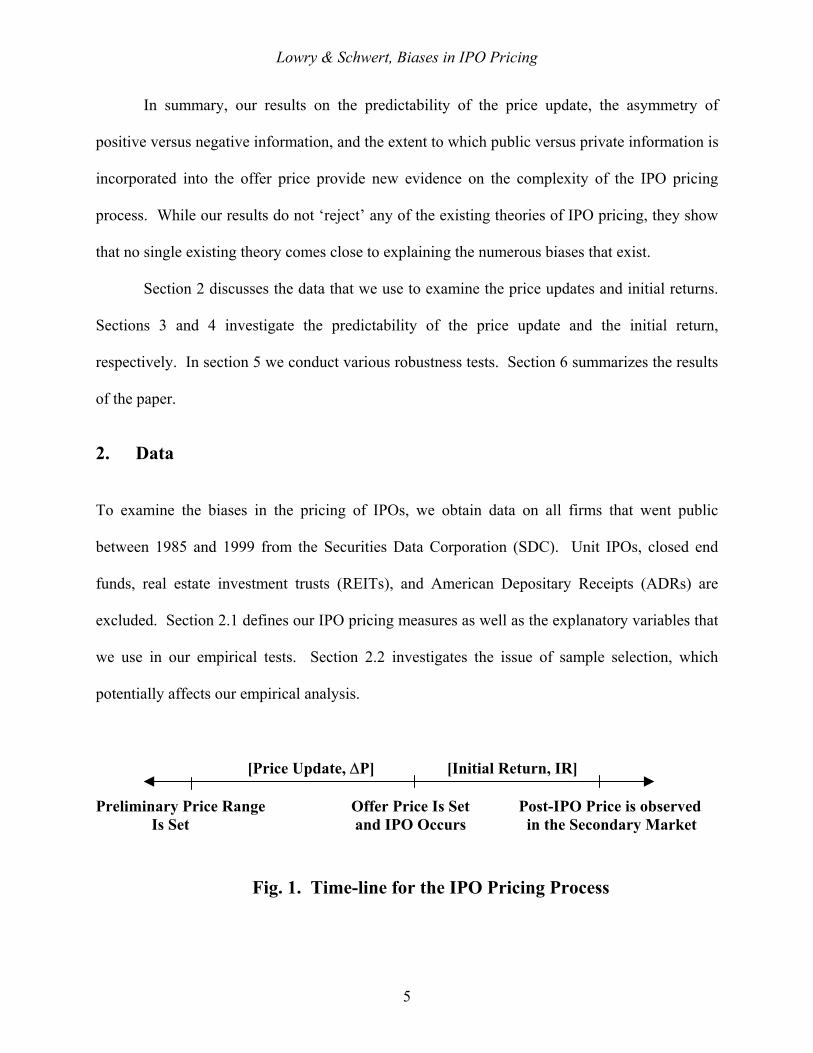
[Price Update, ∆P] [Initial Return, IR]
Preliminary Price Range Offer Price Is Set Post-IPO Price is observed Is Set and IPO Occurs in the Secondary Market
Fig. 1. Time-line for the IPO Pricing Process

Lowry & Schwert, Biases in IPO Pricing
6
2.1. SDC Data on Individual IPOs
The pricing of an IPO can be thought of as occurring in three stages, as illustrated in
figure 1. First, the firm and its underwriters agree on a range of prices within which they expect
to set the offer price. This price range is listed in a prospectus that is filed with the SEC. Some
companies include this price range in the preliminary prospectus that is filed when the offering is
registered, while other companies set the price range in an amended registration statement that is
filed between the initial registration date and the IPO date. Data on the original registration dates
are available on SDC, but Loughran and Ritter (2000) emphasize that there are often amended
filings after the original registration statement that do not appear in the SDC database. We
investigate the exact timing of the first available pricing information using data from the SEC
Electronic Data Gathering, Analysis, and Retrieval system (EDGAR) in 1996-97. Second,
typically the day before the offering, the company and its underwriters set the final offer price.
This is the price at which the issue is offered to the public. Finally, when the issue starts trading
we observe the market’s assessment of the value of this firm.
For each IPO, the price update (∆P) equals the percentage change between the midpoint
of the filing range and the offer price. The initial return (IR) equals the percentage change
between the offer price and the first closing price. To determine the first closing price of a
particular issue, the first closing price from the Center for Research in Securities Prices (CRSP)
is used if price data are available within 14 days of the offer date. If CRSP data are not
available, we try to obtain the closing price on the first day of trading from SDC. If that is not
available, the close on the second day or otherwise the end of the first week of trading is used.
We examine the predictability of both the firm-level price update and initial return, based
on a number of firm- and deal-specific characteristics. For each firm, we identify the

Lowry & Schwert, Biases in IPO Pricing
7
underwriter from SDC and assign an underwriter rank (RANK) based on the Carter, Dark, and
Singh (1998) measures. The ranks range from 0 to 9, with higher numbers representing higher
quality underwriters. Underwriters that are not included in this classification are assigned a rank
of 0. Using the SDC classification system, we also assign each firm a technology dummy
(TECH), equal to 1 if the firm is in a technology industry and 0 otherwise. To capture the effects
of firm size, we collect data on total assets before the offering (TA) and number of shares filed
(SHRS) from SDC, both of which are transformed using logarithms to reduce the skewness in
these data. In addition, TA is transformed into 1983-dollar values using the Consumer Price
Index (CPI) to adjust for the effects of inflation. We form three exchange dummies, NYSE,
NMS, and AMEX, where each dummy equals 1 if the IPO was listed on that market, and 0
otherwise.
Many researchers have noted that IPO pricing is affected by the risk of the issuing firm.
This is not generally measurable at the time of the IPO, although investors and underwriters
clearly form opinions about this important attribute when setting the IPO price. We follow the
tradition in the literature of proxying for the ex ante risk of the IPO stock using volatility of the
IPO stock return in the secondary trading market. VOL is the market-adjusted volatility of the
IPO stock return, equal to the standard deviation of daily returns to the IPO stock in trading days
22 through 63 after the IPO (the second and third months of secondary market trading, skipping
the first month to avoid the effects of price supports, if any) minus the standard deviation of daily
returns to the CRSP equal-weighted market portfolio of NYSE, Amex, and Nasdaq stocks during
the same period.1
1 We also use a measure of after-market volatility based on trading days 1 through 63 after the IPO and the results are similar.

Lowry & Schwert, Biases in IPO Pricing
8
Loughran and Ritter (2000) analyze the reaction of the price update to public information
that becomes available during the registration period as reflected in the return to the CRSP value-
weighted portfolio over the 15 days before the IPO. Because IPO stocks tend to be small, we use
the CRSP equal-weighted return to measure the public information that becomes available during
the registration period. Also, in section 3.2 we measure market returns over several time
intervals to see how current and past market movements affect IPO prices.
To investigate the possibility that positive and negative information learned during the
registration period affect the offer price differently, we define two asymmetry measures. First,
∆P+ equals ∆P when the price update is positive, and zero otherwise. Similarly, MKT+ equals
MKT when the market returns during the registration period are positive, and zero otherwise.
Thus, in our cross-sectional regression models, the coefficients on these variables measure the
differences between the effects of positive versus negative information, if any.
We focus on data from 1985-97 in our tests because there is evidence that the IPOs in
1998 and 1999 had substantially different behavior. The effects of limiting our sample period in
this manner are investigated in detail in section 5.
2.2. Sample Selection Bias
The goal of this analysis is to explain the IPO pricing process. How do IPO prices get
updated between the initial prospectus and the final IPO, and how does the after-market price of
the stock relate to the IPO offer price? The tests control for the characteristics of the IPO firms
and of the transactions. The regression models, however, require full data on the explanatory
variables. The data sources (SDC and CRSP) do not have complete information on all of the
variables for many firms.

Lowry & Schwert, Biases in IPO Pricing
9
Table 1 shows a comparison of means between the sample with full data available for all
of the variables listed above (referred to as the regression sample) in column (1) and the means
of these variables for the observations that are omitted from the regression sample because they
have data missing for at least one other variable (referred to as the incomplete data sample) in
column (2). This shows the nature of the sample selection bias associated with the regression
tests in tables 2, 6, 7, and 8. Column (3) of table 1 shows t-statistics that test whether the means
are equal in the regression sample and in the incomplete data sample, based on
heteroskedasticity-consistent standard errors, and column (4) shows the number of observations
in the incomplete data sample.
We find that the characteristics of the regression sample firms differ significantly from
the missing-data firms along several dimensions. For example, firms in the regression sample
state in the prospectus that they plan to issue an average of 2.2 million (= exp(14.587)) shares.
In comparison, the average for firms that are not in the regression sample (because they are
missing data for at least one of the other variables) is 2.4 million (= exp(14.678)) shares. Thus,
firms in the regression sample tend to file fewer shares (t-statistic = -2.82). Firms in the
regression sample also have higher after-market volatility (t-statistic = 3.84), are less likely to
issue on the NYSE (t-statistic = -6.07), more likely to issue on NMS (t-statistic = 5.94), and have
higher market returns in the registration period (t-statistics of 2.19 and 2.12 on MKT and MKT+),
on average. Finally, the price update when it is positive, ∆P+, and the initial return are
significantly larger for the regression sample (t-statistics of 2.91 and 2.05).
Columns (5) and (6) of table 1 show the percent of IPOs that occur in each year from
1985 through 1997 for each sample, and column (7) shows the heteroskedasticity-consistent t-
statistics for the differences between the proportions in each sample by year. A large proportion

Lowry & Schwert, Biases in IPO Pricing
10
(39%) of the regression sample occurs in the years 1995-97, and a large proportion (49%) of the
incomplete data sample occurs in the years 1985-91. This likely reflects changes in the
thoroughness with which SDC has collected data on IPOs over time. Some of the differences in
characteristics in columns (1) and (2) are probably related to the calendar patterns seen in
columns (5) and (6). For example, the greater proportion of technology firms in the regression
sample is probably related to the fact that data from recent years are more likely to be in the
regression sample, and there were a lot of technology-related IPOs from 1995-97.
The most important message to get from table 1 is that the firms with missing or
incomplete data are not random. Thus, at a minimum, we must be cautious in interpreting our
regression results to realize that they may not be representative of the firms with incomplete data.
3. Predictability of Price Updates
The pricing of an IPO begins at the time the IPO is filed, and thus we begin our analysis
of the pricing process at this point. This section examines whether underwriters fully incorporate
available information into the expected offer price.
3.1. Predictable Bias in the Price Update at the Filing Date
The first thing to note about the price update is that the average price update is negative
(-2.800 in table 1) and a simple t-test for whether this is reliably different from 0 equals –9.17.
Thus, on average the IPO price is about 2.8% below the mid-point of the initial filing range.
Table 2 examines the extent to which underwriters incorporate available information
about the company at the time they set the initial filing range. Column (1) of table 2 contains
estimates of a regression model that explains the price update that occurs between the date of the
first prospectus with pricing information and the offer date, conditional on information that is

Lowry & Schwert, Biases in IPO Pricing
11
publicly known at the time the offering is filed,
∆Pi = α + β1 RANKi + β2 TECHi + β3 TAi + β4 SHRSi + β5 NYSEi +
β6 NMSi + β7 AMEXi + εi, (1)
where the variables have been defined above.
We find that many of these predetermined variables predict the IPO price update. For
example, IPOs underwritten by highly ranked investment bankers are likely to have larger price
updates (t-statistic of 4.57 in column (2)). Technology firms also tend to have larger price
updates (t-statistic of 3.56). On the other hand, holding other things constant, firms that are
larger are likely to have smaller price updates (t-statistic of –3.03 on total assets). Finally, the
exchange the offering lists on is also significantly related to the price update. Specifically, firms
that list on NYSE and NMS tend to have larger price updates (t-statistics of 3.90 and 2.34), while
firms that list on AMEX have smaller price updates on average (t-statistic of –2.90).2
The regression in column (1) pools IPO price updates across the 1985-97 period, but to
the extent that there are known cycles in the IPO market (see, for example, Ibbotson, Ritter, and
Sindelar (1988, 1994) and Lowry and Schwert (2001)), it is likely that the regression errors for
firms with IPOs close together in time are correlated. One simple way to check the severity of
this problem is to use a bootstrap estimator similar to Fama and MacBeth (1973). Column (3) in
table 2 shows the average of the estimates of the coefficients in (1) when they are estimated year-
by-year from 1985-97. Each t-statistic in column (4) is based on the standard deviation of the
time-series of estimates. The Fama-MacBeth estimates and tests in columns (3) and (4)
generally support the regression estimates in columns (1) and (2). The estimate of the NMS- 2 Habib and Ljungqvist (2001) argue that the selection of underwriters by firms biases the coefficient estimates of underwriter rank in regressions that explain initial returns to IPOs. To the extent that firms also choose where to list their stock following the IPO, similar self-selection biases could occur. They did not analyze price updates.

Lowry & Schwert, Biases in IPO Pricing
12
listing variable changes sign, suggesting that this effect is not stable across the sample, but this is
the only substantial difference between the pooled and Fama-MacBeth results.
The estimates in the right panel of table 2, columns (5) through (8), add the after-market
volatility VOL to these regressions. Although this variable is not measurable by econometricians
at the time of the IPO, it is likely that investors and investment bankers have at least an intuitive
knowledge of this volatility when evaluating IPO pricing. The coefficient on volatility is reliably
negative in both the pooled regression and in the Fama-MacBeth estimates, implying that price
updates are smaller or more negative for riskier firms. Coefficients on other variables are
substantially unchanged.
These results imply that there is a predictable bias in the adjustment from the initial file
range to the final IPO price. The explanatory power of these regressions is low (between 2% and
4%), because there is a lot of uncertainty about the IPO price at the time that the initial filing
range is set. However, there are systematic patterns in price updates that are significantly related
to the characteristics of the issuing firm, the offering, and the underwriter.
The literature on IPO pricing has often used variables such as those in table 2 to explain
initial IPO returns as a test of theories about asymmetric information. However, it is not clear to
us how these theories would predict any particular pattern in price updates. It seems that
companies and their underwriters do not incorporate all available information when setting the
range of expected offer prices. Consequently, certain types of IPOs tend to have larger price
updates than others.
To assess the economic significance of these relations, we allow each explanatory
variable to vary by one standard deviation and calculate the consequent effect on the price
update. Rank, tech, and volatility have the largest effect on the size of the price update. A one

Lowry & Schwert, Biases in IPO Pricing
13
standard deviation change in each of these variables is associated with approximately a 0.1
standard deviation change in the price update, i.e. approximately 1.7%. While the total effect on
the price update obviously depends on the correlation between the independent variables, this
simple calculation suggests that the economic significance of these relations is relatively low. In
other words, there is a lot of variability in the price update that is unrelated to the regression
model.
Thus, the results indicate that the price update is predictable based on information that is
publicly available at the time the offering is filed. It is important to note, however, that investors
cannot buy in at the expected offer price, so the predictability of the price update does not
represent a profit opportunity, nor is it a cost for the issuing firm. In addition, these relations are
not highly significant in economic terms.
3.2. Price Updates and Market Returns
As noted earlier, Loughran and Ritter (2000) analyze the relation between price updates
and the 15-day return to the CRSP value-weighted portfolio, and they find that the price update
is significantly related to the market return. We examine this relation in more depth to better
understand how public information that becomes available prior to the IPO affects the final offer
price.
To investigate the relation between price updates and contemporaneous market returns,
we use several measures of market returns during the registration period, and in some cases
before the initial registration date. The variable shown in table 1, MKT, is the CRSP equal-
weighted return between the initial registration date and the day before the IPO. For 554 of the
firms that went public in 1996 and 1997, we obtained the date of the first prospectus that
included the initial filing range of prices from EDGAR. In about 60% of the cases, the initial

Lowry & Schwert, Biases in IPO Pricing
14
prospectus included the file range, while for the remaining 40% of cases the first pricing
information was released later in an amended prospectus. Across all cases, the average number
of trading days between the first price range and the IPO was 44 days, or about 75% of the entire
registration period. For these 554 firms, we measure the CRSP equal-weighted market return
between the date of the first prospectus with pricing information and the day before the IPO,
MKTMATCH.
Another approach to measuring the effect of market movements on IPO pricing is to
measure market returns over a fraction of the entire registration period (file date to day before
offer). In particular, we use intervals equal to 25%, 50%, and 75% of the registration period.
Because these measures do not rely on the exact date on which the price range became available,
they can be calculated for our entire sample. For each interval we measure market returns
ending on the day before the IPO and moving backwards the requisite number of days to cover
these proportions of the registration period, where our measure MKT covers 100% of the
registration period. The measures MKT25%, MKT50%, and MKT75% should reflect
information about market valuations that occur in the latter parts of the registration period, just
before the IPO price is set.
Panel A of table 3 shows regressions of the price update (∆Pi) on market returns over the
period between the first pricing information and the setting of the IPO price (MKTMATCH). It
also shows regressions of the price update on market returns over fractions of the entire
registration period, MKT25%, MKT50%, MKT75%, and MKT for the sample of firms for which
we have information from EDGAR. Interestingly, the estimates of β are similar across all
measures of market return that are linked to the entire registration period, MKT25% to MKT.
The coefficient estimates on all of these variables are approximately 0.45. While the t-statistics
Lowry & Schwert, Biases in IPO Pricing
15
and R2’s increase as the intervals increase, this is somewhat mechanical. Note that the dependent
variable is the same across all these regressions and the slope estimates are similar.
Consequently, the larger variance of the longer period market returns yields larger t-statistics and
R2 measures.
Perhaps most surprising is that the market return that is matched to the period of the price
update, MKTMATCH, has the lowest coefficient estimate (0.30, with a t-statistic of 2.08).
Contrary to our intuition, market returns between the setting of the initial price range and the
actual offer do not appear to be the most relevant. Rather, the importance of market returns
seems to be independent of the exact time that the initial price range was set. It is also notable
that although MKT incorporates returns prior to the release of the expected offer price for many
firms, this coefficient is substantially larger and more significant than that on MKTMATCH.
This suggests that price updates between the initial filing range and the IPO price react to market
movements that precede the announcement of the initial filing range. Table 4 investigates this
possibility in more depth.
Panel B of table 3 shows estimates of the sensitivity of the price update to market returns
over fractions of the registration period, MKT25% to MKT, for the all SDC firms from 1985-97.
As in Panel A, the estimates of β are similar for all of the measures of market return, although
these estimates are smaller than in Panel A, around 0.15. Again, the larger variance of the longer
period market returns yields larger t-statistics and R2 measures.
Table 4 considers the general effects of recent market movements on IPO price setting,
independent of the length of the registration period. We measure the equal-weighted CRSP
return for periods of 5, 10, 15, 20, 25, 35, 40, 45, 50, 75, 100, 125, and 250 trading days before

Lowry & Schwert, Biases in IPO Pricing
16
the IPO (denoted MKT5 to MKT250) and measure the strength of the relation between price
updates and these alternative measures of market returns.
Table 4 shows that the estimates of market sensitivity are highest in the week before the
IPO, β = 1.04, with a t-statistic of 5.92. The estimates gradually decline to 0.11 for the 250
trading days (approximately one year) before the IPO. The largest t-statistic and R2 are for the
estimate including 50 trading days (about two months). Again, this reflects a trade-off between
the increase in the variability of market returns measured over longer horizons versus the
reduction in the slope estimate.
As discussed previously, the existence of cycles in the IPO market potentially causes
regression errors for firms with IPOs close together in time to be correlated. It is possible that
the OLS analysis overstates the importance of market returns in explaining price updates. The
last two columns of table 4 show the Fama-MacBeth bootstrap estimates of the slope and the t-
statistic. These t-statistics are much smaller, by a factor of about 3, reflecting the strong positive
correlation in the errors of these regressions (unexpected price updates) that occur close together
in time. It is interesting that these adjustments are much larger than those in table 2. This
indicates that the relations between firm and offer characteristics and the price update are
relatively stable over time, yet the extent to which companies and their underwriters incorporate
recent market conditions varies much more substantially. Notably, while the significance is
substantially attenuated in the Fama-MacBeth regressions, the finding that market returns up to
one year contribute to the price update, with MKT50 being the most significant, remains.
As a final check on the relation between price updates and market movements, table 5
shows a multiple regression of the price update against 13 weeks or months of lagged market
returns,
13

Lowry & Schwert, Biases in IPO Pricing
17
∆Pi = α + Σ βi XKi + εi , (2) K=1
where XKi is the weekly (WKi) or monthly (MKi) market return for the Kth week or month
before the IPO. Each weekly return is measured using 5 trading day returns and each monthly
return is measured using 20 trading day returns of the CRSP equal-weighted portfolio of NYSE,
Amex, and Nasdaq-listed stocks. As shown in the left panel, the coefficients for the 8 weeks
before the IPO are similar in magnitude, between 0.441 and 0.894, with t-statistics between 2.37
and 4.79. The coefficients for weeks 9 through 13 are smaller and less significant, although all
positive. Consistent with the weekly results, the right panel shows that the coefficients for
months 1 and 2 are similar and have large t-statistics (0.658 and 0.705, with t-statistics of 9.53
and 9.31). The coefficient for month 3 is 0.343, with a t-statistic of 5.40, and the remaining
coefficients are small and not reliably different from zero.
Thus, the results in table 5 show that general market conditions for the two months prior
to the IPO are strongly correlated with the price update, with a smaller effect in the third month.
Together with the results in tables 3 and 4, this implies that while issuing firms and their
underwriters do adjust the IPO price in response to recent market movements, this adjustment
does not seem to be linked to the date on which the initial price range is first revealed. Further,
since the registration period averages 2 months, our findings indicate that market returns prior to
the setting of the initial price range contribute to the price update. This is puzzling because it
implies that companies and their underwriters do not fully incorporate recent market returns into
the expected price range that is declared in the preliminary or amended prospectus.
The results in tables 3, 4, and 5 also show that all of the coefficients on market returns are
less than 1. This indicates that companies and their underwriters adjust the offer price less than
Lowry & Schwert, Biases in IPO Pricing
18
one-for-one with overall movements in market values in the months before the IPO. In contrast,
Ibbotson (1975), Clarkson and Thompson (1990) and Chan and Lakonishok (1992) find that the
beta of IPOs shortly after going public is greater than 2. If IPO firms have similar risk levels
prior to the actual offer, then the low β estimates in tables 3, 4, and 5 suggest that the price
update represents only a partial adjustment to the public information reflected in market returns.
Such a finding would be inconsistent with Benveniste and Spindt’s model, as originally noted by
Loughran and Ritter.
An alternative interpretation of the low β estimates is that they reflect the lack of trading
in these pre-IPO stocks. Gintschel (2000) shows that returns to NYSE, Amex, and Nasdaq
stocks during non-trading periods, which are measured from quote revisions, are much less
sensitive to market returns than returns based on trading prices. Since the price update is
essentially a quote revision, Gintschel’s evidence is directly comparable. Whether the low
sensitivity of market maker and investment bankers’ quotes to market movements is rational or
not remains an interesting question.
The extent to which public information is incorporated into market returns is examined
further in section 4.3.
3.2. Predictable Bias in the Price Update at the IPO Date
Table 6 combines the tests in table 2, showing the relation between price updates and
information that is available in the preliminary prospectus, with the market returns for the 50
trading days before the IPO,
∆Pi = α + β1 RANKi + β2 TECHi + β3 TAi + β4 SHRSi + β5 NYSEi +
β6 NMSi + β7 AMEXi + β8 VOLi + β9 MKT50i + β10 MKT50 +i + εi. (3)
Lowry & Schwert, Biases in IPO Pricing
19
Market returns (MKT50) are measured using the CRSP equal-weighted return for the 50 trading
days before the IPO. MKT50+ equals MKT50 when the market return is positive and zero
otherwise. We include both MKT50 and MKT50+ to allow for an asymmetric response of the
price update to the market return. As discussed earlier, it is plausible that investment bankers
may not treat positive and negative information equally. For example, if they are risk averse,
they will tend to incorporate negative information more fully into the offer price than positive
information. This enables them to share gains on underpriced issues but avoid losses on
overpriced issues.
Column (1) in table 6 shows estimates of equation (3) without the asymmetric market
effect. The coefficients and t-statistics on most of the firm and deal variables are similar to those
in table 2, and the coefficient on MKT50 in column (1) (0.653 with a t-statistic of 14.92) is
similar to the coefficient in the univariate regression in table 4 (0.589 with a t-statistic of 16.76).
The main difference from table 2 is that the coefficient on after-market volatility, VOL, is
smaller (-2.057 versus –3.000). This difference is potentially driven by the interaction between
MKT50 and after-market volatility. French, Schwert, and Stambaugh (1987) find that increases
in stock prices tend to be followed by decreases in market-wide volatility, and Schwert and
Seguin (1990) show that there is a strong market factor in the time-varying volatility of
individual firms.3 Thus, it is possible that the significant coefficient on volatility in table 2 was
driven by correlated omitted variables. After controlling for market returns prior to the offering,
the negative relation between firm volatility and the price update is weaker.
Columns (3) and (5) in table 6 allow for the asymmetry of market returns. In column (3),
the coefficient on MKT is 1.131 (t-statistic of 5.26), implying that market returns of –10% result
3 Although our volatility measure subtracts the volatility of the equally weighted index, is it unlikely that we have perfectly excluded market effects.
Lowry & Schwert, Biases in IPO Pricing
20
in price updates that are 11.3% lower. In contrast, the coefficient on MKT+ is –0.550 (t-statistic
of –2.26), implying that market returns of 10% result in price updates that are only 5.8% higher
(1.131 – 0.550). This much smaller price update when market values rise implies an under-
adjustment to positive new information that becomes available before the IPO. However, the
Fama-MacBeth bootstrap estimates shown in column (5) cast doubt on this conclusion. The
estimate of the coefficient on MKT+ is 0.214 and insignificant at conventional levels (t-statistic
of 0.39). This contrast between the OLS results and the Fama-MacBeth results implies that the
asymmetric effect of market returns is not stable across the sample period. Fama-MacBeth
coefficient estimates on the other variables and their associated t-statistics are similar to those in
columns (3) and (4), indicating that the other relations are stable over time.
4. Predictability of Initial Returns
The process of updating the price of the issuing firm’s stock takes another large step
when the IPO occurs. It is well known that the percent change between the offer price and the
secondary market price (the initial return) is large on average, but also highly variable across
firms. Section 4.1 examines the predictability of initial returns based on firm and offer-specific
characteristics that are known at the time the issue is filed. In section 4.2, we investigate the
extent to which information learned during the registration period is incorporated into the offer
price. Intuitively, if such information is entirely incorporated into the offer price, then it should
have no significant power to explain initial returns. Finally, section 4.3 attempts to differentiate
between the effects of private versus public information learned during the registration period.
Benveniste and Spindt’s (1989) model provides a rational explanation for why private
information should only be partially incorporated into the offer price. However, Loughran and

Lowry & Schwert, Biases in IPO Pricing
21
Ritter’s (2000) findings suggest that both public and private information are only partially
incorporated into the offer price, which is inconsistent with Benveniste and Spindt’s model.
4.1 The Effects of Firm- and Offer-specific Characteristics
The information asymmetry theories of Beatty and Ritter (1986), Rock (1986), and Baron
(1982) suggest that issues characterized by greater uncertainty will tend to be more underpriced
to compensate investors for learning the true value of these issues. Prior work, including Beatty
and Ritter (1986), Megginson and Weiss (1991), and Koh and Walter (1989), has found support
for these information asymmetry theories in cross-sectional analyses. Table 7 re-examines this
issue, employing both pooled cross-sectional regressions and Fama-MacBeth regressions. In
controlling for the possible correlation of regression errors of IPOs close together in time, the
Fama-MacBeth regressions examine the robustness of prior findings.
As a starting point for our initial return analysis, we focus on information that is available
at the time the offer is filed. Specifically, column (1) of table 7 estimates the following
regression,
IRi = α + β1 RANKi + β2 TECHi + β3 TAi + β4 SHRSi + β5 NYSEi +
β6 NMSi + β7 AMEXi + εi , (4)
where the variables were described in section 2. The regression in column (3) adds volatility as
an unbiased estimator of information that is known to the market, but not to econometricians, at
the time the offer is filed.
Our results are generally consistent with the findings of prior literature in that offerings
subject to greater information asymmetry tend to be underpriced by a greater amount.
Specifically, we find that technology firms and smaller firms tend to have higher initial returns
(t-statistics of 4.50 and –5.76 in column (4)). We also find that firms that list on Amex are less

Lowry & Schwert, Biases in IPO Pricing
22
underpriced on average (t-statistic of –3.45). Interestingly, underpricing is not reliably related to
after-market volatility (t-statistic of 1.56).
Columns (5) and (6) in table 7 show the Fama-MacBeth bootstrap estimates of the
regression in column (3) and the associated t-statistics. Most of the estimates and their t-
statistics are similar to those in columns (3) and (4), indicating that these relations are stable over
time. One exception is the coefficient for listing on the Nasdaq NMS, which is positive in the
pooled regressions and reliably negative in the Fama-MacBeth estimates.
4.2. The Effects of Information Learned During the Registration Period
When the IPO firm and its underwriters go on the road show prior to the offering, they
presumably have two main objectives. They wish to market the issue to potential investors, and
they seek to obtain more information on the true value of the firm. To the extent that this new
information gets incorporated into the offer price, it contributes to a more accurate pricing of the
new issue. Note that if such information were entirely incorporated into the offer price, then it
would not be related to the initial return. Table 8 examines whether two measures of information
learned during the registration period, market returns and the price update, are reliably related to
the initial return.
Column (1) of table 8 includes all of the independent variables from table 7, plus two
measures of the information that becomes available during the registration period, MKT50 and
∆P. Assuming underwriters employ both public and private information learned during the
registration price to arrive at the ultimate offer price, the price update (∆P) should incorporate
both types of information. In contrast, MKT50 should only reflect public information. Because
we include both of these variables in one regression, to the extent that MKT50 captures the

Lowry & Schwert, Biases in IPO Pricing
23
effects of public information on the initial return, the coefficient on ∆P should isolate the effects
of private information.
As shown in tables 3, 4, and 5, market returns over different intervals appear to have
varying effects on the offer price, and thus potentially on the initial return. For purposes of
comparison with the results in earlier tables, we report results using MKT50. However, we also
examine the sensitivity of our results to using market returns over other intervals.
As shown in table 8, we find that both information measures are significantly positive (t-
statistics of 3.47 and 18.48 for MKT50 and ∆P, respectively). Consistent with the prior findings
of Loughran and Ritter (2000), this suggests that underwriters only partially incorporate both the
public and the private information that they learn during the registration period into the offer
price. Consequently, such information contributes significantly to the initial return.
The price update regressions in section 3 suggested that underwriters incorporate
negative information more fully into the offer price than positive information. Column (3)
allows for a similar asymmetric effect in the initial return regressions. Specifically, we add both
MKT50+ and ∆P+ to the regression. We find that the effect of price update on initial returns is
strongly asymmetric. A 10% increase in the price update corresponds to a 9% (0.184 + 0.712)
increase in the initial return, while a 10% decrease in the price update corresponds to a smaller
1.84% decrease in the initial return. Thus, the size of the initial return tends to be lower after
negative price updates than after positive price updates. In a contemporaneous paper, Bradley
and Jordan (2001) obtain similar results. They also show that increases in the file range (in
amended prospectuses) have a larger impact on initial returns than decreases in the file range.
As with the results in table 6, investment bankers and issuing firms adjust to negative
information more fully than to positive information. This is consistent with underwriters trying

Lowry & Schwert, Biases in IPO Pricing
24
to avoid losses on overpriced issues while allowing informed investors to share the gains on
underpriced issues.
Once we allow for this asymmetry, neither of the MKT50 measures is reliably related to
initial returns. The t-statistics for both MKT50 measures are less than one in absolute value,
suggesting that public information learned during the registration period is fully incorporated
into the offer price.4
We also estimate the economic impact of market returns and the price update on initial
returns. The regressions in table 8 show that a one standard deviation increase in market returns
(about 10%) is associated with a 0.08 standard deviation increase in initial returns
(approximately 1.45%). Thus, the economic significance of market returns appears quite low. In
comparison, a one standard deviation increase in the price update (about 17.7%) is associated
with a 0.55 standard deviation increase in initial returns (approximately 9.7%).
To the extent that these market returns capture public information learned during the
registration period, the low statistical and economic significance of these returns is consistent
with Benveniste and Spindt and suggests that underwriters fully incorporate public information.
In contrast, the high statistical and economic significance of the price update indicates that they
only partially incorporate private information. This finding is reassuring in the sense that
Benveniste and Spindt provide a rational incentive-based explanation for underwriters only
partially incorporating private information, but similar theories do not hold for public
information.
4 As a robustness check, we estimate the regression by specifying the asymmetric market return variable to be zero when MKT50 is positive and equal to MKT50 when it is negative (call it MKT50-). With this specification, MKT50 is marginally significant (the coefficient equals 0.136 with a t-statistic of 2.39), while MKT50- is not significant at conventional levels (the coefficient equals 0.052 with a t-statistic of 0.21). Given the large sample size the small size of the coefficients, this specification also provides little evidence that underwriters systematically exclude public information in pricing of IPOs.

Lowry & Schwert, Biases in IPO Pricing
25
The strength of this conclusion obviously depends on the extent to which market returns
capture public information. It seems plausible that some of the public information that is learned
during the registration period may not be incorporated in a market-wide index. For example,
events in the issuing firm’s industry may have ramifications for the firm’s value. Such industry
effects may include an overall increase in demand for the industry’s products, circumstances
related to a competitor, or changes in a supplier relationship, among other things. Such
dynamics would be extremely hard to measure directly. At a minimum, public information that
affects the overall market does appear to be fully incorporated into the offer price, and thus does
not contribute to the initial return. Further, as discussed in the next section, sensitivity tests
suggest that results are qualitatively similar after accounting for industry-level effects.
Our finding that public information learned during the registration period is entirely
incorporated into the offer price contrasts with the conclusions of Loughran and Ritter (2000)
and to some extent those of Benveniste, Wilhelm, and Yu (2000). We thus briefly discuss the
differences between the studies that led to these opposite conclusions. Loughran and Ritter
estimate univariate regressions of the initial return on value-weighted market returns during the
15 days prior to the IPO, and they find that initial returns are significantly related to these market
returns. Our results indicate that this relation becomes insignificant after controlling for the
effect of the price update on initial returns and for the asymmetric manner in which investment
bankers incorporate positive versus negative information. Benveniste, Wilhelm, and Yu find that
public information, measured as S&P500 returns during the registration period, is significantly
related to initial returns for mature industry firms, but not for immature industry firms. They
conclude that their results are consistent with Loughran and Ritter, but that the differences
between mature and immature industry firms suggest an alternative interpretation. Specifically,
Lowry & Schwert, Biases in IPO Pricing
26
if some of the information embedded in S&P500 returns first became available through the
bookbuilding process in the primary equity market, then underwriters may consider it to be
private information and only partially incorporate it into the offer price. Because the S&P500
represents mature industry firms, it is more likely that such information originated during the
bookbuilding periods of similar firms, resulting in a significant relation between the initial
returns of mature industry firms and S&P500 returns.
Several other findings emerge from the table 8 regressions. For example, the coefficients
on investment banker rank have opposite signs between tables 6 and 8. Rank is positively
related to the price update, but negatively related to the initial return. This suggests a systematic
conservative bias in IPO pricing by high quality investment banks early in the IPO process in the
preliminary prospectus, but less conservatism when setting the actual IPO price.
Columns (5) and (6) in table 8 show the Fama-MacBeth bootstrap estimates of the
regression in column (3) and the associated t-statistics. Most of the estimates and their t-
statistics are similar to those in columns (3) and (4), indicating that the relations are stable over
time.
We also estimate the regressions in table 8 using market returns over the entire
registration period instead of MKT50. Results are qualitatively similar using this alternative
measure. Specifically, once we account for asymmetric effects, market returns do not contribute
significantly to the initial return. Again, this suggests that public information as represented by
market-wide returns is fully incorporated into the offer price.

Lowry & Schwert, Biases in IPO Pricing
27
5. Robustness Checks
The tests above use data from 1985-97. We have also estimated similar tests extending
the sample through 1999, but the extreme conditions in the IPO market in 1998-99 result in some
unusual estimates when these additional years are included.
5.1. WLS Fama-MacBeth Estimates from 1985-99
Figure 2 shows the time series of estimates of the regression in column (5) of table 7,
estimated year-by-year from 1985-99. It is obvious from figure 2 that the estimates of many of
the coefficients in 1998 and 1999 are extreme outliers compared with the 1985-97 sample, so
including these data could skew the conclusions for the entire sample.
The dispersion of initial returns across different IPOs was much higher in 1998 and 1999,
so any type of least squares (OLS) procedure, such as those used in tables 2 through 8, would
give inordinate weight to the data from the last two years. As one check on this conjecture, we
used weighted least squares (WLS) to create Fama-MacBeth estimates for tables 2, 6, 7, and 8.
The weights used for each year are the cross-sectional standard error estimates for the regression
coefficients. Using this WLS Fama-MacBeth procedure, the estimates from 1985-99 are similar
to the OLS estimates from 1985-97. Thus, after controlling for the heteroskedasticity of the data,
adding 1998 and 1999 does not change the conclusions we draw from the 1985-97 sample.
We chose to report and focus on the results from 1985-97 because it was not necessary to
use complicated WLS procedures in our tests. The data are sufficiently stable within this period
to use standard least squares procedures.

Lowry & Schwert, Biases in IPO Pricing
28
5.2. Industry Portfolios to Measure Public Information
Both prior empirical evidence and practitioner accounts suggest that industry dynamics
have a substantial effect on the pricing of IPOs. In the table 8 regressions, we used the market-
wide index to proxy for public information. To assess the importance of industry information,
we define 13 industry groups based on SIC codes, and classify each IPO firm into one of these
industries. We similarly classify all public firms into one of these industries and calculate equal-
weighted returns across all firms in each industry. We then estimate the regressions in tables 3,
4, 5, 6, and 8 using these industry portfolio returns in place of market-wide returns. For
example, in tables 6 and 8 we substitute the equal-weighted industry returns during the 50 days
prior to the offering (INDUS50) for MKT50, and INDUS50+ for MKT50+.
While the industry returns tend to be slightly more significant than market-wide returns
in explaining initial returns, the overall tenor of results is similar. For example, in panel A of
table 3, industry returns between the setting of the initial price range and the actual offer have the
lowest coefficient estimate, indicating that the importance of public information in the form of
returns to related securities is not directly linked to the exact time that the offer price is set. In
table 8, when both INDUS50 and INDUS50+ are included as independent variables, neither
appears to significantly affect initial returns, given the other variables in the model.
6. Conclusion
This paper examines the entire IPO pricing process to study the apparent biases in the
pricing of new offerings. While some of our findings provide added support for one or more of
the existing theories of IPO pricing, others cannot be explained with these theories.

Lowry & Schwert, Biases in IPO Pricing
29
We begin our analysis with the firm’s revelation of the expected range of offer prices,
which is announced at the time the offer is filed or in an amended prospectus. We find that there
are significant biases in these expected offer prices. Specifically, the price update, defined as the
percent difference between the midpoint of this file range and the final offer price, is predictably
related to publicly known firm- and offer-specific characteristics. Apparently, companies and
their investment bankers do not incorporate all available information when setting this price
range. While significant relations between such characteristics and the initial return have been
interpreted as supportive of information asymmetry theory, it is difficult to similarly explain the
predictability of the price update.
We then investigate how information that becomes available during the book-building
period is incorporated into the offer price. Our results show that companies and their
underwriters update the offer price in response to recent market returns. However, this
adjustment process does not seem to be directly related to the date on which the initial price
range is first revealed. Underwriters appear to consider the past three months of market returns
when they update the offer price, irrespective of when the initial price range was first revealed.
This finding provides additional evidence that all available information is not incorporated into
the initial price range.
We also find that the response of the final offer price to information is asymmetric, with
negative information being more fully incorporated than positive information. This is consistent
with investment bankers trying to avoid losses on overpriced issues, but sharing the gains on
underpriced issues with investors who are able to obtain shares in the IPO allocation.
Finally, the predictability of initial returns shows that underwriters only partially
incorporate private information that is learned during the filing period into the final offer price,

Lowry & Schwert, Biases in IPO Pricing
30
while public information is fully incorporated. This finding is consistent with Benveniste and
Spindt’s partial updating theory.
In summary, our results show that the IPO pricing process is a complicated function of
many factors. Some of the dynamics are explainable under the information asymmetry theory or
the partial updating theory, but other patterns remain puzzles.

Lowry & Schwert, Biases in IPO Pricing
31
References
Baron, David, 1982, A model of the demand for investment banking advising and distribution services for new issues, Journal of Finance 37, 955-976.
Beatty, Randolph and Jay Ritter, 1986, Investment banking, reputation, and the underpricing of
initial public offerings, Journal of Financial Economics 15, 213-232. Benveniste, Lawrence M., William Wilhelm, and Xiaoyun Yu, 2000, Evidence on information
spillovers in the production of investment banking services, University of Minnesota, working paper.
Benveniste, Lawrence M. and Paul A. Spindt, 1989, How investment bankers determine the offer
price and allocation of new issues, Journal of Financial Economics 24, 343-362. Bradley, Daniel J. and Bradford D. Jordan, 2001, Partial adjustment to public information and
IPO underpricing, University of Kentucky, working paper. Carter, Richard B., Frederick H. Dark, and Alan K. Singh, 1998, Underwriter reputation, initial
returns, and the long-run performance of IPO stocks, Journal of Finance 53, 285-311. Chan, Louis, and Josef Lakonishok, 1992, Robust measurement of beta risk, Journal of Financial
and Quantitative Analysis 27, 265-282. Clarkson, Peter M., and Rex Thompson, 1990, Empirical estimates of beta when investors face
estimation risk, Journal of Finance 45, 431-453. Cornelli, Francesca and David Goldreich, 2001, Bookbuilding: How informative is the order
book? Duke University, working paper. Fama, Eugene F. and James D. MacBeth, 1973, Risk, return, and equilibrium: empirical tests,
Journal of Political Economy 81, 607-636. French, Kenneth R., G. William Schwert and Robert F. Stambaugh, 1987, Expected stock returns
and volatility, Journal of Financial Economics 19, 3-29. Gintschel, Andreas, 2000, The relation between quote revisions and market returns in the
absence of trade, University of Rochester, working paper. Habib, Michel A., and Alexander P. Ljungqvist, 2001, Underpricing and entrepreneurial wealth
losses in IPOs: Theory and evidence, Review of Financial Studies 14, 433-458. Hanley, Kathleen Weiss, 1993, The underpricing of initial public offerings and the partial
adjustment phenomenon, Journal of Financial Economics 34, 231-250.

Lowry & Schwert, Biases in IPO Pricing
32
Ibbotson, Roger G., 1975, Price performance of common stock new issues, Journal of Financial Economics 2, 235-272.
Ibbotson, Roger G., Jody L. Sindelar, and Jay R. Ritter, 1988, Initial public offerings, Journal of
Applied Corporate Finance 1, 37-45. Ibbotson, Roger G., Jody L. Sindelar, and Jay R. Ritter, 1994, The market's problems with the
pricing of initial public offerings, Journal of Applied Corporate Finance 7, 66-74. Koh, Francis, and Terry Walter, 1989, A direct test of Rock’s model of the pricing of unseasoned
issues, Journal of Financial Economics 23, 251-272. Loughran, Tim, and Jay R. Ritter, 2001, Why don’t issuers get upset about leaving money on the
table in IPOs? Review of Financial Studies, forthcoming. Lowry, Michelle and G. William Schwert, 2001, IPO market cycles: Bubbles or sequential
learning? Journal of Finance, forthcoming. Ljungqvist, Alexander P., and William J. Wilhelm, 2001, IPO allocations: Discriminatory or
discretionary? New York University, working paper. Megginson, William, and Kathleen Weiss, 1991, Venture capitalist certification in initial public
offerings, Journal of Finance 46, 879-904. Rock, Kevin, 1986, Why new issues are underpriced, Journal of Financial Economics 15, 187-
212. Schwert, G. William and Paul Seguin, 1990, Heteroskedasticity in stock returns, Journal of
Finance 45, 1129-1155. White, Halbert, 1980, A heteroskedasticity-consistent covariance matrix estimator and a direct
test for heteroskedasticity, Econometrica 48, 817-838.

Table 1
Descriptive Statistics for Variables Related to IPO Pricing and Tests for Sample Selection Bias Based on Availability of SDC and CRSP Data, 1985-97
Column (1) shows the means for the variables used to estimate regression models in subsequent tables. IR is the initial return to IPO investors using
SDC data from 1985-97, the percent difference between the IPO price and the secondary market price. ∆P is the percent price update between the middle of the range of prices in the initial registration statement and the offer price. ∆P+ is the price update when ∆P is positive, and zero otherwise. RANK is the underwriter rank, from Carter, Dark, and Singh (1998). TECH equals one if the firm is in a high tech industry [biotech, computer equipment, electronics, communications, and general technology (as defined by SDC)], and zero otherwise. TA equals the logarithm of real total assets (1983 dollars) before the IPO. SHRS is the logarithm of millions of shares filed in the IPO. VOL is the market-adjusted volatility of the IPO stock return, the standard deviation of daily returns to the IPO stock in trading days 22 through 63 after the IPO minus the standard deviation of daily returns to the CRSP equal-weighted market index during the same period. NYSE equals one if the IPO firm will be listed on the New York Stock Exchange, and zero otherwise. NMS equals one if the IPO firm will be listed on the Nasdaq National Market System, and zero otherwise. AMEX equals one if the IPO firm will be listed on the American Stock Exchange, and zero otherwise. MKT is the return to the CRSP equal-weighted portfolio of NYSE, Amex, and Nasdaq-listed stocks for the period between the filing date and the offering date for the IPO. MKT+ is the return to the market MKT when it is positive, and zero otherwise. The estimates in column (1) are based on the common regression sample of 3,592 firms with complete data. Columns (2) and (3) show estimates of the means in the sample of cases where data are missing for some other variable so they are not included in the regression analysis, with a t-statistic testing whether the difference from the regression sample is reliably different from zero using White’s (1980) heteroskedasticity-consistent standard errors. Column (4) shows the size of the incomplete data sample. Column (5) shows the proportion of observations for each year from 1985-97 for the cases in the regression sample. Column (6) shows the proportion of observations for each year from 1985-97 where data are missing for some other variable so they are not included in the regression analysis, with a t-statistic testing whether the difference from the regression sample is reliably different from zero.
(1) (2) (3) (4) (5) (6) (7) Regression
Sample (N=3,592)
Incomplete Data Sample
t-statistic for Difference
Incomplete Data Sample
Size, N
Regression Sample
(N=3,592)
Incomplete Data Sample (N=1,364)
t-statistic for Difference
Variable Mean Mean Year Percent Percent IR 13.176 11.562 2.05 1,238 1985 0.053 0.059 -0.74 ∆P -2.800 -2.407 -0.73 1,334 1986 0.110 0.124 -1.35 ∆P+ 4.984 4.185 2.91 1,334 1987 0.071 0.109 -3.97 RANK 6.243 6.119 1.09 1,364 1988 0.030 0.043 -2.07 TECH 0.340 0.318 1.46 1,364 1989 0.024 0.039 -2.51 TA 16.786 16.837 -0.41 517 1990 0.025 0.034 -1.74 SHRS 14.587 14.678 -2.82 1,033 1991 0.054 0.081 -3.25 VOL 1.950 1.873 3.84 1,068 1992 0.085 0.080 0.61 NYSE 0.099 0.167 -6.07 1,364 1993 0.102 0.110 -0.82 NMS 0.526 0.432 5.94 1,364 1994 0.060 0.069 -1.14 AMEX 0.042 0.032 1.77 1,364 1995 0.102 0.087 1.68 MKT 6.425 5.666 2.19 1,333 1996 0.168 0.097 6.98 MKT+ 6.984 6.288 2.12 1,333 1997 0.117 0.070 5.31

Table 2
Firm and Deal Characteristics That Predict Price Updates Between the Initial Filing and the IPO, 1985-97
Regression models for the percentage change between middle of the range of prices in the initial registration statement and the offer price,
∆P, using SDC data from 1985-97. RANK is the underwriter rank, from Carter, Dark, and Singh (1998). TECH equals one if the firm is in a high tech industry [biotech, computer equipment, electronics, communications, and general technology (as defined by SDC)], and zero otherwise. TA equals the logarithm of real total assets (1983 dollars) before the IPO. SHRS is the logarithm of millions of shares filed in the IPO. NYSE equals one if the IPO firm will be listed on the New York Stock Exchange, and zero otherwise. NMS equals one if the IPO firm will be listed on the Nasdaq National Market System, and zero otherwise. AMEX equals one if the IPO firm will be listed on the American Stock Exchange, and zero otherwise. VOL is the market-adjusted volatility of the IPO stock return, the standard deviation of daily returns to the IPO stock in trading days 22 through 63 after the IPO minus the standard deviation of daily returns to the CRSP equal-weighted market index during the same period. The t-statistics use White's (1980) heteroskedasticity consistent standard errors. R2 is the coefficient of determination, adjusted for degrees of freedom. S(u) is the standard error of the regression. The sample size is 3,592 observations. Fama-MacBeth (1973) estimates are an average of the year-by-year regression coefficients and the t-statistics are based on the standard deviation of the time-series of coefficient estimates. R2 is the average coefficient of determination across the yearly regressions. For the Fama-MacBeth estimates, R2 is average of the yearly coefficients of determination.
Pooled Fama-MacBeth Pooled Fama-MacBeth (1) (2) (3) (4) (5) (6) (7) (8) Coefficient t-statistic Coefficient t-statistic Coefficient t-statistic Coefficient t-statistic Constant 12.762 1.90 22.224 2.15 18.726 2.76 33.873 3.05 RANK 0.461 4.57 0.388 2.66 0.442 4.39 0.411 2.96 TECH 2.596 3.56 1.867 1.92 2.875 3.96 2.502 2.42 TA -0.584 -3.03 -0.739 -2.16 -0.765 -3.98 -0.839 -2.47 SHRS -0.727 -1.47 -1.020 -2.06 -0.546 -1.10 -1.265 -1.95 NYSE 4.743 3.90 2.720 1.33 4.523 3.73 1.936 0.77 NMS 1.610 2.34 -3.075 -3.16 2.276 3.27 -3.096 -2.70 AMEX -5.492 -2.90 -9.206 -3.15 -5.847 -3.11 -9.602 -3.15 VOL -3.000 -5.41 -3.322 -2.79 R2 0.020 0.032 0.027 0.043 S(u) 18.124 18.062

Table 3
Relation of Price Updates to Public Information: Market Returns During the Registration Period, 1985-97
Regression models for the percentage change between middle of the range of prices in the initial
registration statement and the offer price, ∆P, using SDC data from 1985-97.
∆Pi = α + β MKTi + εi MKT is the return to the CRSP equal-weighted portfolio of NYSE, Amex, and Nasdaq-listed stocks for the period between the filing date and the offering date for the IPO. MKT25%, MKT50%, and MKT75% are market returns for the last 25%, 50%, and 75% of the filing period, ending the day before the IPO.
The sample in Panel A includes the 554 firms for which the exact date of the filing containing the
initial price range (which sometimes occurs in amended filings after the initial IPO registration) could be determined from EDGAR during 1996-97. MKTMATCH is the return to the market from the day that the initial pricing range is revealed to the day before the IPO. The sample in Panel B includes the 4,919 firms with price update information available from SDC from 1985-97.
The t-statistics use White's (1980) heteroskedasticity-consistent standard errors. R2 is the
coefficient of determination, adjusted for degrees of freedom.
A. 554 Firms from EDGAR, 1996-97, with Dates for Initial Filing Range
MKT25% MKT50% MKT75% MKT MKTMATCH
β 0.455 0.421 0.416 0.470 0.302 t-statistic (β = 0) 1.42 2.34 3.55 5.06 2.08 R2 0.005 0.014 0.028 0.049 0.010
B. 4,919 Firms from SDC, 1985-97
β 0.116 0.127 0.121 0.145 t-statistic (β = 0) 1.30 2.53 3.26 4.41 R2 0.000 0.002 0.004 0.007
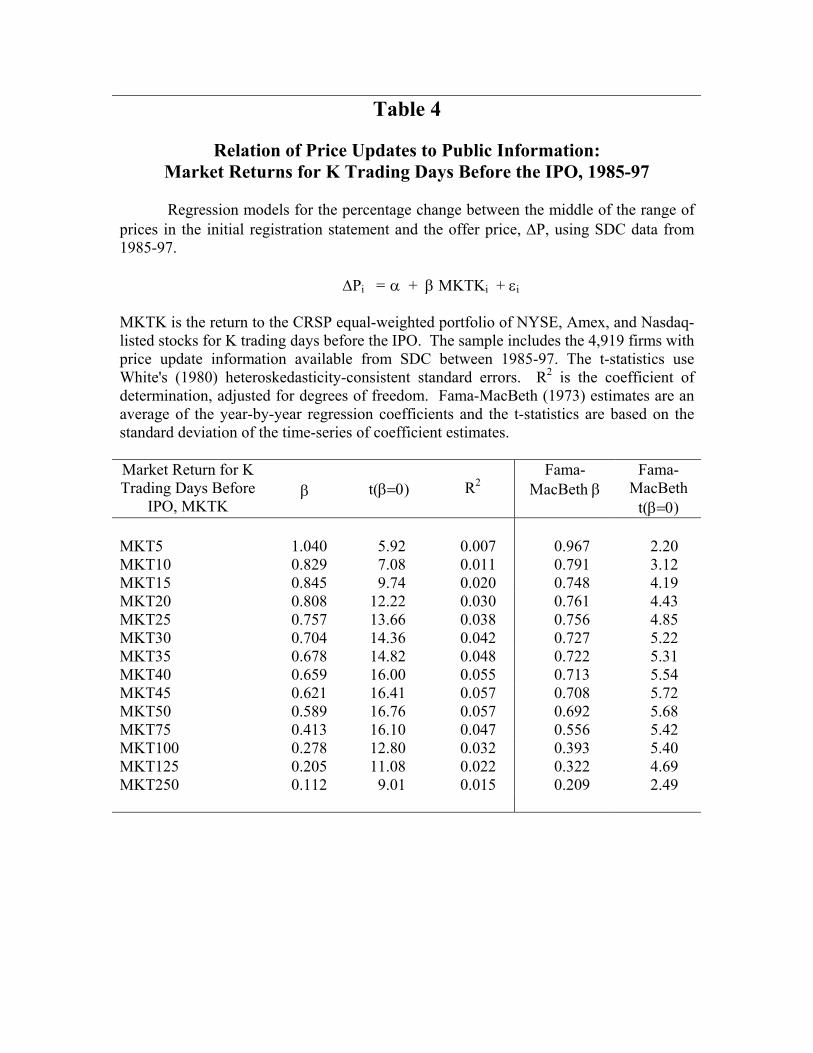
Table 4
Relation of Price Updates to Public Information: Market Returns for K Trading Days Before the IPO, 1985-97
Regression models for the percentage change between the middle of the range of
prices in the initial registration statement and the offer price, ∆P, using SDC data from 1985-97.
∆Pi = α + β MKTKi + εi
MKTK is the return to the CRSP equal-weighted portfolio of NYSE, Amex, and Nasdaq-listed stocks for K trading days before the IPO. The sample includes the 4,919 firms with price update information available from SDC between 1985-97. The t-statistics use White's (1980) heteroskedasticity-consistent standard errors. R2 is the coefficient of determination, adjusted for degrees of freedom. Fama-MacBeth (1973) estimates are an average of the year-by-year regression coefficients and the t-statistics are based on the standard deviation of the time-series of coefficient estimates.
Market Return for K Trading Days Before
IPO, MKTK
β
t(β=0)
R2
Fama-MacBeth β
Fama-MacBeth
t(β=0) MKT5 1.040 5.92 0.007 0.967 2.20 MKT10 0.829 7.08 0.011 0.791 3.12 MKT15 0.845 9.74 0.020 0.748 4.19 MKT20 0.808 12.22 0.030 0.761 4.43 MKT25 0.757 13.66 0.038 0.756 4.85 MKT30 0.704 14.36 0.042 0.727 5.22 MKT35 0.678 14.82 0.048 0.722 5.31 MKT40 0.659 16.00 0.055 0.713 5.54 MKT45 0.621 16.41 0.057 0.708 5.72 MKT50 0.589 16.76 0.057 0.692 5.68 MKT75 0.413 16.10 0.047 0.556 5.42 MKT100 0.278 12.80 0.032 0.393 5.40 MKT125 0.205 11.08 0.022 0.322 4.69 MKT250 0.112 9.01 0.015 0.209 2.49

Table 5
Relation of Price Updates to Public Information: Market Returns for K Trading Days Before the IPO, 1985-97
Regression models for the percentage change between the middle of the range of
prices in the initial registration statement and the offer price, ∆P, using SDC data from 1985-97.
13
∆Pi = α + Σ βi XKi + εi K=1
XKi is the weekly (WKi) or monthly (MKi) market return for the Kth week or month before the IPO. Each weekly return is measured using 5 trading day returns and each monthly return is measured using 20 trading day returns of the CRSP equal-weighted portfolio of NYSE, Amex, and Nasdaq-listed stocks. The sample includes the 4,919 firms with price update information available from SDC from 1985-97. The t-statistics use White's (1980) heteroskedasticity-consistent standard errors. R2 is the coefficient of determination, adjusted for degrees of freedom. S(u) is the standard error of the regression.
Weekly Lags
Monthly Lags
Variable Coefficient t-statistic Variable Coefficient t-statistic
Constant -6.954 -19.49 Constant -7.294 -12.74 W1 0.552 3.08 M1 0.658 9.53 W2 0.447 2.45 M2 0.705 9.31 W3 0.894 4.79 M3 0.343 5.40 W4 0.724 4.12 M4 0.083 1.27 W5 0.790 4.63 M5 0.002 0.02 W6 0.441 2.37 M6 -0.011 -0.18 W7 0.707 3.40 M7 -0.009 -0.14 W8 0.799 4.47 M8 -0.057 -0.95 W9 0.328 1.87 M9 0.101 1.71 W10 0.304 1.66 M10 0.068 1.17 W11 0.053 0.30 M11 0.058 1.00 W12 0.446 2.51 M12 0.042 0.59 W13 0.244 1.48 M13 -0.221 -3.50 R2 0.059 R2 0.061 S(u) 17.207 S(u) 17.191

Table 6
Firm and Deal Characteristics and Market Conditions That Predict Price Updates Between the Initial Filing and the IPO, 1985-97
Regression models for the percentage change between the middle of the range of prices in the
initial registration statement and the offer price, ∆P, using SDC data from 1985-97. RANK is the underwriter rank, from Carter, Dark, and Singh (1998). TECH equals one if the firm is in a high tech industry [biotech, computer equipment, electronics, communications, and general technology (as defined by SDC)], and zero otherwise. TA equals the logarithm of real total assets (1983 dollars) before the IPO. SHRS is the logarithm of millions of shares filed in the IPO. NYSE equals one if the IPO firm will be listed on the New York Stock Exchange, and zero otherwise. NMS equals one if the IPO firm will be listed on the Nasdaq National Market System, and zero otherwise. AMEX equals one if the IPO firm will be listed on the American Stock Exchange, and zero otherwise. VOL is the market-adjusted volatility of the IPO stock return, the standard deviation of daily returns to the IPO stock in trading days 22 through 63 after the IPO minus the standard deviation of daily returns to the CRSP equal-weighted market index during the same period. MKT50 is the return to the CRSP equal-weighted portfolio of NYSE, Amex, and Nasdaq-listed stocks for 50 trading days before the IPO. MKT50+ is the return to the market MKT50 when it is positive, and zero otherwise. The t-statistics use White's (1980) heteroskedasticity consistent standard errors. R2 is the coefficient of determination, adjusted for degrees of freedom. S(u) is the standard error of the regression. The sample size is 3,592 observations. Fama-MacBeth (1973) estimates are an average of the year-by-year regression coefficients and the t-statistics are based on the standard deviation of the time-series of coefficient estimates. For the Fama-MacBeth estimates, R2 is average of the yearly coefficients of determination. Fama-MacBeth (1) (2) (3) (4) (5) (6) Coefficient t-statistic Coefficient t-statistic Coefficient t-statistic
Constant 15.375 2.34 15.968 2.42 19.195 1.89 RANK 0.462 4.76 0.464 4.78 0.373 2.94 TECH 2.477 3.52 2.480 3.53 2.013 1.85 TA -0.537 -2.87 -0.536 -2.85 -0.778 -2.12 SHRS -0.927 -1.93 -0.917 -1.90 -0.873 -1.36 NYSE 2.895 2.49 2.897 2.49 2.079 0.94 NMS 0.335 0.49 0.313 0.46 -2.911 -2.65 AMEX -6.145 -3.38 -6.076 -3.37 -9.549 -3.23 VOL -2.057 -3.81 -2.042 -3.78 -1.352 -1.99 MKT50 0.653 14.92 1.131 5.26 0.690 1.53 MKT50+ -0.550 -2.26 0.214 0.39 R2 0.087 0.088 0.120 S(u) 17.497 17.485

Table 7
Firm and Deal Characteristics That Predict Initial Returns to IPO Investors, 1985-97
Regression models for the percentage change between the offer price and the secondary market
trading price, IR, using SDC data from 1985-97. RANK is the underwriter rank, from Carter, Dark, and Singh (1998). TECH equals one if the firm is in a high tech industry [biotech, computer equipment, electronics, communications, and general technology (as defined by SDC)], and zero otherwise. TA equals the logarithm of real total assets (1983 dollars) before the IPO. SHRS is the logarithm of millions of shares filed in the IPO. NYSE equals one if the IPO firm will be listed on the New York Stock Exchange, and zero otherwise. NMS equals one if the IPO firm will be listed on the Nasdaq National Market System, and zero otherwise. AMEX equals one if the IPO firm will be listed on the American Stock Exchange, and zero otherwise. VOL is the market-adjusted volatility of the IPO stock return, the standard deviation of daily returns to the IPO stock in trading days 22 through 63 after the IPO minus the standard deviation of daily returns to the CRSP equal-weighted market index during the same period. The t-statistics use White's (1980) heteroskedasticity consistent standard errors. R2 is the coefficient of determination, adjusted for degrees of freedom. S(u) is the standard error of the regression. The sample size is 3,592 observations. Fama-MacBeth (1973) estimates are an average of the year-by-year regression coefficients and the t-statistics are based on the standard deviation of the time-series of coefficient estimates. For the Fama-MacBeth estimates, R2 is average of the yearly coefficients of determination. Fama-MacBeth (1) (2) (3) (4) (5) (6) Coefficient t-statistic Coefficient t-statistic Coefficient t-statistic
Constant 17.805 1.85 15.417 1.58 41.452 3.05 RANK -0.081 -0.66 -0.073 -0.60 -0.022 -0.13 TECH 3.968 4.55 3.856 4.50 2.705 2.54 TA -1.635 -6.28 -1.562 -5.76 -1.043 -3.97 SHRS 1.480 1.99 1.408 1.88 -0.585 -0.65 NYSE -0.152 -0.08 -0.064 -0.03 -4.011 -1.32 NMS 1.233 1.14 0.966 0.86 -5.036 -3.62 AMEX -6.021 -3.53 -5.879 -3.45 -9.223 -3.99 VOL 1.201 1.56 0.029 0.02 R2 0.036 0.037 0.057 S(u) 21.558 21.552

Table 8
Effects of Information Learned During the Registration Period on Initial Returns to IPO Investors, 1985-97
Regression models for the percentage change between the offer price and the secondary market
trading price, IR, using SDC data from 1985-97. RANK is the underwriter rank, from Carter, Dark, and Singh (1998). TECH equals one if the firm is in a high tech industry [biotech, computer equipment, electronics, communications, and general technology (as defined by SDC)], and zero otherwise. TA equals the logarithm of real total assets (1983 dollars) before the IPO. SHRS is the logarithm of millions of shares filed in the IPO. NYSE equals one if the IPO firm will be listed on the New York Stock Exchange, and zero otherwise. NMS equals one if the IPO firm will be listed on the Nasdaq National Market System, and zero otherwise. AMEX equals one if the IPO firm will be listed on the American Stock Exchange, and zero otherwise. VOL is the market-adjusted volatility of the IPO stock return, the standard deviation of daily returns to the IPO stock in trading days 22 through 63 after the IPO minus the standard deviation of daily returns to the CRSP equal-weighted market index during the same period. MKT50 is the return to the CRSP equal-weighted portfolio of NYSE, Amex, and Nasdaq-listed stocks for 50 trading days before the IPO. MKT50+ is the return to the market, MKT50, when it is positive, and zero otherwise. ∆P is the price update between the middle of the range of prices in the initial registration statement and the offer price. ∆P+ is the price update when ∆P is positive, and zero otherwise. The t-statistics use White's (1980) heteroskedasticity consistent standard errors. R2 is the coefficient of determination, adjusted for degrees of freedom. S(u) is the standard error of the regression. The sample size is 3,592 observations. Fama-MacBeth estimates are an average of the year-by-year regression coefficients and the t-statistics are based on the standard deviation of the time-series of coefficient estimates. For the Fama-MacBeth estimates, R2 is average of the yearly coefficients of determination. Fama-MacBeth (1) (2) (3) (4) (5) (6) Coefficient t-statistic Coefficient t-statistic Coefficient t-statistic
Constant 6.292 0.67 12.365 1.32 27.995 2.19 RANK -0.264 -2.36 -0.447 -4.01 -0.371 -2.50 TECH 2.484 3.22 1.172 1.56 0.536 0.71 TA -1.167 -4.55 -1.117 -4.33 -0.753 -2.99 SHRS 1.555 2.15 1.050 1.43 -0.126 -0.12 NYSE -2.471 -1.39 -2.391 -1.35 -4.990 -1.93 NMS -0.524 -0.48 -2.038 -1.90 -4.038 -2.30 AMEX -3.363 -1.93 -4.750 -2.87 -7.244 -3.54 VOL 2.764 3.85 2.163 3.12 1.164 1.32 MKT50 0.162 3.47 0.188 0.87 -0.365 -0.36 MKT50+ -0.052 -0.21 0.717 0.60 ∆P 0.443 18.48 0.184 8.41 0.191 10.84 ∆P+ 0.712 8.92 0.523 3.35 R2 0.181 0.217 0.219 S(u) 19.876 19.426

Figure 2. Time series plot of year-by-year estimates of the regression of initial returns to IPO investors on firm and deal characteristics (table 7), 1985-99.
85 86 87 88 89 90 91 92 93 94 95 96 97 98 99
RANKTECH
TASHRS
NYSENASDAQ
AMEXVOL
-30
-20
-10
0
10
20
30
40
50C
oeff
icie
nt E
stim
ates
Var
iabl
e
RANK TECH TA SHRS NYSE NASDAQ AMEX VOL