nests of red wood ants (formica rufa-group) are …nests of red wood ants (formica rufa-group) are...
TRANSCRIPT

Nests of red wood ants (Formicarufa-group) are positively associated withtectonic faults: a double-blind test
Israel Del Toro1, Gabriele M. Berberich2, Relena R. Ribbons1, Martin B.Berberich3, Nathan J. Sanders4 and Aaron M. Ellison5
1 Department of Biology, Lawrence University, Appleton, WI, USA2 Faculty of Electrical Engineering and Information Technology, Technical University of
Dortmund, Dortmund, Germany3 IT-Consulting Berberich, Erftstadt, Germany4 Rubenstein School of Environment and Natural Resources, University of Vermont, Burlington,
VT, USA5 Harvard Forest, Harvard University, Petersham, MA, USA
ABSTRACTEcological studies often are subjected to unintentional biases, suggesting that
improved research designs for hypothesis testing should be used. Double-blind
ecological studies are rare but necessary to minimize sampling biases and omission
errors, and improve the reliability of research. We used a double-blind design to
evaluate associations between nests of red wood ants (Formica rufa, RWA) and the
distribution of tectonic faults. We randomly sampled two regions in western
Denmark to map the spatial distribution of RWA nests. We then calculated nest
proximity to the nearest active tectonic faults. Red wood ant nests were eight times
more likely to be found within 60 m of known tectonic faults than were random
points in the same region but without nests. This pattern paralleled the directionality
of the fault system, with NNE–SSW faults having the strongest associations with
RWA nests. The nest locations were collected without knowledge of the spatial
distribution of active faults thus we are confident that the results are neither biased
nor artefactual. This example highlights the benefits of double-blind designs in
reducing sampling biases, testing controversial hypotheses, and increasing the
reliability of the conclusions of research.
Subjects Biogeography, Ecology, Entomology, Statistics
Keywords Double-blind, Tectonic faults, Formicidae, Species distributions, Clustering
INTRODUCTIONA central question for ecology—the study of the distribution and abundance of
organisms—is why do organisms occur where they do? Explanations include relationships
between organisms and specific environments, interspecific interactions, or random
chance. All of these explanations have been suggested to apply to ants, one of the most
widespread and abundant taxon on Earth (Holldobler &Wilson, 1990; Lach, Parr & Abbott,
2010). Berberich & Schreiber (2013) and Berberich et al. (2016b) reported a seemingly
peculiar positive spatial association between the geographically widespread, conspicuous
red wood ants (Formica rufa-group, RWA) and seismically active, degassing tectonic
How to cite this article Del Toro et al. (2017), Nests of red wood ants (Formica rufa-group) are positively associated with tectonic faults: a
double-blind test. PeerJ 5:e3903; DOI 10.7717/peerj.3903
Submitted 6 July 2017Accepted 18 September 2017Published 12 October 2017
Corresponding authorIsrael Del Toro,
Academic editorJoseph Gillespie
Additional Information andDeclarations can be found onpage 6
DOI 10.7717/peerj.3903
Copyright2017 Del Toro et al.
Distributed underCreative Commons CC-BY 4.0

faults. This work has been difficult to publish because reviewers have suggested that the
authors are ignoring alternative explanations or are ignorant of the basic biology of ants.
Such critiques are familiar to anyone who has proposed a new or controversial hypothesis,
but it is indeed peculiar that ants would be associated with degassing tectonic faults.
Here, we confront the observations of Berberich and colleagues using a double-blind
study. Double-blind studies, in which treatment assignments (or data collected) are
concealed to researchers and subjects, are the most robust ones for testing any hypothesis,
especially controversial ones, and increase the reliability of results and conclusions
(Holman et al., 2015). Double-blind designs are routine in medical sciences, but rare in
ecology (Kardish et al., 2015). To test more robustly the hypothesis that RWA nests are
associated with active faults, we used a double-blind design in which myrmecologists
who were unaware of this hypothesis or any published work on links between RWA
and seismic activity (IDT and RRR) were sent into the field to map RWA nests.
Simultaneously, maps of active tectonic faults in the region were obtained and organized
by geoscientists (GMB and MBB) without any knowledge of the field data. With these two
independently collected datasets, we then asked whether ants were positively associated
with tectonic faults.
MATERIALS AND METHODSSampling design and data collectionWith no prior knowledge, IDT and RRR surveyed two regions of the Jutland Peninsula of
Denmark: Thisted in the north and Klosterhede in the south (Figs. 1A–1C). Both study
areas are located within the Permian–Cenozoic Danish Basin, which was formed by crustal
extension, subsidence, and local faulting (Nielsen, 2003). This basin is bounded in the
north by the seismically active, NW–SE striking fault system of the Sorgenfrei-Tornquist-
Zone (STZ in Fig. 1A) and in the south by the basement blocks of the Ringkøbing–Fyn
High and the Brande Graben (RFH and BG in Fig. 1A). The dominating compressional
stress field is orientated primarily NW–SE direction (Fig. 1D) but scatters in different
regions (Gregersen, 2002; Helmholtz Centre Potsdam—GFZ German Research Centre for
Geosciences, 2008).
The Thisted region (∼670 km2) included parts of the Thy National Park. The
Klosterhede region (∼700 km2), included the Klosterhede plantation, the third largest
forested area in Denmark. Landscapes and vegetation communities varied between the
two sampling regions. Coastal dunes dominated the Thisted region, whereas a mix of
grasslands, pine and oak forests, and conifer plantations dominated the Klosterhede
region. Agricultural lands in both regions were primarily rapeseed plantations.
Before surveying for RWA nests, and with no prior knowledge of the spatial
distribution of tectonic faults, the two regions were subdivided into ∼1,000 � 1,500 m
grid cells. One hundred of the cells in each region were selected at random for
mapping RWA nests, using the rnorm function in R (version 3.31). At each site, we used
an adaptive sampling design to search for RWA nests. If no RWA nests were encountered
within an initial 30 min sampling period, we considered RWA to be absent from the
grid cell. However, if a RWA nest was encountered within an initial 30 min of searching,
Del Toro et al. (2017), PeerJ, DOI 10.7717/peerj.3903 2/8

the survey was continued for an additional 30 min; this process was repeated until no
new nests were found within the survey grid cell boundaries. The location of each
RWA nest found was recorded using a Garmin Oregon 600 GPS unit (Garmin, Olathe,
KS, USA); three individual worker ants were collected from every nest for subsequent
species identification. Voucher specimens were deposited in the Natural History Museum
of Denmark, Copenhagen.
GMB and MBB synthesized published data on geotectonic structures of the two study
areas (data in Supplementary Online Material) with tectonic maps provided by Stig
Pedersen (Geological Survey of Denmark) and the GEUS Map Server (The Geological
Survey of Denmark and Greenland, 2015); they did so with no knowledge of the
distributions of the RWA nest data collected by IDT and RRR.
Spatial data and analysesSpatial clustering of RWA nests was examined with Ripley’s K (Ripley, 1977). The
distance from each nest to the nearest fault line was calculated using the “distmap”
function in the “spstat” library (Baddeley, Rubak & Turner, 2015) using R (version 3.3.1)
(R Development Core Team, 2014). We then estimated ρ: the effect of the spatial covariate(i.e., distance to faults) on the spatial intensity of the locations of the ant nests and the
locations of cells without ants (Baddeley et al., 2012). Finally, we used a Komlogrov–
Smirnov (K–S) test to test if observed RWA nests were closer to faults than locations
sampled (i.e., the center of the sampled grid cell) where no RWA nests were detected.
We attempted to reduce sampling bias resulting from spatial autocorrelation by using a
random sampling grid. The remaining spatial autocorrelation or clustering most likely is
Figure 1 (A) Map of Jutland Peninsula, highlighting the two sampling regions and major tectonic
units. Thisted (B) and Klosterhede regions (C) are shown in detail. Thisted region (north) and the
Klosterhede region (south) are shaded in red. Blue points indicate absence of RWA from grid survey; red
points indicate the location of RWA nests. (D) Distribution of faults in the Jutland Peninsula (after
Vejbæk, 1997; Petersen et al., 2008; The Geological Survey of Denmark and Greenland, 2015) with red and
blue points as in C and D. Full-size DOI: 10.7717/peerj.3903/fig-1
Del Toro et al. (2017), PeerJ, DOI 10.7717/peerj.3903 3/8

related to the polydomous and polygynous colony structure of many F. rufa-group
species (Seifert, 2007).
RESULTS AND DISCUSSIONRWA nests occur closer to fault lines than expected by chanceRed wood ant nests occurred in 28 of the 200 random grid cells (12 in the Thisted region
and 16 in the Klosterhede region). When RWA occurred in a sampled grid cell, there were
generally >1 nest; in total we detected 273 nests of Formica species. All but four (one Formica
serviformica and three Formica fusca) were nests of F. rufa-group ants: 86% were nests of
Formica polyctena and 12% were F. rufa. In both regions, RWA nests were spatially clustered
according to Ripley’s K, but cells without ants were not spatially clustered (Fig. 1).
Covariance of RWA nests and faults was highest within 60 m of faults (Fig. 2A), and
approached zero at greater distances. In contrast, there was no observable covariance
between cells without RWA nests and their distance from faults (Fig. 2B). RWA nests were
approximately eight times more likely to be found at distances <60 m from a fault than
were cells without ants (K–S test, D = 0.373, P < 0.001).
Figure 2 (A) Correlation of ant distributions with tectonic fault zones in the region. (B) Correlation
of ant absences with tectonic fault zones in the region. (C–H) Correlations of ant distributions
with direction patterns of tectonic fault zones in the pooled dataset.
Full-size DOI: 10.7717/peerj.3903/fig-2
Del Toro et al. (2017), PeerJ, DOI 10.7717/peerj.3903 4/8
The directionality of a fault also affected the covariance between the spatial intensity of
RWA nests and their distance to faults (Figs. 2C–2H). Specifically, at distances <100 m
from an active fault and relative to grid cells lacking ants, RWA nests were 10 times
more likely along faults trending NNE–SSW (Fig. 2F) and up to eight times more likely
on faults trending NW–SE or NNW–SSE (Figs. 2C and 2D). These directions are
associated with the present-day main tectonic stress field and its scattering directions
(Helmholtz Centre Potsdam—GFZ German Research Centre for Geosciences, 2008).
In contrast, RWA were only two to four times more likely to faults trending NE–SW or
WNW–ESE (Figs. 2E and 2G), and did not occur adjacent to faults trending ENE–WSW
(Fig. 2H).
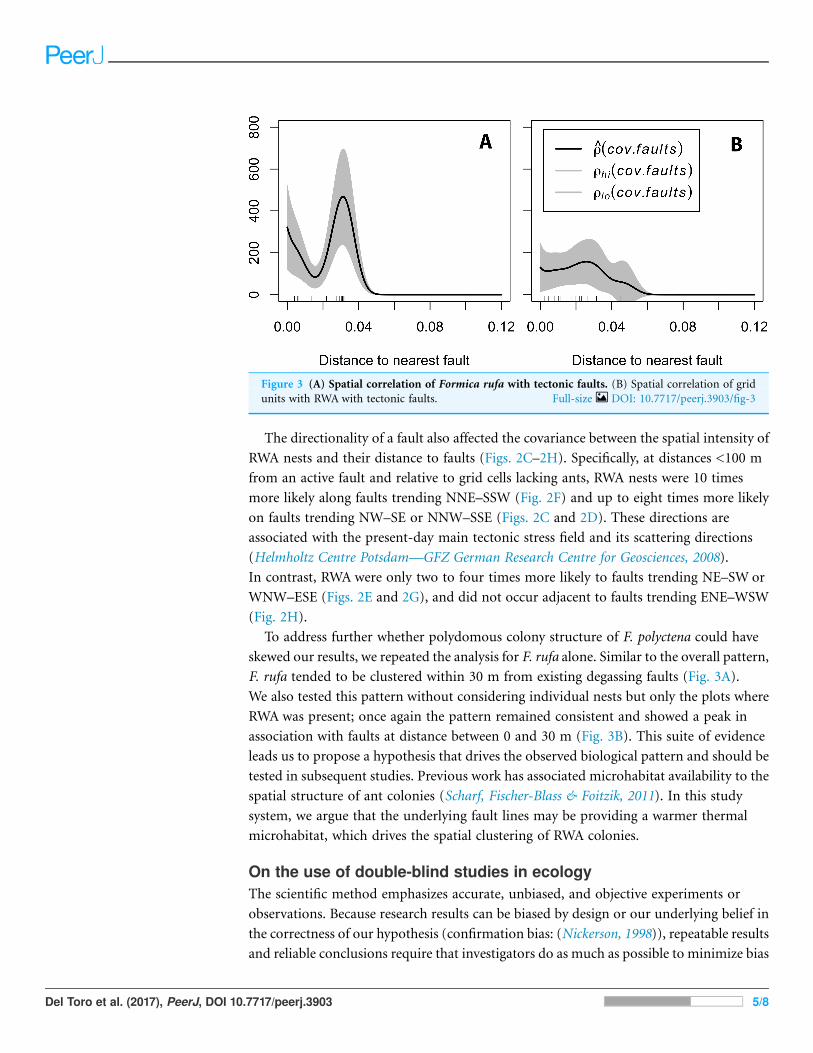
To address further whether polydomous colony structure of F. polyctena could have
skewed our results, we repeated the analysis for F. rufa alone. Similar to the overall pattern,
F. rufa tended to be clustered within 30 m from existing degassing faults (Fig. 3A).
We also tested this pattern without considering individual nests but only the plots where
RWA was present; once again the pattern remained consistent and showed a peak in
association with faults at distance between 0 and 30 m (Fig. 3B). This suite of evidence
leads us to propose a hypothesis that drives the observed biological pattern and should be
tested in subsequent studies. Previous work has associated microhabitat availability to the
spatial structure of ant colonies (Scharf, Fischer-Blass & Foitzik, 2011). In this study
system, we argue that the underlying fault lines may be providing a warmer thermal
microhabitat, which drives the spatial clustering of RWA colonies.
On the use of double-blind studies in ecologyThe scientific method emphasizes accurate, unbiased, and objective experiments or
observations. Because research results can be biased by design or our underlying belief in
the correctness of our hypothesis (confirmation bias: (Nickerson, 1998)), repeatable results
and reliable conclusions require that investigators do as much as possible to minimize bias
Figure 3 (A) Spatial correlation of Formica rufa with tectonic faults. (B) Spatial correlation of grid
units with RWA with tectonic faults. Full-size DOI: 10.7717/peerj.3903/fig-3
Del Toro et al. (2017), PeerJ, DOI 10.7717/peerj.3903 5/8

in all aspects of a research project (Rosenthal & Rosnow, 2007). Double-blind designs
provide the gold-standard for unbiased experiments (Holman et al., 2015).
In the interest of avoiding bias and increasing the repeatability and reliability of
ecological research, we suggest that the benefits of double-blind studies far outweigh the
additional costs and logistical complications of creating blinded research teams. The need
for multiple research teams leads directly to increased costs and additional project
coordination. Trade-offs among personnel, sampling effort, and sampling intensity
depend on available resources. In our study, for example, we reduced sampling effort by
randomly, not exhaustively, sampling the ∼1,400 km2 of the pre-defined study regions.
A second cost of a double-blind study such as ones focused on species occurrences is the
general tendency to focus on where a species occurs, as opposed to where it does not.
For example, most species distribution models are based only on “presence-only” data, as
absences are rarely recorded (Berberich et al., 2016a). Yet as we have shown here, the
samples of locations lacking RWA nests were crucial for determining whether RWA nests
and fault systems had meaningful patterns of covariance.
Double-blind experiments remain rare in ecology (Holman et al., 2015) but their
importance cannot be overestimated. Results and conclusions of double-blind studies are
unlikely to be biased by the views and perspectives of the researchers themselves.
Investment in appropriately replicated double-blind studies also may be more cost-
effective because they rarely need to be repeated, even if the results are unexpected. Just as
double-blind studies in medicine have led to reliable treatments that for injury and
disease, double-blind studies in ecology will provide us with high-quality unbiased data of
how the natural world is structured and is changing.
ADDITIONAL INFORMATION AND DECLARATIONS
FundingIsrael Del Toro was supported by a National Science Foundation Postdoctoral Research
Fellowship; Aaron M. Ellison was supported by NSF grant (DEB-1136646); Nathan J.
Sanders was supported by a National Science Foundation Dimensions of Biodiversity
grant (NSF-1136703). The funders had no role in study design, data collection, and
analysis, decision to publish, or preparation of the manuscript.
Grant DisclosuresThe following grant information was disclosed by the authors:
National Science Foundation Postdoctoral Research Fellowship.
NSF grant: DEB-1136646.
National Science Foundation Dimensions of Biodiversity grant: NSF-1136703.
Competing InterestsAaron Ellison is an Academic Editor for PeerJ. Martin B. Berberich is an employee of
IT-Consulting Berberich.
Del Toro et al. (2017), PeerJ, DOI 10.7717/peerj.3903 6/8

Author Contributions� Israel Del Toro conceived and designed the experiments, performed the experiments,
analyzed the data, contributed reagents/materials/analysis tools, wrote the paper,
prepared figures and/or tables, reviewed drafts of the paper.
� Gabriele Berberich conceived and designed the experiments, performed the
experiments, contributed reagents/materials/analysis tools, wrote the paper, reviewed
drafts of the paper.
� Relena R. Ribbons performed the experiments, contributed reagents/materials/analysis
tools, wrote the paper, reviewed drafts of the paper.
� Martin B. Berberich performed the experiments, contributed reagents/materials/
analysis tools, wrote the paper, reviewed drafts of the paper.
� Nathan J. Sanders conceived and designed the experiments, contributed reagents/
materials/analysis tools, wrote the paper, reviewed drafts of the paper.
� Aaron M. Ellison conceived and designed the experiments, analyzed the data,
contributed reagents/materials/analysis tools, wrote the paper, reviewed drafts of the
paper.
Data AvailabilityThe following information was supplied regarding data availability:
The R markdown file is knitted and presented as Supplemental Dataset Files.
Supplemental InformationSupplemental information for this article can be found online at http://dx.doi.org/
10.7717/peerj.3903#supplemental-information.
REFERENCESBaddeley A, Chang YM, Song Y, Turner R. 2012. Nonparametric estimation of the dependence of
a spatial point process on spatial covariates. Statistics and Its Interface 5(2):221–236
DOI 10.4310/SII.2012.v5.n2.a7.
Baddeley A, Rubak E, Turner R. 2015. Spatial Point Patterns: Methodology and Applications with R.
Boca Raton: CRC Press.
Berberich GM, Dormann CF, Klimetzek D, Berberich MB, Sanders NJ, Ellison AM. 2016a.
Detection probabilities for sessile organisms. Ecosphere 7:e01546 DOI 10.1002/ecs2.1546.
Berberich G, Grumpe A, Berberich M, Klimetzek D, Wohler C. 2016b. Are red wood ants
(Formica rufa-group) tectonic indicators? A statistical approach. Ecological Indicators
61:968–979 DOI 10.1016/j.ecolind.2015.10.055.
Berberich G, Schreiber U. 2013. GeoBioScience: Red wood ants as bioindicators for active
tectonic fault systems in the West Eifel (Germany). Animals 3(2):475–498
DOI 10.3390/ani3020475.
Gregersen S. 2002. Earthquakes and change of stress since the ice age in Scandinavia. Bulletin of
the Geological Society of Denmark 49:73–78.
Helmholtz Centre Potsdam—GFZ German Research Centre for Geosciences. 2008.
The world stress map project—a service for earth system management.
Holldobler B, Wilson EO. 1990. The Ants. Cambridge, MA: Harvard University Press.
Del Toro et al. (2017), PeerJ, DOI 10.7717/peerj.3903 7/8

Holman L, Head ML, Lanfear R, Jennions MD. 2015. Evidence of experimental bias in the life
sciences: why we need blind data recording. PLOS BIOLOGY 13(7):e1002190
DOI 10.1371/journal.pbio.1002190.
Kardish MR, Mueller UG, Amador-Vargas S, Dietrich EI, Ma R, Barrett B, Fang C-C. 2015.
Blind trust in unblinded observation in Ecology, Evolution, and Behavior. Frontiers in Ecology
and Evolution 3:1–4 DOI 10.3389/fevo.2015.00051.
Lach L, Parr C, Abbott K. 2010. Ant Ecology. Oxford: Oxford University Press.
Nickerson RS. 1998. Confirmation bias: a ubiquitous phenomenon in many guises. Review of
General Psychology 2(2):175–220 DOI 10.1037/1089-2680.2.2.175.
Nielsen LH. 2003. The Jurassic of Denmark and Greenland: late Triassic–Jurassic development of
the Danish Basin and the Fennoscandian Border Zone, southern Scandinavia. Geological Survey
of Denmark and Greenland Bulletin 1:459–526.
Petersen HI, Nielsen LH, Bojesen-Koefoed JA, Mathiesen A, Kristensen L, Dalhoff F. 2008.
Evaluation of the quality, thermal maturity and distribution of potential source rocks in the
Danish part of the Norwegian–Danish Basin. Geological Survey of Denmark and Greenland
Bulletin 16:1–27.
R Development Core Team. 2014. R: a language and environment for statistical computing Vienna:
R Foundation for Statistical Computing. Available at https://www.r-project.org.
Ripley BD. 1977. Modelling spatial patterns. Journal of the Royal Statistical Society Series B:
Statistical Methodology 39:172–212 DOI 10.1046/j.1369-7412.2003.05285.x.
Rosenthal R, Rosnow R. 2007. Essentials of Behavioral Research: Methods and Data Analysis.
New York: McGraw-Hill.
Scharf I, Fischer-Blass B, Foitzik S. 2011. Spatial structure and nest demography reveal the
influence of competition, parasitism and habitat quality on slavemaking ants and their hosts.
BMC Ecology 11(1):9 DOI 10.1186/1472-6785-11-9.
Seifert B. 2007. Die Ameisen Mittel- und Nordeuropas. Boxberg: Lutra Verlags- und
Vertriebsgesellschaft.
The Geological Survey of Denmark and Greenland. 2015. GEUS server: geologisk kort over
den Danske Undergrund [Geological map of the Dansk Underground]. Available at
http://www.geus.dk/UK/Pages/default.aspx.
Vejbæk OV. 1997. Dybe strukturer i danske sedimentære bassiner [Deep structures in Danish
sedimentary basins]. Geologisk Tidsskrift 4:1–31.
Del Toro et al. (2017), PeerJ, DOI 10.7717/peerj.3903 8/8