new drivers of future growth
TRANSCRIPT

New drivers of future growthEY Attractiveness Survey
Belgium
May 2020
zz
Editorial
Methodology: how EY researched this report
Recommendations
1 What is the current attractiveness state of Belgium?
Foreign investment projects and job creation in Belgium (2019)
Viewpoint Bart Van Craeynest (Voka)
How was European FDI performing when COVID-19 hit?
Viewpoint Olivier de Wasseige (UWE)
How might COVID-19 impact new FDI in Europe in 2020 and beyond?
Viewpoint Olivier Willocx (BECI)
Perception of the attractiveness of Belgium (2020)
Viewpoint professor Leo Sleuwaegen
What Belgium needs to do to re-define/re-frame its future attractiveness
Top priorities
Driver of future growth
06
07
13
14
17
18
19
22
28
03
38
04
39
30
31
32
34
Content
Executive summary
About the Attractiveness Program
2
zz
EY’s Attractiveness Survey Belgium May 2020 3
ey.com/be/attractiveness
Edito
rial
Foreign direct investment (FDI) rarely makes the headlines. Browse the business pages of leading publications and you’ll see a range of news about M&A, infrastructure investment and IPOs. FDI is often an afterthought.
It shouldn’t be. Totaling €7.2 trillion during 2018, it accounts for 45% of EU GDP. And between 2003 and 2017, it created 11 million jobs in the EU.
If that weren’t enough, FDI turbocharges research. Foreign-owned firms account for more than 50% of business R&D in Belgium.
It is therefore vital to understand what drives businesses to invest in particular countries and regions, how their location priorities are changing, and what governments can do to influence these decisions.
In this spirit, EY has conducted extensive research on the level of FDI in Belgium, and what drives it.
This year, our usual research program was interrupted by COVID-19. Like almost every aspect of life, the pandemic has disrupted, though by no means decimated, FDI.
To understand the virus’s impact, not just in 2020 but beyond, we changed our approach. In this report, you will not just see insights from EY but also external viewpoints focusing on what Belgium needs to do to re-define and re-frame its future attractiveness.
The exact impact of COVID-19 in investment levels will, of course, depend on the extent to which the global economy recovers and how FDI is incentivized at a local level.
We believe FDI can also spark Belgium’s economic recovery and transformation. For this to happen, Belgium must grasp what it means to be an attractive FDI destination post-COVID-19. EY believes that COVID-19 will accelerate three pre-existing trends: technology adoption, sustainable practices and supply chain reorganization.
To remain attractive in this reframed business environment, Belgium – businesses and governments together - must think creatively, act decisively, and put cohesion and collaboration at the heart of everything it does.
Foreign investment is key to the recovery
Tristan Dhondt EY Belgium partner
Patrick Rottiers CEO EY Belgium
Marie-Laure Moreau EY Belgium partner
EY’s Attractiveness Survey Belgium May 20204
Executive summary
5.401267investment projects jobs created
33
51
28
Business services
Sales and marketing
Digital
Logistics
Agri-food services
Transportation and logistics
Manufacturing
53
105
42
60
50%
31%
7%
Flanders
Brussels
1
2
Wallonia3
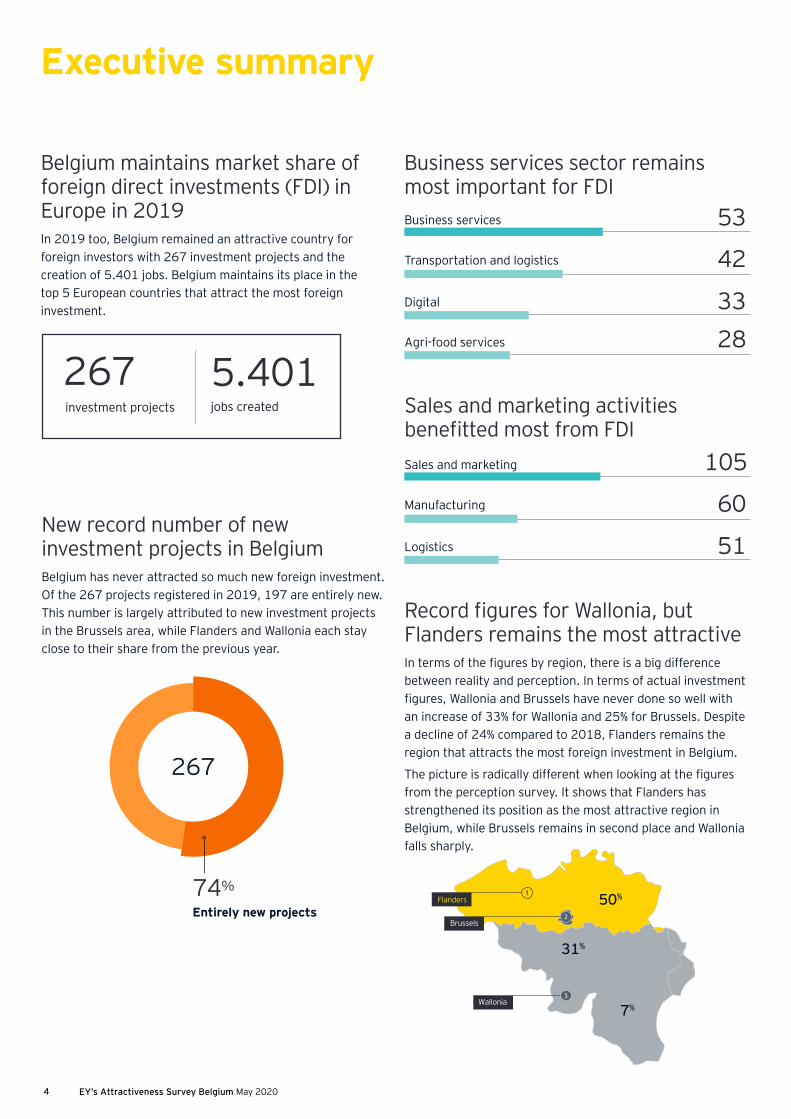
Belgium maintains market share of foreign direct investments (FDI) in Europe in 2019In 2019 too, Belgium remained an attractive country for foreign investors with 267 investment projects and the creation of 5.401 jobs. Belgium maintains its place in the top 5 European countries that attract the most foreign investment.
New record number of new investment projects in BelgiumBelgium has never attracted so much new foreign investment. Of the 267 projects registered in 2019, 197 are entirely new. This number is largely attributed to new investment projects in the Brussels area, while Flanders and Wallonia each stay close to their share from the previous year.
Lorem ipsum267
74%
Entirely new projects
Business services sector remains most important for FDI
Record figures for Wallonia, but Flanders remains the most attractiveIn terms of the figures by region, there is a big difference between reality and perception. In terms of actual investment figures, Wallonia and Brussels have never done so well with an increase of 33% for Wallonia and 25% for Brussels. Despite a decline of 24% compared to 2018, Flanders remains the region that attracts the most foreign investment in Belgium.
The picture is radically different when looking at the figures from the perception survey. It shows that Flanders has strengthened its position as the most attractive region in Belgium, while Brussels remains in second place and Wallonia falls sharply.
Sales and marketing activities benefitted most from FDI
EY’s Attractiveness Survey Belgium May 2020 5
ey.com/be/attractiveness
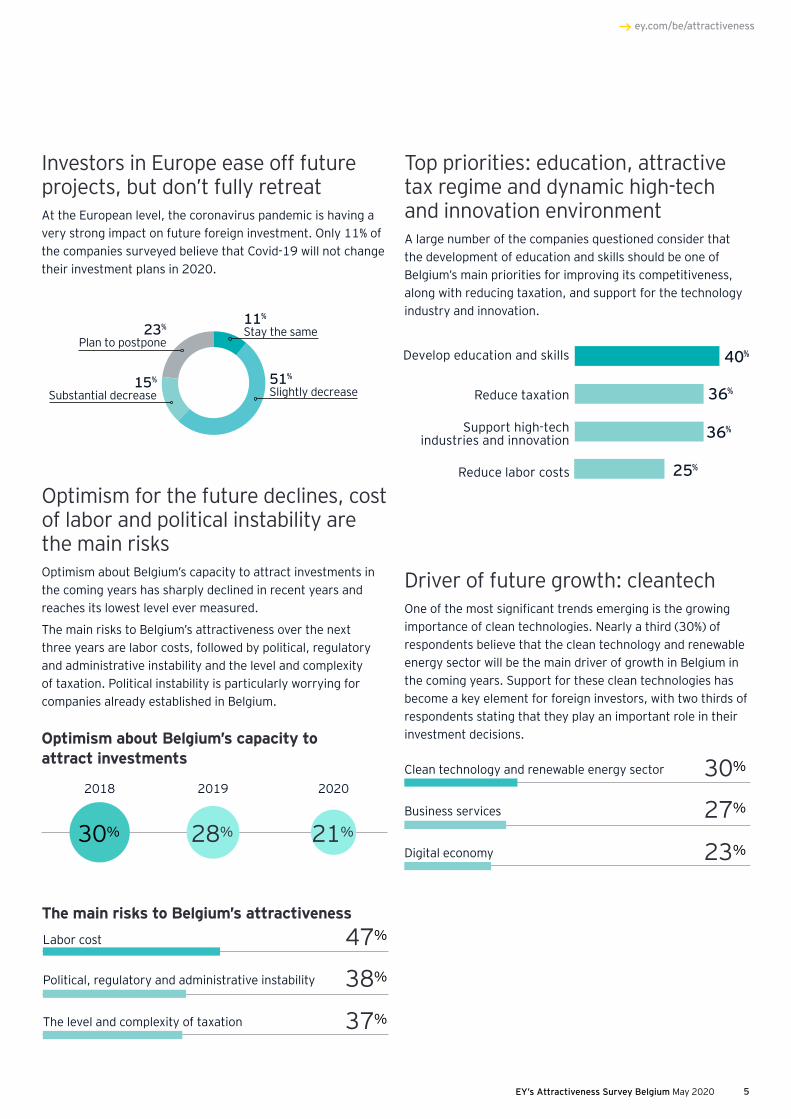
Top priorities: education, attractive tax regime and dynamic high-tech and innovation environmentA large number of the companies questioned consider that the development of education and skills should be one of Belgium’s main priorities for improving its competitiveness, along with reducing taxation, and support for the technology industry and innovation.
37%
Labor cost
The level and complexity of taxation
Political, regulatory and administrative instability
47%
38%
Investors in Europe ease off future projects, but don’t fully retreatAt the European level, the coronavirus pandemic is having a very strong impact on future foreign investment. Only 11% of the companies surveyed believe that Covid-19 will not change their investment plans in 2020.
11%
Stay the same
51%
Slightly decrease
23%
Plan to postpone
15%
Substantial decrease
2018 2019 2020
30% 28% 21%
Optimism for the future declines, cost of labor and political instability are the main risksOptimism about Belgium’s capacity to attract investments in the coming years has sharply declined in recent years and reaches its lowest level ever measured.
The main risks to Belgium’s attractiveness over the next three years are labor costs, followed by political, regulatory and administrative instability and the level and complexity of taxation. Political instability is particularly worrying for companies already established in Belgium.
Driver of future growth: cleantechOne of the most significant trends emerging is the growing importance of clean technologies. Nearly a third (30%) of respondents believe that the clean technology and renewable energy sector will be the main driver of growth in Belgium in the coming years. Support for these clean technologies has become a key element for foreign investors, with two thirds of respondents stating that they play an important role in their investment decisions.Optimism about Belgium’s capacity to
attract investments
The main risks to Belgium’s attractiveness
40%
36%
36%
25%
Develop education and skills
Reduce taxation
Reduce labor costs
Support high-tech industries and innovation
23%
Clean technology and renewable energy sector
Digital economy
Business services
30%
27%
EY’s Attractiveness Survey Belgium May 20206 EY’s Attractiveness Survey Belgium May 2020
1What is the current attractiveness state of Belgium?
4% decline from 2018jobs created
267FDI projects in 2019 5.401
6
Belgium secured
EY’s Attractiveness Survey Belgium May 2020 7
ey.com/be/attractiveness
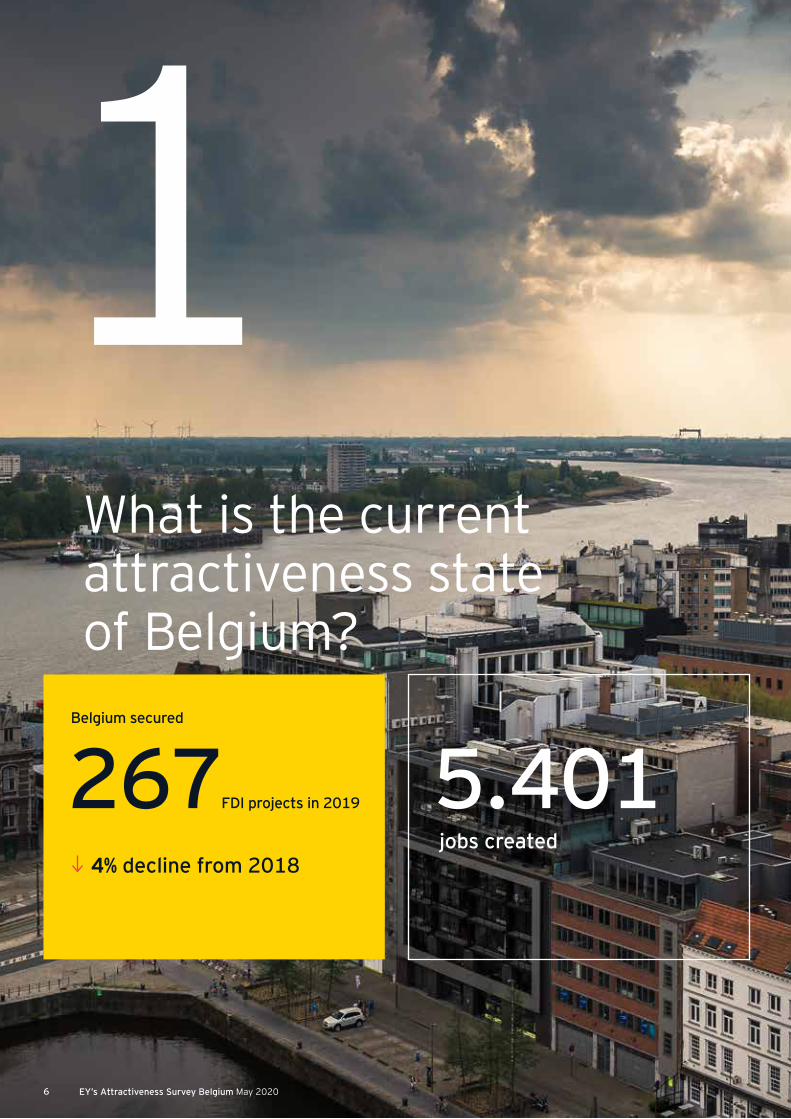
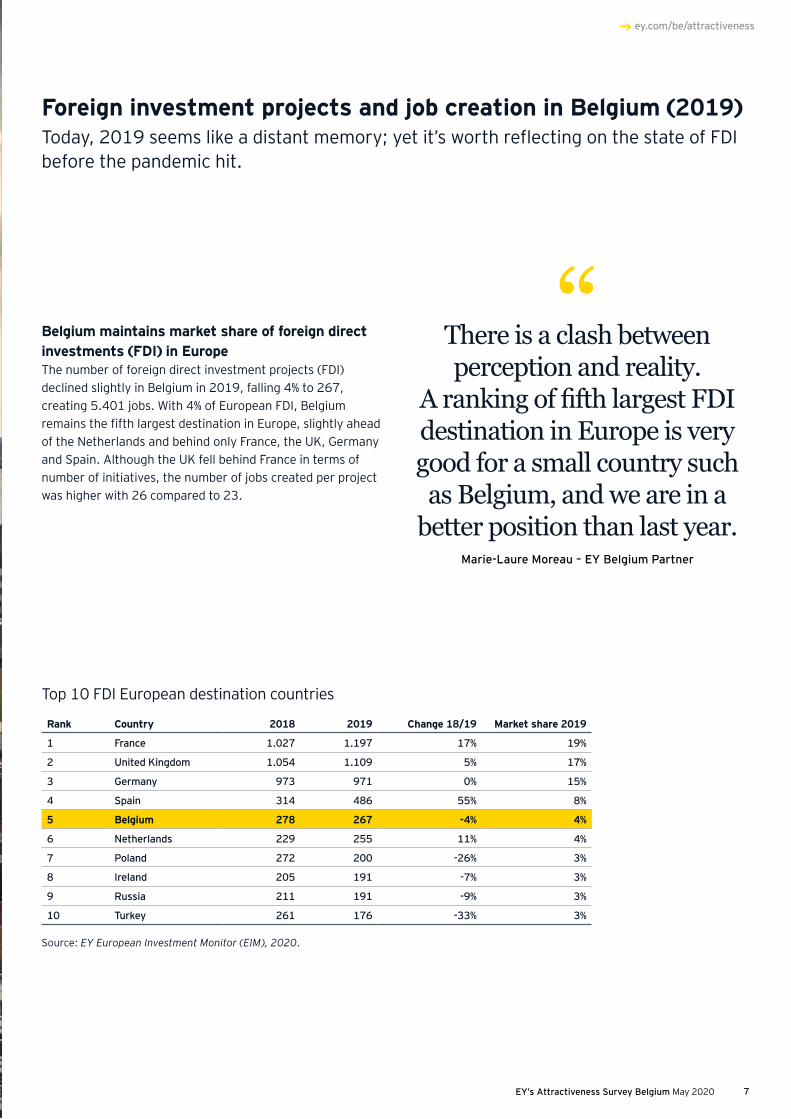
Belgium maintains market share of foreign direct investments (FDI) in EuropeThe number of foreign direct investment projects (FDI) declined slightly in Belgium in 2019, falling 4% to 267, creating 5.401 jobs. With 4% of European FDI, Belgium remains the fifth largest destination in Europe, slightly ahead of the Netherlands and behind only France, the UK, Germany and Spain. Although the UK fell behind France in terms of number of initiatives, the number of jobs created per project was higher with 26 compared to 23.
“There is a clash between perception and reality.
A ranking of fifth largest FDI destination in Europe is very good for a small country such as Belgium, and we are in a
better position than last year.Marie-Laure Moreau – EY Belgium Partner
Foreign investment projects and job creation in Belgium (2019)Today, 2019 seems like a distant memory; yet it’s worth reflecting on the state of FDI before the pandemic hit.
Source: EY European Investment Monitor (EIM), 2020.
Top 10 FDI European destination countries
Rank Country 2018 2019 Change 18/19 Market share 2019
1 France 1.027 1.197 17% 19%
2 United Kingdom 1.054 1.109 5% 17%
3 Germany 973 971 0% 15%
4 Spain 314 486 55% 8%
5 Belgium 278 267 -4% 4%
6 Netherlands 229 255 11% 4%
7 Poland 272 200 -26% 3%
8 Ireland 205 191 -7% 3%
9 Russia 211 191 -9% 3%
10 Turkey 261 176 -33% 3%
EY’s Attractiveness Survey Belgium May 20208
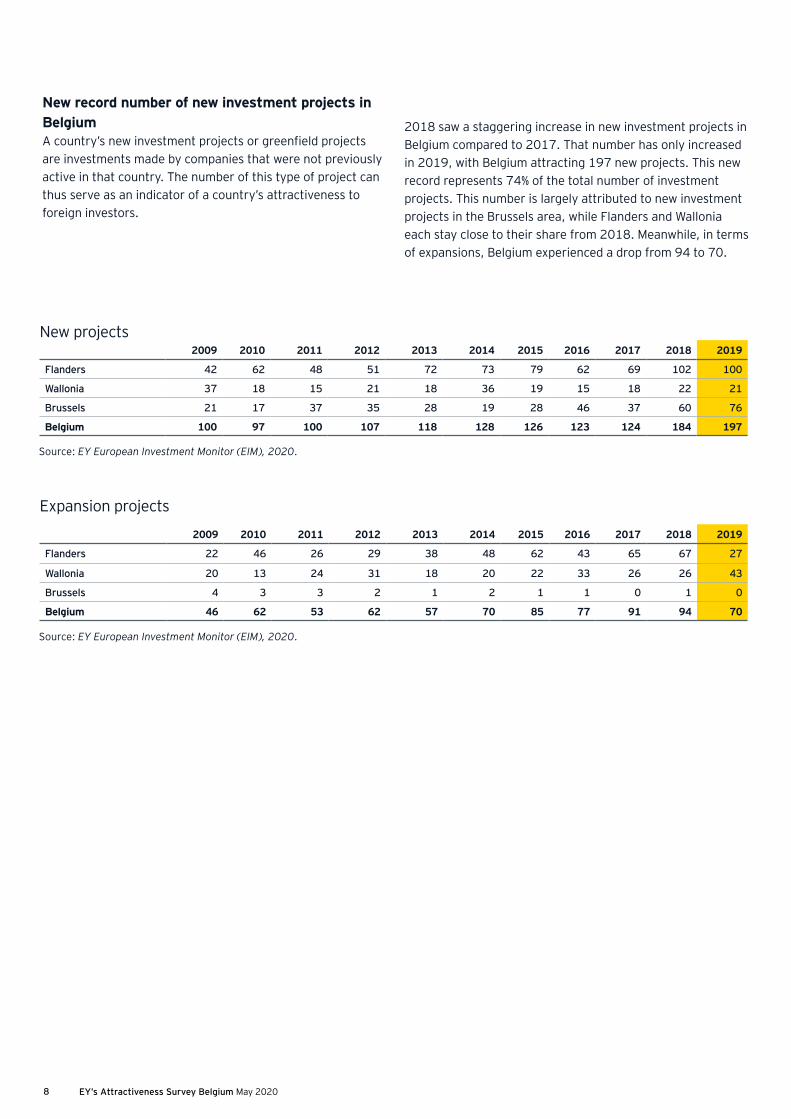
New record number of new investment projects in BelgiumA country’s new investment projects or greenfield projects are investments made by companies that were not previously active in that country. The number of this type of project can thus serve as an indicator of a country’s attractiveness to foreign investors.
Expansion projects
New projects
2009 2010 2011 2012 2013 2014 2015 2016 2017 2018 2019
Flanders 22 46 26 29 38 48 62 43 65 67 27
Wallonia 20 13 24 31 18 20 22 33 26 26 43
Brussels 4 3 3 2 1 2 1 1 0 1 0
Belgium 46 62 53 62 57 70 85 77 91 94 70
2009 2010 2011 2012 2013 2014 2015 2016 2017 2018 2019
Flanders 42 62 48 51 72 73 79 62 69 102 100
Wallonia 37 18 15 21 18 36 19 15 18 22 21
Brussels 21 17 37 35 28 19 28 46 37 60 76
Belgium 100 97 100 107 118 128 126 123 124 184 197
Source: EY European Investment Monitor (EIM), 2020.
Source: EY European Investment Monitor (EIM), 2020.
2018 saw a staggering increase in new investment projects in Belgium compared to 2017. That number has only increased in 2019, with Belgium attracting 197 new projects. This new record represents 74% of the total number of investment projects. This number is largely attributed to new investment projects in the Brussels area, while Flanders and Wallonia each stay close to their share from 2018. Meanwhile, in terms of expansions, Belgium experienced a drop from 94 to 70.
EY’s Attractiveness Survey Belgium May 2020 9
ey.com/be/attractiveness
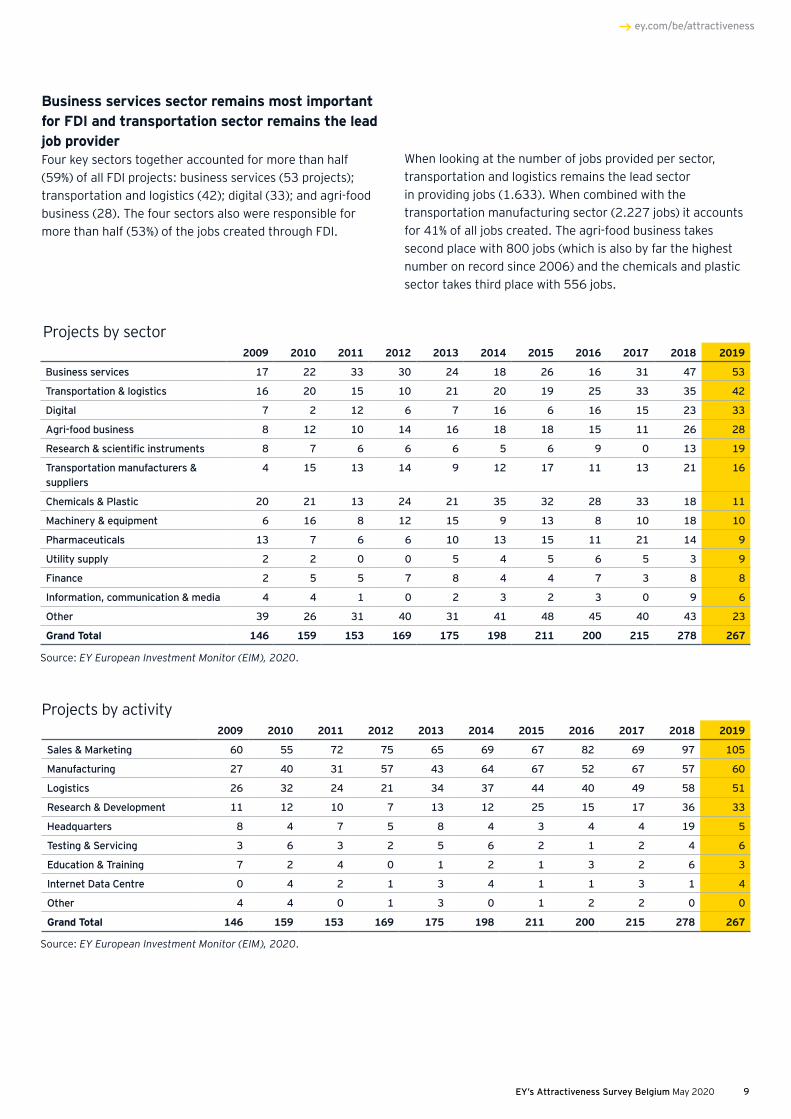
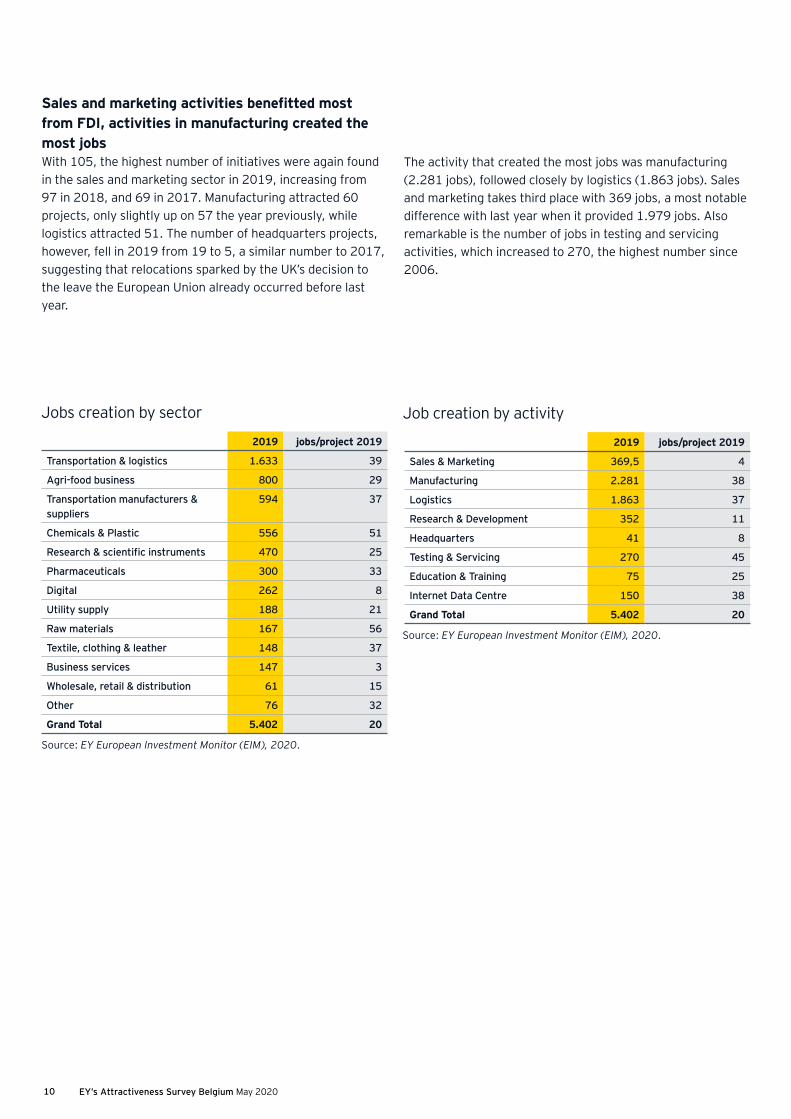
Business services sector remains most important for FDI and transportation sector remains the lead job providerFour key sectors together accounted for more than half (59%) of all FDI projects: business services (53 projects); transportation and logistics (42); digital (33); and agri-food business (28). The four sectors also were responsible for more than half (53%) of the jobs created through FDI.
Source: EY European Investment Monitor (EIM), 2020.
When looking at the number of jobs provided per sector, transportation and logistics remains the lead sector in providing jobs (1.633). When combined with the transportation manufacturing sector (2.227 jobs) it accounts for 41% of all jobs created. The agri-food business takes second place with 800 jobs (which is also by far the highest number on record since 2006) and the chemicals and plastic sector takes third place with 556 jobs.
Projects by sector2009 2010 2011 2012 2013 2014 2015 2016 2017 2018 2019
Business services 17 22 33 30 24 18 26 16 31 47 53
Transportation & logistics 16 20 15 10 21 20 19 25 33 35 42
Digital 7 2 12 6 7 16 6 16 15 23 33
Agri-food business 8 12 10 14 16 18 18 15 11 26 28
Research & scientific instruments 8 7 6 6 6 5 6 9 0 13 19
Transportation manufacturers & suppliers
4 15 13 14 9 12 17 11 13 21 16
Chemicals & Plastic 20 21 13 24 21 35 32 28 33 18 11
Machinery & equipment 6 16 8 12 15 9 13 8 10 18 10
Pharmaceuticals 13 7 6 6 10 13 15 11 21 14 9
Utility supply 2 2 0 0 5 4 5 6 5 3 9
Finance 2 5 5 7 8 4 4 7 3 8 8
Information, communication & media 4 4 1 0 2 3 2 3 0 9 6
Other 39 26 31 40 31 41 48 45 40 43 23
Grand Total 146 159 153 169 175 198 211 200 215 278 267
Projects by activity2009 2010 2011 2012 2013 2014 2015 2016 2017 2018 2019
Sales & Marketing 60 55 72 75 65 69 67 82 69 97 105
Manufacturing 27 40 31 57 43 64 67 52 67 57 60
Logistics 26 32 24 21 34 37 44 40 49 58 51
Research & Development 11 12 10 7 13 12 25 15 17 36 33
Headquarters 8 4 7 5 8 4 3 4 4 19 5
Testing & Servicing 3 6 3 2 5 6 2 1 2 4 6
Education & Training 7 2 4 0 1 2 1 3 2 6 3
Internet Data Centre 0 4 2 1 3 4 1 1 3 1 4
Other 4 4 0 1 3 0 1 2 2 0 0
Grand Total 146 159 153 169 175 198 211 200 215 278 267
Source: EY European Investment Monitor (EIM), 2020.
EY’s Attractiveness Survey Belgium May 202010
Sales and marketing activities benefitted most from FDI, activities in manufacturing created the most jobsWith 105, the highest number of initiatives were again found in the sales and marketing sector in 2019, increasing from 97 in 2018, and 69 in 2017. Manufacturing attracted 60 projects, only slightly up on 57 the year previously, while logistics attracted 51. The number of headquarters projects, however, fell in 2019 from 19 to 5, a similar number to 2017, suggesting that relocations sparked by the UK’s decision to the leave the European Union already occurred before last year.
Job creation by activity
Source: EY European Investment Monitor (EIM), 2020.
2019 jobs/project 2019
Sales & Marketing 369,5 4
Manufacturing 2.281 38
Logistics 1.863 37
Research & Development 352 11
Headquarters 41 8
Testing & Servicing 270 45
Education & Training 75 25
Internet Data Centre 150 38
Grand Total 5.402 20
The activity that created the most jobs was manufacturing (2.281 jobs), followed closely by logistics (1.863 jobs). Sales and marketing takes third place with 369 jobs, a most notable difference with last year when it provided 1.979 jobs. Also remarkable is the number of jobs in testing and servicing activities, which increased to 270, the highest number since 2006.
Source: EY European Investment Monitor (EIM), 2020.
2019 jobs/project 2019
Transportation & logistics 1.633 39
Agri-food business 800 29
Transportation manufacturers & suppliers
594 37
Chemicals & Plastic 556 51
Research & scientific instruments 470 25
Pharmaceuticals 300 33
Digital 262 8
Utility supply 188 21
Raw materials 167 56
Textile, clothing & leather 148 37
Business services 147 3
Wholesale, retail & distribution 61 15
Other 76 32
Grand Total 5.402 20
Jobs creation by sector
EY’s Attractiveness Survey Belgium May 2020 11
ey.com/be/attractiveness
Nearly two-thirds of FDI projects from five countries led by the US
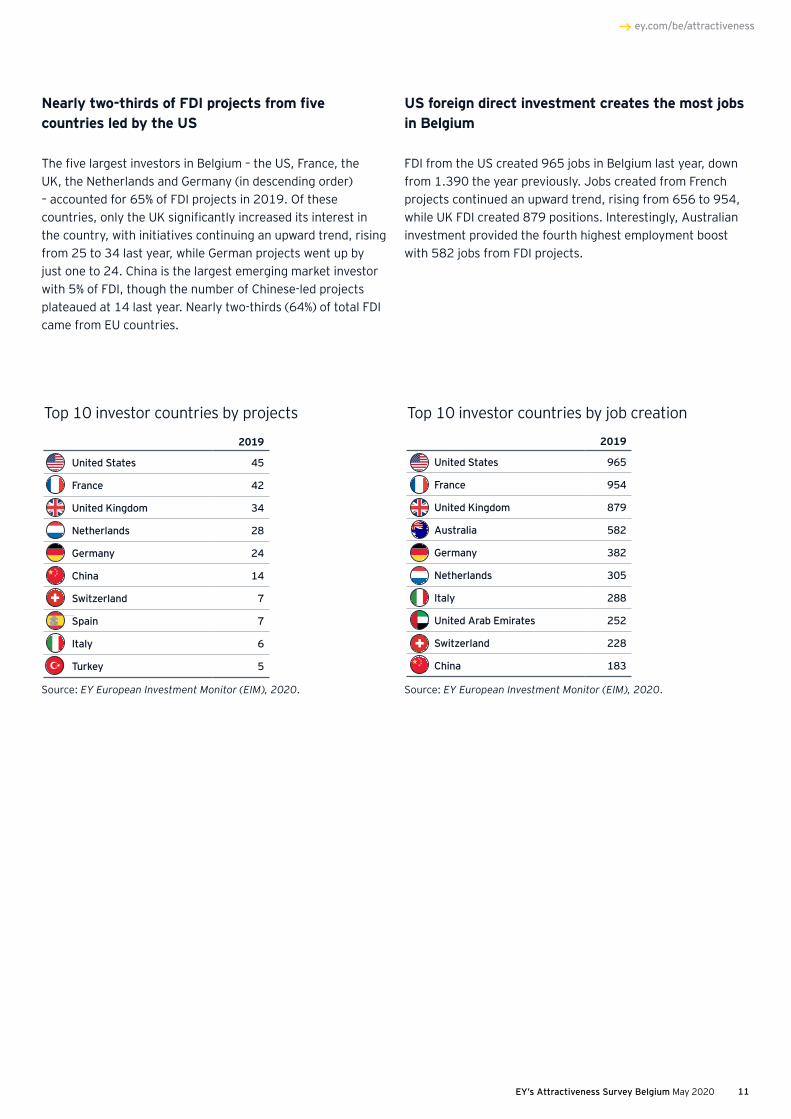
The five largest investors in Belgium – the US, France, the UK, the Netherlands and Germany (in descending order) – accounted for 65% of FDI projects in 2019. Of these countries, only the UK significantly increased its interest in the country, with initiatives continuing an upward trend, rising from 25 to 34 last year, while German projects went up by just one to 24. China is the largest emerging market investor with 5% of FDI, though the number of Chinese-led projects plateaued at 14 last year. Nearly two-thirds (64%) of total FDI came from EU countries.
Source: EY European Investment Monitor (EIM), 2020. Source: EY European Investment Monitor (EIM), 2020.
US foreign direct investment creates the most jobs in Belgium
FDI from the US created 965 jobs in Belgium last year, down from 1.390 the year previously. Jobs created from French projects continued an upward trend, rising from 656 to 954, while UK FDI created 879 positions. Interestingly, Australian investment provided the fourth highest employment boost with 582 jobs from FDI projects.
Top 10 investor countries by job creation
2019
United States 965
France 954
United Kingdom 879
Australia 582
Germany 382
Netherlands 305
Italy 288
United Arab Emirates 252
Switzerland 228
China 183
2019
United States 45
France 42
United Kingdom 34
Netherlands 28
Germany 24
China 14
Switzerland 7
Spain 7
Italy 6
Turkey 5
Top 10 investor countries by projects
EY’s Attractiveness Survey Belgium May 202012
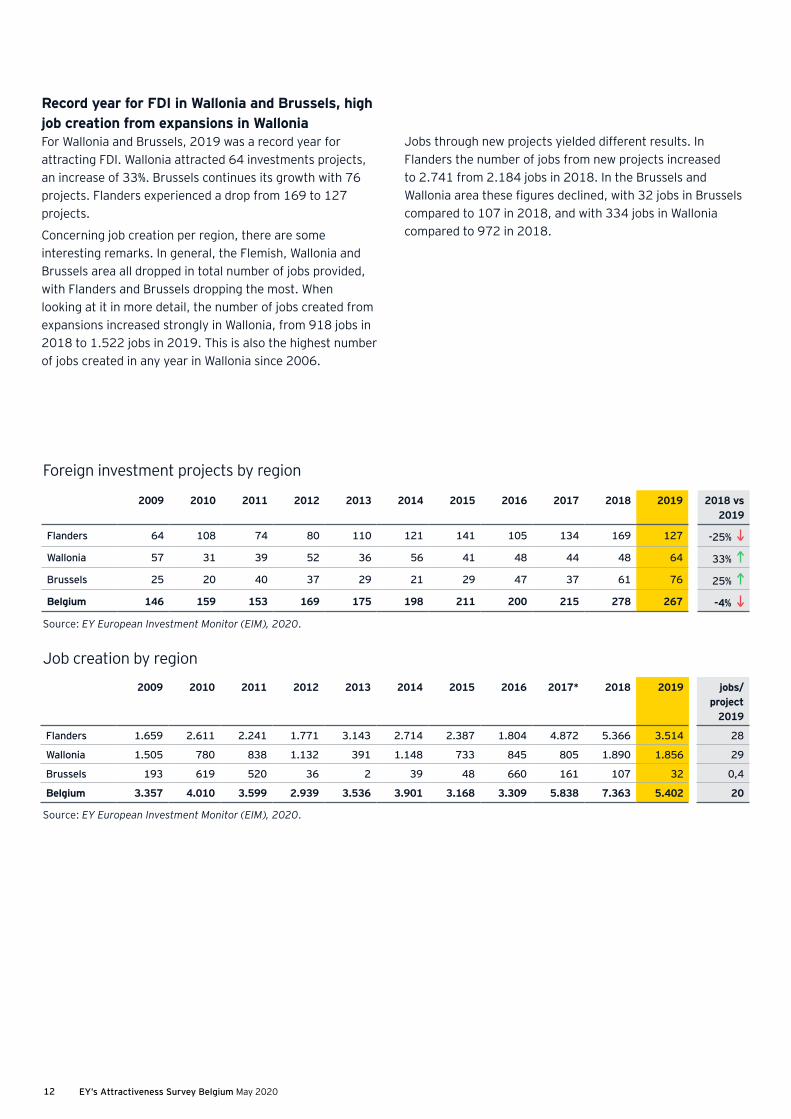
Record year for FDI in Wallonia and Brussels, high job creation from expansions in WalloniaFor Wallonia and Brussels, 2019 was a record year for attracting FDI. Wallonia attracted 64 investments projects, an increase of 33%. Brussels continues its growth with 76 projects. Flanders experienced a drop from 169 to 127 projects.
Concerning job creation per region, there are some interesting remarks. In general, the Flemish, Wallonia and Brussels area all dropped in total number of jobs provided, with Flanders and Brussels dropping the most. When looking at it in more detail, the number of jobs created from expansions increased strongly in Wallonia, from 918 jobs in 2018 to 1.522 jobs in 2019. This is also the highest number of jobs created in any year in Wallonia since 2006.
Foreign investment projects by region
2009 2010 2011 2012 2013 2014 2015 2016 2017 2018 2019 2018 vs 2019
Flanders 64 108 74 80 110 121 141 105 134 169 127 -25%
Wallonia 57 31 39 52 36 56 41 48 44 48 64 33%
Brussels 25 20 40 37 29 21 29 47 37 61 76 25%
Belgium 146 159 153 169 175 198 211 200 215 278 267 -4%
2009 2010 2011 2012 2013 2014 2015 2016 2017* 2018 2019 jobs/project
2019
Flanders 1.659 2.611 2.241 1.771 3.143 2.714 2.387 1.804 4.872 5.366 3.514 28
Wallonia 1.505 780 838 1.132 391 1.148 733 845 805 1.890 1.856 29
Brussels 193 619 520 36 2 39 48 660 161 107 32 0,4
Belgium 3.357 4.010 3.599 2.939 3.536 3.901 3.168 3.309 5.838 7.363 5.402 20
Job creation by region
Source: EY European Investment Monitor (EIM), 2020.
Source: EY European Investment Monitor (EIM), 2020.
Jobs through new projects yielded different results. In Flanders the number of jobs from new projects increased to 2.741 from 2.184 jobs in 2018. In the Brussels and Wallonia area these figures declined, with 32 jobs in Brussels compared to 107 in 2018, and with 334 jobs in Wallonia compared to 972 in 2018.
EY’s Attractiveness Survey Belgium May 2020 13
ey.com/be/attractiveness
Safeguarding Belgium’s strengths
Viewpoint
Bart Van CraeynestFlanders’ Chambers of Commerce and Industry (Voka)
Quality of labor and our central position in the European market have been key elements of the attractiveness of Belgium for foreign investors for a long time. This is unlikely to change with the current crisis. As such we need to safeguard these strengths:
• Improve the functioning of the labor market: before the current crisis, problems of labor market tightness were clearly surfacing. The crisis will only deliver a temporary relaxation of this situation. If Belgium doesn’t take measures to improve the functioning of its labor market, the problem of tightness will return rapidly. In order to avoid that, the authorities should work to increase labor market flexibility and to get more people involved in the labor market. On top of that, quality of education and training efforts should be an important focus of policy.
• Improve transportation infrastructure: before the current crisis, congestion was a serious issue with significant economic costs. As such the attractiveness of our central position in Europe was impaired. The authorities should use the crisis to substantially increase public investment in infrastructure in order to reduce congestion issues.
Viewpoint
• The current crisis is boosting the digitization of the economy in all kinds of ways. The authorities should make a significant effort to accelerate this process even beyond the crisis by investing in digital infrastructure, promote specific training and adapt regulation to facilitate digital business models.
• There is a possibility that the current crisis will be used by some to strengthen the ongoing dynamic against globalization. For the Belgian economy, but also for the entire European economy, international trade remains a key factor for prosperity. In that respect, Belgium should continue to be an explicit advocate for free trade and a strengthening of the single European market. The crisis creates opportunities to strengthen trade, at least at a European level (although it also poses threats).
• The current crisis implies a significant hit to public finances. Given the already elevated levels of taxation on both labor and companies, it will be important to ignore calls for increased taxation to compensate for the deterioration of public finances. The focus should be on a far more effective use of current means. On the side of public expenditure there should be a lot of room to increase effectiveness in order to improve the situation of public finances.
It will be important to ignore calls for increased taxation to compensate for the deterioration of public finances.
“
EY’s Attractiveness Survey Belgium May 202014
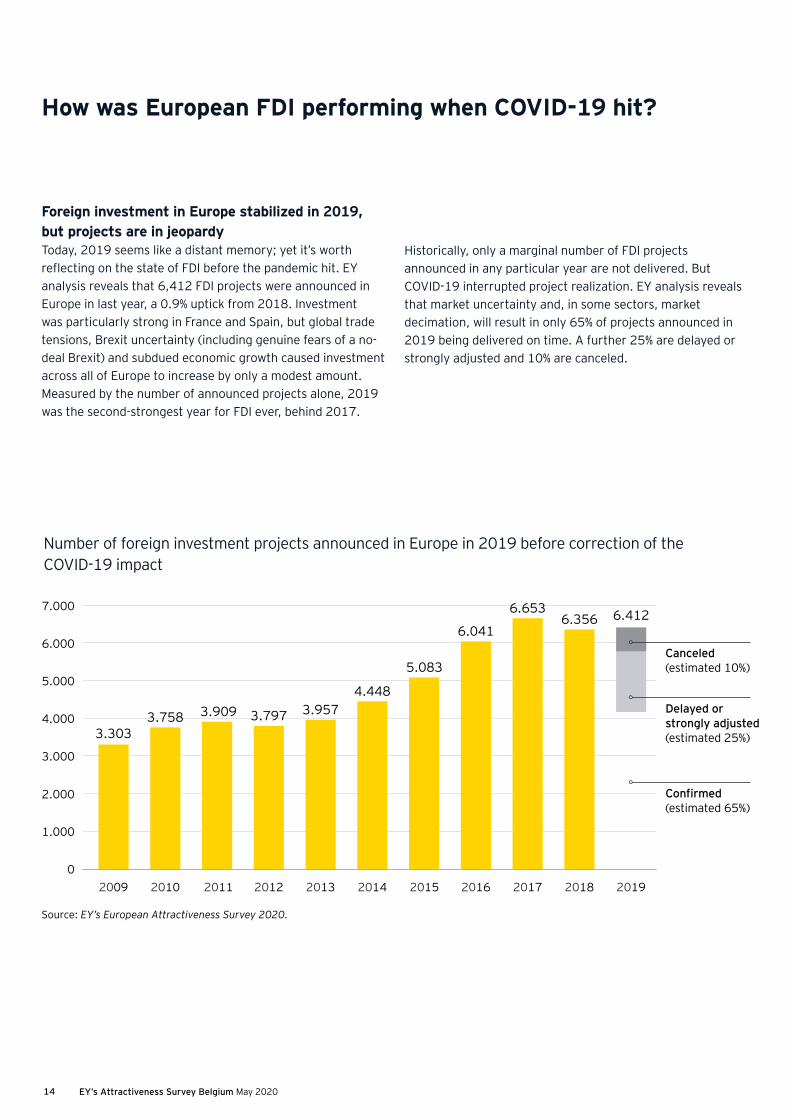
Foreign investment in Europe stabilized in 2019,but projects are in jeopardy Today, 2019 seems like a distant memory; yet it’s worth reflecting on the state of FDI before the pandemic hit. EY analysis reveals that 6,412 FDI projects were announced in Europe in last year, a 0.9% uptick from 2018. Investment was particularly strong in France and Spain, but global trade tensions, Brexit uncertainty (including genuine fears of a no-deal Brexit) and subdued economic growth caused investment across all of Europe to increase by only a modest amount. Measured by the number of announced projects alone, 2019 was the second-strongest year for FDI ever, behind 2017.
Number of foreign investment projects announced in Europe in 2019 before correction of the COVID-19 impact
Source: EY’s European Attractiveness Survey 2020.
How was European FDI performing when COVID-19 hit?
2009 2010 2011 2012 2013 2014 2015 2016 2017 2018 2019
7.000
6.000
5.000
4.000
3.000
2.000
1.000
0
3.3033.758 3.909 3.797 3.957
4.448
5.083
6.041
6.6536.356 6.412
Canceled (estimated 10%)
Delayed or strongly adjusted (estimated 25%)
Confirmed (estimated 65%)
Historically, only a marginal number of FDI projects announced in any particular year are not delivered. But COVID-19 interrupted project realization. EY analysis reveals that market uncertainty and, in some sectors, market decimation, will result in only 65% of projects announced in 2019 being delivered on time. A further 25% are delayed or strongly adjusted and 10% are canceled.
EY’s Attractiveness Survey Belgium May 2020 15
ey.com/be/attractiveness
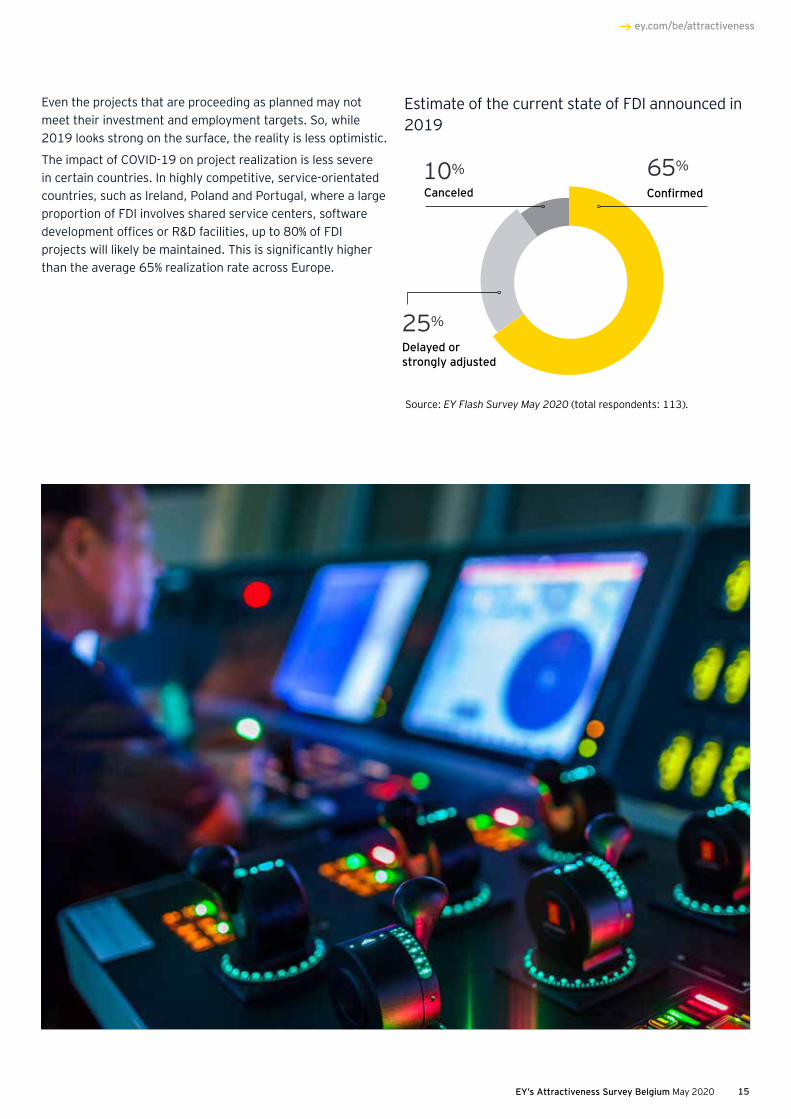
Even the projects that are proceeding as planned may not meet their investment and employment targets. So, while 2019 looks strong on the surface, the reality is less optimistic.
The impact of COVID-19 on project realization is less severe in certain countries. In highly competitive, service-orientated countries, such as Ireland, Poland and Portugal, where a large proportion of FDI involves shared service centers, software development offices or R&D facilities, up to 80% of FDI projects will likely be maintained. This is significantly higher than the average 65% realization rate across Europe.
Source: EY Flash Survey May 2020 (total respondents: 113).
Estimate of the current state of FDI announced in 2019
ConfirmedCanceled
Delayed or strongly adjusted
65%10%
25%
EY’s Attractiveness Survey Belgium May 202016
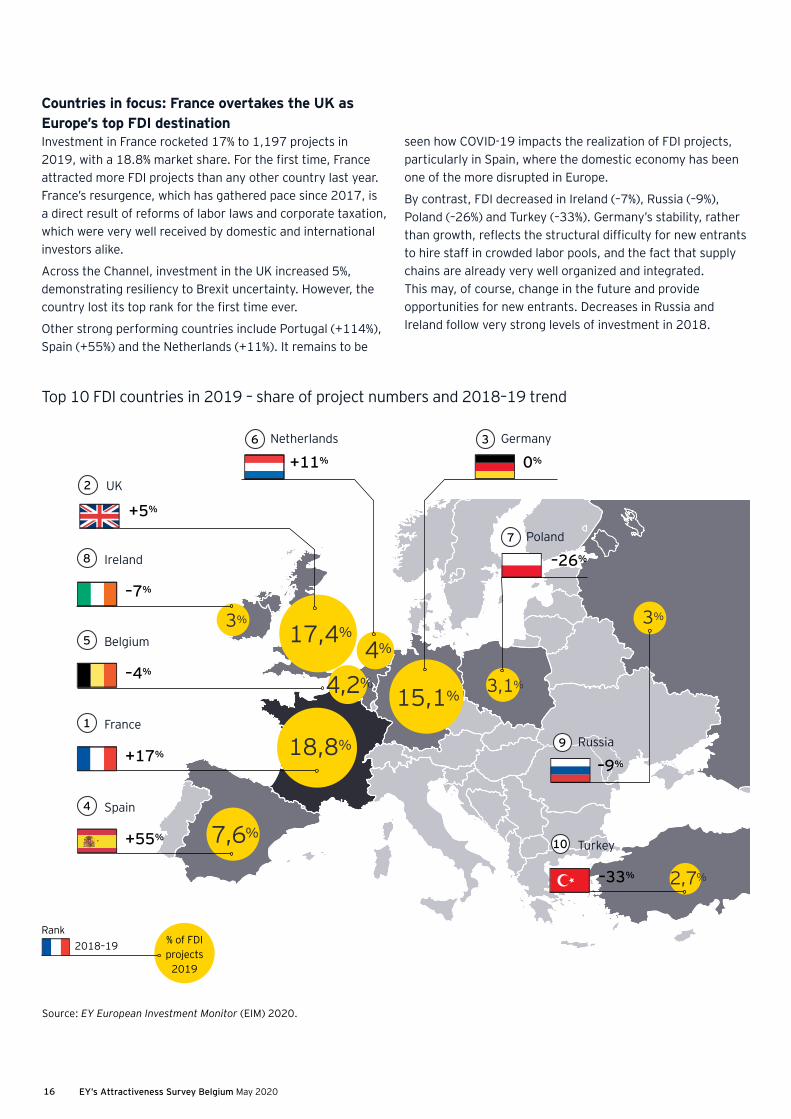
Countries in focus: France overtakes the UK as Europe’s top FDI destinationInvestment in France rocketed 17% to 1,197 projects in 2019, with a 18.8% market share. For the first time, France attracted more FDI projects than any other country last year. France’s resurgence, which has gathered pace since 2017, is a direct result of reforms of labor laws and corporate taxation, which were very well received by domestic and international investors alike.
Across the Channel, investment in the UK increased 5%, demonstrating resiliency to Brexit uncertainty. However, the country lost its top rank for the first time ever.
Other strong performing countries include Portugal (+114%), Spain (+55%) and the Netherlands (+11%). It remains to be
Top 10 FDI countries in 2019 – share of project numbers and 2018–19 trend
1
4
5
8
2
3
7
6
France
Spain
Belgium
Ireland
UK
Germany
Poland
Russia
Netherlands
Turkey10
9
Source: EY European Investment Monitor (EIM) 2020.
% of FDI projects
2019
Rank2018–19
+17%
+55%
–4%
–7%
+5%
0%
–26%
–9%
+11%
18,8%
17,4%
15,1%
3% 3%
3,1%
2,7%
4,2%
7,6%
4%
–33%
seen how COVID-19 impacts the realization of FDI projects, particularly in Spain, where the domestic economy has been one of the more disrupted in Europe.
By contrast, FDI decreased in Ireland (–7%), Russia (–9%), Poland (–26%) and Turkey (–33%). Germany’s stability, rather than growth, reflects the structural difficulty for new entrants to hire staff in crowded labor pools, and the fact that supply chains are already very well organized and integrated. This may, of course, change in the future and provide opportunities for new entrants. Decreases in Russia and Ireland follow very strong levels of investment in 2018.
EY’s Attractiveness Survey Belgium May 2020 17
ey.com/be/attractiveness
A macro-economic rebalancing
Viewpoint
Olivier de WasseigeCEO, Walloon Union of Enterprises (UWE)
The EY Belgian Attractiveness Survey tells a clear story: 2019 was an excellent year for Wallonia in terms of foreign direct investment, with 64 projects, up 33% compared with 2018. This confirms the attractiveness of our Walloon region. In recent years, global giants such as Microsoft, Google and Alibaba have decided to locate there.
Unfortunately, the coronavirus crisis will turn 2020 into a black year. Various surveys give an unambiguous message: a large portion of the planned investments will be postponed , if not cancelled.
However, the coronavirus crisis will bring about a macroeconomic rebalancing. It is clear today that a series of economic activities will have to be reinvented in order to make our economic fabric more resilient. In fact, there is more and more talk of re-industrialisation, relocation of activity or even diversification of supply chains and sources, messages already conveyed for several years by the Walloon Union of Businesses (UWE).
Viewpoint
In this context, Wallonia therefore has a strong card to play. Thanks to its geography, the availability of land, the quality of higher education and its well-performing R&D ecosystem, Wallonia already has many assets with which to play a key role here.
All this makes it vital that politicians seize the opportunities by providing the necessary conditions, in particular with incentives and structural investments to improve the attractiveness of the Walloon region and reinsert Walloon industry into both European and global value chains. The attractiveness of the Walloon Region for investors also depends on local taxation and legislation. All levels of power will have to bring will and determination to the task.
It is clear today that a series of economic activities will have to be reinvented in order to make our economic fabric more resilient.
“
Photo: © UWE
EY’s Attractiveness Survey Belgium May 202018
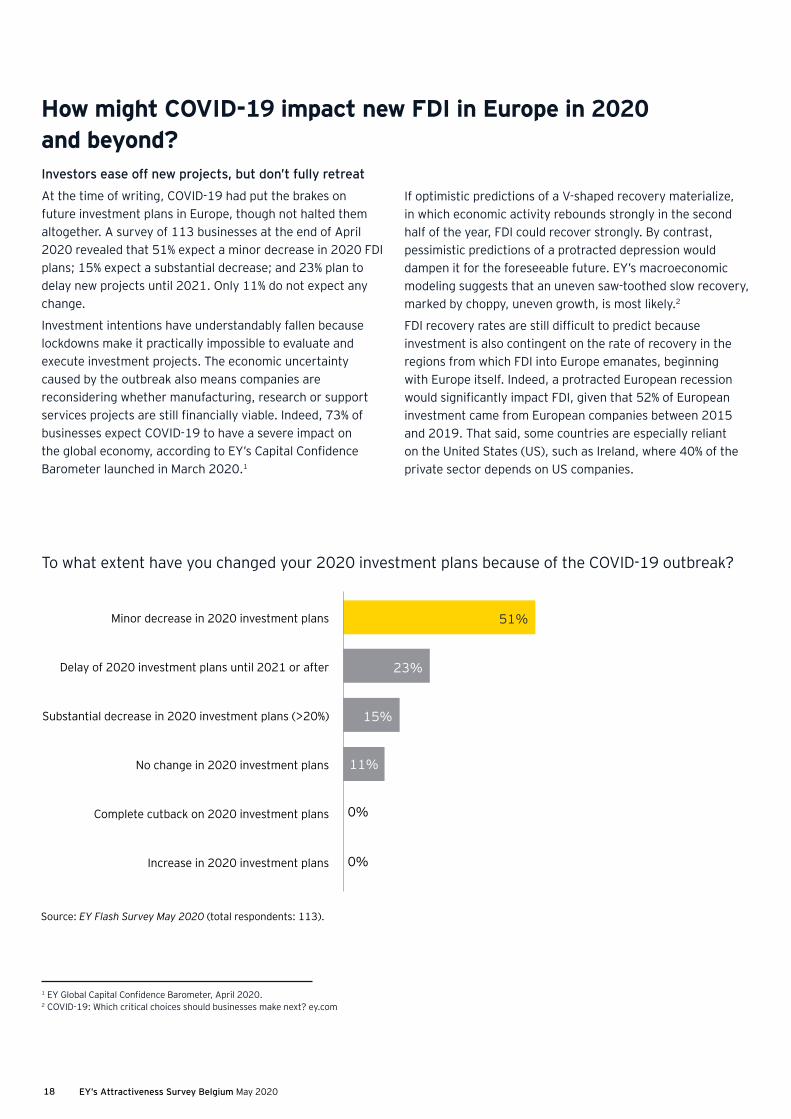
Investors ease off new projects, but don’t fully retreat
At the time of writing, COVID-19 had put the brakes on future investment plans in Europe, though not halted them altogether. A survey of 113 businesses at the end of April 2020 revealed that 51% expect a minor decrease in 2020 FDI plans; 15% expect a substantial decrease; and 23% plan to delay new projects until 2021. Only 11% do not expect any change.
Investment intentions have understandably fallen because lockdowns make it practically impossible to evaluate and execute investment projects. The economic uncertainty caused by the outbreak also means companies are reconsidering whether manufacturing, research or support services projects are still financially viable. Indeed, 73% of businesses expect COVID-19 to have a severe impact on the global economy, according to EY’s Capital Confidence Barometer launched in March 2020.1
1 EY Global Capital Confidence Barometer, April 2020.2 COVID-19: Which critical choices should businesses make next? ey.com
Minor decrease in 2020 investment plans
Delay of 2020 investment plans until 2021 or after
Substantial decrease in 2020 investment plans (>20%)
No change in 2020 investment plans
Complete cutback on 2020 investment plans
Increase in 2020 investment plans
11%
Source: EY Flash Survey May 2020 (total respondents: 113).
0%
51%
15%
23%
0%
If optimistic predictions of a V-shaped recovery materialize, in which economic activity rebounds strongly in the second half of the year, FDI could recover strongly. By contrast, pessimistic predictions of a protracted depression would dampen it for the foreseeable future. EY’s macroeconomic modeling suggests that an uneven saw-toothed slow recovery, marked by choppy, uneven growth, is most likely.2
FDI recovery rates are still difficult to predict because investment is also contingent on the rate of recovery in the regions from which FDI into Europe emanates, beginning with Europe itself. Indeed, a protracted European recession would significantly impact FDI, given that 52% of European investment came from European companies between 2015 and 2019. That said, some countries are especially reliant on the United States (US), such as Ireland, where 40% of the private sector depends on US companies.
To what extent have you changed your 2020 investment plans because of the COVID-19 outbreak?
How might COVID-19 impact new FDI in Europe in 2020 and beyond?
EY’s Attractiveness Survey Belgium May 2020 19
ey.com/be/attractiveness
Urgent need to reform
Viewpoint
Olivier WillocxCEO, Brussels Enterprises Commerce & Industry (BECI)
Belgium, and more particularly Brussels, enjoys an exceptional geographic location. Bordering on several countries and markets, they offer an ideal gateway to the European market and a logistic hub. To these advantages we can add a highly qualified and multilingual workforce, at the forefront in many sectors, in particular pharma, medical, engineering, IT, R&D, cryptography. With its linguistic and cultural diversity, Belgium is also an excellent test market.
These characteristics largely explain Belgium’s results in the EY Belgian Attractiveness Survey. Foreign investment projects are concentrated mainly in sales and marketing, followed by manufacturing and logistics. Belgium’s three Regions, Brussels-Capital, Flanders and Wallonia, also have complementary advantages. Following Brexit, British investments have grown, logically enough, in Belgium. In terms of emerging investor, we are not surprised either by the rise of China.
Belgium comes in the top 5 in the European ranking. To maintain this level in future years, it urgently needs to reform. It could also exhibit more ambition; in any case, it has the keys in hand to do better. Improving continuing skills training, particularly in the context of digitalization and the knowledge economy, is a major challenge.
The stability and simplicity of our fiscal, regulatory and administrative framework are also a fundamental factor of attractiveness. Our labor costs rank among the highest in the world, making us stand out internationally and discouraging a series of investors. In the environmental area, our engineers and researchers are well placed to contribute to the development of clean technologies. This is a precious asset.
Viewpoint
Improving continuing skills training, particularly in the context of digitalization and the knowledge economy, is a major challenge.
“
EY’s Attractiveness Survey Belgium May 202020
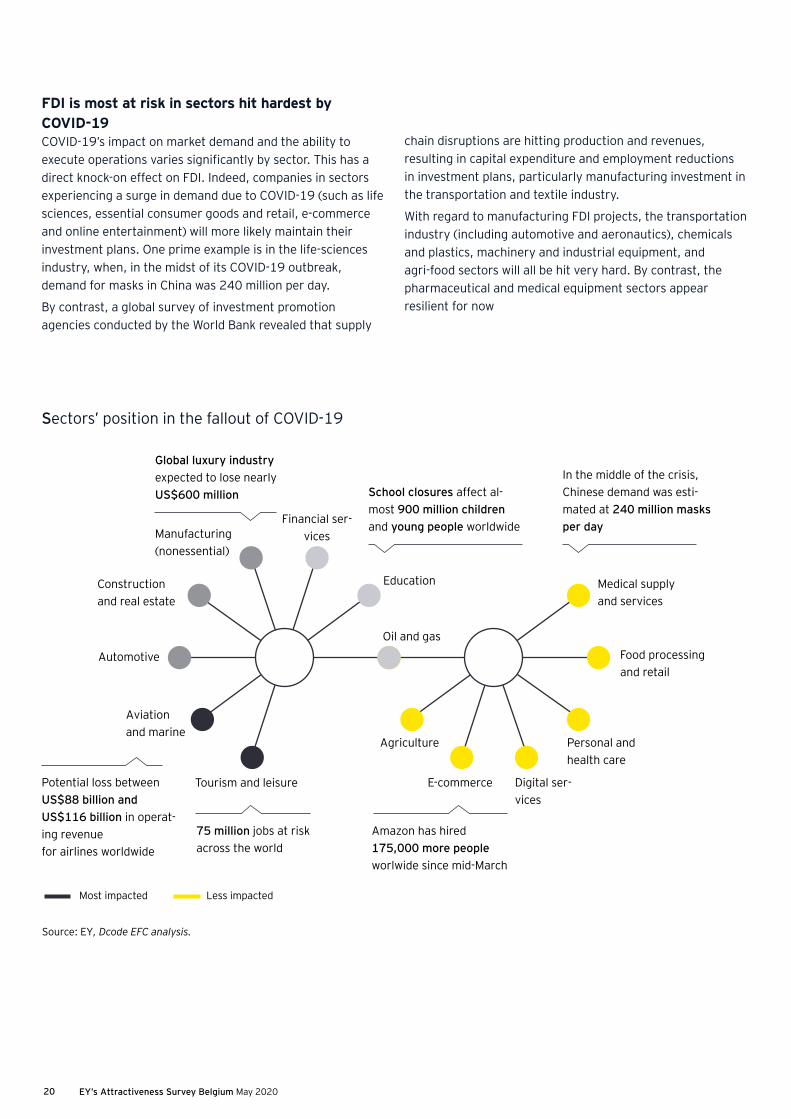
FDI is most at risk in sectors hit hardest by COVID-19 COVID-19’s impact on market demand and the ability to execute operations varies significantly by sector. This has a direct knock-on effect on FDI. Indeed, companies in sectors experiencing a surge in demand due to COVID-19 (such as life sciences, essential consumer goods and retail, e-commerce and online entertainment) will more likely maintain their investment plans. One prime example is in the life-sciences industry, when, in the midst of its COVID-19 outbreak, demand for masks in China was 240 million per day.
By contrast, a global survey of investment promotion agencies conducted by the World Bank revealed that supply
chain disruptions are hitting production and revenues, resulting in capital expenditure and employment reductions in investment plans, particularly manufacturing investment in the transportation and textile industry.
With regard to manufacturing FDI projects, the transportation industry (including automotive and aeronautics), chemicals and plastics, machinery and industrial equipment, and agri-food sectors will all be hit very hard. By contrast, the pharmaceutical and medical equipment sectors appear resilient for now
Tourism and leisure
Aviation and marine
Automotive
Construction and real estate
Manufacturing (nonessential)
Global luxury industry expected to lose nearly US$600 million
Potential loss between US$88 billion and US$116 billion in operat-ing revenue for airlines worldwide
Amazon has hired 175,000 more people worlwide since mid-March
75 million jobs at risk across the world
School closures affect al-most 900 million children and young people worldwide
In the middle of the crisis, Chinese demand was esti-mated at 240 million masks per dayFinancial ser-
vices
Education
Oil and gas
Agriculture Personal and health care
Food processing and retail
Medical supply and services
E-commerce Digital ser-vices
Sectors’ position in the fallout of COVID-19
Source: EY, Dcode EFC analysis.
Most impacted Less impacted

EY’s Attractiveness Survey Belgium May 2020 21
ey.com/be/attractiveness
EY’s Attractiveness Survey Belgium May 202022
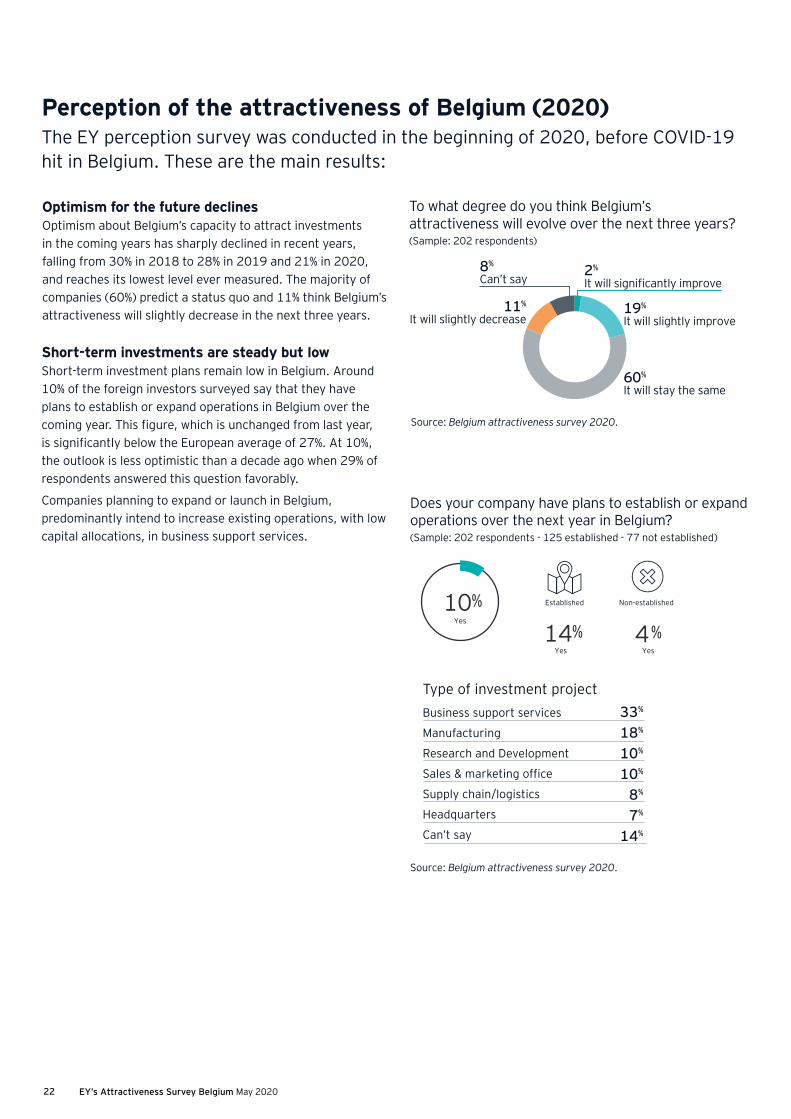
Perception of the attractiveness of Belgium (2020)The EY perception survey was conducted in the beginning of 2020, before COVID-19 hit in Belgium. These are the main results:
Source: Belgium attractiveness survey 2020.
2%
It will significantly improve
19%
It will slightly improve11%
It will slightly decrease
8%
Can’t say
60%
It will stay the same
To what degree do you think Belgium’s attractiveness will evolve over the next three years?(Sample: 202 respondents)
Established Non-established10%
14% 4%
Source: Belgium attractiveness survey 2020.
Yes
Yes Yes
Does your company have plans to establish or expand operations over the next year in Belgium?(Sample: 202 respondents - 125 established - 77 not established)
Type of investment projectBusiness support services
Manufacturing
Research and Development
Sales & marketing office
Supply chain/logistics
Headquarters
Can’t say
33%
18%
10%
10%
8%
7%
14%
Optimism for the future declinesOptimism about Belgium’s capacity to attract investments in the coming years has sharply declined in recent years, falling from 30% in 2018 to 28% in 2019 and 21% in 2020, and reaches its lowest level ever measured. The majority of companies (60%) predict a status quo and 11% think Belgium’s attractiveness will slightly decrease in the next three years.
Short-term investments are steady but lowShort-term investment plans remain low in Belgium. Around 10% of the foreign investors surveyed say that they have plans to establish or expand operations in Belgium over the coming year. This figure, which is unchanged from last year, is significantly below the European average of 27%. At 10%, the outlook is less optimistic than a decade ago when 29% of respondents answered this question favorably.
Companies planning to expand or launch in Belgium, predominantly intend to increase existing operations, with low capital allocations, in business support services.
EY’s Attractiveness Survey Belgium May 2020 23
ey.com/be/attractiveness
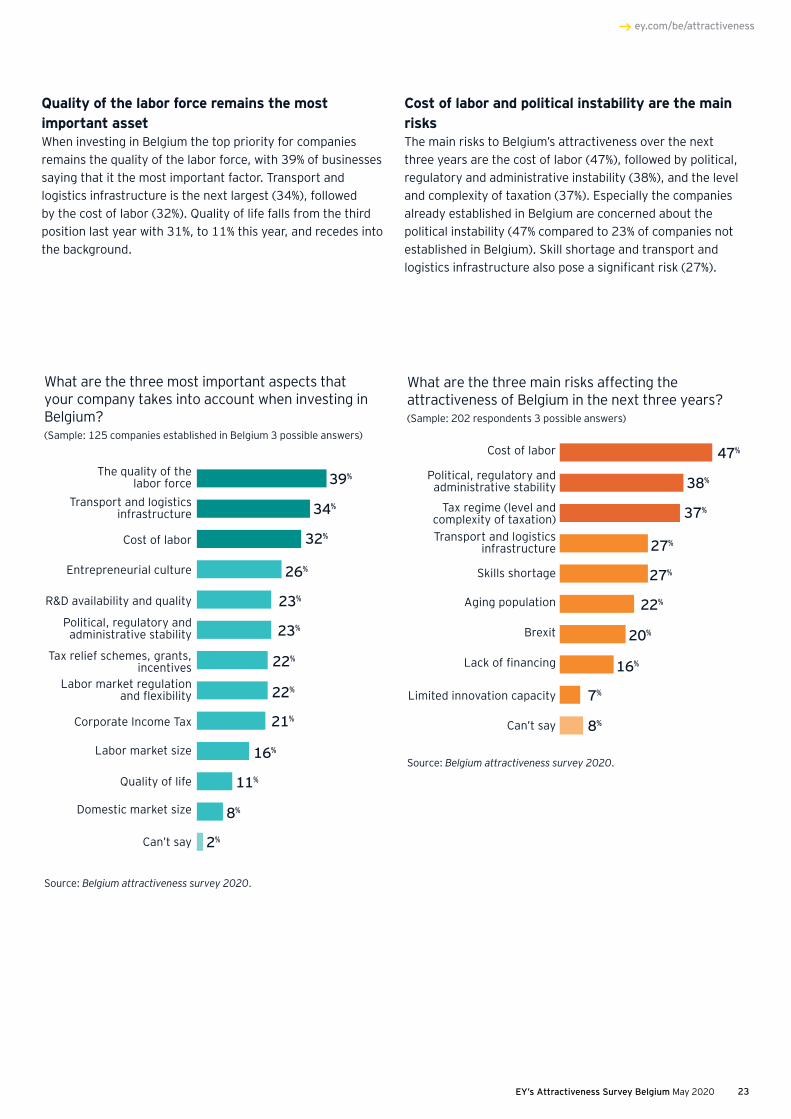
Quality of the labor force remains the most important assetWhen investing in Belgium the top priority for companies remains the quality of the labor force, with 39% of businesses saying that it the most important factor. Transport and logistics infrastructure is the next largest (34%), followed by the cost of labor (32%). Quality of life falls from the third position last year with 31%, to 11% this year, and recedes into the background.
Cost of labor and political instability are the main risksThe main risks to Belgium’s attractiveness over the next three years are the cost of labor (47%), followed by political, regulatory and administrative instability (38%), and the level and complexity of taxation (37%). Especially the companies already established in Belgium are concerned about the political instability (47% compared to 23% of companies not established in Belgium). Skill shortage and transport and logistics infrastructure also pose a significant risk (27%).
39%
34%
32%
26%
23%
23%
22%
22%
21%
16%
11%
8%
2%
Quality of life
Domestic market size
Transport and logistics infrastructure
Political, regulatory and administrative stability
Cost of labor
Corporate Income Tax
R&D availability and quality
Labor market size
Can’t say
Tax relief schemes, grants, incentives
Entrepreneurial culture
The quality of the labor force
Labor market regulation and flexibility
What are the three most important aspects that your company takes into account when investing in Belgium?(Sample: 125 companies established in Belgium 3 possible answers)
Source: Belgium attractiveness survey 2020.
47%
38%
37%
27%
27%
22%
20%
16%
7%
8%
Skills shortage
Aging population
Brexit
Lack of financing
Limited innovation capacity
Transport and logistics infrastructure
Political, regulatory and administrative stability
Cost of labor
Can’t say
Tax regime (level and complexity of taxation)
What are the three main risks affecting the attractiveness of Belgium in the next three years?(Sample: 202 respondents 3 possible answers)
Source: Belgium attractiveness survey 2020.
EY’s Attractiveness Survey Belgium May 202024
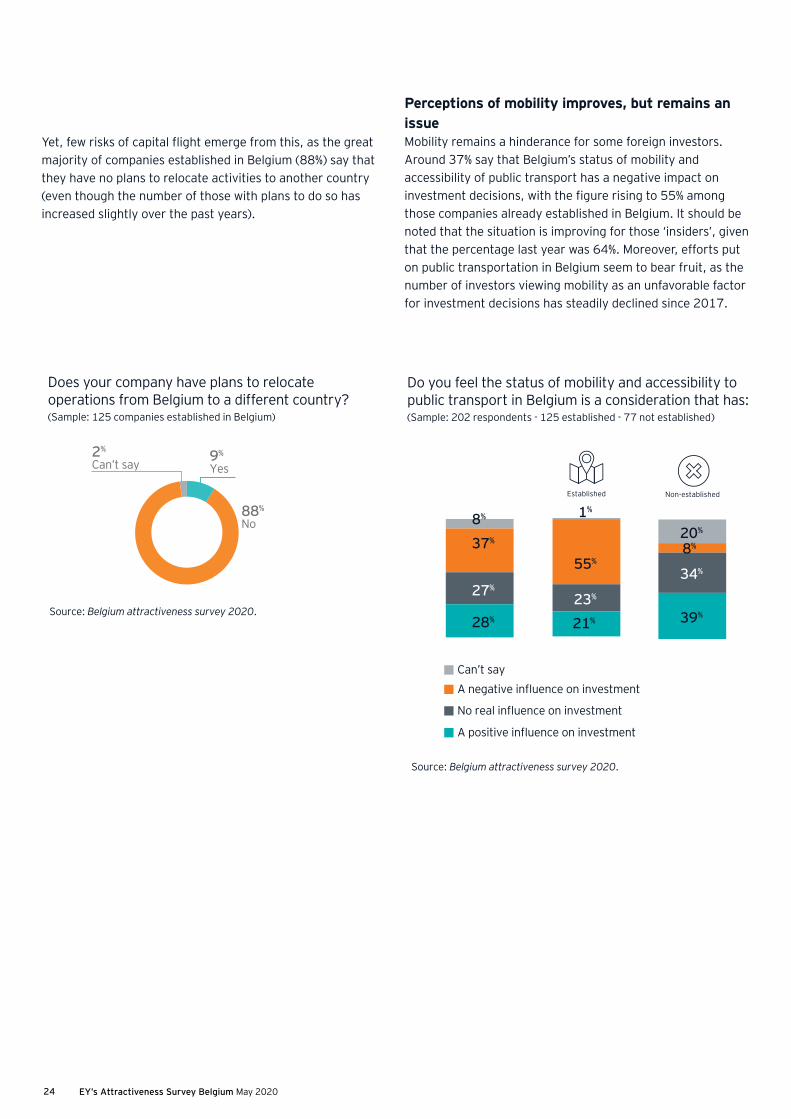
Yet, few risks of capital flight emerge from this, as the great majority of companies established in Belgium (88%) say that they have no plans to relocate activities to another country (even though the number of those with plans to do so has increased slightly over the past years).
Perceptions of mobility improves, but remains an issueMobility remains a hinderance for some foreign investors. Around 37% say that Belgium’s status of mobility and accessibility of public transport has a negative impact on investment decisions, with the figure rising to 55% among those companies already established in Belgium. It should be noted that the situation is improving for those ‘insiders’, given that the percentage last year was 64%. Moreover, efforts put on public transportation in Belgium seem to bear fruit, as the number of investors viewing mobility as an unfavorable factor for investment decisions has steadily declined since 2017.
Source: Belgium attractiveness survey 2020.
9%
Yes
88%
No
2%
Can’t say
Does your company have plans to relocate operations from Belgium to a different country?(Sample: 125 companies established in Belgium)
Source: Belgium attractiveness survey 2020.
28%
37%
27%
8%
39%
8%
34%
20%
21%
55%
23%
1%
Established Non-established
A positive influence on investment
A negative influence on investmentCan’t say
No real influence on investment
Do you feel the status of mobility and accessibility to public transport in Belgium is a consideration that has:(Sample: 202 respondents - 125 established - 77 not established)
EY’s Attractiveness Survey Belgium May 2020 25
ey.com/be/attractiveness
“Following the disruption created by the coronavirus pandemic, companies will be seeking to spread the risk to their supply
chains by expanding their logistical options. While Belgium’s location will ensure that it stays a transportation hub, improving
its transport infrastructure could become increasingly important.”
Tristan Dhondt – EY Belgium Partner
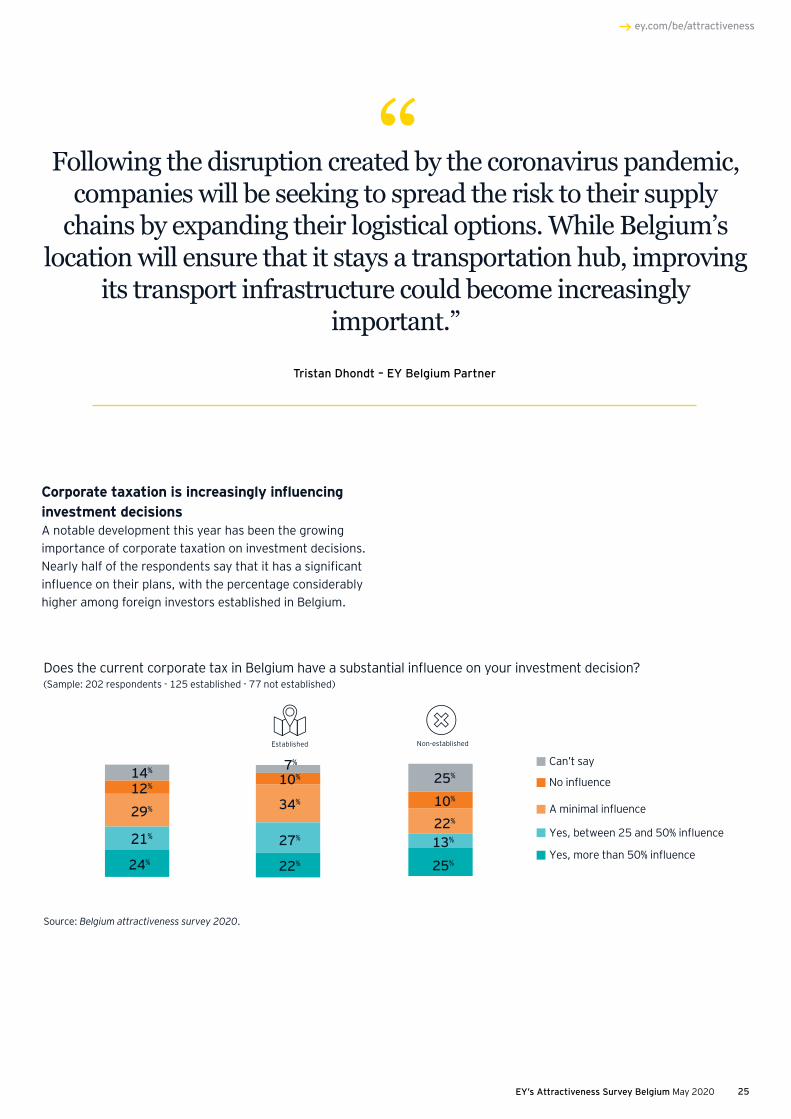
Corporate taxation is increasingly influencing investment decisionsA notable development this year has been the growing importance of corporate taxation on investment decisions. Nearly half of the respondents say that it has a significant influence on their plans, with the percentage considerably higher among foreign investors established in Belgium.
Source: Belgium attractiveness survey 2020.
24%
21%
12%14%
29%
22%
27%
10%
10%
7%
34%
25%
10%
25%
22%
13%
Does the current corporate tax in Belgium have a substantial influence on your investment decision?(Sample: 202 respondents - 125 established - 77 not established)
Established Non-established
Yes, more than 50% influence
Yes, between 25 and 50% influence
No influence
Can’t say
A minimal influence
EY’s Attractiveness Survey Belgium May 202026
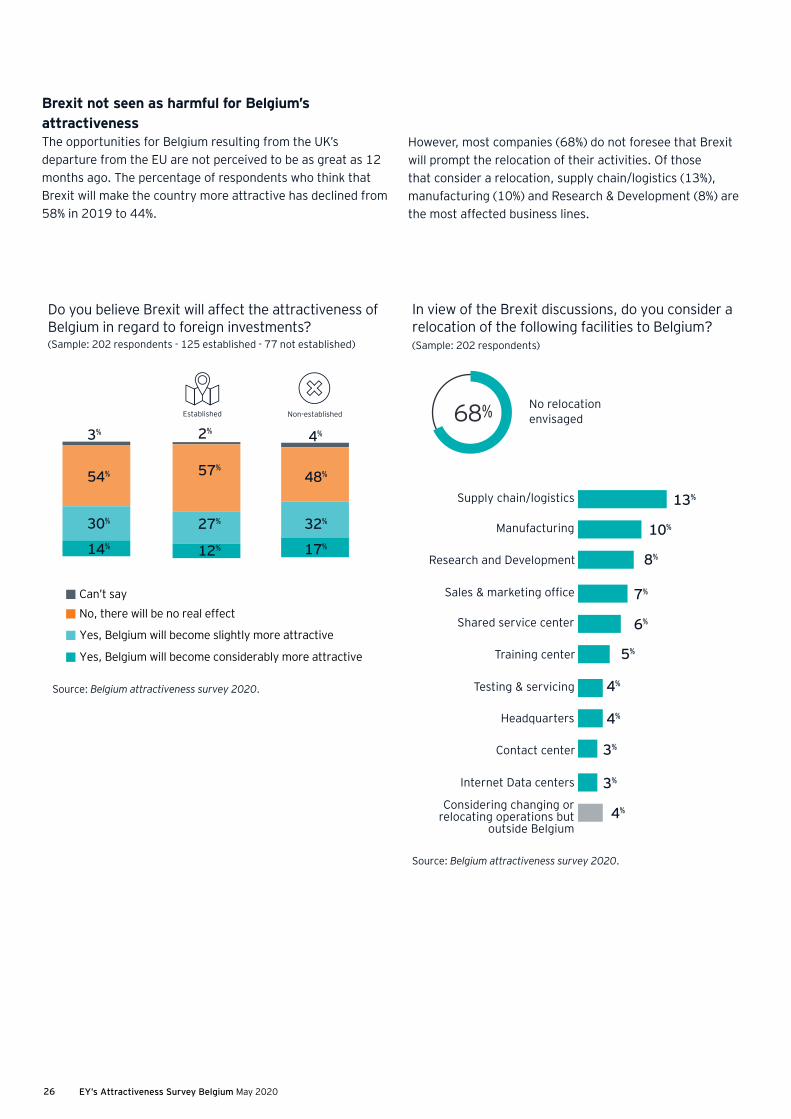
Brexit not seen as harmful for Belgium’s attractivenessThe opportunities for Belgium resulting from the UK’s departure from the EU are not perceived to be as great as 12 months ago. The percentage of respondents who think that Brexit will make the country more attractive has declined from 58% in 2019 to 44%.
However, most companies (68%) do not foresee that Brexit will prompt the relocation of their activities. Of those that consider a relocation, supply chain/logistics (13%), manufacturing (10%) and Research & Development (8%) are the most affected business lines.
14%
30%
3%
54%
Yes, Belgium will become considerably more attractive
No, there will be no real effectCan’t say
Yes, Belgium will become slightly more attractive
Do you believe Brexit will affect the attractiveness of Belgium in regard to foreign investments?(Sample: 202 respondents - 125 established - 77 not established)
Source: Belgium attractiveness survey 2020.
Established Non-established
12%
27%
2%
57%
17%
32%
4%
48%
13%
10%
8%
7%
6%
5%
4%
4%
3%
3%
4%
No relocation envisaged
Manufacturing
Research and Development
Supply chain/logistics
Shared service center
Training center
Sales & marketing office
Headquarters
Contact center
Testing & servicing
Considering changing or relocating operations but
outside Belgium
Internet Data centers
68%
In view of the Brexit discussions, do you consider a relocation of the following facilities to Belgium?(Sample: 202 respondents)
Source: Belgium attractiveness survey 2020.
EY’s Attractiveness Survey Belgium May 2020 27
ey.com/be/attractiveness
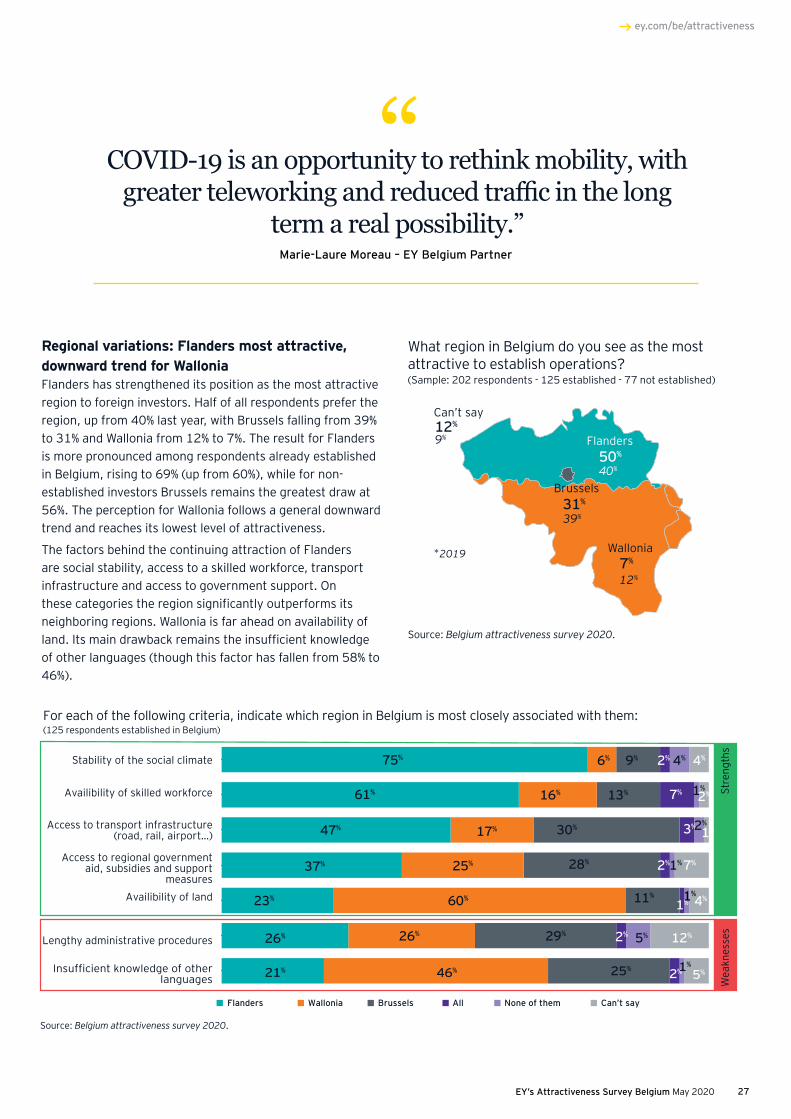
Regional variations: Flanders most attractive, downward trend for Wallonia Flanders has strengthened its position as the most attractive region to foreign investors. Half of all respondents prefer the region, up from 40% last year, with Brussels falling from 39% to 31% and Wallonia from 12% to 7%. The result for Flanders is more pronounced among respondents already established in Belgium, rising to 69% (up from 60%), while for non-established investors Brussels remains the greatest draw at 56%. The perception for Wallonia follows a general downward trend and reaches its lowest level of attractiveness.
The factors behind the continuing attraction of Flanders are social stability, access to a skilled workforce, transport infrastructure and access to government support. On these categories the region significantly outperforms its neighboring regions. Wallonia is far ahead on availability of land. Its main drawback remains the insufficient knowledge of other languages (though this factor has fallen from 58% to 46%).
“COVID-19 is an opportunity to rethink mobility, with greater teleworking and reduced traffic in the long
term a real possibility.”Marie-Laure Moreau – EY Belgium Partner
What region in Belgium do you see as the most attractive to establish operations?(Sample: 202 respondents - 125 established - 77 not established)
Source: Belgium attractiveness survey 2020.
Can’t say
*2019
50%
31%
12%
39%
40%
12%
9%
7%
Flanders
Brussels
Wallonia
Insufficient knowledge of other languages
Stability of the social climate
Availibility of skilled workforce
Access to transport infrastructure (road, rail, airport…)
Access to regional government aid, subsidies and support
measuresAvailibility of land
Lengthy administrative procedures
Flanders Wallonia Brussels All None of them Can’t say
75% 6% 9% 2% 4% 4%
13% 7% 1%2%
30% 3%2%1%
28% 2%1%7%
11%1%1
%4%
29% 2% 5% 12%
25% 2%1%
5%
61%
47% 17%
16%
25%37%
23% 60%
26% 26%
46%21%
Stre
ngth
sW
eakn
esse
sFor each of the following criteria, indicate which region in Belgium is most closely associated with them:(125 respondents established in Belgium)
Source: Belgium attractiveness survey 2020.
EY’s Attractiveness Survey Belgium May 202028
Quick and drastic action
Viewpoint
Prof. Dr. Leo SleuwaegenProfessor International Business Strategy, KU LeuvenEmeritus Professor Vlerick Business School
Belgium maintained a remarkable strong position in attracting foreign investment projects in 2019. It holds a 5th position among the countries surveyed with a 4% share of all new foreign investment projects planned in Europe.
A point of concern is the low number of new jobs created by these projects, where Belgium is more than 25 percent below the European average. The high labor cost and growing concentration of new projects in sales and marketing (40%), where less jobs per project are created compared to manufacturing and/or logistics largely account for this lesser jobs performance.
On the other hand, the growing presence of UK projects in the year prior to Brexit reflects Belgium role as gateway to Europe’s main markets, a role which the country should maintain for all non-European investors.
The attractiveness survey among business leaders reflects the role of the current uncertainty as a prime factor in delaying or cancelling projects, and in the hesitation to develop new projects. Belgium hosts a high number of foreign investment projects in the sectors that are most affected by the Covid-19 crisis following the survey report (automotive, chemicals, financial services).
Viewpoint
More than ever, the government needs to act as a trustworthy partner with an impactful recovery stimulus program, which is singled out by business leaders as the most important location attractiveness factor for the next coming years. The current political crisis and uncertainty in Belgium is a factor that is not helping in that regard.
The plans of foreign investors to expand activities in the future are at the lowest level in more than fifteen years and the slightly growing trend to relocate part of activities from Belgium are strong signals asking to take quick and drastic action. Reducing taxation and regulatory complexity, together with improving investment in education and skill development, especially in those skills that are essential to support the digital economy, should be priority areas.
The digital and cleantech sectors are the sectors with the most promising outlook for attracting new FDI projects in Europe according to the European attractiveness report.
More than ever, the government needs to act as a trustworthy partner with an impactful recovery stimulus program
“

EY’s Attractiveness Survey Belgium May 2020 29
ey.com/be/attractiveness

EY’s Attractiveness Survey Belgium May 202030 EY’s Attractiveness Survey Belgium May 2020
2 What Belgium needs to do to re-define/re-frame its future attractiveness
30
EY’s Attractiveness Survey Belgium May 2020 31
ey.com/be/attractiveness
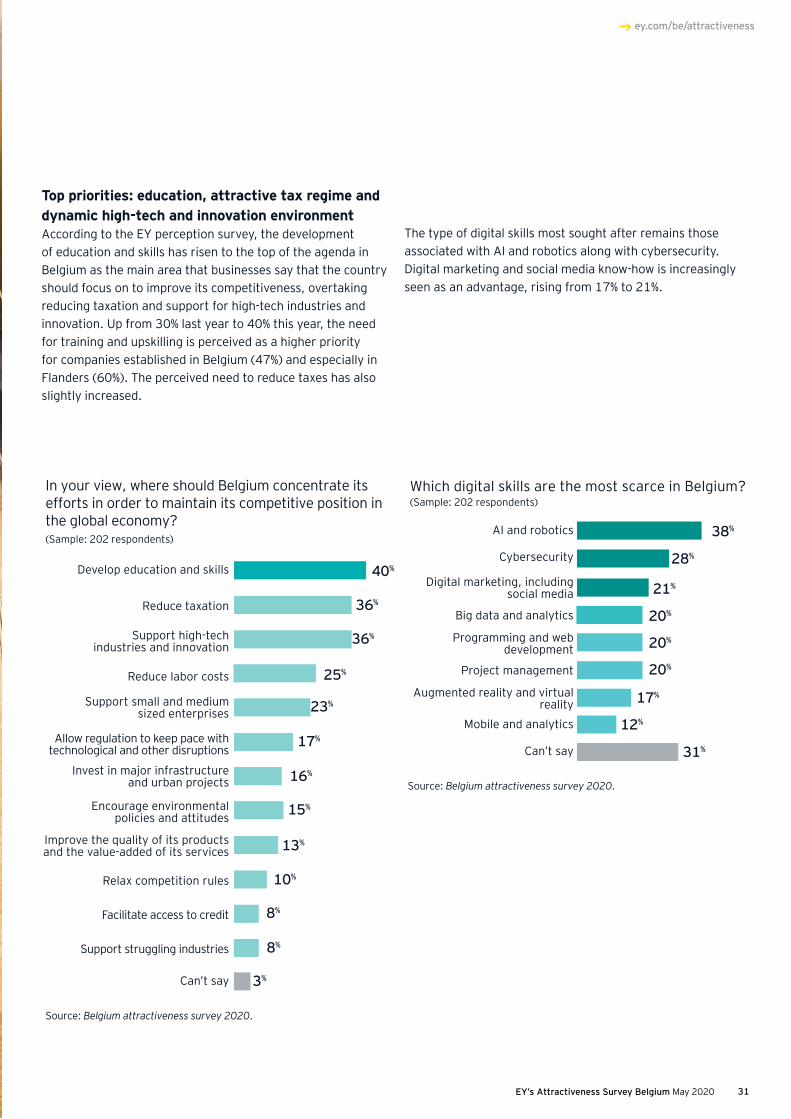
Top priorities: education, attractive tax regime and dynamic high-tech and innovation environmentAccording to the EY perception survey, the development of education and skills has risen to the top of the agenda in Belgium as the main area that businesses say that the country should focus on to improve its competitiveness, overtaking reducing taxation and support for high-tech industries and innovation. Up from 30% last year to 40% this year, the need for training and upskilling is perceived as a higher priority for companies established in Belgium (47%) and especially in Flanders (60%). The perceived need to reduce taxes has also slightly increased.
38%
28%
21%
20%
20%
20%
17%
12%
31%
Big data and analytics
Cybersecurity
Augmented reality and virtual reality
Programming and web development
Can’t say
Project management
Digital marketing, including social media
AI and robotics
Mobile and analytics
Which digital skills are the most scarce in Belgium?(Sample: 202 respondents)
Source: Belgium attractiveness survey 2020.
40%
36%
36%
25%
23%
17%
16%
15%
13%
10%
8%
8%
3%
Develop education and skills
Reduce taxation
Reduce labor costs
Support small and medium sized enterprises
Allow regulation to keep pace with technological and other disruptions
Improve the quality of its products and the value-added of its services
Relax competition rules
Can’t say
Facilitate access to credit
Support struggling industries
Encourage environmental policies and attitudes
Support high-tech industries and innovation
Invest in major infrastructure and urban projects
In your view, where should Belgium concentrate its efforts in order to maintain its competitive position in the global economy? (Sample: 202 respondents)
Source: Belgium attractiveness survey 2020.
The type of digital skills most sought after remains those associated with AI and robotics along with cybersecurity. Digital marketing and social media know-how is increasingly seen as an advantage, rising from 17% to 21%.
EY’s Attractiveness Survey Belgium May 202032
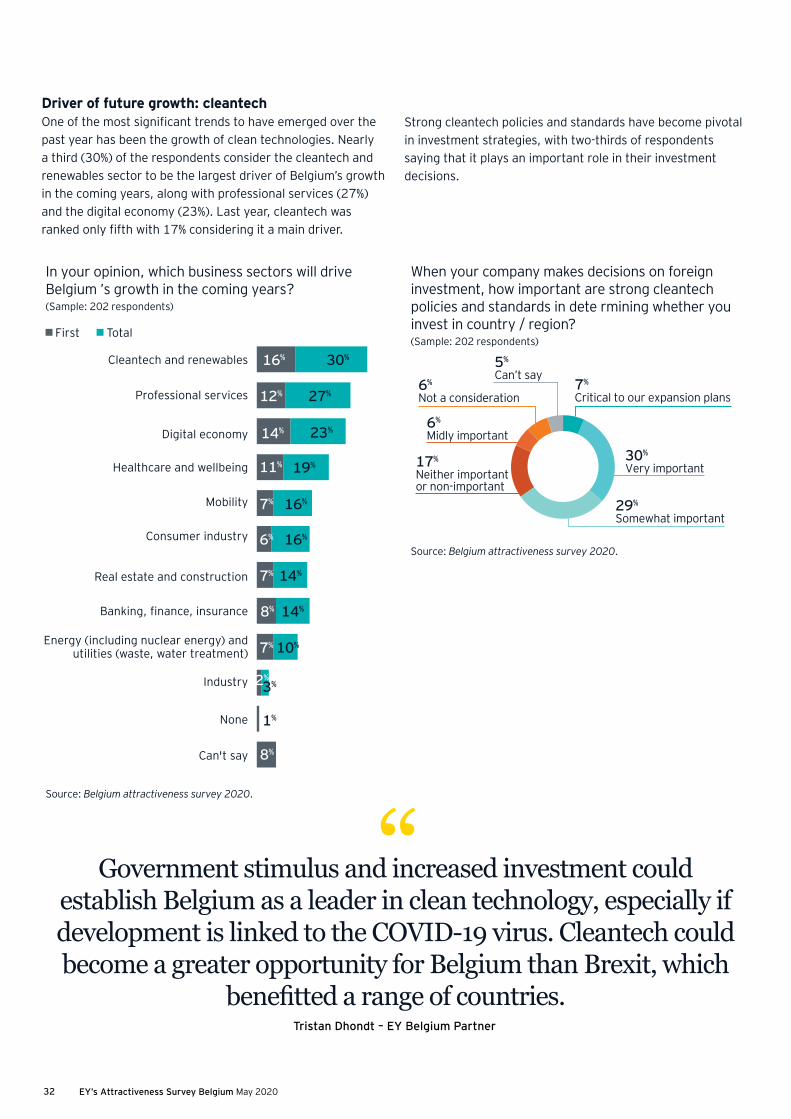
Driver of future growth: cleantechOne of the most significant trends to have emerged over the past year has been the growth of clean technologies. Nearly a third (30%) of the respondents consider the cleantech and renewables sector to be the largest driver of Belgium’s growth in the coming years, along with professional services (27%) and the digital economy (23%). Last year, cleantech was ranked only fifth with 17% considering it a main driver.
“Government stimulus and increased investment could establish Belgium as a leader in clean technology, especially if development is linked to the COVID-19 virus. Cleantech could become a greater opportunity for Belgium than Brexit, which
benefitted a range of countries.Tristan Dhondt – EY Belgium Partner
Strong cleantech policies and standards have become pivotal in investment strategies, with two-thirds of respondents saying that it plays an important role in their investment decisions.
In your opinion, which business sectors will drive Belgium ’s growth in the coming years?(Sample: 202 respondents)
Source: Belgium attractiveness survey 2020.
First Total
16% 30%
12% 27%
14% 23%
11% 19%
7% 16%
6% 16%
7% 14%
8% 14%
7% 10%
3%2%
1%
8%
Cleantech and renewables
Professional services
Healthcare and wellbeing
Mobility
Energy (including nuclear energy) and utilities (waste, water treatment)
Real estate and construction
Digital economy
Consumer industry
None
Can't say
Banking, finance, insurance
Industry
Source: Belgium attractiveness survey 2020.
7%
Critical to our expansion plans
29%
Somewhat important
30%
Very important
6%
Midly important
6%
Not a consideration
5%
Can’t say
17%
Neither important or non-important
When your company makes decisions on foreign investment, how important are strong cleantech policies and standards in dete rmining whether you invest in country / region?(Sample: 202 respondents)
EY’s Attractiveness Survey Belgium May 2020 33
ey.com/be/attractiveness
Belgium as a leading country on cleantech
Viewpoint
Ludovic DeprezEY Belgium Climate Change and Sustainability Services Executive Director
Leen DefoerEY Belgium Climate Change and Sustainability Services Partner
We are seeing a growing group of companies that greatly value sustainability and connect it to innovation. Since consumers and stakeholders expect more sustainable products, companies need to adapt their products, operations and supply chains.
The results of the yearly EY Attractiveness Survey support this observation. A high grade of sustainability expertise contributes to the attractiveness of a country.
That is good news for Belgium, because our workforce and companies have a lot of in-house knowhow on cleantech. Moreover, the presence of industry-focused universities and research institutes further positions Belgium as a leading country on cleantech.
We see that certain sectors are at the forefront of sustainability. For example, the chemical industry that is investing in new sustainable materials, but also producers of consumer goods that are well aware of the sustainability expectations of their clients. And the winds of change are also affecting investors that want to make sure that their portfolio is future proof.
Viewpoint
But the green wave goes beyond a handful of sectors. Take for example our own company: EY has set a global short-term goal to become carbon neutral, which is no small endeavor. We see this engagement as our contribution to a better and more sustainable working world but also as a requirement to stay relevant in the business community in the future.
By the way, it is a mistake to think that COVID-19 will change anything about this development. The EU’s ambitious Green Deal was launched last year in December, right before the outbreak of the virus. Although COVID-19 has temporarily wiped out all other concerns, it has already become clear that sustainability will be central in the recovery plans. Hence the interest in cleantech and sustainability goes beyond statements and is increasingly translated into concrete initiatives and genuine engagement of companies.
The observation that sustainability will become more important is good news for Belgian companies that already have much knowhow in this area of expertise.
“
EY’s Attractiveness Survey Belgium May 202034 EY’s Attractiveness Survey Belgium May 2020
Reco
mm
enda
tions
1
2
These are the policy measures EY Belgium suggests to ensure the attractiveness of Belgium for foreign investors in the long term.
TaxLowering the corporate tax rate from 33% to 25% in 2020 has had a positive impact, but neighboring countries have also lowered their tax rates, and to be comparable Belgium should lower its rate still further to at least 20%. Such a reduction should also be accompanied by a decrease in the individual income tax burden in order to attract more FDI.
Recommendations:• Reduce the corporate rate to 20% and simplify the system • Widen knowledge of and the access to the tax incentives that support innovation
and R&D• Lower the withholding tax on interest, dividends and royalties to a maximum
rate of 10% • Create a stable tax climate that ensures certainty over tax issues • Ensure a legal and fiscal stable framework for companies and businesses• Enforce and empower the Belgian Ruling Commission
EducationThe economic landscape is transforming from a manufacturing one to one based on technological innovation. The focus on education and training must therefore adjust accordingly and lead this change.
Recommendations:• Increase focus in primary and secondary schools on developing IT skills• Provide structural training in entrepreneurship in educational programs• Promote the teaching of digital skills• Invest in durable life-long learning, allowing employees to retrain and participate
in the digital economy in the long term• Invest in the opportunities for learning at the workplace• Address the structural underfunding of higher education
34
EY’s Attractiveness Survey Belgium May 2020 35
ey.com/be/attractiveness
EY’s Attractiveness Survey Belgium May 2020
3 Collaborative ways of working and cooperationAnother key outcome of the pandemic could be a transformation of the idea of competition to include more collaborative ways of working. Large pharmaceuticals in Belgium are cooperating on research into a vaccine for the coronavirus, while furloughed workers have helped fill staffing shortages at supermarkets that were permitted to remain open during the lockdown. Innovative collaboration has increased during the crisis.
Moreover, greater cooperation between the regions of Belgium would help develop the country’s profile on the global stage. Bringing the three federal regions together would boost the country’s reputation and distinguish its different strengths.
35
4 Supply chain and logisticsNow is a good time to rethink our business models. Supply chains have experienced difficulties during the COVID-19 crisis, suggesting the need to build more resilient ones that are less vulnerable to disruption from the closure of some operations. The pandemic has also reinforced the need for business models to be more agile and to exploit the opportunities offered by digitalization and online sales.
Recommendation:• Stimulate investment in the logistics and supply chains, including an inclusive
mobility plan

EY’s Attractiveness Survey Belgium May 202036 EY’s Attractiveness Survey Belgium May 2020
Reco
mm
enda
tions
5 EmploymentIn a post-pandemic period, new ways of working will be introduced. The health and well-being of employees will be key, the digital transformation essential. Continuous investments in expanding the digital skillsets, the on-the-job-learning and communication are required.
Several important fiscal and social measures have been carried out over the past years to reduce the cost of employment and to increase flexibility, particularly in industrial sectors and logistics that are strong drivers of job creation.
Recommendations:• Analyze continuously the gap in labor costs with the most important trade
partners of Belgium and act on the analysis• Examine ways in which the cost of labor can be further reduced• Modify labor law principles to facilitate night-& shift work, e-commerce and
teleworking• Reduce tax burden for individuals on professional income• Increase employment driven tax incentives• Focus on the digital transformation of employees, including supportive
measures with respect to this new way of working (e.g. remote working, virtual, flexible) in a post-pandemic environment.
36
EY’s Attractiveness Survey Belgium May 2020 37
ey.com/be/attractiveness
EY’s Attractiveness Survey Belgium May 2020
6 High- tech, cleantech and innovation environmentAlthough investments in new technologies tend to be smaller than those for other activities, they are often made by established businesses in the country. The priority must therefore be to continue to develop a dynamic, high-tech and innovative environment that attracts this type of investment. A third of respondents see clean technologies, for example, as a major driver of economic growth. The European Green Deal offers a stimulus to develop such innovative technologies, and Belgium has the opportunity to become a major player in the cleantech sector, among other sectors that are responding to the challenges of containing the COVID-19 pandemic and the impact of climate change.
Recommendations:• Focus on the digital competitiveness of Belgium, including digital & sustainable
infrastructure, digital skills/education and a dynamic ecosystem of technology and green tech companies
• Establish strong cleantech standards and policies • Simplify fiscal measures supporting innovation • Reduce the administrative burden of calculating CO2 emissions in order to
facilitate the competitive advantage for companies of ecological transition• Introduce incentives for companies to rethink their business models towards
green growth
37
EY’s Attractiveness Survey Belgium May 202038
35%
22%
43%
Source: EY Attractiveness Survey 2020.
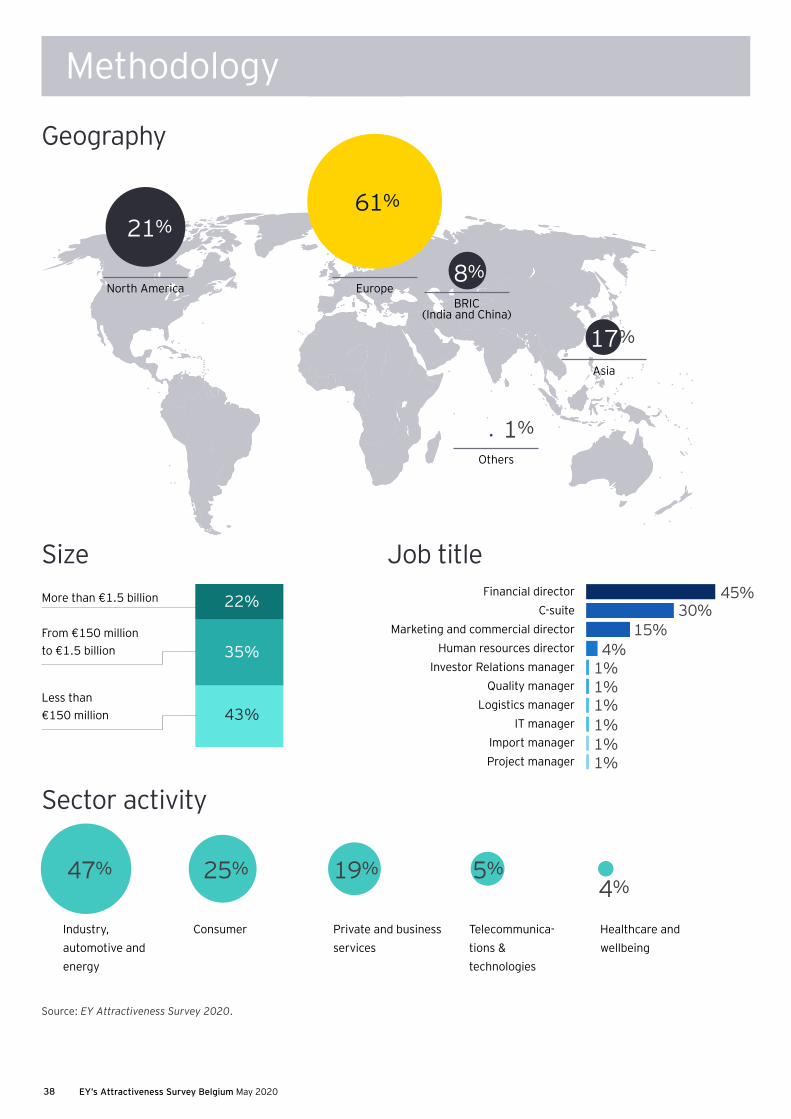
Methodology
Geography
Size
Sector activity
Job title
Asia
Others
More than €1.5 billion
From €150 million to €1.5 billion
Less than €150 million
BRIC (India and China)
North America Europe
61%
21%
8%
17%
1%
45%30%
15%4%
1%1%1%1%1%1%
47% 25% 19% 5%4%
Financial directorC-suite
Marketing and commercial directorHuman resources director
Investor Relations managerQuality manager
Logistics managerIT manager
Import managerProject manager
Industry, automotive and energy
Consumer Private and business services
Telecommunica-tions &technologies
Healthcare and wellbeing
EY’s Attractiveness Survey Belgium May 2020 39
ey.com/be/attractiveness
EY’s Attractiveness Surveys are widely recognized by our clients, media, governments and major public stakeholders as a key source of insight into FDI. Examining the attractiveness of a particular region or country as an investment destination, remove barriers to growth. A twostep methodology analyzes both the reality and perception of FDI in the country or region. Findings are based on the views of representative panels of international and local opinion leaders and decision-makers.
The program has an 18-year legacy and has produced in-depth studies for Europe, a large number of European countries, Africa, the Mediterranean region, India, Japan, South America, Turkey and Kazakhstan.
For more information about the European report, please visit: ey.com/attractiveness #EYAttract
About the EY Attractiveness program
The “real” attractiveness of Belgium for foreign investors Our evaluation of the reality of FDI in Europe is based on the EY European Investment Monitor (EIM), the EY proprietary database produced in collaboration with OCO. This database tracks the FDI projects that have resulted in the creation of new facilities and jobs. By excluding portfolio investments and M&A, it shows the reality of investment in manufacturing and services by foreign companies across the continent. Data on FDI is widely available.
An investment in a company is normally included in FDI data if the foreign investor acquires more than 10% of the company’s equity and takes a role in its management. FDI includes equity capital, reinvested earnings and intracompany loans.
However, our figures also include investments in physical assets, such as plant and equipment. And this data provides valuable insights into:
• How FDI projects are undertaken
• What activities are invested in
• Where projects are located
• Who is carrying out these projects
The EY EIM is a leading online information provider that tracks inward investment across Europe. This flagship business information tool is the most detailed source of data on cross-border investment projects and trends throughout Europe. The EY EIM is frequently used by government bodies, private sector organizations and corporations looking to identify significant trends in employment, industry, business and investment.
The EY EIM database focuses on investment announcements, the number of new jobs created and, where identifiable, the associated capital investment. Projects are identified through the daily monitoring of more than 10.000 news sources. To confirm the accuracy of the data collected, the research team aims to directly contact more than 70% of the companies undertaking these investments. The following categories of investment projects are excluded from the EY EIM:
• M&A and joint ventures (unless these result in new facilities or new jobs being created)
• License agreements
• Retail and leisure facilities, hotels and real estate*
• Utilities (including telecommunications networks, airports, ports and other fixed infrastructure)*
• Extraction activities (ores, minerals and fuels)*
• Portfolio investments (pensions, insurance and financial funds)
• Factory and other production replacement investments (e.g., replacing old machinery without creating new employment)
• Nonprofit organizations (charitable foundations, trade associations and government bodies) * Investment projects by companies in these categories are included in certain instances: e.g., details of a specific new hotel investment or retail outlet would not be recorded, but if the hotel or retail company were to establish a headquarters facility or a distribution center, this project would qualify for inclusion in the database.
The perceived attractiveness of Belgium and its competitors by foreign investors We define the attractiveness of a location as a combination of image, investors’ confidence and the perception of a country’s or area’s ability to provide the most competitive benefits for FDI.
For the Belgian Attractiveness Survey, the field research was conducted by the CSA Institute between February 14 and March 4, 2020 via telephone interviews, based on a representative panel of 202 international decision-makers, established (62%) and non-established (38%) in Belgium.
For the European Attractiveness Survey, the field research was conducted by the CSA Institute in January and February 2020 via telephone interviews, based on a representative panel of 504 international decision-makers. A second perception survey was conducted from 15 April to 29 April to reflect decision-makers’ perception changes due to the COVID-19 crisis. This online survey was led by Euromoney, based on a representative panel of 113 international decision-makers.
EY contacts
Patrick Rottiers CEO EY Belgium Tel: +32 (0)2 774 91 11 [email protected]
Tristan Dhondt EY Belgium Partner Tel: +32 (0)2 774 60 17 [email protected]
Marie-Laure Moreau EY Belgium Partner Tel: +32 (0)4 273 76 43 [email protected]
Guy Serraes EY Director Public Sector Tel: +32 (0)9 242 52 05 [email protected]
Bruno Wattenbergh EY Senior Advisor Tel: +32 (0)2 774 97 41 [email protected]
Christophe Ballegeer Press Relations Tel: +32 (0)2 774 91 11 [email protected]
Jan-Peter Eerdekens Brand, Marketing & Communications consultant Tel: +32 (0)2 774 91 11 [email protected]
About EYEY is a global leader in assurance, tax, transaction and advisory services. The insights and quality services we deliver help build trust and confidence in the capital markets and in economies the world over. We develop outstanding leaders who team to deliver on our promises to all of our stakeholders. In so doing, we play a critical role in building a better working world for our people, for our clients and for our communities.
EY refers to the global organization and/or one or more of the member firms of Ernst & Young Global Limited, each of which is a separate legal entity. Ernst & Young Global Limited, a UK company limited by guarantee, does not provide services to clients.
For more information about our organization, please visit ey.com.
© 2020 EYGM Limited.
All Rights Reserved.
ED None
In line with EY’s commitment to minimize its impact on the environment, this document has been printed on paper with a high recycled content.
This material has been prepared for general informational purposes only and is not intended to be relied upon as accounting, tax or other professional advice. Please refer to your advisors for specific advice.
The views of third parties set out in this publication are not necessarily the views of the global EY organization or its member firms. Moreover, they should be seen in the context of the time they were made.
ey.com/be
EY | Assurance | Tax | Transactions | Advisory