new possibilities for driver hmipublications.lib.chalmers.se/records/fulltext/181412/181412.pdf ·...
TRANSCRIPT

New Possibilities for Driver HMI
A study through design on infrared interaction technology
Master of Science Thesis
Simon Fellin
Department of Product and Production Development
Design & Human Factors
CHALMERS UNIVERSITY OF TECHNOLOGY
Gothenburg, Sweden, 2013

Table of Content Abstract ..................................................................................................................................... 1
Acknowledgements ................................................................................................................ 2
1. Introduction .......................................................................................................................... 3
1.1 Neonode ......................................................................................................................... 3
1.2 MultiSensing Technology ............................................................................................... 4
1.3 Car Integration ............................................................................................................... 5
1.4 Purpose, Goals and Delimitations ................................................................................ 6
1.5 Sustainability.................................................................................................................... 7
2. Methods and Implementation ........................................................................................... 8
2.1 Planning ........................................................................................................................... 8
2.2 Background .................................................................................................................... 9
2.3 Early Concept Development ..................................................................................... 10
2.4 Final Concept Development ...................................................................................... 12
2.5 Validation ...................................................................................................................... 15
3. Background ........................................................................................................................ 16
3.1 Theory on Driving .......................................................................................................... 16
3.2 Technical Description .................................................................................................. 25
3.3 Competing Technologies ........................................................................................... 28
3.4 Trends in Driver HMI ...................................................................................................... 30
3.5 Function Listing ............................................................................................................. 31
4 Early Concept Development ............................................................................................ 33
4.1 Early Sketches ............................................................................................................... 33
4.2 Promising Areas ............................................................................................................ 36
4.3 Functionality to Concept ............................................................................................ 38
5 Final Concept Development ............................................................................................ 41
5.1 GUIs ................................................................................................................................ 41
5.2 Physical Design ............................................................................................................. 43
5.3 Formative Evaluation ................................................................................................... 46
6. Validation ............................................................................................................................ 47
6.1 Kano Analysis ................................................................................................................ 47
6.2 Benchmark Usability Test ............................................................................................. 48
7. Discussion ............................................................................................................................ 53

7.1 Validation ...................................................................................................................... 53
7.2 Results ............................................................................................................................ 54
7.3 Methods and Implementation ................................................................................... 55
7.4 Theory ............................................................................................................................ 56
8. Conclusions ......................................................................................................................... 57
References .............................................................................................................................. 58
Appendices ............................................................................................................................ 69
Appendix A – GANNT Chart ............................................................................................. 70
Appendix B – Kano Model Results ................................................................................... 71
Appendix C – Prototype description ............................................................................... 74
Appendix D – Usability Protocol ....................................................................................... 76

1
Abstract The Stockholm based company Neonode licenses infrared interaction technology
and is moving into the automotive segment. The company now wants to further
develop their technology to better suit the needs of the automotive industry and is
also in need of case studies that demonstrate the benefits of using their technology
to improve the interaction between driver and driver HMI.
The aims of the project were to summarize knowledge about in-car interaction and
to give an example of how this knowledge can be realized by creating a
demonstrator featuring the Neonode technology.
Recent publications regarding human car interaction were summarized and
presented along with a number of crude conceptual solutions, demonstrating some
possibilities for automotive applications. In collaboration with the Neonode team, a
final suggestion on a new automotive demonstrator was then developed.
The final concept features suggested solutions to several of the problems uncovered
in the background study. The final concept aims to keep the driver’s eyes on the
road and both hands on the wheel. Different ways to provide effective feedback
when using touch solutions and a safer way of textual input in the driver environment
are also suggested.
The conceptual solution was empirically evaluated against a benchmark solution,
the result gave a clear indication that refined versions of some of the suggested
solutions, if implemented in cars in a near future, could lead to a safer and more
user-friendly driving environment.

2
Acknowledgements Firstly, I would like to give thanks to my family for always being supportive through my
years of studying. I would also like to thank my examiner MariAnne Karlsson and my
supervisor Lars-Ola Bligård for their commitments to this project.
A special dedication to all the people at Neonode who have been so kind to take
time to listen to my presentations and have shared with me their own thoughts and
given me feedback regarding my work, especially Ulf Mårtensson who has been my
main contact person during the project.
Furthermore, I would like to thank Semcon for their assistance in the research phase
and the carpool Sunfleet in Gothenburg for lending me a car to use during the
usability test.
Finally I would like to mention all the wonderful people at the Industrial Design and
Engineering programme at Chalmers. You have made these five last years go by so
quickly. I wish you all the best!

3
1. Introduction
1.1 Neonode
Neonode was started in Sweden in
2001 by Thomas Eriksson and Magnus
Goetz. Initially the company
developed and sold its own touch
display-based mobile phones, the
Neonode N1, N1m and N2 (see Figure
1). These phones featured an
interaction system based on infrared
light rather than capacitive touch
technology. The phones were
developed, sold and marketed from
the Neonode offices in Sweden and
manufactured in Malaysia.
In 2009, based on the previous
experience from the mobile business,
Neonode changed its business model
and has since then been licensing
technology rather than developing
consumer products. The main
Neonode technology is called zForce
(zero force) and is today used by
multiple companies around the world
in applications such as e-readers,
phones, tablets, automotive and
printers as well as games and toys.
Figure 1: Neonode N1 (to the left) and the successor Neonode N2 (on the right)

4
1.2 MultiSensing Technology
Neonode’s patented zForce
technology consists of a set of infrared
emittors and detectors, a light guide,
control electronics and control
software. The emittors project infrared
light directly above the touch surface
and touch is indicated by changes in
lighting conditions. Gestures can be
detected by combining measured
values form one or several photo
detectors.
Neonode has a product segment
called MultiSensing technology, which
is able to detect touch on any material.
The MultiSensing technology may also
be used for gesture control using
proximity solutions and can detect 3D
gestures like the rotation of a finger or
a stylus using a solution nicknamed
“Stargate”. (Mårtensson, 2013)

5
1.3 Car Integration
One of the latest markets that
Neonode is expanding into and see a
large potential in is the automotive
segment. In-car HMI is a market that is
very large and currently undergoing
major changes.
During the last couple of years, cars
have become more than a mean for
individual transportation and people
spend a considerable amount of time
in their cars while for example
commuting to work.
There has at the same time been a
significant increase in the amount of
functionality offered in the driving
environment. Vehicles have become
an access point for information, media
consumption and personal
entertainment. As many of these
systems are digital, the car has
become a space not only for driving,
but also for interacting with
miscellaneous systems. Therefore,
human factors and usability play an
increasingly important role in the
interaction design of the different
interfaces in the car. One of the main
reasons for this is safety. On one hand,
the technological advances have
made driving safer through driver
assistance systems; on the other hand
the driver is now more exposed to
performing non driving related tasks
while the need to manoeuvre the car
safely still remains. (Schmidt 2010)
In the early fall of 2012, Neonode
began developing interaction solutions
specifically designed for the
automotive industry. A project was
initiated to develop a concept
steering wheel that was to
demonstrate some of the possible
Neonode solutions for automotive
applications at the CES expo in Las
Vegas in early 2013. Neonode now
wants to increase its knowledge in the
area of driver-vehicle interaction as
well as develop and refine some
concepts that can be used to market
the technology to companies in the
automotive industry.

6
1.4 Purpose, Goals and
Delimitations
The purpose of the project has been to
increase the knowledge at Neonode
regarding Human Machine Interaction
in cars, mainly aimed at driver-vehicle
interaction with regulators in the driver
environment. This knowledge could be
used as a basis for future design
decisions in the new automotive
segment.
The goal has been to provide
suggestions of possible
implementations of theory through
suggesting design guidelines and
exemplifying these in a conceptual
demonstrator featuring Neonode
technology. The design has been
benchmarked and compared to
existing solutions for evaluation
purposes.
The following delimitations were
decided upon at the beginning of the
project.
The project will focus on the
driver-vehicle interaction with
physical regulators in the driver
environment. This means that
interaction with graphical user
interfaces, interaction with
regulators outside the car and
interaction in the engine
compartment, backseat and
trunk of the car will be
considered only when they are
deemed to have an impact on
the design of the physical
regulators. Halfway to the
project, it was decided to focus
on integration of controls in a
multifunctional steering wheel.
The functionality of a large
number of concepts solutions
will be described. Out of these,
a limited number of concepts
will be selected for further
refinement and visualization.
The level of detail of the final
concept solutions will be
specified to the extent that
manufacturing of a working
prototype and comparisons
against “on the market-solutions”
are possible.

7
1.5 Sustainability
The solutions that were developed in
this project related to social
sustainability by increased safety
through developing safer solutions for
in-vehicle interaction. Safety in driving
is an area that is important for social
sustainability. People should feel safe
while moving around in urban and
rural environments. Traffic safety, of
which the driver environment is a part,
is very important from this perspective.
The final solution will have the potential
to increase economic and ecological
sustainability by reducing the Bill of
Materials (BOM) compared to many
other solutions that aim to solve the
same problem, resulting in less material
use and lower costs.
The development of cars is a complex
and resource demanding process. In
recent years, automotive
manufacturers have been struggling
with high development and
manufacturing costs in combination
with dropping sales volumes. If the
complexity of the controls in the driver
environment can be reduced, this may
also contribute to a quicker and less
expensive product development
process for car interiors.

8
2. Methods and
Implementation
2.1 Planning
In the beginning of the project, a
planning report was created to define
the scope and background of the
project and a GANTT-chart (Appendix
A) was used for the initial time-
planning and to divide the time
between the Neonode offices in
Stockholm and Chalmers University of
Technology in Gothenburg. It was seen
as crucial to spend time on site in
Stockholm early in the project in order
to quickly gain a good understanding
of the technology while doing most of
the theoretical work at Chalmers with
good access to literature.
The project, that started in late
October and was scheduled to run for
20 weeks ending in March, was
divided into two phases. The character
of the first phase was mainly
exploratory; summarizing research and
coming up with a large number of
conceptual solutions that were
presented to Neonode. In the second
synthesis phase, the learning outcomes
from the first phase were summarized
in a design concept and evaluated
using empirical methods.
The project plan was designed with
two parallel tracks in the beginning
(Figure 2). to be able to use the
inspiration from the background
research in creating concepts with the
aim to provide a solution to the
uncovered problems The second
phase was aimed to finalize the
concepts to the extent that testing
was possible.
Figure 2: Visualisation of workflow during the project

9
2.2 Background
2.2.1 Literature Study
Literature studies are used to collect
background information for a project
and to describe the current state of
knowledge within a subject. This is
done by searching through different
sources for information that could be
vital for the project. The sources for a
literature study can be of many
different kinds; such as earlier
documentation, course literature,
scientific publications and reports.
(Bligård 2010, author’s translation)
The focus for the literature study in 3.1
“Theory on Driving” was to find recent
research publications and
proceedings from automotive
conferences. Also considered were
textbooks that summarize knowledge
in the area of interaction design and
human factors for the automotive
industry. The findings from the literature
were summarized with the aim to find
goals for the project and extract
guidelines to be used later in the
project for good design of regulators in
the driver environment.
Literature studies were used to
increase the knowledge about other
competing technologies in Neonode’s
main product segment of touch
interaction. The findings are presented
in chapter 3.3 “Competing
Technologies”. This was considered as
crucial to be able to pinpoint possible
advantages of Neonode’s technology
that could be emphasized in the
design or weaknesses that should be
minimized.
2.2.2 Interview Study
One of the most basic methods for
collecting user information is interviews.
Interviews can create an
understanding of how users think and
why they do the things they do.
Interviews can be carried out with
different degrees of structure. In
unstructured interviews a topic is freely
discussed with an interviewee, this is
preferably done when qualitative data
is required. (Bligård 2010, author’s
translation)
Unstructured interviews were in this
project not primarily used to interview
users (i.e. drivers), but rather to gain a
better understanding of how the
theory behind driving is applied in
practice through a visit at the Semcon
design department in Gothenburg
where an unstructured interview with
Mr. David Gillblom and Mr. Anders
Sundin was conducted. (see result in
“3.5 Driver HMI In The Industry”)
Unstructured interviews was also used
to gain a better understanding of the
Neonode infrared interaction
technology. This was done by
interviewing employees at the
Neonode offices in Stockholm (see
result in “3.2 Technical description”).

10
2.3 Early Concept Development
2.3.1 Function Listing
A function listing lists and describes the
different functions of systems. The
functions are then organized into
different subgroups, usually primary
tasks, secondary task and supporting
tasks related to the goals of the human
machine interaction system. The
function listing can later be
complemented with technical
principles. (Bligård 2010, author’s
translation)
A simple function listing was
completed out to define the design
space for the project. The function list
was used to generate design concepts
that could execute the described
functions. The function listing was used
as a basis for discussion on which
conceptual solutions and which
functionality that were suitable to be
included in the final concept.
A more elaborate function listing (see
chapter 5.1 GUI) was conducted to
break up the functions into sub-
functions that were to be included in
the representation for the usability test
into sub-functions. This also provided
the basis for the GUI development.
2.3.2 Gesture Sketching
The gesture sketching method was
created specifically for this project
because there was a lack of methods
to aid the idea generation and design
of interactions as well as a lack of
methods when the desired solution is of
a non-visual nature. Sketching a
driving environment and then trying to
describe the movement of hands and
other body parts on paper was found
to be much too time-consuming and
did not communicate in a good way
how well the interaction might work.
Therefore the method of gesture
sketching was created.
Gesture sketching requires a
representation of the interface that the
interaction will take place in and a
device that records video. Video is
then recorded while the designer(s)
uses the representation of the
interface to try out different physical
interactions. This documents the
different ideas in a highly realistic
manner. The video can later be edited
with textual descriptions or symbols
further clarifying the intent of the
interaction. The video can be used as
a basis of discussion during the design
process as it gives viewers an
indication of how the interaction
would feel and work in an actual
situation.
Gesture sketching was used in the
project as an idea generation tool. A
Volvo C30 from 2008 served as a
representation for the method. Self-
adhesive stickers were used to mark
out possible areas where sensors could
be added to the car. The designer (the
author) then sat in the car and was
recorded while trying out different
interactions during the course of a day.
The video recording was then edited
to simulate the systems response in
order to give an understanding of
which effects the interactions would
have. The video was later used as
presentation material at the
intermediate presentation and as a
basis of discussion on the future
development of the final concept.

11
2.3.3 Future Development and Filtering
After the intermediate presentation,
the scope of the remaining part of the
project was discussed and a decision
was made to come up with a concept
that included the most interesting
functionality and that was feasible to
achieve with the time remaining.
The discussion at the time of the
intermediate presentation was used to
evaluate which concepts were to be
included in the final solution. A large
number of concepts were reviewed,
but it was clear that some had larger
potential and others required little
effort to include in the final scope.

12
2.4 Final Concept Development
2.4.1 Sketching
Sketches can be used to visualize and
communicate designs. There are
different types of sketches such as
hand sketches, digital sketches and
marker-renderings.
Sketch models are a type of 3-
dimensional sketches that can not only
communicate the design and visual
appearance of an object, but also
evaluates size and physical
ergonomics. (Österlin, 2003, author’s
translation)
To integrate the suggested
functionality in a design concept,
sketches were made that featured all
the suggested functionality. Initially the
goal was to explore different possible
shapes of a conceptual steering wheel
without many restrictions, why a large
number of hand sketches were
generated; exploring different design
possibilities.
The most promising design tracks were
selected for further visualization using
digital sketches, and the most
promising sketch was turned into a
sketch model using KAPA-board and
tape. The sketch model was then used
to evaluate measurements for
satisfactory physical handling and
photos of the model were used as
underlay for the CAD. Additionally, the
model was used as a representation in
the Formative Evaluation (see 2.4.2
Usability Testing).
The Graphical User Interface (GUI) for
the representation was developed
through iterative sketching using
various sketching tools such as
Photoshop and Fireworks. PowerPoint
was used for the final layout and to
add dynamics to the GUI.
2.4.2 Usability testing
A usability test lets a selection of test
subject conduct a series of tasks with a
representation of the product that is to
be tested. The method is used to
evaluate the level of usability of a
product and its interface but can also
successfully be used to compare
different product designs among each
other to get a benchmark. (Jordan,
1998) The result of the usability test is
largely dependent on the environment
in which the test is conducted. The
more realistic the test set up is and the
closer to the use-situation the test
situation is, the more valid the result.
The parameters measured during a
usability test can be quantitative; such
as number of errors, time to execute a
task or number of clues required for the
test subject to solve the task at hand.
Just as important as quantitative
measurements are qualitative
measurements. Qualitative
measurements can for example be
specific problems encountered or
comments from the test subjects
regarding the interface.
During a usability test, the test subject is
presented with the task by means of
either written or oral instruction. Usually
a moderator is in charge of the testing
and presents the tasks to the test
subject. The moderators’ influence on
the test result is large, why it is
important that the moderator treats all
test subjects equally and that there is
always a note made if the test subject
requires extra explanation beyond the
instruction of the task.

13
The selection of test subjects is also
important for the outcome of the
usability test. Test subjects are for
instance likely to perform better if they
have a high level of domain
knowledge, i.e. are familiar with similar
types of systems than subjects that
have little experience in dealing with
such.
Formative evaluation
A type of usability test, the formative
evaluation is part of an iterative
process that aims to identify and
resolve usability problems with a
concept during the concept
development stage of the product
creation process (Jordan, 1998). A
representation of the product is used,
and much like in a regular usability test,
a group of test subjects is asked to
perform tasks with the mock-up
product in order to evaluate the
design. The main way in which a
formative evaluation is different from a
standard usability test is that the
representation of the product is
modified in between test-runs
whenever a problem is uncovered. This
is done in order to gradually improve
the performance of the product
interface while getting continuous
feedback on the effect of the
changes.
In this project, formative evaluations
were used in the concept
development phase in order to
discover and resolve usability problems
before evaluating the final concept.
A table-top representation of the
system was used for the formative
evaluation (see Figure 3). It consisted
of the sketch-model that had already
been made for the physical evaluation
mounted on a rotating stand. The
stand was made from wood and the
wheel of a trolley. As a Head-Down-
Display (HDD), a 13.3 inch LCD-screen
controlled by a laptop was used to
power a PowerPoint presentation
displaying the HDD-GUI. The Head-Up-
Display (HUD) GUI was shown using a
USB-compatible pico-projector that
could be controlled using a remote.
The GUIs are presented in their final
version in chapter 5.1.
The formative evaluation was done
using 10 test subjects aged between
Figure 3: Set up for the formative evaluation

14
21 and 64. The subjects performed six
consecutive tasks in one run, with a
total of two runs in order to measure
the learnability aspects of the system.
The tasks were the following:
1. Navigation:
Add new destination
2. Wipers:
Activate wipers at highest
speed
Shut of wipers
3. Lights:
Activate high beams
Deactivate high beams
4. Audio:
Play song from playlist
Decrease volume
5. Climate:
Set temperature to 22
6. Telephone:
Call Contact.
The execution of the tests were similar
to the benchmark test described in
chapter 6.2, but since the prototype
was changed in between test runs,
and the results only tracked individually
summaries of this test data is not
presented.

15
2.5 Validation
2.5.1 Kano Analysis
The Kano Analysis is based on the Kano
Model of customer satisfaction, named
after its inventor, Japanese professor Dr.
Noriaki Kano. It is a tool used to
evaluate the quality/customer
satisfaction that a function would add
to a product. The method uses a
questionnaire to ask potential users
about their estimated satisfaction level
of different functions. The data is then
analysed to define the functions in
three different categories; threshold,
performance and exciters. Threshold
functions must be implemented to
achieve an acceptable level of
satisfaction, implementation of
performance functions have a linear
effect on the satisfaction, while
implementation of exciter functions
only have a positive effect on the
customer satisfaction.(Brusse-Gendre,
2002)
As a validation of the attractiveness of
the concepts featured solutions and
functionality, the functions were
evaluated using a Kano analysis
questionnaire that was handed out to
15 persons aged between 21 and 64.
The result of the questionnaire was
compiled and the functions were
characterized according to which
functional category they belonged to.
This was done by dividing the number
of user that saw this function as
belonging to that category with the
total number of users. This value was
then used to illustrate the functions
position in the Kano Model chart. A
value close to 1 (eg. all the users agree
on the belonging of this function) put
the graph tangent to the line used in
the KANO model to illustrate this. A
value of less than 1 makes the line
deviate away from this position.
If the respondents were uncertain to
how the function affected their
satisfaction. These users were omitted
from the calculations, and an
uncertainty-factor was added
dependant on the number of users
that stated their uncertainty or
functions lack of effect on their
satisfaction level.
In this case, it was not crucial to get an
exact mathematical value of the
characteristic; hence, the calculations
were therefore simplified and plotted
by estimate.
2.5.2 Benchmark test
A usability benchmark test was carried
out in order to evaluate the
performance of the prototype
compared to a solution on the market
today.from a usability perspective. The
methodology of a usability test has
already been described in chapter
2.4.2. The execution of the tests will be
described in coherence with the results
in chapter 6.2. This order has been
decided because the test method was
based on the results of the concept
development. Hence, the validation of
the concept will be easier to follow
once the concept has been presented.

16
3. Background
3.1 Theory on Driving
3.1.1 Rationale
Designing interaction for the driver
environment is demanding because it
places high demands on the quality of
the design of both input (e.g. controls)
and output (e.g. displays) devices. The
reason for these high demands is that
driving itself is a complex cognitive
process that requires the driver's full
attention. The process should therefore
not be disturbed by adding cognitive
loads on the driver through interaction
with other devices than those used for
driving. There is however an increasing
demand for functionality in the driving
environment, which is why it is even
more important for safety reasons that
the increased functionality is well
designed from a human factors
perspective.
The automotive industry places high
demands on all controls and displays
that are implemented in cars. There is
a legitimate concern among safety
experts and organizations that new
technologies for interacting in a car
may overload the drivers’ information
processing and distract him/her from
the primary driving task (Bhise 2012).
Based on this, most major car
manufacturers have employed human
factors professionals dedicated to
developing, improving and testing
new solutions (Gillblom 2012). It is
consequently important for suppliers of
software and hardware to be in
agreement with the requirements
placed upon their products from these
perspectives.
3.1.2 Driver Information Processing
Driving is one of the most complex
processes that people learn during the
course of their lifetime. The
combination of actions triggered by
different inputs and the coordinated
motor skills required for driving is
something that takes a considerable
amount of time to learn for most.
Beginner drivers often find changing
gears more or less impossible. Novice
drivers are often so preoccupied by
the spastic positioning of the vehicle
that they do not properly scan the
environment for potential dangers, but
rather look at the road straight ahead
of them, something that may cause
accidents. (Underwood et al. 2007)
The car can be viewed as a complex
human machine interaction system
where the actions of the human
performed on the controls give input
signals to the functionality of the
vehicle that are being displayed using
visual, kinaesthetic and auditory
output. In accordance with Normans
model of human information
processing (Figure 4) the driver’s ability
to give the vehicle the correct input is
limited by the following factors: The
driver’s attention to the system
feedback, the driver ability to operate
the system, the driver’s knowledge
about the system, and whether the
driver’s mental model of the system
corresponds well to the actual design.
(Bohgard et al. 2008)
Once a driver has overcome the initial
learning phase and has adjusted to
his/her specific vehicle, there is some
cognitive capacity to spare for the
driver to handle other tasks while
manoeuvring the vehicle in a relatively

17
safe manner. This can include having a
conversation or operating audio
equipment, navigation systems or
climate control.
In order to drive safely, drivers need to
stay in their designated lane, maintain
an appropriate speed and spacing to
other cars, navigate bends and
corners by turning the steering wheel
and be able to avoid hazards by
braking. In order to do this, the driver
should direct his/her gaze mainly in the
direction of movement, which is most
often straight ahead, but the driver
also needs to divert his/her attention in
other directions for certain periods.
These diversions last from 0.5 to 1
second for rear view mirrors to several
seconds and multiple glances for other
in-car equipment such as radios and
climate controls. These visual and
motor interaction tasks may compete
with the demands of driving.
(Underwood et. al 2007)
3.1.3 Multimodality in Driving
The most important sensory organ for a
driver is vision. For the driver to safely
interact with the surrounding
environment, he or she needs to have
a clear view of it. The many aids
installed in cars, such as mirrors,
parking assistance and driver
assistance systems are testament to
this need.
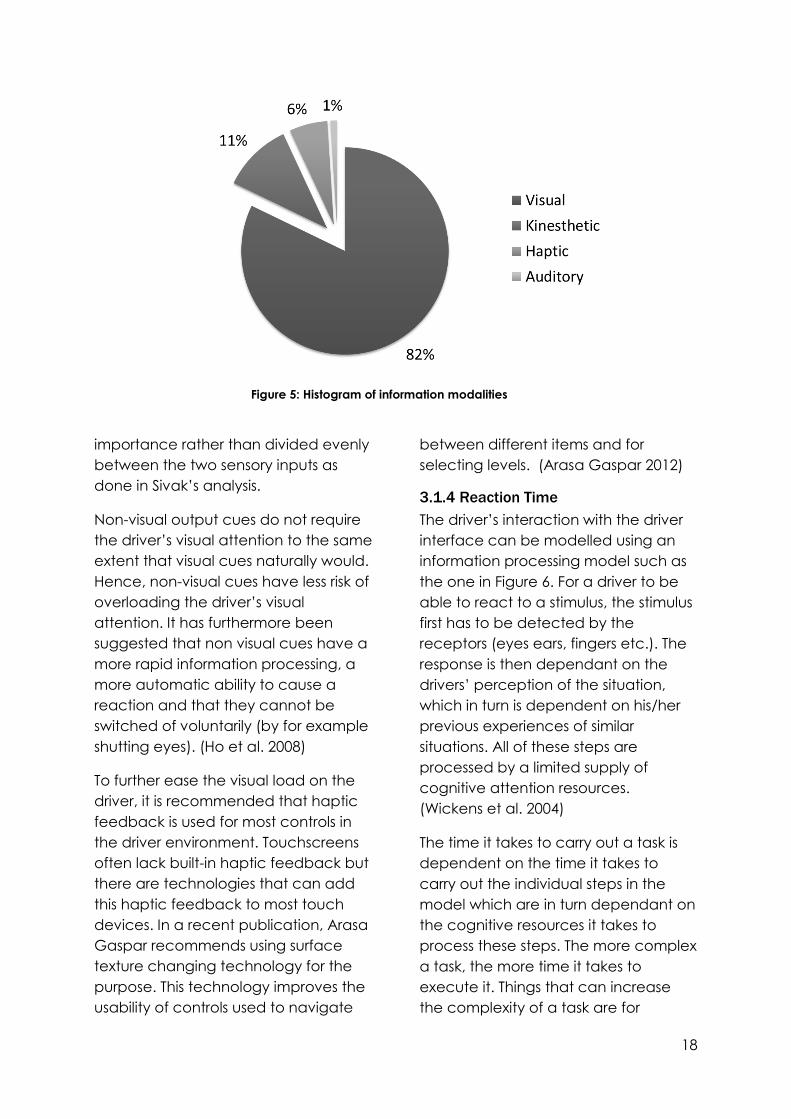
In 1996, Sivak mapped 89 of the most
important of the behaviours to the
sensory input that was required to
execute the behaviour. The result of
the mapping was that vision is by far
the most important sense with 83% of
all behaviours dependant on it, 11% of
all behaviours are dependent on
kinaesthetic input, 6% are dependent
on tactile input and 1% is dependent
on auditory input (see Figure 5). 33% of
the behaviours are dependent on
more than one sensory modality (Sivak
1996). It has however frequently been
argued that more than 90% of the
input for driving is visual. This could also
be supported by Sivak's findings if for
example the visual input vs. the
kinaesthetic input was weighed during
the course of an action, according to
Figure 4: Model of human information processing based on Norman (Norman 1986)
18
importance rather than divided evenly
between the two sensory inputs as
done in Sivak’s analysis.
Non-visual output cues do not require
the driver’s visual attention to the same
extent that visual cues naturally would.
Hence, non-visual cues have less risk of
overloading the driver’s visual
attention. It has furthermore been
suggested that non visual cues have a
more rapid information processing, a
more automatic ability to cause a
reaction and that they cannot be
switched of voluntarily (by for example
shutting eyes). (Ho et al. 2008)
To further ease the visual load on the
driver, it is recommended that haptic
feedback is used for most controls in
the driver environment. Touchscreens
often lack built-in haptic feedback but
there are technologies that can add
this haptic feedback to most touch
devices. In a recent publication, Arasa
Gaspar recommends using surface
texture changing technology for the
purpose. This technology improves the
usability of controls used to navigate
between different items and for
selecting levels. (Arasa Gaspar 2012)
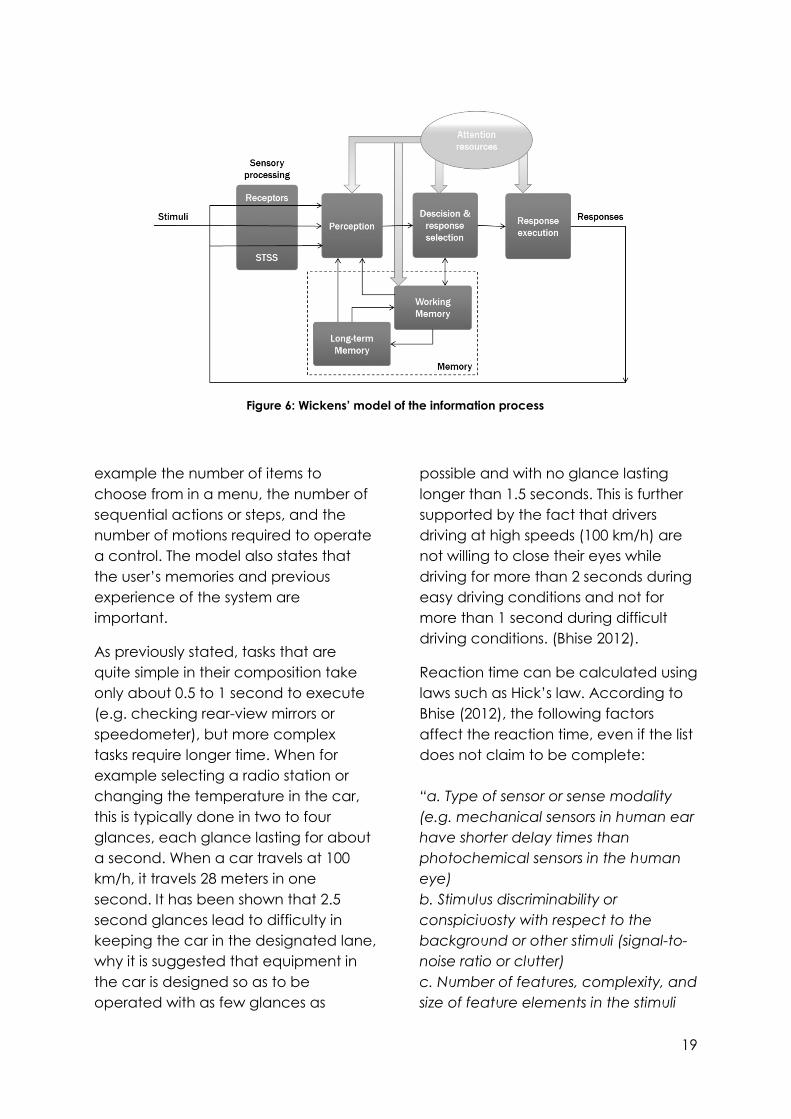
3.1.4 Reaction Time
The driver’s interaction with the driver
interface can be modelled using an
information processing model such as
the one in Figure 6. For a driver to be
able to react to a stimulus, the stimulus
first has to be detected by the
receptors (eyes ears, fingers etc.). The
response is then dependant on the
drivers’ perception of the situation,
which in turn is dependent on his/her
previous experiences of similar
situations. All of these steps are
processed by a limited supply of
cognitive attention resources.
(Wickens et al. 2004)
The time it takes to carry out a task is
dependent on the time it takes to
carry out the individual steps in the
model which are in turn dependant on
the cognitive resources it takes to
process these steps. The more complex
a task, the more time it takes to
execute it. Things that can increase
the complexity of a task are for
Figure 5: Histogram of information modalities
19
example the number of items to
choose from in a menu, the number of
sequential actions or steps, and the
number of motions required to operate
a control. The model also states that
the user’s memories and previous
experience of the system are
important.
As previously stated, tasks that are
quite simple in their composition take
only about 0.5 to 1 second to execute
(e.g. checking rear-view mirrors or
speedometer), but more complex
tasks require longer time. When for
example selecting a radio station or
changing the temperature in the car,
this is typically done in two to four
glances, each glance lasting for about
a second. When a car travels at 100
km/h, it travels 28 meters in one
second. It has been shown that 2.5
second glances lead to difficulty in
keeping the car in the designated lane,
why it is suggested that equipment in
the car is designed so as to be
operated with as few glances as
possible and with no glance lasting
longer than 1.5 seconds. This is further
supported by the fact that drivers
driving at high speeds (100 km/h) are
not willing to close their eyes while
driving for more than 2 seconds during
easy driving conditions and not for
more than 1 second during difficult
driving conditions. (Bhise 2012).
Reaction time can be calculated using
laws such as Hick’s law. According to
Bhise (2012), the following factors
affect the reaction time, even if the list
does not claim to be complete:
“a. Type of sensor or sense modality
(e.g. mechanical sensors in human ear
have shorter delay times than
photochemical sensors in the human
eye)
b. Stimulus discriminability or
conspiciuosty with respect to the
background or other stimuli (signal-to-
noise ratio or clutter)
c. Number of features, complexity, and
size of feature elements in the stimuli
Figure 6: Wickens’ model of the information process

20
d. Amount of search the human
operator conducts (e.g. size of search
set)
e. Amount of information processed
(uncertainty and number of choices
and their occurrence probability)
f. Amount of memory search
g. Stimulus–response compatibility (e.g.,
how similar is the mapping or
association of the stimuli to the
responses)
h. Alertness of the subject
i. Motivation of the subject
j. Expectancy (how expected, or
known from past experience is the
event, in terms of when and where it
could occur)
k. Mental workload (other tasks that
the subject is time sharing at that time)
l. Psychological stress (e.g. emotional
state of the subject)
m. Physiological stress (e.g. tired,
fatigued, or in an environment
affecting bodily functions)
n. Practice (how familiar or skilled is the
subject to the situation)
o. Subject’s age (older subjects are
usually slower and more variable)”
(Bhise 2012, chapter 6, p. 60-61)
When a reaction has been determined,
there is an additional time taken to
make the physical movement required
by the decided action. According to
Fitt's law of movement (Fitts 1954, Fitts
et. al 1967) this time can be reduced
by (i) reducing the movement
distance and (ii) by increasing the size
(width) of the target control, thus
reducing the need for accuracy.
3.1.5 Layouts
A large body of laboratory research
has shown that driving performance
deteriorates when drivers have to
divide their attention spatially. This
means to focus all their auditory or
visual attention in multiple directions as
opposed to one. It has been shown
that handling multiple tasks at the
same time while driving leads to a
more dangerous driving behaviour (Ho
et. al. 2008). The implication of this is
that driver attention should not be
averted from the main task of driving,
that is mainly visual and directed
towards the environment surrounding
the vehicle.
The driver environment for personal
vehicles is heavily standardized, and as
a result, the layout of the main
functionality of the car is very similar
between models and brands. Tönnis
(2006) divides the tasks of driving into
three different categories: Primary,
Secondary and Tertiary tasks. These
tasks are then plotted into a driver
environment according to the spatial
location of the function that supports
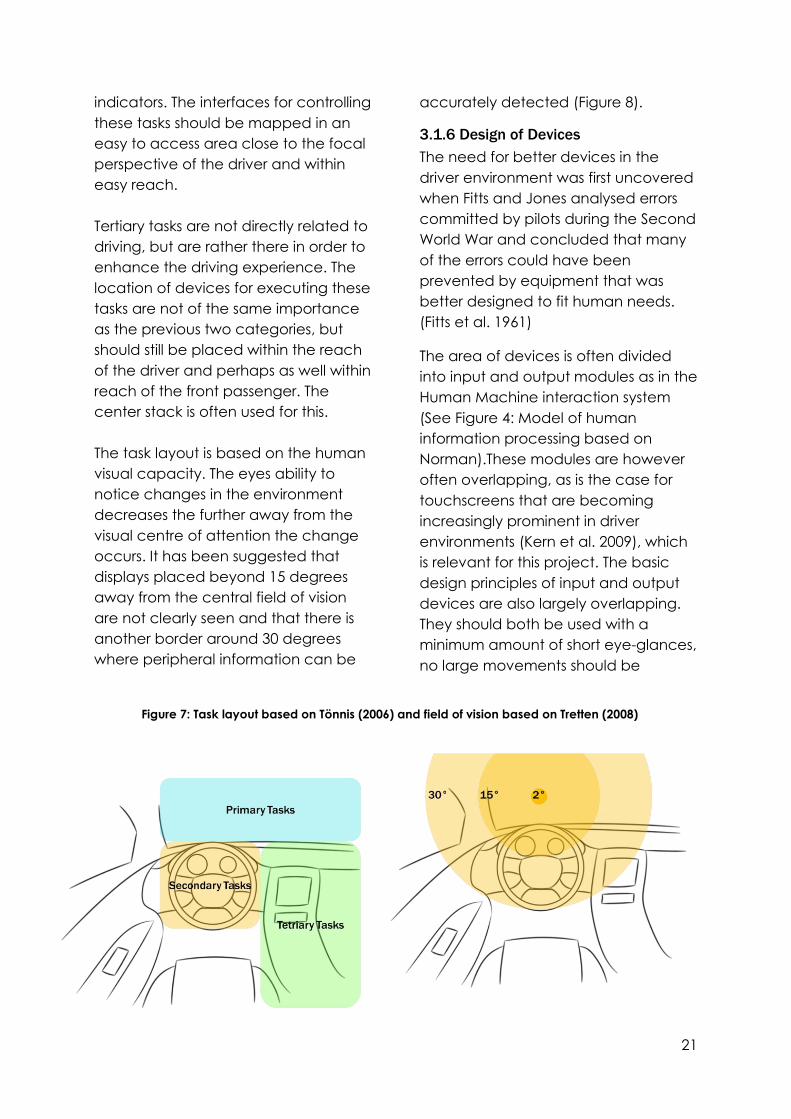
the desired task (Figure 7)
Primary tasks are directly related to
manoeuvring the vehicle in the
surrounding environment. These tasks
are today controlled mainly by
devices such as the steering wheel
and the pedals (and in case of the
manual transmission, the gear stick).
The suggestion is that information
regarding these tasks is positioned in a
place that is easy for the driver to
perceive, since the information is
Important for the driving process.
Secondary tasks are tasks closely
related to the driving capacity and
safety of the driver such as using
windscreen wipers and turning
21
indicators. The interfaces for controlling
these tasks should be mapped in an
easy to access area close to the focal
perspective of the driver and within
easy reach.
Tertiary tasks are not directly related to
driving, but are rather there in order to
enhance the driving experience. The
location of devices for executing these
tasks are not of the same importance
as the previous two categories, but
should still be placed within the reach
of the driver and perhaps as well within
reach of the front passenger. The
center stack is often used for this.
The task layout is based on the human
visual capacity. The eyes ability to
notice changes in the environment
decreases the further away from the
visual centre of attention the change
occurs. It has been suggested that
displays placed beyond 15 degrees
away from the central field of vision
are not clearly seen and that there is
another border around 30 degrees
where peripheral information can be
accurately detected (Figure 8).
3.1.6 Design of Devices
The need for better devices in the
driver environment was first uncovered
when Fitts and Jones analysed errors
committed by pilots during the Second
World War and concluded that many
of the errors could have been
prevented by equipment that was
better designed to fit human needs.
(Fitts et al. 1961)
The area of devices is often divided
into input and output modules as in the
Human Machine interaction system
(See Figure 4: Model of human
information processing based on
Norman).These modules are however
often overlapping, as is the case for
touchscreens that are becoming
increasingly prominent in driver
environments (Kern et al. 2009), which
is relevant for this project. The basic
design principles of input and output
devices are also largely overlapping.
They should both be used with a
minimum amount of short eye-glances,
no large movements should be
Figure 7: Task layout based on Tönnis (2006) and field of vision based on Tretten (2008)

22
necessary and physical as well as
cognitive loads should be minimized
during the use of both types of devices.
(Bhise 2012).
3.1.7 Different Types of Devices
There are many different types of
devices that the driver can interact
with in a car. Here follows a selection
of those that often are used in cars
and/or are relevant for this project. The
items in this list may be used instead of
the word device in the following
section 3.1.8 Design Guidelines for
Devices.
1. Displays: There are many different
types of displays; basically anything
that transmits information to a user
is a display. It can be a symbol, a
light on a button, a gauge or a
large screen displaying a huge
variety of different information. It
could be possible to classify the
screen as a compound of different
displays and refer to the individual
elements as display units.
2. Buttons: Buttons refer to regular
buttons that are activated by a
pushing motion. They can be
present in virtual or physical form
and sometime incorporate a visual,
tactile or auditory display to
indicate status. Buttons are often
discrete, meaning that they only
have a set amount of modes, often
on and off.
3. Stick switches: Stick switches are
protruding levers that have two or
more settings. They can have either
discrete or continuous input as in
the case of joysticks, but are often
simpler as the controls used to
open and close windows. They give
a visual and haptic feedback to
the mode that they are set to, but
this can require strengthening in
order not to be a source of errors.
4. Rotary switches: Rotary switches are
often used to increase or decrease
flow, but can also be used when
selecting alternatives in a menu.
Generally clockwise means
increased flow or forward and
counter clockwise means
decreased flow or backwards.
5. Multifunction switches:
Multifunction switches are often
used in today’s cars in order to
reduce the number of input
devices. One-to-one mapping is
not always possible as for example
a BMW in 2009 contained more
than 700 functions (Kern et al. 2009).
The multifunction switches are often
a combination of the previous
switches like in the case of the
steering wheel stalk. It can be
flipped to different settings like a
stick switch, rotated as a rotary
switch and usually has buttons that
can be pressed.
6. Touchscreens: Screens and
touchscreens are increasingly used
in today's vehicles. They can
reduce the need for motor-
movement needed to manipulate
controls and can contain a
multitude of different displays and
controls. Most touch displays
require, however, visual attention
due to their lack of haptic
feedback. They may in addition not
be suitable for use with e.g. gloves
or long finger-nails and may also be
more susceptible to dirt, wear and
reflections. (Bhise 2012).
7. Gesture recognition: A more recent
interaction device that (to the
author’s knowledge) has not yet

23
entered production in cars is
gesture interaction. It uses optical,
audial or electric sensors to track 3-
dimensional gestures performed by
for example a hand or any stylus.
Gesture recognition has the
possibility to reduce the visual
demand of the driver through
controlling an interface using a less
exact spatial orientation than is
allowed by most traditional
interfaces. (Döring et al. 2011)
3.1.8 Design Guidelines for Devices
There are some general guidelines for
devices used in a Human Machine
Interface that can be applied also to
the displays and controls in the driver
environment. Driving has some specific
requirements that are discussed in
previous sections. These guidelines all
strive to minimize the cognitive and
physical load of the driver.
A selection of suggested guidelines are
presented below.
1. All devices should be operable with
as few glances as possible and
should contribute as little as
possible to visual overload of the
driver. If possible the devices should
be operable without the need of
visual information. (Bhise 2012).
2. The system should provide easy to
understand feedback on what
happens when an input is received.
At all times it should be easy to
inspect the status of the HMI system
as well as find the way out of the
action flow. (Bohgard et al. 2008)
3. The devices that are most
important for the use of the vehicle
and those that are used most often
should be placed close and within
easy reach of the driver.(Bohgard
et al. 2008)
4. Driver information that is urgent for
the circumstance should be
placed as close to the traffic scene
as possible. (Tretten 2008)
5. All interaction should try to emulate
reality so that the user more easily
can understand the system. For
example, if a manipulation of an
input device occurs in a downward
direction, this should also be
replicated in the system by a similar
downward reaction. (Bohgard et al.
2008)
6. The order of information and
actions should be structured
spatially in a logical way according
to the order that they are used. This
sequence should be reoccurring
throughout the whole system.
(Bohgard et al. 2008)
7. The devices in a system should
function in a similar way that they
do in other systems that the user
might have experience from. (Bhise
2012). This is sometimes referred to
as external consistency. There are
many different standards for this
such as ISO or SAE standards that
include for example different
symbols for an array of different
functions in vehicles.
8. Controls and displays should be
grouped after functionality
(Bohgard et al. 2008).
9. Similarity between objects that do
not have the same function should
be avoided (Bohgard et al. 2008).
10. One should use multimodality in
senses and multiple sources of
information to make the user react
more quickly to important events
(Bohgard et al. 2008). This is
especially important in warning

24
systems, where is has been shown
that users react more quickly using
a combination of different sensory
modalities. (Ho et al 2008).
11. All controls should require a
minimum amount of movement to
operate (Bhise 2012).
12. The physical properties of the
controls should be such that they
do not require any strain and a
minimum amount of precision to
operate. They should feel
comfortable to use. (Bhise 2012).
3.1.9 Conclusions and Design
Implications
The design guidelines used in the
driving environment differ from general
design guidelines in HMI interaction
mainly because of the heavy impact
that the visual information processing
has on the driving task. This has two
major implications. One is that driving is
more dependent than many other
tasks on multimodal feedback. The
other is that the relation between the
items 3 and 4 in the design guidelines
has a slight discrepancy. It concerns
the position of the controls and the
displays. One of the guidelines rates
the importance and frequency of use
of the devices in order to figure out the
spatial positioning of displays and
controls, while the other bases this
importance on which information is
needed for the circumstance. Neither
of the statements is wrong, but
traditional approach, exposes the
driver to a high risk when executing a
task considered less important by not
having these less important controls
and displays conveniently located.
During these circumstances, the
controls should be temporarily moved
to a more convenient location,
reducing the risk exposure. This is
entirely possible with today’s
technology. This is also supported by
NHTSA Guidelines stating that active
displays should be placed as close to
the line of sight as practical (Strickland
2012). Figure 8 shows the drivers field of
vision over the controls.
Figure 8: Overlay of field of vision on layout of controls

25
3.2 Technical Description
To gain a better understanding of the
Neonode technology before the
concept development phase, a
technical description was generated
through unstructured interviews at the
Neonode offices in Stockholm, Sweden.
(Mårtensson 2012):
The technology is used in many
different devices such as smart phones,
tablets, e-Readers, toys, printers and
for automotive touchscreens.
3.2.1 Optics
The Neonode patented zForce
technology is based on infrared light
and originally derived from the
Neonode smartphone. Light Emitting
Diodes (LEDs) are placed on a circuit
board that emits infrared lights through
a patent-protected plastic frame
called light guide that filters and
directs the light. This light is then
projected in a grid-like pattern across
a surface (Figure 9) and detected by
several Photo Detectors (PDs) on the
opposite side of that same surface.
When an object such as a finger
shades the PDs from the light emitted
by the LEDs, the PDs detect this and
provide coordinates that can be used
to decipher the touch point to an
external interface. Today, the
technology can handle two touch-
points of down to 1 mm in size, but
current research will soon increase this
number to five or more. High
resolutions are possible, which allows
the display to track handwriting with
even a gloved finger or a stylus.
3.2.2 Mechanics
The light guide is wrapped around the
screen and projects the light above it.
This requires the height of the edge to
be at least 0.5 mm (preferably higher
for better performance) in order to
project the grid properly. Therefore,
the light guide cannot be in level with
screen, but has to be slightly above
Figure 9: Explanation of the infrared grid (image couertsy of Neonode)

26
the screen, creating a frame (much
like in a painting). The light guide can
guide the light in different directions
due to its total inner reflection property,
but is due to this phenomenon sensitive
in the reflecting areas. (See Figure 10
for cross section of system)
The touch surface, which can be
made up from of any material, can be
flat or slightly concave, but not convex
due to the fact that light cannot bend
around it.
The light guides are usually
manufactured in polycarbonate (PC)
by means of injection moulding. They
can also be manufactured in PMMA
(commonly known as Plexiglas), Due to
the better construction properties of
PMMA, it is often used for prototyping.
3.2.3 Hardware
The control hardware such as LED
drivers, amplifiers, multiplexers, voltage
regulators and filters are all integrated
in a chip that Neonode recently has
developed in close cooperation with
Texas Instruments. The merge of this
functionality into one chip allows for a
lower cost of the bill of materials and a
smaller printed circuit board footprint.
It additionally allows for a shorter time
to market as the standardized Serial
Peripheral Interface (SPI) making the
integration of the technology in
different products much simpler.
Scanning speeds of up to 1000 Hz are
possible, resulting in response times of
down to 1 millisecond. The technology
also has five to six times lower power
consumption compared to some
competing technologies. This new
hardware makes it possible to save
touch point history, something that
gives shorter response-times and adds
a possibility to track more advanced
gestures.
3.2.4 Automotive Application
Challenges
Some of the technical challenges
regarding the automotive applications
of Neonode technology are the longer
product life that the consumers expect
from their vehicles compared to most
consumer electronics products in
which the technology is usually
Figure 10: Component description

27
featured. Furthermore, the automotive
industry requires a much higher
durability with regards to external
temperatures. This could be an issue
due to the thermal expansion of the
plastic that the light guide is comprised
from. The light guide has been
developed to operate in conditions
ranging from -40°C to +85°C but this
has to be validated further. In addition,
the grid is sensitive to water-droplets
that may break the light, but has
software algorithms that can
compensate for dust or other particles
on the touch surface as well as
variations in component quality.
3.2.5 Future Development
The Neonode technology can not only
be utilized to recognize touch over a
surface. Infrared technology is also
widely used for proximity detection. In
the case of proximity, the LEDs are
aimed outwards from the surface, and
any object in the vicinity of the surface
will reflect some of this light, which can
then be detected by PDs. This is similar
to the technology that exists today in
many automatic faucets in public
restrooms. It is possible to detect not
only position, but motion towards and
away from the LED and PD pair.
If the light guides are layered, it will not
only be possible to detect position in a
3rd dimension but full 3D rotation too.
Neonode calls this application
“Stargate”. The advances in hardware
signal processing make it possible to
save history for the motions.
Furthermore, the technology has
potential to add multi touch and
proximity to curved surfaces as well as
recognize 3-dimensional gestures. This
means that you can create a touch
and 3D gesture tracking surface with
any shape and many different surface
textures as long as the surface is
transparent or semi-transparent. The
light guides can be tinted in a variety
of different colours, but the most
commonly used (so far) is black.

28
3.3 Competing Technologies
There are several technologies for
achieving touch integration on screens
and other surfaces. Many of these
compete directly with the infrared-grid
based technology that Neonode
utilizes. An overview of some of the
more common competing
technologies follows.
3.3.1 Capacitive Touchscreens
A very commonly used technology for
achieving touch interaction is
capacitive touch technology. This
technology is based on a (weak)
electric current, so that when a
conductor touches the interaction
surface, the change in the electrical
field can be measured and the point
of contact calculated. There are
different types of capacitive touch,
which are used in different
applications depending on the
accuracy required. Capacitive
technology can support multi-touch
and is widely used in applications such
as smartphones, track pads, and
tablets. Most capacitive touchscreens
however depend on the prerequisite
that the finger or stylus touching it is a
conductor. (Cirque corporation, 2011)
3.3.1 Resistive Touchscreens
Resistive touchscreens require two,
otherwise insulated, conductors to be
squeezed together in one point,
forming a current which can be used
to deduce the point of touch. Resistive
touch technology is insensitive to the
electrical conductivity of the stylus, but
has in later years been eclipsed by the
capacitive technology. (Cirque
corporation, 2011)
3.3.2 Frustrated Total Inner Reflection
Frustrated total inner reflection uses the
property of total inner reflection in
acrylic materials by projecting infrared
light into them. The acrylic material
then becomes the touch-surface that,
when touched, calculates the position
of the touch point by detecting the
disturbance that occurs in the light-
field when the total inner reflection is
interrupted by another material
coming in contact with the acrylic. The
change is detected by an infrared
camera. The limitations of this
technology is that an acrylic needs to
be used as the touch surface and that
it is sensitive to dirt, grease and liquid
that may disrupt the infrared light. The
technology however supports multi-
touch. (Blindmann, 2011)
3.3.3 Optical Imaging
Optical imaging usually uses infrared
projected over a rectangular surface.
The change in the light is then
detected by detectors in the corners
of the surface that triangulates the
position of the point of touch. Optical
imaging can be scaled with little cost
to fit larger screens, but is more
sensitive to dirt and other particles
than the intended stylus that may
break the light. In the configuration
with four detectors, it supports dual
touch. (Blindmann, 2011)
3.3.4 Acoustic Pulse Recognition
Acoustic pulse recognition utilizes the
fact that the contact with and
movement on a glass surface create
sound waves in the glass. The sound is
detected and the position is
calculated in a way that is similar to
that of dispersive signal
technology. The technology cannot,

29
however, calculate positions for multi-
touch. (Blindmann, 2011)
3.3.5 Force Based Touch
Force based touch uses sensors on a
screen that calculate the point of
touch based on the proportion of the
force that is divided over the sensors.
The technology is very insensitive to dirt
and other particles, but at the same
time uses mechanical components
that may be subject to wear. It can
detect pressure, but is only single
touch capable. (Blindmann, 2011)
3.3.6 Incentives for Neonode Technology
Incentives for using Neonode
technology are among others
(Mårtensson 2012):
The low price - The zForce is
marketed as an affordable
technology. In quantities over one
million units, a price of 1 USD per
screen-inch is feasible.
The low energy consumption -
zForce outperforms capacitive
displays and many other solutions
when it comes to energy
consumption. At 100 Hz one unit is
at 1 mW.
High speed and precision -
Scanning speeds of up to 1000 Hz
are possible.
Short turnaround time and low
technical risks - the Neonode
solutions are not mechanically
complicated and are based on
well tested infrared technology.
These incentives suggest that
Neonode’s technology is competitive
mainly when it comes to price, but also
in performance and from the
standpoint of ecological sustainablilty.

30
3.4 Trends in Driver HMI
Semcon has a strong connection to
the Volvo CC and Volvo AB. The
design department does a lot of work
and research in the field of Driver HMI.
Much of the work has traditionally
been focused on minimizing or
eliminating the number of glances
or ”eyes off road time” that the driver
uses to operate instruments in the
driver environment.
Recently, the introduction of Head-Up-
Displays has meant that it is possible to
create HMI designs which allow the
driver to operate instruments while
keeping his or her eyes on the road.
This means that some often used
testing methods, such as occlusion
goggles, may be obsolete and new
testing methods may have to be
developed if the HMI system
incorporates a Head-Up-Display.
There has also been a lot of interest for
tracking driver intention. By monitoring
the behaviour of the driver and the
surrounding environment, it is often
possible to predict the actions of the
driver and adapt the instrumentation
to better suit the contextual needs of
the driver. A technology that is
interesting for this is motion tracking
technology such as LEAP, or Kinect
technology or potentially infrared
proximity. Motion tracking technology
has the potential to support a gestural
interaction system that may reduce
the need of visual orientation in the
driver environment.
Additionally, different types of haptic
feedback in the driver environment
have been an area of interest for the
automotive industry for many years,
and many different solutions have
been tested. A field that Semcon is
currently doing research in is the use of
haptic feedback in touchscreens,
which suggests that this area is of
interest to car manufacturers. (Gillblom
2012)

31
3.5 Function Listing
The functions that can be accessed in
most modern cars can be divided into
the groups; primary tasks, secondary
tasks, tertiary task and exterior tasks.
This division is based on the task layout
of Tönnis et al. (2008) previously
referred to in the theory section. (See
Figure 11)
The primary tasks are directly related to
driving, and any removal of such a
task would reduce the capacity that
the driver has to control the cars
movement with. The primary task list is
relatively complete, even if there are
possible additions such as the
adaptive cruise control or automated
parking in newer cars.
The secondary tasks aid the driver in
the driving process and contribute to
the safety of the driver, the passengers,
secondary users and the surrounding
environment.
Tertiary task are not directly related to
the process of driving, but may still be
desired for comfort, safety or
entertainment reasons.
3.5.1 Filtering for Concept Development
Before developing concepts on how
to control the different functions using
Neonode technology, the list was
reviewed and some of the less
promising functions were eliminated
(see Figure 12).
Steering and accelerating were
deemed to be so heavily standardized
that any modifications could
overthrow the realism of the concept.
Seatbelts are very mechanical
solutions that much like the signal horn
is very standardized. Parking assistance
already uses proximity sensors why
such an implementation would be on
a different level than this project
handles. The seats could very well be
controlled by sensors, but were
eliminated due to the difficulty of
Figure 11: Initial function list

32
grouping such a function with other
functionality.
“Car settings” is not a specific task, but
rather a collection of different tertiary
functions that concepts should be
developed induvidually for. This group
of functions was eliminated because it
seemed to extensive to do a proper
job of defining and developing
concepts for each function, but with
only insignificant increases to the
marginal utility.
Initially, the exterior task were not to be
considered at all, but during the
gesture sketching, some interesting
concepts were discovered, why they
have been included in the report.
Figure 12: Selection for early concept development

33
4 Early Concept
Development
4.1 Early Sketches
A number of idea concepts were
generated through Gesture sketching
and video was recorded. The
concepts below are grouped
according to the group of functions to
which they belong (see Figure 12 in
3.5). The concepts are based on the
theory and the design guidelines when
possible.
4.1.1 Primary Task Concepts
Cruise control
Figure 13: Screenshot from gesture sketching
The cruise control is activated by
sweeping upwards with the right foot
that usually controls the accelerator.
The motion is tracked by proximity
sensors on the pedal or on the panel
next to the pedal. This coheres with the
guidelines that devices are grouped
after functionality. It is also a control
that does not require visual input to be
operated.
Anticipate break
Something already used in the
automotive industry is panic break
functionality. This means that a car
starts to break even before the brake
pedal is pressed. The Neonode
technology could track the movement
of the right foot using proximity and
control the speed of the car
accordingly. This functionality is
executed without adding any strain to
the driver and is a way of tracking
driver intention.
Gear shifting
Figure 14: Screenshot from gesture sketching
When shifting gears, it could be useful
to have a gear shifting indicator handy.
This could be achieved by installing
proximity sensors in the gearstick and
when the stick is grasped, a gear-
shifting indicator appears in a Head-
Up-Display. This relates to guidelines
#1-4 and #10. It should be noted that
the driver grasps the gearstick in
different ways depending on which
gear he/she is about to shift to. This
intention could be tracked and utilized
in different applications.
Parking break
The parking break could be integrated
into a touch surface with other
functionalities and controlled by a
gesture in order to reduce the number
of controls in the driver environment.
This could cut costs and leave room for
other functionality.
4.1.2 Secondary Task Concepts
Blinkers

34
The blinkers are controlled by stalks on
the steering wheel in most cars today.
These stalks could be replaced by
proximity sensors. The sensors could be
swept up and down to give turn signals
left and right, pressed and swept back
and forth for other functionality related
to the lights. These motions follow the
guideline #7 that the functionality
should be similar to other familiar
systems.
Windscreen wipers
Figure 15: Screenshot from gesture sketching
Figure 16: Screenshot from gesture sketching
Windscreen wipers can be controlled
by proximity sensors similar to the
blinkers and activated by a push. The
speed can then be controlled by a
proximity slider on the steering wheel.
For a single wipe, the wipers could be
activated by a swiping motion in front
of the windshield, tracked by proximity
sensors on top of the steering wheel.
This is in coherence with guideline #7.
Rearview mirrors
Controlling the rear-view mirrors could
be done automatically by tracking the
position of the driver’s head with
proximity sensors and adjusting the rear
view mirrors accordingly. The angles of
the rear view mirrors could also be
controlled using a “Stargate” type
application that can track angles in
two dimensions.
Navigation
Figure 17: Screenshot from gesture sketching
Input of, for example GPS navigation
destinations could be done by textual
input at the steering wheel, using the
finger as a stylus. GPS navigation is
now integrated in cars and textual
input is an element that is interesting in
many applications. This design
application is in accordance with
guideline #1.
4.1.3 Tertiary Task Concepts
Audio system volume
Figure 18: Screenshot from gesture sketching

35
The volume of the audio system could
be controlled using a slider located by
the audio module. This is in
accordance with the guideline for
grouping controls according to
functionality.
Climate flow control
The flow from the fans could be
controlled by a slider above the
outflow of the fans. This in in
accordance with the guideline for
grouping according to functionality
but also provides multimodal
feedback in the form of feeling the
airflow on your palm.
Windows
The windows and the trunk could
either be controlled using sliders on a
mediating representation of the car
interior, for example a square hole, or
directly by touching the windows. The
first has mainly functional and
economic advantages compared to
an electromechanical solution. The
latter has distinct cognitive
advantages through being in line with
for example guideline #8 and #12.
Phone (thumb app)
Figure 19: Screenshot from gesture sketching
Many of today’s cars have easy-to-
access buttons on the steering wheel
that make it easier for the driver to
handle e.g. phone calls while driving.
These buttons could be replaced with
small touch screens with the phone
functionality only active upon
indication or when someone is calling
in. These screens can be synchronized
with the Head-Up-Display. This
application is supported by guidelines
#1, #2 and #4.
4.1.4 Exterior Tasks
Doors
Doors could be opened automatically
by an outward gesture at the back
edge of the door, close to the position
of the door handle. The door would
then open until it detects an obstacle
in its vicinity, avoiding collision with for
example a car parked next to it. This
could be solved using proximity
detection and is in line with the #5, #7,
#8, #11 and #12 design guidelines for
good controls.
Fuel cap
The fuel cap could open automatically
after having tracked a specified
gesture, such as a password-symbol
(such as the one used to unlock some
smartphones), using proximity sensors.
This would allow for touch free
interaction with potentially dirty
surfaces. It is also in line with the
physical strain guideline #12
Trunk
Opening the trunk could be done
using a sweeping gesture with the leg
in case hands are occupied carrying
luggage. This could be tracked with
proximity sensors for touch-free
interaction.

36
4.2 Promising Areas
Based on the concepts, the initial study
and a presentation of the generated
concepts, four areas were identified as
interesting for further development.
4.2.1 Thumb Interaction
The concept for answering the phone
with a use of the Head-Up-Display and
the right thumb seems promising from
the standpoint of human factors and
circumstance dependant interfaces.
The interface could be developed
further to cover a wide range of
functionalities and has the possibility to
be operated even when the steering-
wheel is turned. Furthermore, Neonode
has a history of creating innovative
solutions for thumb-interaction on small
screens which makes concepts in this
area trustworthy. These concepts have
possible applications in for example
the cruise control, audio, climate, lights
and phone handling tasks.
4.2.2 Haptic Feedback
One of the main reasons that touch
interaction has not yet been widely
introduced in cars is that it normally
lacks the haptic feedback that is
important for non-visual operation. If a
technology is aiming to become
dominant in the industry, it is important
that it is compatible with solutions for
haptic feedback. In a recent master
thesis at Industrial Design Engineering
(Gaspar 2011), the “surface texture
changing”- technology provided by
the Finnish company Senseg was
identified as the most promising
technology from a human factors
standpoint. It would be interesting to
see if this type of technology could be
integrated in a future concept. It could
be implemented into the same
functions as the thumb interaction
concept or in any other touchscreen.
4.2.3 Touch on Panels
Looking at the design of many car
interiors, curved panels make up a
large quantity of the accessible
surfaces in the driver environment.
Here, Neonode technology in its basic
setup faces a challenge, and it would
be interesting to experiment with
different setups to enable touch on
convex surfaces with the Neonode
Technology. From the Technology
study, two viable options were
obtained.
The first option uses two proximity lists
set up opposite to one and other,
spanning a curved surface. The Y-
coordinate is then derived from the
shadowing of the PDs, while the X-
coordinate is calculated using the
difference in reflection between the
two lists. This solution can also integrate
coloured diodes to give the lists a
visual indication of when the touch is
activated that can be perceived by
the peripheral vision.
The second setup is the 3D surface
touch that could be obtained by
placing proximity detectors (LED and
PDs) under a semi-transparent surface,
thus enabling touch on the surface
and creating a 3-dimensional
interaction space over the surface. This
could for example be implemented
forgiving textual input on the steering
wheel for navigation tasks.
4.2.4 3-Dimensional Gesture Spaces
The previously mentioned 3-
dimensional interaction space is the

37
last area that was identified as
particularly interesting for the future
development. Proximity detection can
be used to track a variety of different
gestures, both on and in the vicinity of
surfaces. The technology may not
always be able to track the same
variety of gestures or have the same
reach as a camera based technology,
but it could quite possibly be a much
more rugged and inexpensive solution.
This could be applied for controlling
the blinkers and the windscreen wipers.
If the different concepts are mapped
to the areas of interest as in Figure 20, it
is easy to see that a selection can be
which demonstrates all these
interesting areas in in one single final
concept.
Figure 20: Mapping to areas of interest
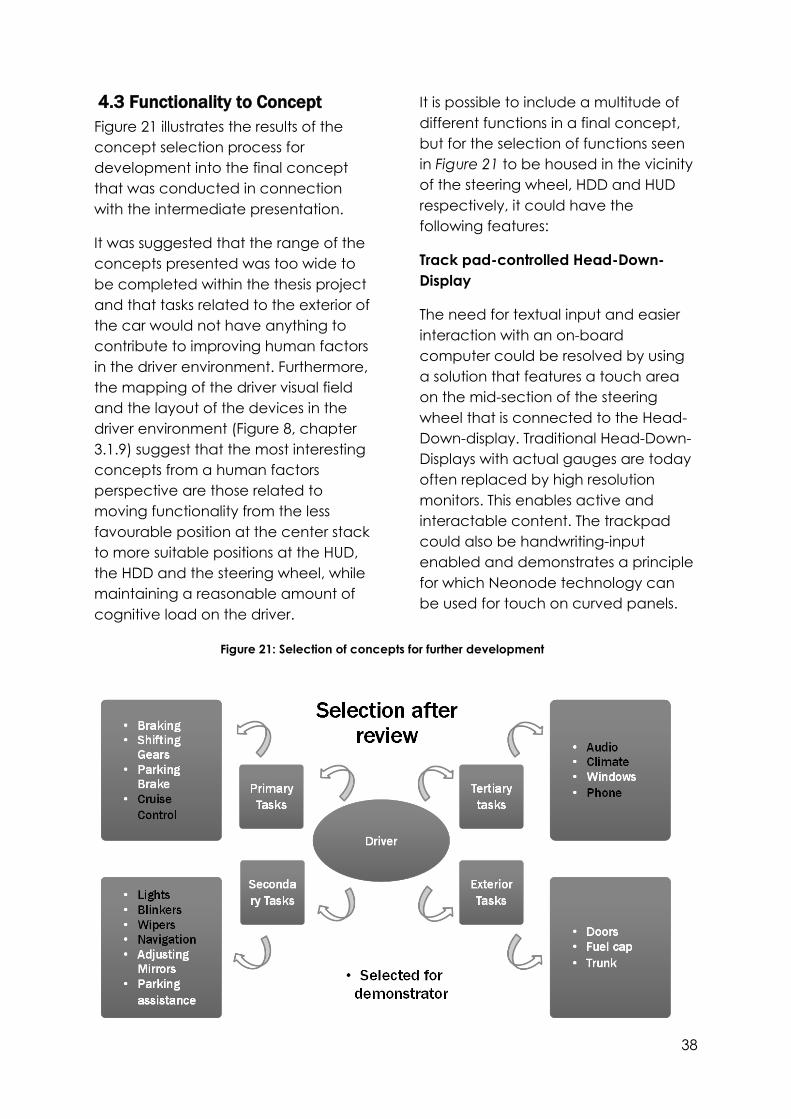
38
4.3 Functionality to Concept
Figure 21 illustrates the results of the
concept selection process for
development into the final concept
that was conducted in connection
with the intermediate presentation.
It was suggested that the range of the
concepts presented was too wide to
be completed within the thesis project
and that tasks related to the exterior of
the car would not have anything to
contribute to improving human factors
in the driver environment. Furthermore,
the mapping of the driver visual field
and the layout of the devices in the
driver environment (Figure 8, chapter
3.1.9) suggest that the most interesting
concepts from a human factors
perspective are those related to
moving functionality from the less
favourable position at the center stack
to more suitable positions at the HUD,
the HDD and the steering wheel, while
maintaining a reasonable amount of
cognitive load on the driver.
It is possible to include a multitude of
different functions in a final concept,
but for the selection of functions seen
in Figure 21 to be housed in the vicinity
of the steering wheel, HDD and HUD
respectively, it could have the
following features:
Track pad-controlled Head-Down-
Display
The need for textual input and easier
interaction with an on-board
computer could be resolved by using
a solution that features a touch area
on the mid-section of the steering
wheel that is connected to the Head-
Down-display. Traditional Head-Down-
Displays with actual gauges are today
often replaced by high resolution
monitors. This enables active and
interactable content. The trackpad
could also be handwriting-input
enabled and demonstrates a principle
for which Neonode technology can
be used for touch on curved panels.
Figure 21: Selection of concepts for further development

39
Thumb-screens mirrored in Head-Up-
Display
One concept found very promising
from the early concept development
stage was the thumbscreen concept
with connections to the Head-Up-
Display. This set up would allow the
driver to interact with the in-car system
without moving the hands away from
the steering wheel and without
averting the gaze from the traffic
scene. If haptic feedback is included
in the thumbscreens, this function
covers two of the defined interesting
areas for future development.
3-Dimensional proximity stalks.
In the early concept development
stage, there were many secondary
task concepts identified as suitable for
control by Neonode technology, many
of them today controlled by the
steering wheel stalks.
These tasks are mainly activated by
sweeping gestures that manipulate the
stalks into new positions. These gestures
could just as well be tracked by
clusters of proximity sensors. This
implementation would demonstrate
that gesture control is something
already present in cars, and that
gestures can be tracked by optical
sensors as well as mechanical ones.

40
Figure 22: List of primary functions and sub-functions
Figure 23: List of secondary functions and sub-functions
Figure 24: List of tertiary functions and sub-functions

41
5 Final Concept
Development
5.1 GUIs
The functionality that was to be
included in the GUI (Graphical User
Interface) was split into groups and
sub-functions for each function were
identified. (See Figures 22, 23 and 24)
It was deemed that the GUI for the
testing should be able to show at last
basic functionality, as well as feature
most standard displays, such as
speedometer and fuel-gauge etc.
White on black was chosen for highest
possible contrast if the Head-Up-
Display was to be projected on the
windshield. Since time was limited,
graphical elements were kept as
simple as possible for the GUI not to
look like an attempt at a finished
product but as a feasability test of a
layout of functions.
For the development of these GUIs, a
set of icons was already available from
a previous project that Neonode had
done and could be utilized to make up
parts of also this GUI.
Head-Down-Display (HDD)
The Head-Down-Display (Figure 25)
features an overview of the car’s status,
various settings, and a navigation
system. All these functions are fairly
complicated to operate and
subsequently require a substantial
amount of the user’s attention
resources to operate. They are
therefore suitable to operate only
when the driving situation is not
demanding or when the car is
stationary. Hence, the Head-Down-
Display was considered a suitable
location for such functions.
Head-Up-Display (HUD)
The Head-Up-Display features a cruise
control GUI, a simple climate control
panel, a music player and a telephone
application as well as information
Figure 25: Head-Down-Display GUI

42
about speed and simple navigation
information (Figure 26) that is often
found in a Head-Up-Display solutions
currently on the market. The
functionality is sparse with only the
most important functions incorporated
in order to reduce the visual and
cognitive load on the driver. All
functions are however functions that
are often used while the driving
situation is more or less demanding. It
should therefore be possible to
operate them without averting the
gaze from the driving scene.
Figure 26: Head-Up-Display GUI

43
5.2 Physical Design
Some of the early design concepts
(Figure 27) do not look much like
steering wheels in today’s cars, but
because the final product may be
developed into a demonstrator,
showing how the Neonode technology
could be implemented in cars that are
arriving on the market within the next
couple of years, conventionality was
not necessarily seen as a negative
characteristic.
The final result (Figure 28) is a 4-spoke
steering wheel with some
unconventional design features that
highlight the functionality of the
steering wheel. The most prominent
design feature is the rift between the
two bottom spokes of the steering
wheel. The cut-out indicates that the
space between spokes is an area that
can recognize touch or gesture
interaction. The space also has the
effect that the steering wheel will be
more comfortable to operate with
progressive steering rather than
conventional steering so that the
wheel will not have to be turned many
revolutions.
The mid-section is slightly sunk in
between the elongations of the two
bottom spokes and demonstrates the
principle where Neonode technology
can be used to add touch interaction
to any one-dimensionally curved
surface. The mid-section is flanked by
two opposing proximity arrays
providing X- and Y-direction
coordinates for any touch points on
the touch surface.
Figure 28: Various sketches illustrating the design process
Figure 27: Various sketches from different stages in the design process

44
The screens on the top spokes of the
steering-wheel refer to the Neonode
brand history. In 2002 Neonode
introduced one of the first touchscreen
phones that used infrared technology
for control by the thumb, through
tapping and sliding gestures. The
phone utilized the edges around the
screen by using the light guide as a
haptic indication of the fingers’
position on the screen. This reduced
the demand for visual navigation in
the system. As Neonode is moving into
the automotive segment, the haptic
indications and the less visual
navigation will be even more
important than it currently is for mobile
devices. The two 3.5-inch screens
(Figure 30) are representations of this
heritage and are positioned to provide
comfortable access to the entire
screen area. The screens are
positioned on volumes that bind the
elements of the steering wheel
together while containing all the
electrical components.
Figure 28: Perspective rendering of the final concept
Figure 29: Front detail-view rendering of the final concept
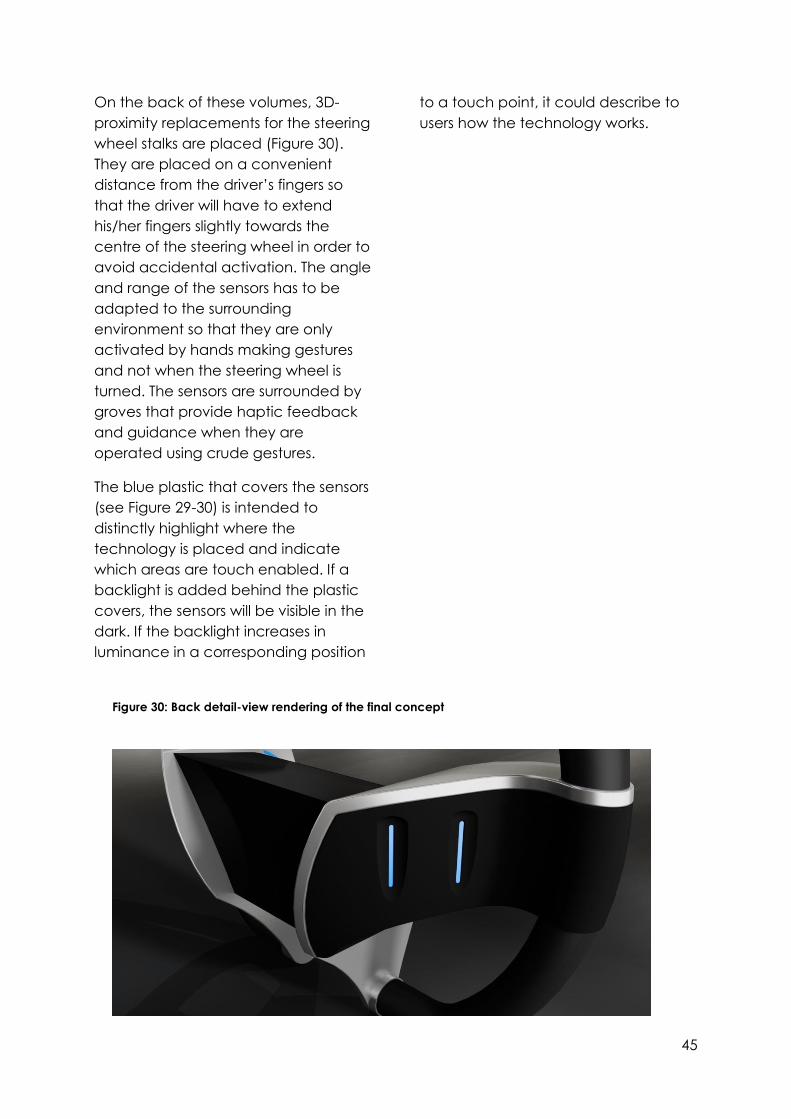
45
On the back of these volumes, 3D-
proximity replacements for the steering
wheel stalks are placed (Figure 30).
They are placed on a convenient
distance from the driver’s fingers so
that the driver will have to extend
his/her fingers slightly towards the
centre of the steering wheel in order to
avoid accidental activation. The angle
and range of the sensors has to be
adapted to the surrounding
environment so that they are only
activated by hands making gestures
and not when the steering wheel is
turned. The sensors are surrounded by
groves that provide haptic feedback
and guidance when they are
operated using crude gestures.
The blue plastic that covers the sensors
(see Figure 29-30) is intended to
distinctly highlight where the
technology is placed and indicate
which areas are touch enabled. If a
backlight is added behind the plastic
covers, the sensors will be visible in the
dark. If the backlight increases in
luminance in a corresponding position
to a touch point, it could describe to
users how the technology works.
Figure 30: Back detail-view rendering of the final concept

46
5.3 Formative Evaluation
The formative evaluation resulted in
the following changes to the system:
The HDD top menu icons were
changed from rotating to fixed
positions.
Symbols were added to
indicate the functionality of the
proximity replacements for
steering wheel stalks.
Only one type of arrows was
used throughout the whole
system.
Haptic indications for the HDD
top menu choices were added
on the mid-section of the
steering wheel.
Added a background to the
HDD top menu.
Wiper speed control was
moved to the front of the
steering wheel.
The indication of the current
menu choice in the HUD top
menu was changed.

47
6. Validation To validate the result a Kano Analysis
survey and a benchmark usability test
were executed.
6.1 Kano Analysis
The questionnaire had 15 respondents
and evaluated the attractiveness of
the features Head-Up-Display,
touchscreens and gesture control and
compared these to the more standard
solutions of media players and GPS
navigation systems.
The result was that the features HUD,
gesture control and touchscreens
have strong exciter-characteristics
when compared to the features GPS
Navigation System and Media Player.
There was however a bit of uncertainty
to whether or not the functions were
useful. Several of the respondents had
no previous experience with such
functions, and could not state that
they cared about the implementation
without any experience from using it.
The data the graphs (see Figure 31)
are based on can be found in
Appendix B – Kano Model Results. Note
that the graphs have been plotted to
give a visual comparison of the
functions and does not claim to be
mathematically correct but give an
indication of the exciter characteristics
of the features
.
Figure 31: Plot of the result of the Kano analysis

48
6.2 Benchmark Usability Test
Summary
Benchmark tests were carried out in
order to evaluate the performance of
the prototype compared to solutions
out on the market today from a
usability perspective. On the road
usability tests were conducted with a
selection of users in a total of 28 test
runs. The experiment used Volvo V60
that was modified in between tests to
resemble the prototype solution. The
results show a decrease of the error
rate when using the prototype solution
rather than the industry benchmark,
and the qualitative data also shows
that the user satisfaction is greater
using the prototype system.
Implementation
The benchmark system chosen to
evaluate the prototype system against
was a Volvo V60 year model 2011. The
chosen car is used by the company
Sunfleet as a carpool car in
Gothenburg. It was seen as a suitable
car because it is relatively new and
also a car that is used by different
people every day, why the
requirement for usability, especially
among first time users, ought to be
high. Being a Volvo, which is the most
common car in Sweden as well as a
car used in many driving schools, it
ought to set the bar high as a
benchmark solution. The modifications
made to the car prior to the tests were
that an iPhone was mounted on the
car center stack and paired with the
car infotainment system to enable in-
car calling. Since the car lacked an
on-board GPS, the iPhone was also
used for the navigation task through
an application called Wayz.
For testing the prototype system,
cardboard and paper cut-outs were
added to the steering wheel to make it
resemble the concept steering wheel
(see Figure 32). The same LCD screen
setup that was used in the formative
evaluation was used for the Head-
Down-Display, but the Head-Up-
Display pico-projector had to be
replaced with a turnable cardboard
representation because of problems
with the power supply. (See Appendix
C for a detailed description of the
prototype.)
Figure 32: The usability test-environment

49
There were in total 28 test runs carried
out, 14 with the benchmark system
and 14 with the prototype system. The
7 test subjects carried out 2 test runs
with each setup. The subjects were
aged between 19 and 32. The tests
were performed two times in a row
with each system and test-subject,
then the set up was changed and two
tests were performed with the new set
up. The order of the
prototype/benchmark tests was
alternated between the test-runs to
compensate for any learning effects.
Four of the six tasks from the formative
Evaluation were re-used in the test.
1. Navigation:
Add new destination
2. Wipers:
Activate wipers at highest
speed
Shut of wipers
3. Lights:
Activate high beams
Deactivate high beams
4. Telephone:
Call contact.
This choice was partly because the
tests would have been very lengthy
with double the amount of runs (both
benchmark and prototype), and partly
because there was almost no
difference between the results in the
formative evaluation for the 3 last tasks,
all using the thumbscreen/HUD set up.
The test site chosen was a closed off
parking lot (see Figure 33). When the
test subjects showed up on the test site,
they were given the questionnaire for
the Kano evaluation and were asked
to fill it in. When this was completed,
they were given the instructions that
they would be given 4 different tasks
that they had to carry out while driving.
They were also given some basic
instructions about the thought
functionality of the prototype; basically
that the cardboard pieces were
representations of touch areas and
that the two on the steering wheel
were mapped to the HUD and that
there were proximity sensors on the
back of the steering wheel (see
instructions in Swedish in Appendix D –
Usability Protocol). The test subjects
executed the first task while stationary
and the three following tasks while the
Figure 33: The layout of the test-course

50
car was moving slowly on first gear
around the test course.
Before the test, the minimum number
of actions was checked. During the
test, the number of errors while using
the systems and the number of times
the user took his/her eyes off the road
(more than approx. 15 degrees) during
the telephone task for more than 1.5
seconds were measured. (for
complete protocol see Appendix D)
The minimum number of actions should
give an indication to the efficiency of
the respective HMI designs, while the
number of errors would provide a
good measurement of guessability
and overall usability. Doing a second
run may indicate the learnability of the
design and the experienced user
performance of the system, while the
eyes off road measurement limits
originates from the results of the
literature study and is a driving-specific
measurement.
The test runs were documented with a
CCTV setup in the car that both
showed the test subject (see figure 34)
and the traffic scene in front of the car.
This was used primarily to check the
eyes off road time measurement. The
errors were entered into the protocol
by the moderator during the test.
Results
The theoretical minimum number of
actions (see Figure 37) needed to
Figure 34: View From one of the CCTV cameras during test
Figure 37: Plot of the measurements from test 1 and 2

51
execute all the four tasks did not differ
much between the two systems (12 for
the benchmark and 11 for the
prototype).
When looking at the total number of
interaction errors during the first test run,
the total number of errors for the
benchmark solution is 38, while the
total number of errors for the prototype
is 23. Looking at the distribution of
errors over the test subjects (see Figure
35), the benchmark has an even
distribution over the tasks except for
blinkers that only contributed with one
error. For the prototype, the majority of
errors were conducted in the
navigation and wiper tasks
respectively (see Figure 36). It should
be noted that during the windscreen
wiper test for the benchmark (14 errors),
one slightly stressed test subject
accounted for almost half (6) of the
errors by repeatedly activating the
blinkers and windscreen washer fluid,
why this figure may be slightly bloated.
The major advantage for the
prototype concerned the telephone-
task where only four errors were
conducted using the prototype HUD
based setup compared to eleven for
the traditional setup. Several test
subjects expressed their liking for this
particular solution and stated that they
would prefer such a system to the
center stack mounted system used in
the benchmark design. Two of the
subjects even pulled over and stopped
the car while doing the telephone-task
using the benchmark system because
they did not feel that is was safe to
operate. Regarding the two other
functionalities, the results were mixed.
None of the test subjects expressed
any disliking to any of the systems after
Figure 35: Errors distributed over test subjects

52
understanding how they worked, but
there was an element of doubt as to
how the mock-up track pad was
connected to the Head-Down-Display.
This was, according to some of the test
subjects, because there was no
feedback built in to in the system. The
users expressed difficulties in finding
clues on to operate the 3D proximity
stalks; clearer indications were
suggested.
When doing run number two with both
solutions, the error rate dropped
drastically with only four errors for the
benchmark system and two errors for
the prototype.
The most distinguishable result is the
measurement on how many times the
test-subjects took their eyes off the
road for more than 1.5 seconds. During
the first run, a total of 72 times was
recorded for the benchmark and
during the second run, the number
was 38. The prototype solution resulted
in no long glances away from the
traffic scene in any of the test runs.
Figure 36: Detailed plot of the errors in Test 1

53
7. Discussion 7.1 Validation
Even if the validation gave clear
indications that the prototype in many
areas has advantages over the
traditional systems, there are some
areas that need further investigation in
order to be able to draw definite
conclusions. Firstly, comparing the test
result between a crude prototype that
lacks the normal feedback from the
system and a well-tested fully
functional solution may have
contributed to errors in measurement.
Finished solutions usually perform better
in some areas, but the risk of making
follow up-errors in a system that has
more of possible actions to execute is
often greater than in serial-flow
prototype solution specifically
designed to handle the functionality to
be tested.
With only seven test subjects, the
sample from the benchmark tests is too
small to draw conclusions based on
the quantifications of the results. One
should as a suggestion look at the
qualitative aspects during the tests
and see if they support or go against
the results. In the case of the Head-
Up-Display/thumbscreen solution, the
comments regarding the functionality
were unanimously positive, but more
indecisive regarding the two other
suggested functionalities.
The Windscreen task showed
surprisingly poor performance in
regards to the simple nature and clear
description of the task. The
performance was rather poor in the
prototype system but most notably
also in the heavily standardized
benchmark-system. This probably has
an explanation in the concealed
position of the controls and lack of
indications in the prototype system. For
the benchmark system the poor result
is explained by one individual user’s
exceptionally poor performance and
the poor feedback regarding the
status (set speed of windscreen wipers)
that the system provides. Both systems
could probably perform much better
with a better mapping to standard
guidelines for interaction design.
Gesture control in cars could be
feasible if easy-to-understand icons
were developed.

54
7.2 Results
The results correspond well to the initial
goals of the project.
The user experience suffers slightly from
the very sparsely designed graphical
user interface. It would be beneficial
for the general impression of the
demonstrator to have a more finished
and well-designed graphical user
interface. Even if the mock-up GUI
well serves it’s purpose for evaluating
the possible capacity of the
functionality, a more finished and
better GUI would make it easier to
convince potential customers about
the feasibility of integrating this type of
interaction technology in the next
generation of cars.
When it comes to the physical design
of the concept solution, it has been
pointed out that the final design is not
entirely realistic to implement in a
modern car because of regulations
that state that possible impact-zones in
the driver environment need to have a
certain impact area to absord the
force at a crash and no sharp edger or
angles facing the driver, even with the
use of an airbag. It is however nothing
that has an impact on the feasibility of
the concept, but it may be wise to
produce a new physical design in
order to demonstrate that the
technology is compatible also with
these design regulations.

55
7.3 Methods and Implementation
During the project, a handful of
methods were used to collect and
analyse data as well as develop
concepts and evaluate them. Early on,
there was a large focus on
understanding the theoretical
framework that is quite vast and
complicated compared to many other
development projects that the author
has been involved in. It was also
decided early on to do an evaluation
of a concept against a benchmark in
order to achieve a result that gave a
clear indication to whether or not the
technology was suitable for use in a
driving environment. This was
accomplished within the project, but
did not leave time to create multiple
concept candidates that could be
evaluated against each other to
become a final concept.
If more time had been spent in the
concept development stage, it is
possible that the final product would
have had a better finish. More shapes
and different concepts could have
been generated and compared to
each other.
Also, the project does not feature a list
of requirements that the concepts
could have been evaluated against.
This is due to the complexity of the
theoretical background. Deciding
which concept would perform better
from for example a safety perspective
requires extensive testing and is not
easily evaluated using estimates in a
matrix.
56
7.4 Theory
As previously mentioned the
theoretical part of this project was
quite extensive and gave a solid
foundation on which to base the
following concepts. However, there
are still some questions left that need
to be investigated further in order to
be able to evaluate the final concept:
How does the Graphical User Interface
and the intended interaction with it
affects the driver’s visual attention?
Which design guidelines are more
important when it comes to the
process of driving compared to
general usability guidelines?
How should interactable content in the
Head-Up-Display be designed to
minimize the visual and cognitive load
on the driver if the driving situation
suddenly becomes increasingly
demanding? This looks promising in the
final suggestion, but needs a stronger
proof of concept.
57
8. Conclusions The theoretical part of the project
summarizes and suggests design
guidelines for designing user interfaces
for the automotive industry. An
important conclusion is that the main
driving task is a visual process which
makes it particularly important for
subsidiary secondary and tertiary tasks
to place a low visual load on the driver,
something achievable through haptic
guidance and feedback as well as
general design from a human factors
perspective.
The final concept fared well when
compared to the benchmark solution.
This indicates that continued
development and testing should be
done.
A final reflection is that it is very hard to
separately develop controls and
displays for a user interface. For touch
applications specifically, this means
that hardware and software
development need to be tightly
interlaced.

58
References Arasa Gaspar, A., 2011, Design and evaluation of haptic feedback for in-
vehicle touch screens, Chalmers University of Technology
Bhise, V., 2012, Ergonomics in the Automotive Design Process, CRC Press
Bligård, L-O, 2011, Utvecklingsprocessen ur ett människa-maskinperspektiv,
Chalmers University of Technology
Internet source: Blindmann, G., 2011, Multitouch Technologies,
http://www.multi-touch-solution.com/en/knowledge-base-en/multitouch-
technologies-en/, accessed on 2013-02-02
Bohgard, M., Osvalder, A., Karlsson, S., Loven, E., Mikaelsson, L.; Mårtensson, L.,
Rose, L., Ulfvengren, P., 2008, Arbete och teknik på människans villkor,
Prevent
Internet source: Cirque corporation, 2011, Resistive touch – September 15th
2011 and Capacative touch – June 10th 2011, www.touchadvance.com,
accessed on 2013-02-02
Döring, T., Kern, D., Marshall, P., Pfeiffer, M., Schöning, J., Gruhn, V., Schmidt, A.,
2011, Gestural Interaction on the Steering Wheel - Reducing Driver Visual
Demand, Proceedings from the CHI Conference on Human Factors in
Computing Systems in Vancouver May 7-12 2011, ACM
Fitts, P. M. 1954. The information capacity of the human motor system in
controlling amplitude of movement, Journal of Experimental Psychology, 47,
381–391.
Fitts, P. M., Posner M. I., 1967, Human Performance, London
Fitts, P.M., Jones, R.E., 1961, Psychological factors of instrument display:
Analysis of Factors contributing to 279 “pilot errors” experiences in reading and
interpreting aircraft instruments, In: Selected papers on human factors in the
design and use of control systems, Dover Publications Inc.
Gillbom D., 2012, Unpublished source, Semcon
Ho, C., Spencer, C., 2008, The Multisensory Driver: Implications for Car Interface
Design, Ashgate Publishing Group
Jordan, P. W., 1998, An introduction to Usablilty, Taylor & Francis
Kern, D., Schmidt, A., 2009, Design Space for Driver Based Automotive User
Interfaces, Proceedings of the 1st International Conference on Automotive
User Interfaces and Interactive Vehicular Applications in Essen September 21-
22 2009, ACM
Mårtensson U., 2012, Unpublished source, Neonode
Sivak, M., 1996, The information that drivers use: is it indeed 90% visual?,
Publication title The UMTRI Research Review, Volume 29, Issue 1, University of
Michigan
Strickland, D.L., (2012) Visual-Manual NHTSA Driver Distraction Guidelines for
In-Vehicle Electronic Devices, DEPARTMENT OF TRANSPORTATION National
Highway Traffic Safety Administration
Tretten, P., 2008, The Driver and the Instrument Panel, Luleå University of
Technology

59
Tönnis, M., Broy, V., Klinker, G., 2006, A Survey of Challenges Related to the
Design of 3D User Interfaces for Car Drivers, Proceedings of the IEEE
conference on Virtual Reality archive, IEEE Computer Society
Underwood, G., Crundwall, D., Chapman., P, 2007, Handbook of Applied
Cognition, New Zealand Psycol Soc
Wickens , C.D., Lee, J.D., Liu, Y., Becker Gordon, S.E., 2004, An introduction to
human factors engineering, Pearcon
Österlin, K., 2003, Design i fokus för produktutveckling, - Varför ser saker ut som
de gör?, Liber
Norman, D.A., 1986, User Centered System Design: New Perspectives on
Human-Computer Interaction (Cognitive engineering) , Erlbaum associates
Internet source: Brusse-Gendre, T., 2002, Kano Model Analysis,
http://people.ucalgary.ca/~design/engg251/First%20Year%20Files/kano.pdf,
accessed on 2013-02-02, University of Calgary

69
Appendices
Appenix A – GANTT –chart
Appendix B – Kano Model result
Appendix C – Prototype description
Appendix D – Usability protocol

70
Appendix A – GANNT Chart

71
Appendix B – Kano Model Results
Questionnaire (in Swedish)
Frågor:
Ålder:
Körkort : JA / NEJ
Hur skulle du känna dig om din bil var utrustad med:
Missnöjd Neutral (normalt) Nöjd Bryr mig inte
Mediaspelare
GPS
Head-Up-Display
Geststyrning
Touchpaneler
Hur skulle du känna dig om din bil saknade:
Missnöjd Neutral (normalt) Nöjd Bryr mig inte
Mediaspelare
GPS
Head-Up-Display
Geststyrning

72
Touchpaneler
Data:
Included missnöjd neutralt nöjd bryr mig inte
Media player 4 10 1
GPS 1 14
HUD 1 1 9 4
Gesture control 4 7 2
Touch Panels 3 10 1
Not Included missnöjd neutralt nöjd bryr mig inte
Media player 13 1 1
GPS 6 8 1
HUD 1 5 1 8
Gesture control 1 7 7
Touch Panels 2 8 5
basic performance exiter insecurity
Media player 4 10 2
GPS 1 6 8 1
HUD 1 5 12
Gesture control 1 7 9
Touch Panels 2 8 6
Visualisation of Data:

73

74
Appendix C – Prototype description
As a prototype, A “Wizard of Oz” - setup in a Volvo V60 was used. The test leader
controls the mock-up interface to make it act as similar as possible that it would act
in a real situation while the test subject manipulates mock controls.
In this case, a laptop computer was used to power and control the HDD interface. A
description of the parts of the mock set up follows:
A: The HUD was emulated by a turnable cardboard mock-up that was placed on
top of the instrument panel. This interface was serial and had a small delay.

75
B: The HDD was emulated by a 13.3 inch LCD screen controlled through a power
point presentation powered through a laptop. This gave the possibility to have a
more dynamic GUI with only small delays.
C: The thumbscreens were represented by cardboard cutouts attached to the
steering wheel on top of the already existing thumb-buttons. The cardboard cut-outs
do not display any images, but are similar in shape to the the shape indicated in the
HUD display. It is debatable whether or not they would be easier to operate if they
displayed the same image
D: A larger representation of a trackpad was attached to the mid -part of the
steering wheel. Its placement directly underneath the HDD and its shape indicates
that it controls the HDD.
E: Behind the steering wheel, blue strips of paper are attached on both sides of it.
They give a slight haptic indication and are meant to simulate the proximity sensors.
F: A blue strip of paper is attached to the right front side of the wheel. In the test, it
represents a proximity slider that controls the speed of the windscreen wipers.
G: Two of the CCTV cameras that capture the action in the car. One is facing the
front to capture the driving scene and one facing the driver to capture eye-
movement.

76
Appendix D – Usability Protocol
Protocol (in Swedish):
Instruktioner:
Jag kommer att ge dig några uppgifter som du ska utföra i med hjälp av den här
ratten. Alla är vanliga uppgifter som man brukar utföra medan man kör.
Ratten fungerar så att det finns en touchkänslig yta i mitten som är mappad mot
Head-down-display Och två touchkänsliga ytor på sidan som är mappade mot
Head-up displayen. Det finns också avståndssensorer som känner av rörelse på
baksidan av ratten..
Uppgift 1:Lägg till linnegatan 89 som ny destination i navigationssystemet
Uppgift 2: Sätt på vindrutetorkarna på högsta fart och stäng av dem igen.
Uppgift 3 :Sätt på och stäng av helljus.
Uppgift 4: Spela upp “Track 2” från CDn, dra ned volymen
Uppgift 5: Ställ in klimatsystemet på 22 grader.
Uppgift 6: Ring Carl Cahill.
Test 1 Handlingar Felhandlingar Ledtrådar
#1
#2
#3
#4
#5
#6
Test 2 Handlingar Felhandlingar Ledtrådar
#1

77
#2
#3
#4
#5
#6
Data:
Benchmark
Test 1 Minimum actions Errors Eyes-off-road
Navigation 5 12
Wipers 2 14
High-beams 2 1
Telephone 4 11 72
Sum 13 38 72
Test2
Navigation 5
Wipers 2 2
High-beams 2
Telephone 4 2 37
Sum: 13 4 37
Prototype
Test 1 Minimum actions Errors Eyes-off-road
1 4 10
2 3 9
3 2
4 3 4
Sum: 12 23 0
Test2
1 4
2 3 2
3 2
4 3
Sum: 12 2 0

78

79
Visualisation of data: