nickel & molybdenum overview: nickel: a battery-charged ... · pdf filenickel &...
TRANSCRIPT

Nickel & Molybdenum Overview:
Nickel: A Battery-Charged Future
Molybdenum: Still Groundhog Day
MRAG Annual Mining Analyst Forecast and Luncheon Mark Selby, CEO
RNC Minerals November 10, 2017

www.royalnickel.com
Disclaimer
1 TSX: RNX
All currency references in U.S. dollars, unless otherwise stated.
Cautionary Statements Concerning Forward-Looking Statements This presentation provides certain financial measures that do not have a standardized meaning prescribed by IFRS. Readers are cautioned to review the stated footnotes regarding use of non-IFRS measures.
This presentation contains "forward-looking information" including without limitation statements relating to the guidance for production; costs of sales, C1 cash costs, all-in sustaining costs and capital expenditures, and relating to the potential of the Beta Hunt Mine and the Reed Mine.
Forward-looking statements involve known and unknown risks, uncertainties and other factors which may cause the actual results, performance or achievements of RNC to be materially different from any future results, performance or achievements expressed or implied by the forward-looking statements. Factors that could affect the outcome include, among others: future prices and the supply of metals; the results of drilling; inability to raise the money necessary to incur the expenditures required to retain and advance the properties; environmental liabilities (known and unknown); general business, economic, competitive, political and social uncertainties; accidents, labour disputes and other risks of the mining industry; political instability, terrorism, insurrection or war; or delays in obtaining governmental approvals, projected cash costs, failure to obtain regulatory or shareholder approvals. For a more detailed discussion of such risks and other factors that could cause actual results to differ materially from those expressed or implied by such forward-looking statements, refer to RNC's filings with Canadian securities regulators available on SEDAR at www.sedar.com.
Although RNC has attempted to identify important factors that could cause actual actions, events or results to differ materially from those described in forward-looking statements, there may be other factors that cause actions, events or results to differ from those anticipated, estimated or intended. Forward-looking statements contained herein are made as of the date of this presentation and RNC disclaims any obligation to update any forward-looking statements, whether as a result of new information, future events or results or otherwise, except as required by applicable securities laws.
Cautionary Statement Regarding the Beta Hunt Mine The decision by SLM to produce at the Beta Hunt Mine was not based on a feasibility study of mineral reserves, demonstrating economic and technical viability, and, as a result, there may be an increased uncertainty of achieving any particular level of recovery of minerals or the cost of such recovery, including increased risks associated with developing a commercially mineable deposit. Historically, such projects have a much higher risk of economic and technical failure. There is no guarantee that that anticipated production costs will be achieved. Failure to achieve the anticipated production costs would have a material adverse impact on SLM’s cash flow and future profitability. It is further cautioned that the PEA is preliminary in nature and includes inferred resources that are considered too speculative geologically to have the economic considerations applied to them that would enable them to be categorized as mineral reserves. No mining feasibility study has been completed on Beta Hunt. Mineral resources are not mineral reserves and do not have demonstrated economic viability. There is no certainty that the PEA will be realized.

www.royalnickel.com
NICKEL
Nickel prices to climb higher towards a 1st half 2018 peak
Nickel demand growth to remain relatively strong – at same or better levels than 2016
Nickel supply to grow more slowly than demand – only net source of supply growth will be Indonesian NPI as Chinese NPI constrained by Philippines ore availability
Nickel demand will grow in both China and ROW
Significant deficit will emerge – scale dependent on strength of restocking cycle
MOLYBDENUM
Molybdenum prices will remain “pinned” into the cost curve below $10/lb
May see temporary rebound towards $10/lb from $5/lb driven by stainless steel restocking
2
Review of last MRAG presentation
(vs. MRAG 2016)
NICKEL
Nickel prices moving strongly higher, broke 4 year downtrend
Nickel demand at 7% - same as 2016 and in line with prior cycles
Supply growth failed to keep pace and NPI (Indonesia and China) > 100% of supply growth. All other supply shrunk in 2017
Demand grew strongly in both markets
Deficit now forecast to be 100+kt
MOLYBDENUM
Moly prices remain well below $10/level
Moly prices moved higher from low levels of $6.70/lb at end 2016 as stainless production moved higher

www.royalnickel.com
Summary
Nickel market surprised many commentators with continued strong demand – recent market focus on demand from EVs in 2020s support an already robust medium and long-term picture
Back-to-back robust demand growth in 2016-17 – combined growth of 16% consistent with prior rebounds
Nickel demand much better than anticipated – despite historical pattern, few analysts forecast 2017 growth of 7+% Solid growth in both ROW and Chinese, stainless production improving in all regions
Supply growth driven solely by NPI in Indonesia and China – supply in ROW continues to contract with significant implications for future supply Tough to quickly turn operations on long-term downtrend regardless of how high nickel prices go Nickel production increasingly concentrate in high political risk countries – Will car companies start paying
a premium for low risk supply? PAL was not a solution to nickel supply last time – “A laterite leach by any other name still smells like a billion
dollar cost overrun”
Battery demand growth driven by significant growth in EVs and a shift in battery chemistry toward higher nickel content underpins an already robust long-term demand growth story
Many misconceptions about batteries, particularly about types of feed – fundamental issue is total nickel units No long-term shortage of nickel sulphate – premiums now, but China will build 2-3X what market needs (like
they have for every semi-processed material) and bid premiums down to zero profit (feed suppliers win !) No shortage of feed - over 400kt of Class I product thrown into stainless steel furnaces, NPI plants can simply
add a converter, add sulphur and produce matte (PT Inco has done for 30 years) to be refined
A battery - charged future for nickel already in significant deficit Already robust demand growth (nickel best performing base metal) about to be turbocharged by batteries Nickel supply growth dependent on high political risk NPI, with potential limits from increasingly stringent
environmental limits in China) with very few shovel ready projects (such as Dumont)
3

www.royalnickel.com
Nickel Prices Finally Broken 5+ Year Downtrend
4
Source: Metalprices.com
0.00
2.00
4.00
6.00
8.00
10.00
12.00
14.00
LME Cash Nickel Price (US$/lb)
Recent nickel price movements finally broke through a 5+ year downtrend moving sharply higher at start of November

www.royalnickel.com
Nickel Prices - Well-Supported
Movement in nickel prices have been well-supported by movements in Chinese stainless steel prices
5
Stainless Steel 304 Coil (China) Yuan (000s)/t
Source: Antaike, CRU
9
10
11
12
13
14
15
16
17
18
19

www.royalnickel.com 6
Headline Inventories appear to have peaked and open inventories have declined as cancelled warrants have increased to record levels
Exchange Inventories
Exchange inventories gradually declining from peak of 500+kt with significant decreases in off-warrant stocks. Strong growth in nickel demand is also eroding the effective market overhang.
LME + SHFE Nickel Inventories (Jan 1, 2015 – November 3, 2017, Kt)
0
100
200
300
400
500
Nic
kel
(kt)
384kt
LME Inventory
432 kt
SHFE Inventory 48kt
Note: SHFE nickel inventory was 47,511t, of which cancelled inventory was 10,472t, as at November 3, 2017. Source: Argus Media

www.royalnickel.com
Nickel Demand Past Cycles Would Suggest No Slowdown in Demand
Many analysts had low forecasts after strong year in 2016. 2017 demand growth of 7+% was completely in line with past cycles.
7
27%
13%
25%
13% 12%
9%*
16% 16%
0%
5%
10%
15%
20%
25%
30%
1982 - 1984 1986 -1988 1993 -1995 1998 -2000 2001 - 2003 2005 - 2007 2008 -2010 2015-2017
Nickel Consumption Growth 2 Years Following a Price Trough
Trough
Source: MetalPrices.com, Macquarie, RNC analysis
* Insufficient nickel supply constrained demand resulting in single-digit demand rebound

www.royalnickel.com
Base Metals - Supply and Demand
8
Nickel continued to have the highest demand growth of the major base metals in 2017
0%
1%
2%
3%
4%
5%
6%
7%
8%
Zinc Lead Copper Aluminum Nickel
Demand Growth 2017f (YoY)
Source: Macquarie

www.royalnickel.com
Stainless Steel Production by Region
Stainless production grew in each region globally
9
2,000
4,000
6,000
8,000
2016 2017(f)
Stainless Production USA (t)
Source: Macquarie, RNC analysis
2,000
4,000
6,000
8,000
2016 2017(f)
Stainless Production Europe (t)
2,000
4,000
6,000
8,000
2016 2017(f)
Stainless Production Other Asia (t)
2,000
4,000
6,000
8,000
2016 2017(f)
Stainless Production India (t)
12,500
17,500
22,500
27,500
2016 2017(f)
Stainless Production China (t)
0
500
1,000
1,500
2,000
2016 2017(f)
Stainless Production Indonesia (t)
+15%
+2% +2%
+7%
+3%
www.royalnickel.com
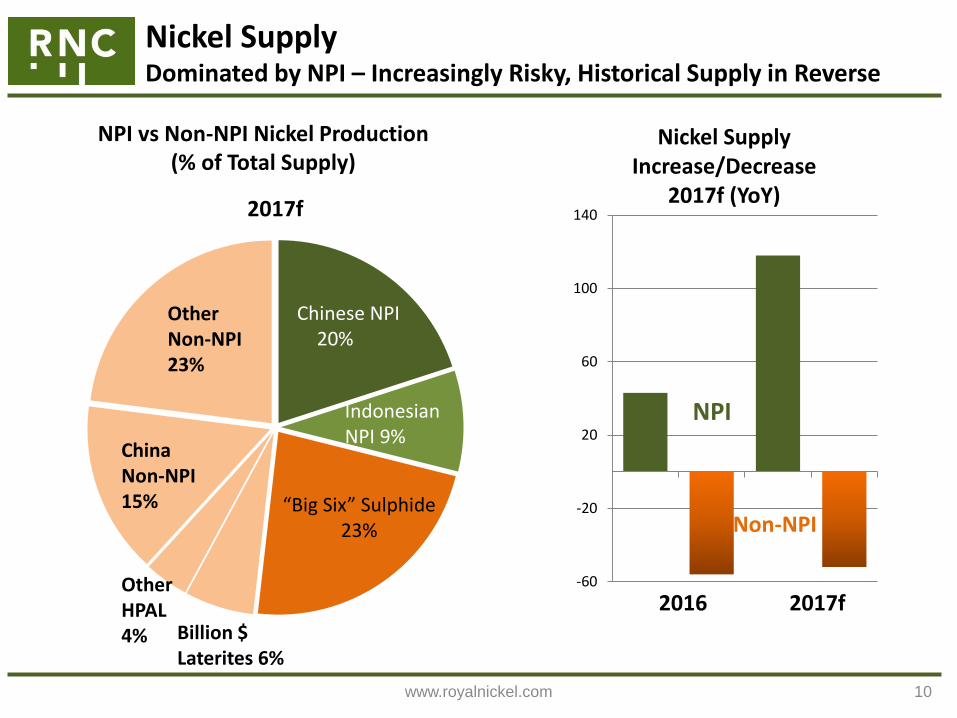
Nickel Supply Dominated by NPI – Increasingly Risky, Historical Supply in Reverse
10
-60
-20
20
60
100
140
Nickel Supply Increase/Decrease
2017f (YoY)
Non-NPI
NPI
2017f
Chinese NPI 20%
Indonesian NPI 9%
“Big Six” Sulphide 23%
NPI vs Non-NPI Nickel Production (% of Total Supply)
2017f 2016 Billion $ Laterites 6%
Other HPAL 4%
Other Non-NPI 23%
China Non-NPI 15%

www.royalnickel.com
11
Nickel Supply Decline of the “Big Six”
0
20
40
60
80
100
Mount Keith + Leinster Ni Production (kt)
0
20
40
60
80
100
Voisey’s Bay Ni Production (kt)
0
20
40
60
80
100
Vale Sudbury Ni Production (kt)
Source: Company reports, CRU, Wood Mackenzie
0
20
40
60
80
100
Vale Manitoba Ni Production (kt)
0
20
40
60
80
100
Jinchuan Ni Production (kt)
-27% -47%
-22%
* 2017 guidance is 206-211 kt
180
200
220
240
Norilsk Ni Production (Polar + Kola, kt)
*
+1%
+78%
Nickel production from most of the largest sulphide operations has declined over the last decade (ex Voisey’s Bay ramp-up) as low nickel prices deterred investment
* 2017 forecast based on 9M2017 production * 2017 forecast based on 9M2017 production
* 2017 forecast based on 9M2017 production * 2017 forecast based on CRU * 2017 forecast based on CRU
-27%

www.royalnickel.com
Nickel Supply – HPAL/FeNi Billion Dollar Ramp-ups
12 Source: Company reports
0
10
20
30
40
50
60
2012 2013 2014 2015 2016 2017f
Ambatovy
0
10
20
30
40
50
60
2012 2013 2014 2015 2016 2017f
Vale New Caledonia (Goro)
0
10
20
30
40
50
60
2012 2013 2014 2015 2016 2017f
Koniambo
0
10
20
30
40
50
60
2012 2013 2014 2015 2016 2017f
Ramu
The amount of additional nickel supply from the billion dollar laterite projects of the last decade is relatively uncertain…
Capacity Capacity
Capacity
Capacity
* 2017 guidance 36-39kt * 2017 forecast based on 9M2017 production
* 2017 forecast based on 9M2017 production * 2017 forecast based on 9M2017 production

www.royalnickel.com
Nickel Supply – Established HPAL Producers
13
Source: Company reports
0
10
20
30
40
50
2012 2013 2014 2015 2016 2017f
Murrin Murrin
0
10
20
30
40
50
2012 2013 2014 2015 2016 2017f
Ravensthorpe*
0
10
20
30
40
50
2012 2013 2014 2015 2016 2017f
Moa Bay
…While established HPAL producers are facing challenges to maintain existing production levels
*Placed on care and maintenance on October 1, 2017
* 2017 guidance 31.5 – 32.5 kt
* 2017 forecast based on 9M2017 production

www.royalnickel.com
14
Nickel Supply – China Production Leveling Out
Source: Antaike, RNC analysis
Chinese nickel supply of both NPI and non-NPI metal has leveled out in recent years - cost pressures and lower ore grades will limit future growth
Chinese Nickel Pig Iron Production (Annualized Monthly Production, Kt)
0
100
200
300
400
500
600
Jan
-13
May
-13
Sep
-13
Jan
-14
May
-14
Sep
-14
Jan
-15
May
-15
Sep
-15
Jan
-16
May
-16
Sep
-16
Jan
-17
May
-17
0
100
200
300
400
500
600
2012 2013 2014 2015 2016 2017f
Chinese Nickel Production (ex-NPI) (Kt)
* 2017 forecast based on Jan-Aug 2017 production
China’s environmental crackdowns are now real (rather than just talk), How much NPI output will China accept ?

www.royalnickel.com
Where is new project supply going to come from?
15
Nickel Supply - Little Momentum in Existing Supply & “Project Cupboard” Largely Empty
Source: CRU, RNC Analysis
By mid-2020s, 800kt-1 Mt of new supply is required, but “project cupboard” outside of Indonesian NPI is empty — few projects in pipeline and 35+ years of inertia to overcome
TSX: RNX
Laterites – HPAL?
Laterites – FeNi?
NPI?
Sulphides?
800kt - 1 Mt New Supply
Required
This is equivalent to a TRIPLING of Chinese NPI production or a doubling of current nickel sulphide production !

www.royalnickel.com
Nickel Supply – Market Needs Indonesia NPI Output, Will Consumers be Willing to Rely On It ?
NPI from Indonesia is one of few potential sources of new nickel that the market requires, but it comes with significant political risk
Indonesian NPI ~10% of global supply in 2017 and first significant production of stainless steel, largely by Tsingshan
Tsingshan will bring on 3 Mt of stainless steel production capacity by 1st half 2018
Dangerous to extrapolate Tsingshan performance to other companies
Tsingshan result is successful execution of long-term plan executed over a decade
Poor track record of Chinese mining projects outside China
Political risk in Indonesia has increased substantially over last few years – which will slow pace of investment
Indonesia is in position to become the world’s largest nickel producer and one of the largest stainless producers but will take until the early to mid-2020s at the earliest
16

www.royalnickel.com
17
Ferro-nickel puck produced from
Dumont concentrate
Significant potential benefits to producers of suitable nickel sulphide concentrate feed such as RNC’s Dumont Project:
Lower costs due to simpler processing compared to traditional smelting and refining
Higher payabilities than traditional smelting and refining
Greater flexibility for more potential partners and customers
Roasted nickel concentrate is effectively a very high grade laterite ore feed – creates new source of demand for nickel sulphide concentrate, notably at a time when many NPI and ferronickel producers face feed shortages as a result of Indonesia’s nickel ore export ban
RNC’s strategic alliance with Tsingshan led to the development of the first integrated nickel pig iron (“NPI”) plant to directly utilize nickel sulphide concentrate as part of the stainless steel production process through concentrate roasting
Nickel Supply – RNC’s NiCal Roasting Process - A Significant Breakthrough

www.royalnickel.com
Battery: Charging An Already Bright Future for Nickel Fact and Fiction
FACT Nickel demand will be driven by increased penetration of EVs into car market
Wide range of forecasts – bottom line: hundreds of thousands of tonnes of additional annual nickel demand
Nickel will make up higher proportion of metal in each battery produced
Fundamentally driven by requirement for higher energy density and lower costs
FICTION There will be a shortage of nickel sulphate for batteries
Supply is tight now, but China will build 2-3X what market needs (like they have for every semi-processed material) and bid premiums down to zero profit (feed suppliers win !) - cobalt story
There will be a shortage of Class I nickel for batteries
Over 400kt (~20%) of nickel supply (or almost 40% of Class I supply) ends up in stainless steel where it is not necessary
NPI plants can simply add a converter, add sulphur and produce a 70% nickel matte (PT Inco has done for 30 years) to be refined (and also get cobalt !)
18

www.royalnickel.com
Nickel & EVS: FACT Millions of EVs coming, Wide Range of Forecasts
19
Based on OEM announcements, IEA estimates EV cars on the road could range between 9 – 20 million by 2020 and 40 – 70 million by 2025 compared to just 2 million in 2017
At 35-50kg per car, that is a total of 1.4 – 3.5 Mt of nickel consumption by 2025

www.royalnickel.com
2018 Honda Odyssey (PRICE: $ 38,095)
20
Nickel & EVs: FACT A Personal Story
2018 Chrysler Pacifica (PHEV)
(PRICE: $37,095) ($51,095 less $14,000 Subsidy)
The decision for many consumers to buy an EV is getting very easy with government subsidies in place which reduce cost to similar price point.
My 2 top choices to replace my minivan are:

www.royalnickel.com 21
Nickel & EVs: FACT Demand Driven by Higher Energy Density, Lower Costs
Nickel will make up an increasing proportion of battery materials driven simply by need for higher energy density and lower costs (Tesla batteries already 80% nickel)
Source: Vale presentation, October 2017
Given safety concerns for use in handheld devices and automobiles, development cycles for new batteries are very long – no other technologies on near-term horizon

www.royalnickel.com
Nickel & EVs: NO SHORTAGE OF NICKEL SULPHATE
The assertion that there will be future shortages of nickel sulphate is ludicrous. Chinese refined production of cobalt (mostly cobalt salts) increased by 6X in just 3 years to more than 20% of global refined production.
22
0
2,000
4,000
6,000
8,000
10,000
12,000
14,000
2002 2003 2004 2005
Chinese Refined Cobalt Production (kt)
2002-2008
In many, many, many commodities, China has very quickly added 2-3X the capacity the market requires for many semi processed materials
- Steel
- Alumina
- Aluminum
- NPI
- Cobalt products
NICKEL SULPHATE WILL BE NO EXCEPTION !

www.royalnickel.com
Nickel & EVs NO SHORTAGE OF CLASS I NICKEL
Over 20% of total nickel supply and almost 40% of existing Tier 1 nickel currently ends up in stainless steel – only a tiny fraction of this purity is actually required by the stainless producer.
Very easy to take saprolite feed to a Tier 1 nickel feed (PT Inco has produced nickel matte for nearly 40 years)
Add a converter to existing NPI flowsheet
Add sulphur
Slag iron off
Produce high grade matte (high grade feed for nickel sulphate producer)
23

www.royalnickel.com
Nickel Price Cycle Analysis — Explosive Price Moves
24
Nickel price moves have always been explosive even without China. Again, why would it be different this cycle, particularly when major new source of demand is emerging (with few substitutes) Remember that a 150-300% price increase from a $3.50 trough is $9-$14 per pound!
84%
595%
157% 184% 301%
371%
221%
0%
100%
200%
300%
400%
500%
600%
700%
Q4 1982Q2 1985
Q1 1987Q1 1988
Q3 1993Q1 1995
Q4 1998Q1 2000
Q4 2001Q1 2004
Q4 2005Q2 2007
Q4 2008Q1 2011
Q1 2016?
Nickel Price Increase (Trough to Peak)
Trough
Peak
Source: MetalPrices.com, RNC analysis
150%=$8.75
300%=$14.00
84%=$6.44

www.royalnickel.com
Molybdenum - “Groundhog Day” for Several More Years…
China continues to be largely self-sufficient in molybdenum as supply growth largely keeps pace with demand growth even at current price levels
China should continue to dominate molybdenum demand growth (~100% of world growth) as China moves into higher value added products
As a result, little to no ROW demand growth and little call on molybdenum units from China
Even in scenario where ROW demand does grow, substantial shut-in capacity (Thompson Creek, FCX) and by-product copper growth will keep market well-supplied
25
For next several years, molybdenum prices will remain “pinned” into the cost curve well below $10/lb. Prices moved higher in 2017 above $8/lb driven by strong growth in stainless steel production; however Chinese production has already responded (up 14% August YTD).

www.royalnickel.com
Molybdenum - Prices
As expected, moly prices did rally back over $8/lb as stainless steel rebounded in 2017, but remained well below $10/lb
26
Molybdenum Prices ($/lb) 1978 to date (U.S. moly oxide)
Source: Metalprices.com
0
5
10
15
20
25
30
35
40
45
50
• Cancellation of
Chinese shipments
• Boom in iron and
steel industries
• Rising demand
from new uses
• Restricted supply
• Strong global demand
• Chinese mine closures
offset ROW increases
• Limited roasting capacity

www.royalnickel.com
Molybdenum Demand China Likely >100% of Demand Growth
27
53% 50%
37%
0%
10%
20%
30%
40%
50%
60%
Stainless Steel Production Steel Production Molybdenum Demand
Chinese Global Share 2017f
Source: CRU, Macquarie
China should dominate molybdenum demand growth as it moves up value add product curve and should approach similar share of world demand as in carbon steel and stainless steel

www.royalnickel.com
-8,000
-6,000
-4,000
-2,000
0
2,000
4,000
6,000China – Net Moly Exports (kt)
(adjusted for concentrate imports)
Source: GTIS, RNC Analysis
Molybdenum – China Remains Largely Self-Sufficient
China remains largely self-sufficient with no clear call on molybdenum units from ROW (YTD Q3-2017 a small net exporter). Prices > $8/lb sufficient to generate Chinese supply response (2017 production up 14% YTD August)

www.royalnickel.com
Nickel
Nickel prices to climb higher towards a mid 2018 peak. Prices supported both fundamentally and by investor interest in longer-term EV story
Nickel demand growth to continue, but at a slower pace than in 2017
Nickel demand will grow in both China and ROW
Nickel supply to grow solely from NPI in Indonesia and China
Market will remain in deficit, but smaller than in 2017
Molybdenum
Molybdenum prices will remain “pinned” into the cost curve below $10/lb
Molybdenum prices to retreat towards $6/lb as stainless cycle slows and Chinese supply response works through market
29
2018 Forecast

RNC – Focused on Value Creation
Reed Mine (30%) RNC-Waterton Nickel Joint Venture
Massive exploration potential - known gold showings over 4 km strike, open in three directions, limited exploration at depth
Ramping up gold production in 2017: 50-60koz, net AISC declining to target US$900-1000 by Q4
Infrastructure in place to support much larger gold operation
Copper Producer
2017 Production Guidance: Copper: 4.0-5.0 kt; Gold: 0.8-1.1 koz (30% basis)
Low cost production, 2016 AISC US$1.49/lb
Ongoing cash flow from January 2017
RNC - Waterton 50/50 JV to advance Dumont and grow nickel business with $US 35 MM cash
Dumont Nickel Project: structurally low cost, large scale, shovel ready
3rd largest nickel reserve in the world, 5th largest nickel sulphide discovery ever
One of largest cobalt resources outside Africa
High grade gold exploration projects in Northern Quebec and U.S. Carolina Gold Belt
Successful 2017 drill program: multiple high-grade gold drill intersections up to 13.7 g/t, five new surface discoveries up to 457 g/t Au confirm 40-km high-grade “Qiqavik break” gold system
Exploration to begin in Carolina Gold Belt properties
Trading as ORM on TSX-V
Western Australia Quebec, Canada Quebec and Carolinas Manitoba, Canada
Beta Hunt Mine Gold, Nickel Producer
Orford Mining (~55%) Exploration Spin-Out
30

31
Unique Partnership with Waterton
Well-Funded Joint Venture Arrangement to Create and Unlock Value within the Global Nickel Industry
RNC Minerals and Waterton 50/50 joint venture limited partnership (“JV Entity”) to advance Dumont and acquire high quality nickel assets globally
Strong Partnership
Focused on Nickel
Advancement of Dumont
Well-Funded Funded with US$35M in capital commitments to develop Dumont and acquire additional nickel assets, and backed by Waterton’s two largest funds with a total of US$1.725B in committed capital
The joint venture’s objective is to establish a pure play nickel company with multiple projects operating in stable jurisdictions
Waterton’s acquisition of 50% of Dumont for US$22.5 million (C$30 million) in cash valuing Dumont at C$60 million. Provides funding to continue to advance Dumont.

www.royalnickel.com 32
RNC – Waterton Joint Venture First of its Kind Platform for Growth
Unlocking value in Dumont through a strategic joint venture partnership
JV Entity
100% interest in Dumont
US$35 million in capital commitments
US$5 million to continue to advance Dumont
US$30 million to acquire additional nickel assets
50% 50%

Dumont Nickel Project Structurally Low Cost Project in Excellent Jurisdiction
33

RNC’s Dumont Nickel Project: A Billion Dollar Opportunity
Source: Company reports and Wood Mackenzie Ltd. (December 2011); RNC 105ktpd (LOM) vs 2012 production for other projects
34

Dumont One of Largest Nickel Sulphide Discoveries Ever and Largest Since 1960
RNC’s Dumont Project
Source: Vale presentation at the Metal Bulletin 3rd International Nickel Conference , London, April 29, 2015
35

Dumont – RNC’s Nickel Roasting Approach A Significant Breakthrough
Ferro-nickel puck produced from
Dumont concentrate
Significant potential benefits to producers of suitable nickel sulphide concentrate feed such as RNC’s Dumont Project:
Lower costs due to simpler processing compared to traditional smelting and refining
Higher payabilities than traditional smelting and refining
Greater flexibility for more potential partners and customers
Roasted nickel concentrate is effectively a very high grade laterite ore feed – creates new source of demand for nickel sulphide concentrate, notably at a time when many NPI and ferronickel producers face feed shortages as a result of Indonesia’s nickel ore export ban
RNC’s strategic alliance with Tsingshan led to the development of the first integrated nickel pig iron (“NPI”) plant to directly utilize nickel sulphide concentrate as part of the stainless steel production process through concentrate roasting
24

37
Dumont - World Class Cobalt Potential
1.6
1.1 1.0
0.9 0.9
0.7
2016 North American Cobalt Production by Operation
(ktpa)
386
230
114
60 27 13
Reserve
Contained Cobalt Resource by Operation (kt)
Company or Project Market Cap (US$) Clean Teq 429
eCobalt Solutions 119
Havilah Resources 89
Dumont (Implied) 45
Ardea KNP 29
* Based on 2013 Dumont Feasibility Study; Source: Company reports; market capitalizations as of March 30, 2017
Cobalt projects are receiving significant market attention - Dumont is a shovel ready project that hosts one of the largest cobalt resources outside of Africa and would be the largest cobalt miner in North America once in production*
126

www.royalnickel.com 38
Notes

www.royalnickel.com 39
Corporate Overview
Share Structure1:
Basic Shares Outstanding1: 307.3 million Convertible (price: US$0.1912 (C$0.2573))2 63.2 million Options (ave. exercise price: C$0.41) 27.8 million Warrants (exercise price: C$0.39) 3 28.9 million Deferred/Restricted Share Units 5.0 million Contingent Shares 7.0 million
Fully Diluted Shares Outstanding: 439.2 million
Directors and Officers Share Ownership: ~4% Large Shareholders: Eric Sprott ~9% Westgold Resources Limited ~8%
Balance Sheet Highlights: Cash and Cash Equivalents4: C$24.5 million Market Capitalization1: C$56.8 million
1. Shares outstanding, fully diluted shares outstanding, shareholdings and market capitalization as at August 10, 2017 2. Assumes maximum conversion of 75% of US$10M principal into RNC common shares; US/C $ exchange rate as at June 7, 2017 and conversion of US$4 million principal and interest into RNC
common shares ; US/C $ exchange rate at September 18, 2017 3. 16.5 million warrants @ C$0.49, 5.9 million warrants @ C$0.24, 5.0 million warrants @ C$0.25 and 1.5 million compensation warrants @ C$0.41 4. Cash and cash equivalents as at June 30, 2017