nico larco suburbia shifted japr submission for dist · such as fannie mae and freddie mac began...
TRANSCRIPT

Suburbia Shifted: Overlooked Trends and Opportunities in Suburban Multifamily Housing Nico Larco Department of Architecture 1206 University of Oregon Eugene, OR 97403-1206 [email protected] Nico Larco is an Assistant Professor of Architecture at the University of Oregon. © Copyright Nico Larco, 2007 Research generously supported in part through a grant from the University of Oregon, Department of Architecture. Publication Forthcoming in: Journal of Architectural and Planning Research (2008). Please do not copy without author's permission.

Larco - 1
Suburbia Shifted: Overlooked Trends and Opportunities in Suburban Multifamily Housing Abstract
Planners, policymakers, and the general public have largely overlooked the proliferation of multifamily housing in suburbia and in doing so have failed to engage an existing and widespread example of suburban density. While suburban multifamily housing is the largest growing housing market in the country, it is relatively absent from planning and policy literature regarding suburbia. In this paper I reintroduce suburban multifamily housing and use the 1997 through 2005 American Housing Survey (AHS) National Microdata to analyze the demographic composition and transportation behavior of its residents. The findings counter widely held views of suburban multifamily housing and suggest that many of the barriers to its development are largely unfounded. In addition, the findings reveal that much of the highly publicized rise in suburban diversity is actually occurring in this housing type. The AHS analysis also shows that suburban multifamily housing is contributing to smart growth goals as it places density near commercial areas and houses a population that makes a significant percentage of non-auto oriented trips. Instead of continuing to privilege the single-family home while zoning out and reacting against suburban multifamily development, planners and policymakers should embrace the growing suburban multifamily housing trend and capitalize on its potential role in promoting suburban smart growth.
Larco - 2
Introduction
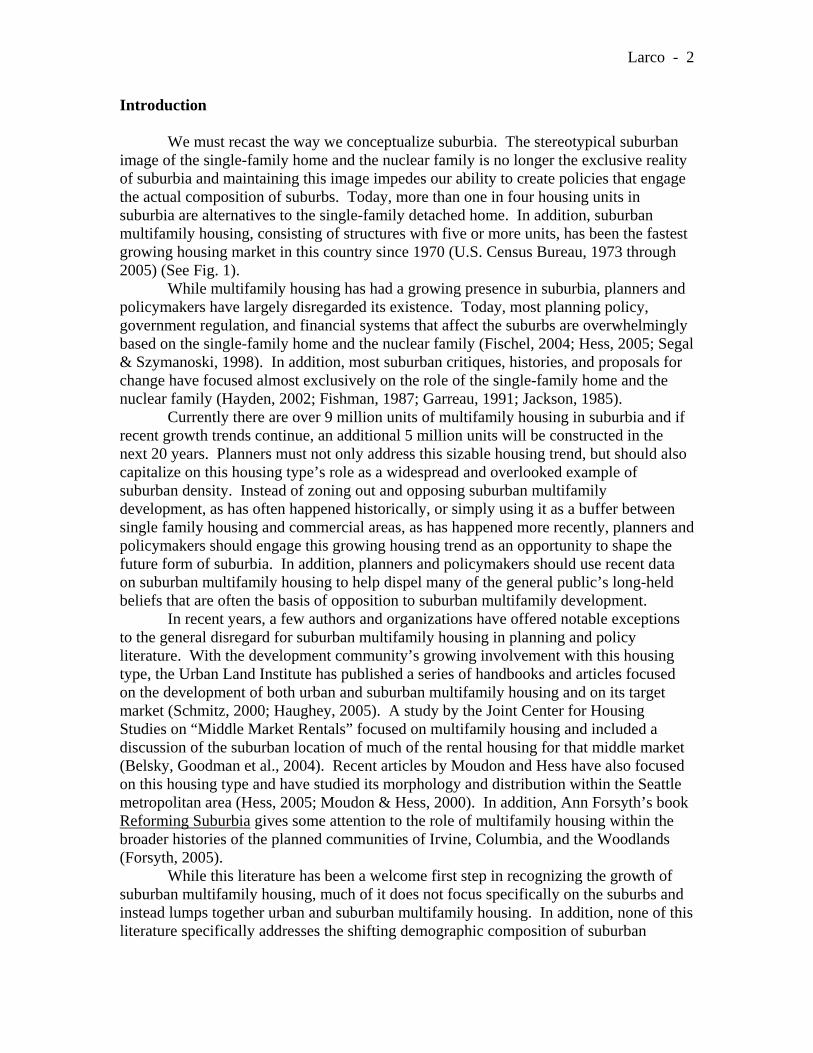
We must recast the way we conceptualize suburbia. The stereotypical suburban image of the single-family home and the nuclear family is no longer the exclusive reality of suburbia and maintaining this image impedes our ability to create policies that engage the actual composition of suburbs. Today, more than one in four housing units in suburbia are alternatives to the single-family detached home. In addition, suburban multifamily housing, consisting of structures with five or more units, has been the fastest growing housing market in this country since 1970 (U.S. Census Bureau, 1973 through 2005) (See Fig. 1).
While multifamily housing has had a growing presence in suburbia, planners and policymakers have largely disregarded its existence. Today, most planning policy, government regulation, and financial systems that affect the suburbs are overwhelmingly based on the single-family home and the nuclear family (Fischel, 2004; Hess, 2005; Segal & Szymanoski, 1998). In addition, most suburban critiques, histories, and proposals for change have focused almost exclusively on the role of the single-family home and the nuclear family (Hayden, 2002; Fishman, 1987; Garreau, 1991; Jackson, 1985).
Currently there are over 9 million units of multifamily housing in suburbia and if recent growth trends continue, an additional 5 million units will be constructed in the next 20 years. Planners must not only address this sizable housing trend, but should also capitalize on this housing type’s role as a widespread and overlooked example of suburban density. Instead of zoning out and opposing suburban multifamily development, as has often happened historically, or simply using it as a buffer between single family housing and commercial areas, as has happened more recently, planners and policymakers should engage this growing housing trend as an opportunity to shape the future form of suburbia. In addition, planners and policymakers should use recent data on suburban multifamily housing to help dispel many of the general public’s long-held beliefs that are often the basis of opposition to suburban multifamily development.
In recent years, a few authors and organizations have offered notable exceptions to the general disregard for suburban multifamily housing in planning and policy literature. With the development community’s growing involvement with this housing type, the Urban Land Institute has published a series of handbooks and articles focused on the development of both urban and suburban multifamily housing and on its target market (Schmitz, 2000; Haughey, 2005). A study by the Joint Center for Housing Studies on “Middle Market Rentals” focused on multifamily housing and included a discussion of the suburban location of much of the rental housing for that middle market (Belsky, Goodman et al., 2004). Recent articles by Moudon and Hess have also focused on this housing type and have studied its morphology and distribution within the Seattle metropolitan area (Hess, 2005; Moudon & Hess, 2000). In addition, Ann Forsyth’s book Reforming Suburbia gives some attention to the role of multifamily housing within the broader histories of the planned communities of Irvine, Columbia, and the Woodlands (Forsyth, 2005).
While this literature has been a welcome first step in recognizing the growth of suburban multifamily housing, much of it does not focus specifically on the suburbs and instead lumps together urban and suburban multifamily housing. In addition, none of this literature specifically addresses the shifting demographic composition of suburban
Larco - 3
multifamily housing or its role in the general development and demographic composition of suburbia.
Specifically acknowledging and addressing suburban multifamily housing development leads us to re-evaluate a number of current planning and policy issues. First, we must identify the planning and policy barriers to suburban multifamily development and weigh them against the actual impacts of this housing type. Second, we must revisit claims of a shifting general suburban demographic in light of potentially uneven change based on housing type. Third, we must investigate the potential role of suburban multifamily housing and its associated demographic as a catalytic element of suburban smart growth. Figure 1: 1970-2005 Housing Growth by Type and Location
0%
20%
40%
60%
80%
100%
120%
140%
160%
180%
200%
200520011997199319891985198119771973Year
Perc
ent G
row
th F
rom
197
0
Suburban MultifamilySuburban Single-Family DetachedCentral City Single-Family DetachedCentral City Multifamily
Source: 1973-2005 American Housing Survey, U.S. Census Bureau
In this paper I briefly track the historical trajectory of suburban multifamily development, looking at both regulatory and financial policy that has affected its growth in the last century. I then present current models of suburban multifamily housing and analyze its associated demographic. This demographic analysis is based on the 1997 through 2005 American Housing Survey National Microdata and uses the survey to study family type, race, immigration, tenure, moving preferences, and transportation behavior.

Larco - 4
Based on this analysis, I end with a description of planning and design issues that address the overlooked reality of suburban multifamily housing and its implications for the future development of suburbia. Growth Amid Opposition: Historic Barriers of Regulation and Finance Suburban multifamily construction increased considerably during the middle of the 20th century as baby boomers came of age and the national household formation rate skyrocketed. During the period between 1955 and 1963, suburban multifamily production more than quadrupled (Schafer, 1974). This laid the foundation for the proliferation of suburban multifamily housing which today comprises approximately 14% of all suburban housing (U.S. Census Bureau, 1973 through 2005).
While suburban multifamily housing saw considerable growth in the second half of the last century, it faced considerable regulatory and financial barriers for most of the early part of the century. In the landmark 1926 zoning case of Euclid v. Ambler Realty the Supreme Court specifically addressed construction of multifamily housing in a single-family housing area. The Court justified excluding apartments by citing previous opinions which describe apartment houses as ‘a mere parasite’ and ‘very near to being nuisances’ ("Village of Euclid, Ohio v. Ambler Realty Co.," 1926).
Multifamily housing developed an entrenched secondary standing in suburbia in the middle of the 20th century largely due to the U.S. Senate hearings on housing chaired by Senator Joseph McCarthy in 1947. In these hearings McCarthy and other proponents of single-family housing development lumped public financing, multifamily housing, and rental housing together as a single option and proceeded to demonize and limit its development. These debates strengthened, in the minds of many Americans, an unfounded link between multifamily housing, public housing, and the stigma of poverty. This led to the amplification of government regulatory and financial policies that promoted the detached single-family developments that have become the dominant image of the suburbs (Baxandall & Ewen, 2000). These policies, in turn, significantly limited multifamily suburban production between the 1940’s and mid 1950’s (Schafer, 1974).
Early exclusionary zoning policies in many suburbs kept multifamily housing out of suburban areas by setting minimum lot sizes and restricting building types. Multifamily housing advocates started to overturn this practice through a series of legal battles that climaxed in the Mt. Laurel cases in New Jersey in the late 1970’s and early 1980’s. The primary argument against exclusionary zoning was the right to affordable housing in all communities (See Babcock, 1973; Fischel, 2004; and Haar, 2000 for an overview of exclusionary zoning). While today courts consistently rule against overt exclusionary zoning that is based on limiting access to specific populations, more covert forms of exclusionary zoning persist. This zoning continues to limit the development of multifamily housing, especially for low-income populations (Downs, 1992).
Reasons for this exclusionary zoning are largely based on a perception by planners and the general public that multifamily housing reduces adjacent property values and creates service burdens for local jurisdictions (Fischel, 2004). While this sentiment is pervasive in communities throughout the country, it is often not based on any empirical data on suburban multifamily development or its residents.

Larco - 5
A number of recent studies have shown that multifamily housing is not a de facto detriment to adjacent property values and actually often has a positive effect. These studies find that the degree of positive or negative effect on property value is largely due to multifamily housing design and integration with the local context (Moody & Nelson, 2003; Nguyen, 2005). This points to a need for appropriate design review or guidelines instead of the absolute dismissal of this housing type.
Financial structures have historically favored single-family development over multifamily development. Government creation of the secondary mortgage market for single-family homes and mortgage related tax deductions for single-family home owners made investment in single-family housing much more attractive than multifamily housing in the middle part of the 20th century. This severely limited the availability of capital for multifamily development with most of this development financed by thrifts and savings banks until the mid-1980’s.
In the late 1970’s federal policy changed and government sponsored enterprises such as Fannie Mae and Freddie Mac began investing in multifamily mortgages with heavily increased investment occurring in the mid 1980’s (Murray & Judy, 1978; Schnare, 2001). This increase has continued and in 2005 Fannie Mae invested $25.6 billion in multifamily housing which represents approximately a 1000% increase in their multifamily investment over the previous 10 years. This far outpaces growth in their single-family home investment and assists the proliferation of multifamily housing throughout the country (Fannie Mae, 1999, 2006).
While regulatory and financial barriers have significantly decreased in the last half century, some of these barriers still persist. It is critical that planners and policymakers develop an accurate understanding of suburban multifamily housing development and its residents to correctly assess the validity of existing barriers and can engage the potential of this housing type in shaping the future form of suburbia. An important first step is to identify the different forms of suburban multifamily housing and analyze the demographic composition and transportation behavior of its residents. Suburban Multifamily Housing Types
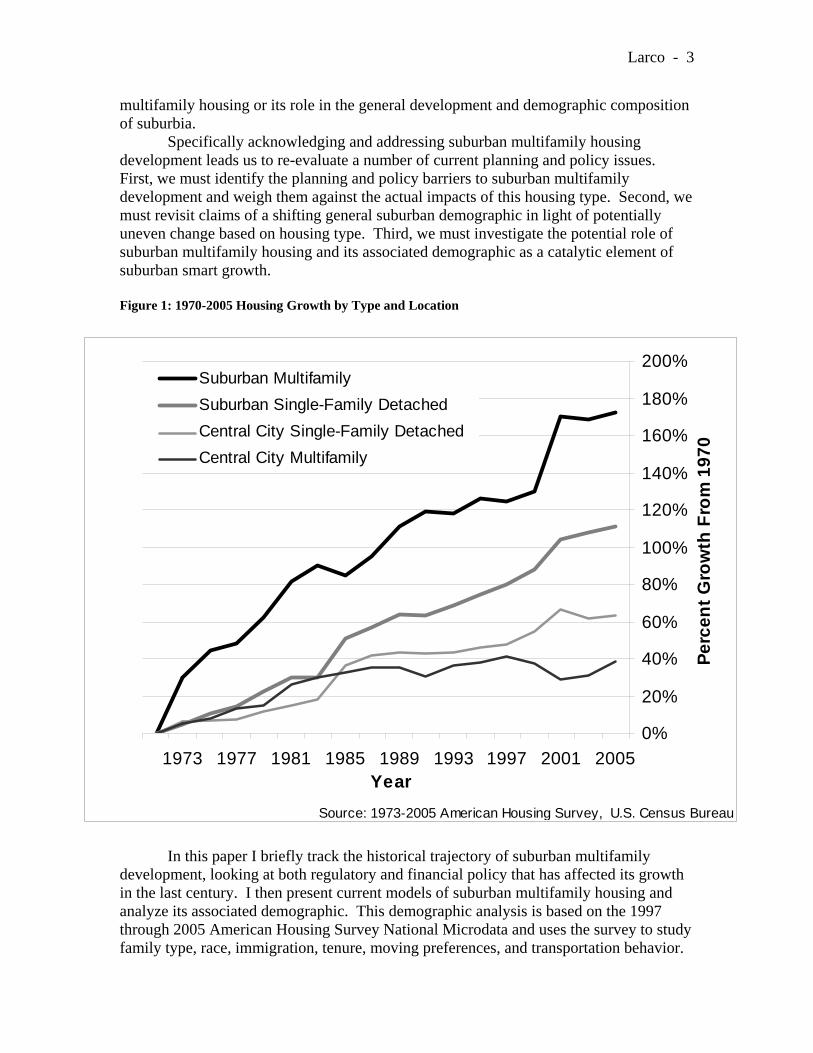
Due to codes, market demand, and economic realities, suburban multifamily housing typically follows one of three typological models throughout the country. By far the most prevalent model is the ‘garden apartment/condominium.’ This housing type is typically two to three stories in height, usually without elevators, often has an exterior entry for each unit, and includes integral parking and open space (See Fig. 2 - 4). Due to the development of fairly consistent building codes across the country, especially in terms of fire safety and accessibility standards, the three story height is rarely exceeded in this model. Similarly, due to land cost, construction costs, and rental rates, these units are rarely less than two stories tall.
Larco - 6
Figure 2: Typical Suburban Multifamily Housing (clockwise from upper left: Eugene, Oregon; Phoenix, Arizona; Sun Prairie, Wisconsin; Pleasanton, California)
Figure 3: Suburban Multifamily Site Plan, Pleasanton, California

Larco - 7
Based on housing density, these garden apartment/condominium developments are almost always in areas that have access to public sewer systems (U.S. Census Bureau, 1973 through 2005) and are often located near arterials (Peiser, 1989). These denser housing developments are frequently zoned near commercial and retail areas (Moudon & Hess, 2000) both reacting to economic demand and to create buffers between these areas and single-family homes. Reaching densities of up to 30 units per acre (similar to the average density of San Francisco), these housing developments are often multi-building and while primarily rentals, also exist as ownership communities.
Elderly housing is a second model of suburban multifamily housing and it has experienced significant growth in the last decade. This housing type differs from the garden apartment/condominium in that it almost universally has elevators, a reduced amount of parking, entry to units through a shared common interior space, and often includes group kitchen, dining, and recreational spaces. Because of the addition of the elevator and interior entry to units, this model of multifamily housing can often reach five or six stories in height (See Fig. 4).
Mixed-use lifestyle centers are a third model of suburban multifamily housing development which caters specifically to high end markets. This is a fairly recent development phenomenon which combines retail establishments, highly designed pedestrian environments, and multifamily housing in one, compact suburban location (See Fig. 5). This building type often includes elevators, has shared unit access through an enclosed lobby, and provides dedicated parking for residents separate from retail parking. Again, due to the addition of elevators and interior unit access, this model can reach five or six stories in height. This trend began as a strictly retail and commercial model but has added residential components, mimicking a historic main street typology (Gillem, 2006). Although this trend is in its infancy, the recent success of these developments coupled with the growth of the high-end apartment market (Goodman, 2001; Obrinsky, 2000) points to the potential for continued growth in this more affluent suburban multifamily housing market.
Figure 4: Suburban Elderly Housing in Figure 5: Lifestyle Center in Scottsdale, Arizona
Sun Prairie, Wisconsin

Larco - 8
Suburban Multifamily Housing: Who Lives Here?
Carl Horowitz in 1983 wrote what is today still the most comprehensive analysis of suburban multifamily housing. He found that specific demographics such as young singles, couples without children, the elderly, and the divorced were attracted to this housing type. These demographic groups were interested in suburban multifamily housing due to its affordability, reduced maintenance requirement, and the increased ease it offered in changing places of residence. He found that while many individuals preferred to live in the suburbs due employment opportunities or personal connections, their life situations did not lend themselves to living in detached single-family homes.
Aside from this study, researchers have largely grouped all housing types in their analysis of suburbs and then discussed research outcomes implicitly in terms of single-family home development. With the large and growing amount of multifamily housing in suburbia, this approach overlooks potential differences between multifamily and single-family development and blurs a more fine tuned analysis of changes in suburban populations. Separating out single-family and multifamily units, the two most dominant housing types in suburbia, provides an opportunity to analyze their differences in regards to residents’ preferences, demographics, and transportation behavior. Methods
The data used in this analysis comes from the 1997 through 2005 American Housing Survey (AHS) National Microdata. The AHS describes suburbs as being within metropolitan areas but outside of central cities. In this study I compare demographic characteristics of residents in two types of suburban housing: detached single-family homes and multifamily housing (building with five or more units). In the 2005 AHS there are 15,397 cases of suburban detached single-family housing and 3,480 cases of suburban multifamily housing. I have excluded attached single-family home units or buildings with two to four units in my analysis as these are a smaller percentage of suburban housing and reflect characteristics that are somewhere between detached single-family housing and multifamily housing.
The demographic characteristics explored in this study include family type, race, immigration, income, education, age, transience, reasons for moving, and transportation behavior. I have weighted all data so that it is nationally representative and calibrated with the 1990 census. In cases of analysis which look at data from the 1997 through 1999 AHS, the data is calibrated with the 1980 census. I conduct basic bivariate statistics on un-weighted totals to examine the difference in demographic characteristics between residents in detached single-family homes and multifamily housing. Family Type
Suburban multifamily housing has a significantly different distribution of family types than detached single-family housing. More than half (57.6%) of the households in suburban multifamily housing are made up of singles, widowed, or divorced individuals

Larco - 9
without children. This represents almost one quarter of all suburban households with this demographic. The dominant suburban stereotype of ‘married with children’ comprises only 12.5% of suburban multifamily households and 32.8% of single-family households (See Table 1). As opposed to detached single-family units, multifamily units have a large percentage of individuals living alone (45.3%) or with non-relatives (10.8%).
This difference in family type composition leads to a drastically lower percentage of school age children in suburban multifamily housing as compared to single-family housing. According to the AHS, every unit of suburban detached single-family housing adds on average .70 school age residents to a neighborhood while suburban multifamily units add .35 school age residents per unit.
Table 1: Family Structure, Living Situation, and School Age Children
Source: 2005 American Housing Survey National Microdata, U.S. Census Bureau Total numbers vary due to missing data, ‘not applicable’ answer, or refusal to answer question
Percentages may not add up to zero due to rounding
Race, Ethnicity, and Immigration
Suburban multifamily housing is significantly more diverse in terms of race and ethnicity than suburban single-family detached housing (See Table 2). Minority householders make up 25.5% of multifamily households as opposed to only 12% of single-family households. In addition, 14.1% of multifamily householders are Hispanic, almost twice the percentage found in single-family detached suburban households. These
Detached Single-Family Suburban Housing
Multifamily Suburban Housing (5+ units/bldg)
Weighted Number of Units
% of Total
Weighted Number of Units
% of Total
Family Structure Married w/ Children 11,750,772 32.8% 862,850 12.5%Married w/out Children 12,436,446 34.7% 1,083,947 15.7%Non-Family (Single/widowed/divorced w/out children) 8,706,166 24.3% 3,983,798 57.6%Other Family (Single/widowed/divorced w/ children) 2,907,701 8.1% 988,393 14.3%
Total 35,801,085 100.0% 6,918,988 100.0%
Living Situation Living with Relatives 28,522,478 79.7% 3,033,589 43.8%Living with Non-Relatives 1,295,982 3.6% 747,992 10.8%Living Alone 5,982,624 16.7% 3,137,407 45.3%
Total 35,801,084 100.0% 6,918,988 100.0%
School Age Children/Unit Total School Age Children (5-18) 24,929,020 2,408,217 Total # of Units 35,801,084 6,918,988 # of School Age Children/Unit 0.70 0.35

Larco - 10
figures make suburban multifamily units resemble the diversity found in urban areas more than the homogeneity found in single-family detached suburban dwellings.
Although long term changes are difficult to track in the AHS because of changes to survey questions in the last ten years, shorter term analysis shows that multifamily housing accounts for a significant portion of the changing racial and immigrant composition of suburbia. In 1997 suburban multifamily housing accounted for approximately 13% of suburban housing. Between 1997 and 2001, however, it accounted for 23% of the growth of all non-white householders and 38% of the growth of Asian or Pacific Islander householders in specific. In contrast, suburban single-family households were 68% of suburban households, yet only accounted for 51% of the growth of non-white householders.
This trend is also consistent with regards to immigration. Twenty-one percent of multifamily suburban householders are immigrants and one third of these individuals are naturalized citizens. In contrast, only 10% of single-family householders are immigrants and 60% of these are naturalized citizens. Approximately 11.8% of the immigrant householders in the entire country and 28.9% of immigrant householders in suburbia live in suburban multifamily housing. Almost one third of all Thai householders and one quarter of all North African and Scandinavian householders in this country live in suburban multifamily housing. Mexicans, the largest immigrant group in the country, make up 5.4% of suburban multifamily householders and only 2.3% of single-family householders.
Multifamily housing also represents a large proportion of the change in the number of immigrant householders in suburbia. In 2001 suburban multifamily housing was approximately 14% of suburban housing yet between 2001 and 2005 it accounted for 30% of the total growth in suburban foreign born householders during this period. Age
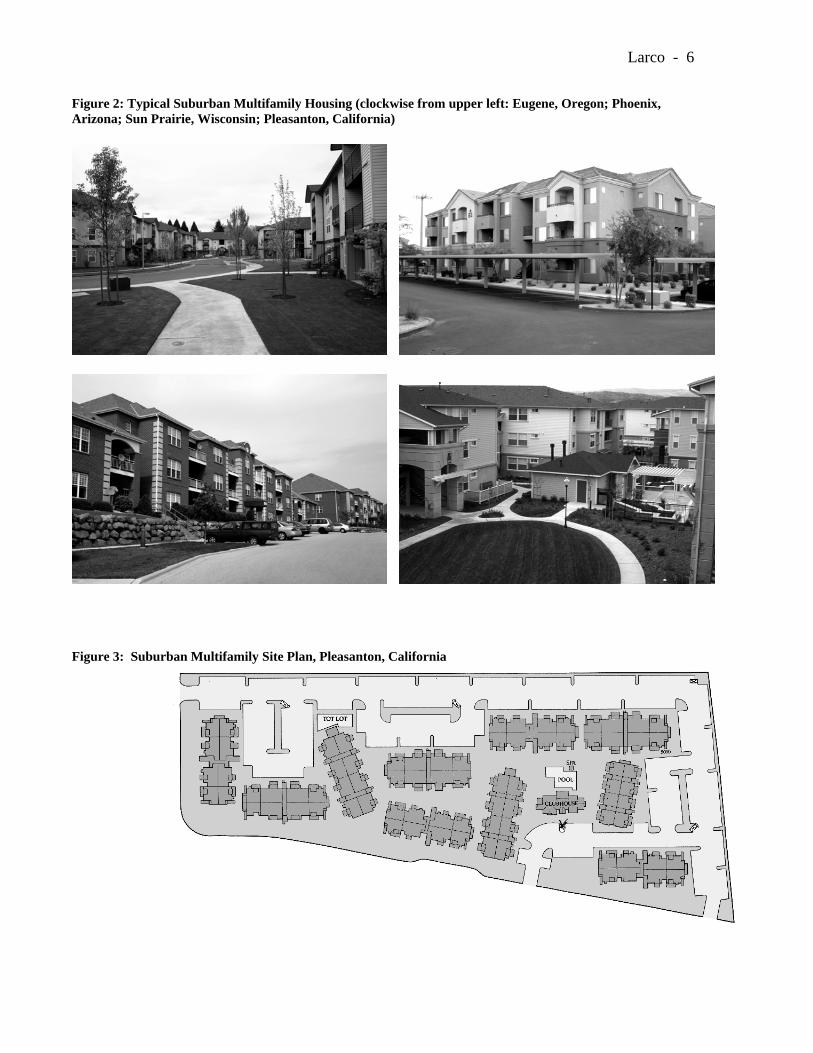
Suburban multifamily households have a significantly different age distribution of householders than detached single-family home households. In general, this distribution shows younger adults between 18-35 years of age and elderly adults over 80 years of age having a preference for multifamily housing (See Fig. 6).
With the aging of the baby boomer generation, the need for elderly housing has grown in this country as a whole (Blake & Simic, 2005). This growth can be seen in suburban multifamily housing as 14% of new units built since 2000 now house householders over 65 years of age. Not surprisingly, there are a larger overall number of multifamily housing units (508,595 units) than single-family units (447,625 units) in age restricted developments. In addition, over 11% of suburban multifamily housing units built since 2000 have been in age restricted developments.

Larco - 11
Table 2: Race, Immigration, and Age Detached Single-Family
Suburban Housing Multifamily Suburban
Housing (5+ units/bldg) Weighted
Number of Units% of Total Weighted
Number of Units% of Total
Race of Householder White Only 31,524,146 88.1% 5,158,294 74.6%Black Only 2,498,064 7.0% 1,202,532 17.4%Asian Only 1,166,024 3.3% 367,851 5.3%Other 612,849 1.7% 190,312 2.8%
Total 35,801,083 100.0% 6,918,989 100.0%
Spanish origin of householder Yes 2,920,840 8.2% 1,188,543 17.2%No 32,880,243 91.8% 5,730,445 82.8%
Total 35,801,083 100.0% 6,918,988 100.0%
US Citizenship of Householder Native born 32,149,519 89.8% 5,437,426 78.6%Foreign born, naturalized US citizen 2,200,757 6.2% 489,785 7.1%Foreign born, not a US citizen 1,450,809 4.1% 991,777 14.3%
Total 35,801,085 100.0% 6,918,988 100.0%
Age of householder 0 - 20 yrs old 220,121 0.6% 239,313 3.5%21 - 25 yrs old 697,828 2.0% 899,799 13.0%26 - 30 yrs old 1,872,645 5.2% 1,014,180 14.7%31 - 35 yrs old 3,066,281 8.6% 808,076 11.7%36 - 40 yrs old 3,982,429 11.1% 638,815 9.2%41 - 45 yrs old 4,814,515 13.5% 603,844 8.7%46 - 50 yrs old 4,455,222 12.4% 494,888 7.2%51 - 55 yrs old 3,957,897 11.1% 436,180 6.3%56 - 60 yrs old 3,370,763 9.4% 292,473 4.2%61 - 65 yrs old 2,635,181 7.4% 260,261 3.8%66 - 70 yrs old 1,980,602 5.5% 232,134 3.4%71 - 75 yrs old 1,691,778 4.7% 277,369 4.0%76 - 80 yrs old 1,398,819 3.9% 233,249 3.4%>80 yrs old 1,657,003 4.6% 488,406 7.1%
Total 35,801,084 100.0% 6,918,987 100.0%Source: 2005 American Housing Survey National Microdata, U.S. Census Bureau Total numbers vary due to missing data, ‘not applicable’ answer, or refusal to answer question
Percentages may not add up to zero due to rounding
Larco - 12
Figure 6: Age Distribution of Suburban Householders
0.0%
2.0%
4.0%
6.0%
8.0%
10.0%
12.0%
14.0%
16.0%
0 - 2
0
21 -
25
26 -
30
31 -
35
36 -
40
41 -
45
46 -
50
51 -
55
56 -
60
61 -
65
66 -
70
71 -
75
76 -
80 >80
Age of Householder
% o
f Wei
ghte
d To
tal
Multifamily Households
Detached Single-FamilyHouseholds
Income
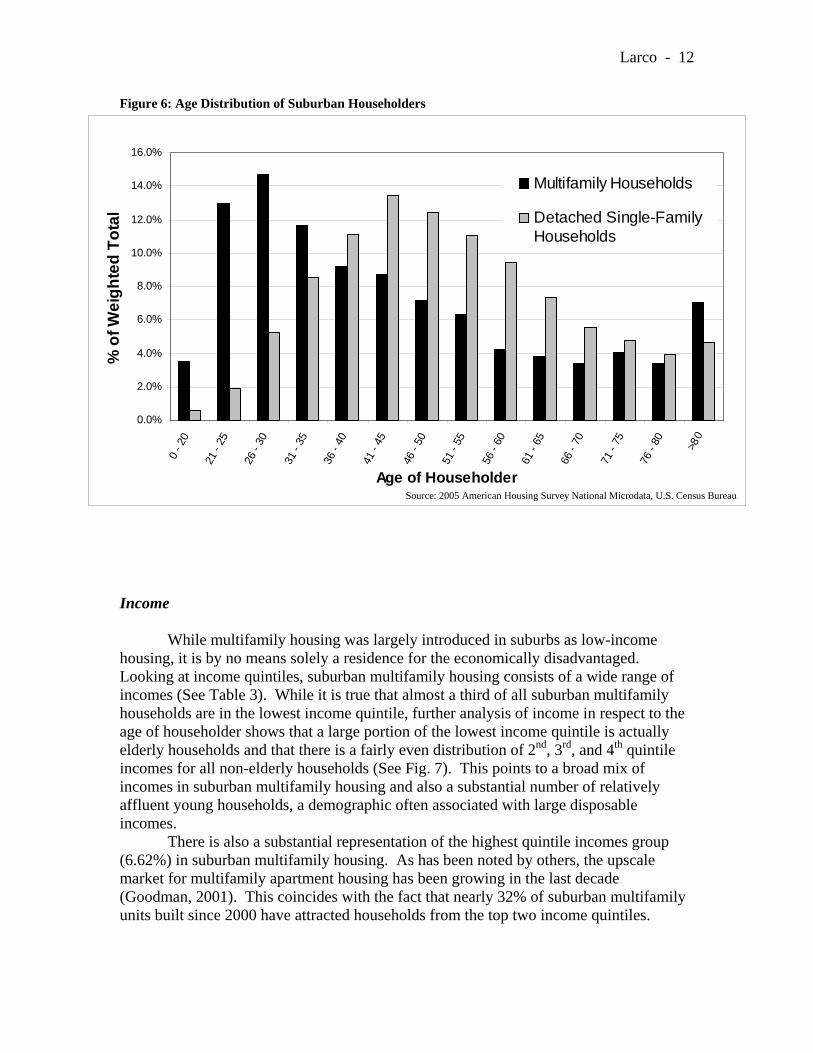
While multifamily housing was largely introduced in suburbs as low-income housing, it is by no means solely a residence for the economically disadvantaged. Looking at income quintiles, suburban multifamily housing consists of a wide range of incomes (See Table 3). While it is true that almost a third of all suburban multifamily households are in the lowest income quintile, further analysis of income in respect to the age of householder shows that a large portion of the lowest income quintile is actually elderly households and that there is a fairly even distribution of 2nd, 3rd, and 4th quintile incomes for all non-elderly households (See Fig. 7). This points to a broad mix of incomes in suburban multifamily housing and also a substantial number of relatively affluent young households, a demographic often associated with large disposable incomes.
There is also a substantial representation of the highest quintile incomes group (6.62%) in suburban multifamily housing. As has been noted by others, the upscale market for multifamily apartment housing has been growing in the last decade (Goodman, 2001). This coincides with the fact that nearly 32% of suburban multifamily units built since 2000 have attracted households from the top two income quintiles.
Source: 2005 American Housing Survey National Microdata, U.S. Census Bureau

Larco - 13
Table 3: Income and Education Detached Single-Family
Suburban Housing Multifamily Suburban
Housing (5+ units/bldg) Weighted
Number of Units % of Total
Weighted Number of Units
% of Total
Household Income (by 2005 Quintiles) Lowest Quintile: Less than $19,178 4,485,976 12.5% 2,122,054 30.7%2nd Quintile: $19,178 - $36,000 5,253,676 14.7% 1,902,657 27.5%3rd Quintile: $36,001 - $57,658 6,754,378 18.9% 1,420,339 20.5%4th Quintile: $57,659 - $91,705 8,667,298 24.2% 1,016,206 14.7%Top Quintile: More than $91,705 10,639,756 29.7% 457,732 6.6%
Total 35,801,084 100.0% 6,918,988 100.0%
Educational level of householder Less than High School Diploma 4,269,401 11.9% 1,133,138 16.4%High School Graduate - High School Diploma or equivalent (For Ex: GED)
9,008,978 25.2% 1,837,172 26.6%
Some college but no degree 6,157,132 17.2% 1,305,284 18.9%Diploma or certificate from a vocational, technical, trade business school beyond high school
1,113,920 3.1% 191,604 2.8%
Associate degree in college - Occupational/vocational program
1,534,652 4.3% 245,130 3.5%
Associate degree in college - Academic program
1,369,860 3.8% 274,603 4.0%
Bachelors degree (For Ex: BA, AB, BS) 7,834,200 21.9% 1,346,545 19.5%Master's Degree (For Ex: MA, MS, Meng, Med, MSW, MBA)
3,216,019 9.0% 400,443 5.8%
Professional School Degree (For Ex: MD, DDS, DVM, LLB, JD)
682,867 1.9% 62,671 0.9%
Doctorate Degree (For Ex: PhD, EdD) 614,053 1.7% 122,398 1.8%Total 35,801,082 100.0% 6,918,988 100.0%
Source: 2005 American Housing Survey National Microdata, U.S. Census Bureau Total numbers vary due to missing data, ‘not applicable’ answer, or refusal to answer question Percentages may not add up to zero due to rounding

Larco - 14
Figure 7: Suburban Multifamily Housing 2005 HH Income by Quintile Cross Tabulated with Age of Householder
0
50,000
100,000
150,000
200,000
250,000
300,000
350,0000
- 20
21 -
25
26 -
30
31 -
35
36 -
40
41 -
45
46 -
50
51 -
55
56 -
60
61 -
65
66 -
70
71 -
75
76 -
80 >80
Age of Householder
Wei
ghte
d N
umbe
r of H
H
Low est Quintile
4th Quintile
3rd Quintile
Top Quintile
2nd Quintile
Education
Suburban multifamily householders have a range of educational backgrounds that are similar to the education profiles of their detached single-family home neighbors (see Table 3). While as a whole multifamily householders are slightly less educated than detached single-family householders, both groups have relatively equal percentages of householders with associate, bachelors, masters, professional, and doctoral degrees. Over 57% of multifamily householders have completed at least some college. Renters/Owners
Over 83% of all multifamily housing in suburbia is rental housing and this represents almost half of the total rental housing stock in suburbia. In contrast, only 8% of single-family homes in suburbia are rentals. Renting is generally believed to be a circumstance of necessity, not of choice in this country. While this may have been true historically, there has been a definite shift in the attitudes of individuals. The National Housing Survey conducted by Fannie Mae reported that 41 % of individuals rented by choice in 2001. Renting by circumstance was drastically reduced in the latter half of the 1990’s with 69% doing so in 1996 compared to 51% doing so in 2001 (Fannie Mae, 2001).
Source: 2005 American Housing Survey National Microdata, U.S. Census Bureau

Larco - 15
Transience
The turnover rate for suburban multifamily housing is relatively high and this transience is often cited as one of the reasons for opposing suburban multifamily housing development. From the 2005 AHS, the median length of stay in a specific unit was 23 months for multifamily suburban households and 103 months for single-family homes, implying a much longer tenure rate for single-family homes. For the purposes of planning, however, a more transient population should not be confused with a changing demographic. While suburban apartment residents move much more often than single-family home residents, their units are often taken over by individuals with a similar demographic. Planners and policymakers can therefore look at the suburban multifamily population as somewhat consistent even though it is transient (Goodman, 1999). Reasons for Moving
The AHS asks residents who have moved during the last two years why they chose their neighborhood and unit. While this is not a comprehensive description of the preferences of all multifamily residents, because of the high turnover rate, this question covers over half of all suburban multifamily households. The single most reported criteria given by suburban multifamily residents for moving to their current neighborhood was ‘convenience to jobs’ with almost a third of all recent movers citing this reason (See Table 4). Consistent with the low rate of school age children, only 6% of suburban multifamily households cited good schools as the primary motivation for their neighborhood choice. In regards to unit choice, one third of recent movers reported financial reasons for choosing their specific multifamily housing unit. Interestingly, over 7% of recent movers reported that they chose their current unit because it was the only one available. This may point to a high demand and limited supply for this housing type in certain markets, a topic for further study.
Transportation
As with the profiles of residents described above, the transportation behavior of suburban multifamily housing residents is markedly different than those of single-family housing residents (See Table 5). The modal split of multifamily residents points to a much higher rate of non-private automobile use. 6.6% of multifamily versus 1.5% of single-family home residents used public transportation as their primary means of travel to work. This percentage of public transit use by suburban multifamily residents approaches the percentage of public transit use typically seen in urban areas (9.4%). In addition, 3.5% of multifamily versus 1.1% of single-family residents either biked or walked to work. Of those driving to work, 15.2% of multifamily residents drove with others while only 7.3% of single-family residents did so. Also, the median distance traveled to work was 17% lower for multifamily households (10 miles) than single-family households (12 miles).

Larco - 16
Table 4: Neighborhood Choice and Owner/Renter Status
Detached Single-Family Suburban Housing
Multifamily Suburban Housing (5+ units/bldg)
Weighted Number of Units
% of Total
Weighted Number of Units
% of Total
Owner/Renter Status of Unit Owned or being bought 32,494,952 90.8% 1,076,050 15.6%Rented for cash rent 2,855,098 8.0% 5,767,491 83.4%Occupied without payment of cash rent 451,033 1.3% 75,446 1.1%
Total 35,801,083 100.0% 6,918,987 100.0%
Main Reason This Neighborhood Was Chosen All reasons equal 155,370 2.9% 46,473 1.3%Convenient to job 704,497 12.9% 1,099,941 31.8%Convenient to friends or relatives 726,353 13.3% 538,833 15.6%Convenient to leisure activities 63,584 1.2% 55,288 1.6%Convenient to public transportation 19,225 0.4% 66,122 1.9%Good schools 616,861 11.3% 213,162 6.2%Other public services 35,008 0.6% 61,408 1.8%Looks/design of neighborhood 985,338 18.0% 445,946 12.9%House was an important consideration 1,240,116 22.7% 204,455 5.9%Other 911,784 16.7% 730,634 21.1%
Total 5,458,136 100.0% 3,462,262 100.0%
Main Reason This Unit Was Chosen All reasons equal 204,188 3.7% 55,430 1.6%Financial reasons 1,218,746 22.3% 1,163,402 33.6%Room layout/design 1,113,304 20.4% 568,542 16.4%Kitchen 43,023 0.8% 18,078 0.5%Size 811,499 14.9% 479,101 13.8%Exterior appearance 292,895 5.4% 115,275 3.3%Yard/trees/view 442,951 8.1% 111,352 3.2%Quality of construction 239,470 4.4% 71,148 2.1%Only one available 139,732 2.6% 257,397 7.4%Other 946,895 17.4% 624,891 18.0%Don't Know 4,568 0.1% 2,012 0.1%
Total 5,457,271 100.0% 3,466,628 100.0%Source: 2005 American Housing Survey National Microdata, U.S. Census Bureau Total numbers vary due to missing data, ‘not applicable’ answer, or refusal to answer question Percentages may not add up to zero due to rounding

Larco - 17
Table 5: Transportation Detached Single-Family
Suburban Housing Multifamily Suburban
Housing (5+ units/bldg) Weighted
Number of Units % of Total
Weighted Number of Units
% of Total
Method of Transportation to Work (for all HH members) Own Motorized Vehicle (Car, Truck, Van, Motorcycle) 76,170,913 94.0% 8,762,425 88.1%Public Transportation (Bus, Subway, Railroad) 1,204,056 1.5% 656,274 6.6%Bike or Walk 884,506 1.1% 349,142 3.5%Other (Taxi or Other) 397,466 0.5% 52,556 0.5%Works at Home 2,381,082 2.9% 122,000 1.2%
Total 81,038,024 100.0% 9,942,396 100.0%
Drive to Work Alone or With Others (for all HH members) Alone 71,540,784 92.7% 7,442,890 84.8%Go With Others 5,642,189 7.3% 1,329,862 15.2%
Total 77,182,973 100% 8,772,753 100%
Median Distance Traveled to Work Number of Miles 12 miles 10 miles
Someone in HH Uses Pub. Trans. at Least Once/Week Yes 1,571,880 4.4% 1,144,520 16.5%No 14,611,192 40.8% 3,983,029 57.6%Not applicable 19,466,181 54.4% 1,708,423 24.7%Don't Know 119,353 0.3% 69,275 1.0%Refused 22,566 0.1% 13,741 0.2%
Total 35,791,172 100.0% 6,918,988 100.0%
Number of Cars Kept for Use By HH Members
None 5,133,483 14.3% 1,765,358 25.5%One 15,379,934 43.0% 3,812,490 55.1%Two 11,048,997 30.9% 1,226,780 17.7%Three 3,218,212 9.0% 110,105 1.6%Four 761,387 2.1% 4,255 0.1%Five 259,071 0.7% - 0.0%
Total 35,801,083 100.0% 6,918,988 100.0%Source: 2005 American Housing Survey National Microdata, U.S. Census Bureau Total numbers vary due to missing data, ‘not applicable’answer, or refusal to answer question Percentages may not add up to zero due to rounding ‘Public Transportation Use at Least Once/Week’ question was filtered by 'number of people in unit' variable to separate a set of cases that have N/A as an answer for all AHS questions from cases that gave N/A only for this question. Doing this produced an 'n' value consistent with other results in this study.
While the AHS does not record modal splits for non-work related travel there is reason to speculate that a relatively large proportion of these are non-private auto trips. 16.5% of multifamily households said someone in the household used public transportation at least once a week. A majority (55.1%) of multifamily households only have one car and 24.5% of the households have no car at all. In addition, 48.0% of multifamily units reported having businesses or institutions within one half of a block and

Larco - 18
69.1% reported having a neighborhood store within 1 mile. This is in contrast to single-family housing where 14.7% had businesses or institutions within one half of a block and 54.7% have a neighborhood store within 1 mile. This reinforces the observation that many suburban multifamily developments are zoned around commercial areas. Implications for Planning, Policy, and Design
The data from the AHS describes suburban multifamily housing as a significantly different demographic and entity than single-family housing. This difference, along with the denser qualities of multifamily housing, should cause planners and designers to question a number of existing practices, beliefs, and policies in place today. A discussion of these issues related to development barriers, suburban diversity, and smart growth are described below. Barriers to Development
In addition to many of the regulatory and financial barriers to multifamily suburban development discussed earlier, there are a number of barriers that are a result of local planning concerns and popular misconceptions regarding suburban multifamily demographics and its associated transportation behavior. Multifamily suburban development is often opposed at the local level due to planners and residents’ beliefs that it will increase demand on local schools, require services for a low-income population, strain existing police and fire service, and put additional burden on transportation networks. The AHS analysis above suggests that all four of these arguments are largely unfounded.
Due to the significant difference in family composition, each unit of multifamily developments creates a smaller burden on schools than single-family development. Planners should consider this as they review multifamily development proposals and work on deriving both impact fees and the expansion needs of their educational systems.
In addition, while suburban multifamily housing is often more affordable than nearby single-family housing, this does not translate into multifamily housing being solely low-income housing. Planners, researchers, and community members should not casually interchange these two categories or their associated stigma. As multifamily housing is not necessarily for low-income or a less educated population it therefore does not automatically require the services associated with this demographic. Planners should work to untangle the stigma associated with multifamily housing as this stigmatization, tracing back to the middle of the last century, is often unfounded and creates a significant barrier to multifamily suburban development, affecting potential residents of all incomes.
The AHS analysis of transportation behavior suggests that per unit, multifamily housing is less of a burden on transportation networks than detached single-family housing. Multifamily householders travel shorter distances to work and a higher proportion of multifamily residents use public transit, walk, or bike. While multifamily housing does concentrate trip generation into a smaller area because of its inherently denser development, per unit it potentially reduces the impact on transport networks, minimizes traffic, and decreases maintenance and construction needs for a municipality. Although the data available through the AHS is not conclusive in regards to total household trip generation, it does suggest that suburban multifamily housing creates less

Larco - 19
auto trips per unit than single-family detached housing. While this topic is in need of further study, it suggests planners should endorse and not block this housing type when trying to encourage development that will promote mixed-modal transportation use.
Another barrier to suburban multifamily development is a disproportionately high property tax rate. A recent study by Goodman (2006) comparing the tax rates between single-family and multifamily housing found that multifamily housing often paid a significantly higher tax rate as related to property value. One reason suggested for this finding is that tax caps on single-family homes shift the tax burden to multifamily housing. In addition, multifamily housing is often rental housing and is taxed as a commercial business, raising its tax rate in comparison to single-family homes. As has been noted, multifamily households have less school age children and seem to have a smaller impact on local roads, two of the more costly responsibilities of local governments. This creates doubts about the equity of a higher tax rate on suburban multifamily housing and the unequal burden it places on multifamily development.
Planners must adjust inaccurate assumptions about multifamily housing and must educate their communities in order to remove barriers such as exclusionary zoning, inequitable impact fees, and disproportionate property tax. Doing so can allow planners and communities to engage the positive role this dense housing type can play in suburbia. A Changing Suburbia or Two Suburbias?
Currently there is a large body of literature that documents the changing demographic composition of suburbia in terms of family structure, race, ethnicity and immigration (Frey, 2003; Frey & Berube, 2002; Li, 2006; Lucy & Phillips, 2006). This literature describes a more diverse and potentially inclusive version of suburbia than what has previously existed and suggests associated policy and planning changes based on this shift. It is important to revisit some of this literature through the lens of housing type. While suburbia is changing, the AHS analysis shows that much of this change is occurring unevenly, creating two distinct demographic conditions in suburbia, one in multifamily housing and one in single-family housing. Suburban multifamily housing is significantly more diverse than single-family housing and accounts for a significant portion of the demographic shifts reported in suburbia.
The relationship between diversity and suburban multifamily housing begs the question of whether large scale suburban diversification actually translates into local scale spatial segregation based on housing type. If two worlds are being created in suburbia, what are the interactions between them, what benefits might arise, and what problems should we guard against? This is a topic that is beyond the scope of this article but is in need of future study. Suburban Smart Growth
While multifamily suburban development is rarely created under the banner of ‘Smart Growth’ or promoted by environmentally and socially progressive planners or designers, it contains many of the qualities and benefits of smart growth development. Suburban multifamily housing is dense, has mixed use adjacencies, and houses a population showing an inclination to use non-auto oriented transportation. These

Larco - 20
qualities need to be acknowledged so that planners, policymakers, and designers can shape policy and development to build upon the existing benefits of this housing type. The extent of existing suburban multifamily housing changes the debate on smart growth in suburbia. While studies have show a strong link between housing density and smart growth (see Danielsen, Lang, & Fulton, 1999 for an excellent overview), the prospect of bringing density to suburbia has historically been met with significant skepticism. Numerous authors have argued that the only housing type generally acceptable to the suburban market is low density single-family homes (Carliner, 1999; Easterbrook, 1999; Gordon & Richardson, 1997). At the same time, many who promote smart growth and denser development in suburbia consistently refer to preference surveys to argue for a latent desire in the general population for this development type (Danielsen et al., 1999; Ewing, 1997; Morrow-Jones, Irwin, & Roe, 2004; Myers, 2001).
Both sides of this debate overlook the fact that a large amount of dense housing development already exists in the suburbs and that the market for this housing type continues to grow. The question is not necessarily if density would be acceptable in suburbia, it already is. Instead, the focus should be on how density is implemented and how the existing demographic and physical composition of multifamily suburbia might relate to smart growth goals.
The fact that suburban multifamily housing developments are often located near commercial and retail land uses creates a condition where all the components of mixed use and compact development are in place. Due to regulation, a design and planning culture that is based on enclaved single-family development, and a lack of large scale coordination between developments, the actual design of these areas, however, is often disconnected and uninviting, limiting the potential synergy and interaction between uses and hindering smart growth goals (Hess, 2005; Moudon & Hess, 2000). Planners should modify outdated regulations and use the design review process to identify and encourage vehicular and pedestrian connections to adjacent areas.
The condition and existence of sidewalks, bike lanes, bike storage, and streetscape designs can significantly affect both the degree and safety of non-auto oriented modal split. While destinations might be close, the design of the physical environment might discourage non-auto trips or create safety concerns for those who choose alternative modes of transportation. Planners, developers, and designers need to keep the potential for these trips in mind as they develop multifamily housing and commercial proposals. This entails looking beyond the boundaries of a specific site when considering its design implications. Commercial areas and multifamily housing developments need to be coordinated either through developers or through planning departments to maximize the synergy of adjacent land uses.
In addition to bringing density to the suburbs, analysis of the AHS suggests that multifamily suburban households might also beneficially contribute to jobs/housing balance, a key smart growth issue. With almost 80% of jobs in metropolitan areas located in the suburbs (Glaeser, 2001), many of the individuals living in suburban apartments move there to minimize commutes to suburban employers and not necessarily for the stereotyped suburban lifestyle. This coincides with the fact that, in the AHS, multifamily households give ‘convenience to job’ as the single largest reason for choosing their current neighborhood. This also proved true in a separate survey done specifically on garden apartment residents where 38 % named proximity to work as the

Larco - 21
most important reason for choosing their community (Temkin, 1994). If proximity to employment is a primary motivator of suburban multifamily residents and this motivation alleviates jobs/housing balance, planners should prioritize and advocate for the development of multifamily units in locations that allow easy access to local commercial development.
Many of the traits of suburban multifamily housing development described above resonate with the newly piloted LEED-Neighborhood Development criteria (U.S. Green Building Council, 2007). Proposed as a measure of smart growth goals and created with the input of national smart growth organizations, this rating system can be used as an overlay to current suburban multifamily housing development practices. The LEED-ND criteria promote compact development, a diversity of uses, minimizing walking distances, and increasing access to the surrounding vicinity; all of these criteria either inherent to suburban multifamily housing or easily incorporated into this development type.
Suburban multifamily housing is an existing and growing typology that can contribute positively to smart growth goals. As such, it should be welcomed, acknowledged, and promoted by planners, policymakers, and designers that push for smart growth today. Conclusion
Planners, policymakers, and designers must re-adjust their understanding of suburbia to include an accurate depiction of multifamily housing. Although there have been a large number of studies dealing with the development and current condition of suburbia, this body of literature overwhelmingly excludes reference and discussion of the suburban multifamily housing sector. This sector is the largest growing housing market in the country and provides a widespread and overlooked example of density in suburbia. We must move beyond an antagonistic relationship with suburban multifamily housing as many of the barriers against it are unjustified. Multifamily housing does not necessarily reduce adjacent property values or cause increased burdens to local schools, transportation networks, or social services.
Suburban multifamily housing accommodates a demographic and lifestyle that is fundamentally different from the stereotypical single-family home segment of suburbia. It is far more diverse in terms of family type, race, and immigration and contains a large number of young and elderly householders. In addition, suburban multifamily residents move more often and have significantly different transportation behavior that leans towards non-auto use. Contrary to popular misconceptions and stigmatization, suburban multifamily householders have a wide range of income and education levels including a large number of affluent and highly educated residents. This shift in the residential make-up of suburbia suggests the need for us to shift our understanding of suburbia and, by extension, the direction of suburban policy and planning.
Suburban multifamily housing is an existing form of compact development that can contribute significantly to smart growth goals. Planners, designers, and researchers must move beyond the debate over whether density can exist in suburbia and instead focus on how it is implemented. Design and large scale coordination of multifamily

Larco - 22
developments will be critical to both the form and the future environmental impact of suburbia.
Ignoring the presence of multifamily suburban housing is not benign and it fails to capitalize on potential benefits associated with the continued development of this housing type. Planners, policymakers, and designers need to become aware of this overlooked reality to be most effective in guiding the future development of suburbs. References Babcock, R. (1973). Exclusionary Zoning: A Code Phrase for a Notable Legal Struggle.
In The Urbanization of the Suburbs (Vol. 7, pp. 313-328). Beverly Hills: Sage Publications.
Baxandall, R., & Ewen, E. (2000). Postwar Housing Politics: The McCarthy Hearings on Housing. In Picture Windows: How the Suburbs Happened (pp. 87-105). New York: Basic Books.
Belsky, E., J. Goodman, et al. (2004). Middle Market Rentals: Hiding in Plain Sight. Cambridge, MA, Joint Center for Housing Studies of Harvard University.
Blake, K. S., & Simic, A. (2005). Elderly Housing Consumption: Historical Patterns and Projected Trends. Washington, DC.: Dept. of Housing and Urban Development.
Carliner, M. S. (1999). Comment on Karen A Danielsen, Robert E. Lang, and William Fulton's 'Retracting Suburbia: Smart Growth and the Future of Housing'. Housing Policy Debate, 10(3), 549-553.
Danielsen, K. A., Lang, R. E., & Fulton, W. (1999). Retracting Suburbia: Smart Growth and the Future of Housing. Housing Policy Debate, 10(3), 513-540.
Downs, A. (1992). Regulatory Barriers to Affordable Housing. Journal of the American Planning Association, 58(4), 419-424.
Easterbrook, G. (1999). Comment on Karen A Danielsen, Robert E. Lang, and William Fulton's 'Retracting Suburbia: Smart Growth and the Future of Housing'. Housing Policy Debate, 10(3), 541-547.
Ewing, R. (1997). Is Los Angeles-Style Sprawl Desirable? Journal of the American Planning Association, 63(1), 107-125.
Fannie Mae. (1999). 1998 Annual Report. Washington DC.: Fannie Mae. Fannie Mae. (2001). Fannie Mae National Housing Survey 2001. Washington, D.C. Fannie Mae. (2006). NT 10-K, Federal National Mortgage Association submitted to
S.E.C. Washington DC.: Fannie Mae Fischel, W. A. (2004). An Economic History of Zoning and a Cure for its Exclusionary
Effects. Urban Studies, 41(2), 317-340. Fishman, R. (1987). Bourgeois Utopias: The Rise and Fall of Suburbia. New York: Basic
Books. Forsyth, A. (2005). Reforming Suburbia: The Planned Communities of Irvine, Columbia,
and The Woodlands. Berkeley, University of California Press. Frey, W. H. (2003). Melting Pot Suburbs: A Study of Suburban Diversity. In B. Katz &
R. E. Lang (Eds.), Redefining Urban and Suburban America: Evidence From Census 2000. Washington, DC: Brookings Institute Press.
Frey, W. H., & Berube, A. (2002). City Families and Suburban Singles: An Emerging Household Story from Census 2000. Washington, DC.: Brookings Institution.

Larco - 23
Garreau, J. (1991). Edge City: Life on the New Frontier. New York: Doubleday Books. Gillem, M. (2006). The New Main Street: Hyperconsumption and the Lifestyle Center,
The International Association for the Study of Traditional Environments Conference. Bangkok, Thailand.
Glaeser, E., Matthew Kahn, and Chenghuan Chu. (2001). Job Sprawl: Employment Location in U.S. Metropolitan Areas. Washington, DC: The Brookings Institution.
Goodman, J. (1999). The Changing Demography of Multifamily Rental Housing. Housing Policy Debate, 10(1), 31-57.
Goodman, J. (2001). The Upscale Apartment Market: Trends and Prospects. Washington, DC.: National Multi Housing Council.
Goodman, J. (2006). Houses, Apartments, and the Incidence of Property Taxes. Housing Policy Debate, 17(1), 1-26.
Gordon, P., & Richardson, H. W. (1997). Are Compact Cities A Desirable Planning Goal? Journal of the American Planning Association, 63(1), 95-107.
Haar, C. M. (2000). Suburbs Under Siege: Race, Space, and Audacious Judges. Princeton, NJ: Princeton Univeristy Press.
Haughey, R. M. (2005). Higher-Density Development: Myth and Fact. Washington, DC, Urban Land Institute.
Hayden, D. (2002). Building Suburbia: Green Fields and Urban Growth, 1820-2000. New York: Pantheon.
Hess, P. M. (2005). Rediscovering the Logic of Garden Apartments. Places, 17(2), 30-35. Horowitz, C. F. (1983). The New Garden Apartment. New Brunswick, New Jersey:
Center of Urban Policy Research. Jackson, K. (1985). Crabgrass Frontier. New York: Oxford University Press. Li, W. (Ed.). (2006). From Urban Enclave to Ethnic Suburb. Honolulu: University of
Hawaii Press. Lucy, W., & Phillips, D. (2006). Tomorrow's Cities, Tomorrow's Suburbs. Washington,
DC.: American Planning Association. Moody, M., & Nelson, A. C. (2003). Price Effects of Apartments on Nearby Single-
Family Detached Residential Homes. Washington, DC: National Multi Housing Council.
Morrow-Jones, H. A., Irwin, E. G., & Roe, B. (2004). Consumer Preference for Neotraditional Neighborhood Characteristics. Housing Policy Debate, 12(1), 171-203.
Moudon, A. V., & Hess, P. M. (2000). Suburban Clusters: The Nucleation of Multifamily Housing in Suburban Areas of the Central Puget Sound. Journal of the American Planning Association, 66(3), 243-264.
Murray, J. E., & Judy, H. L. (1978). Federal National Mortgage Association and Federal Home Loan Mortgage Corporation Uniform Multifamily Mortgage Instruments. The Business Lawyer, 33, 2303-2380.
Myers, D. (2001). Current Preferences and Future Demand for Denser Residential Environments. Housing Policy Debate, 12(4), 633-659.
Nguyen, M. T. (2005). Does Affordable Housing Detrimentally Affect Property Values? A Review of the Literature. Journal of Planning Literature, 20(1), 15-26.
Obrinsky, M. (2000). Apartments and Renters: A Long Look Back. Washington, DC.: National Multi Housing Council.

Larco - 24
Peiser, R. B. (1989). Density and Urban Sprawl. Land Economics, 65(3), 193-205. Schafer, R. (1974). The Suburbanization of Multifamily Housing. Lexington, Mass:
Lexington Books. Schmitz, A. (2000). Multifamily Housing Development Handbook. Washington D.C,
ULI-The Urban Land Institute. Schnare, A. B. (2001). The Impact of Changes in Multifamily Housing Finance on Older
Urban Areas: The Brookings Institution. Segal, W., & Szymanoski, E. J. (1998). Fannie Mae, Freddie Mac, and the Multifamily
Mortgage Market. Cityscape: A Journal of Policy Development and Research, 4(1), 59-84.
Temkin, K., and Chuck Harry. (1994). An Analysis of Apartment Residents and Their Preferred Apartment Amenities (No. RERI Working Paper 22). Hartford, CT: Real Estate Research Institute.
U.S. Census Bureau. (1973 through 2005). American Housing Survey National Microdata.
U.S. Green Building Council (2007). LEED for Neighborhood Development Rating System: Pilot Version. Washington DC.
Village of Euclid, Ohio v. Ambler Realty Co., 272 U.S. 365 (U.S. Supreme Court 1926).