nike project presentation 4.24.14
TRANSCRIPT
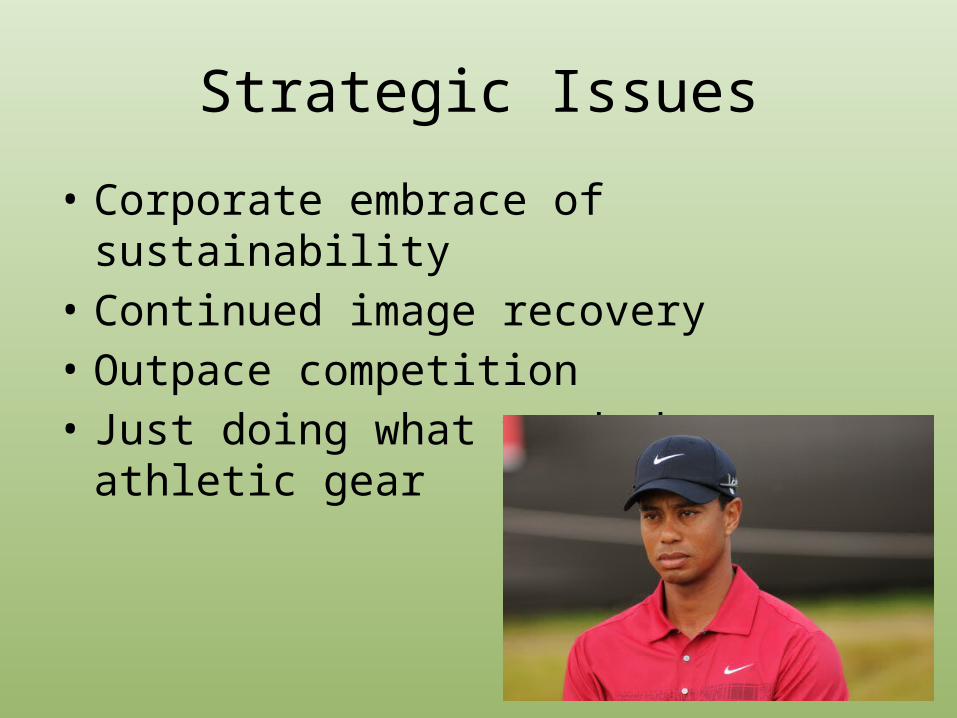
Strategic Issues
• Corporate embrace of sustainability• Continued image recovery• Outpace competition• Just doing what we do best – athletic gear

Growth
• Historical Sales Growth
• Forecasted Sales Growth
2011 2012 2013
Internal Growth Rate (IGR) 12.1% 11.9% 11.1%
Sustainable Growth Rate (SGR) 19.7% 18.9% 18.7%
Historical Revenue Growth Rate (%) 5.8% 16.0% 8.5%
FY 2014 FY 2015 FY 2016
Best 17.60% 17.60% 17.60%
Base 10.10% 10.10% 10.10%
Worst 5.20% 5.20% 5.20%
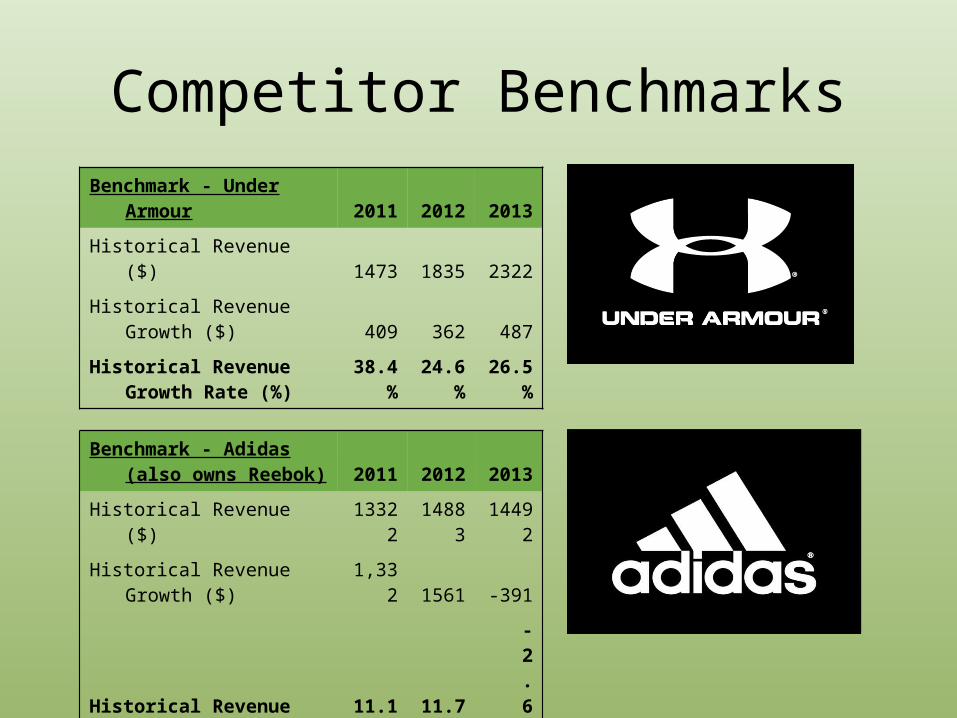
Competitor Benchmarks
Benchmark - Under Armour 2011 2012 2013
Historical Revenue ($) 1473 1835 2322
Historical Revenue Growth ($) 409 362 487
Historical Revenue Growth Rate (%) 38.4% 24.6% 26.5%
Benchmark - Adidas (also owns Reebok) 2011 2012 2013
Historical Revenue ($) 13322 14883 14492
Historical Revenue Growth ($) 1,332 1561 -391
Historical Revenue Growth Rate (%) 11.1% 11.7% -2.6%

External Financing
• No current need for External Financing (EFN) into 2014– Pension funds– Internal financing– Growth rate proposal– Unlevered organization
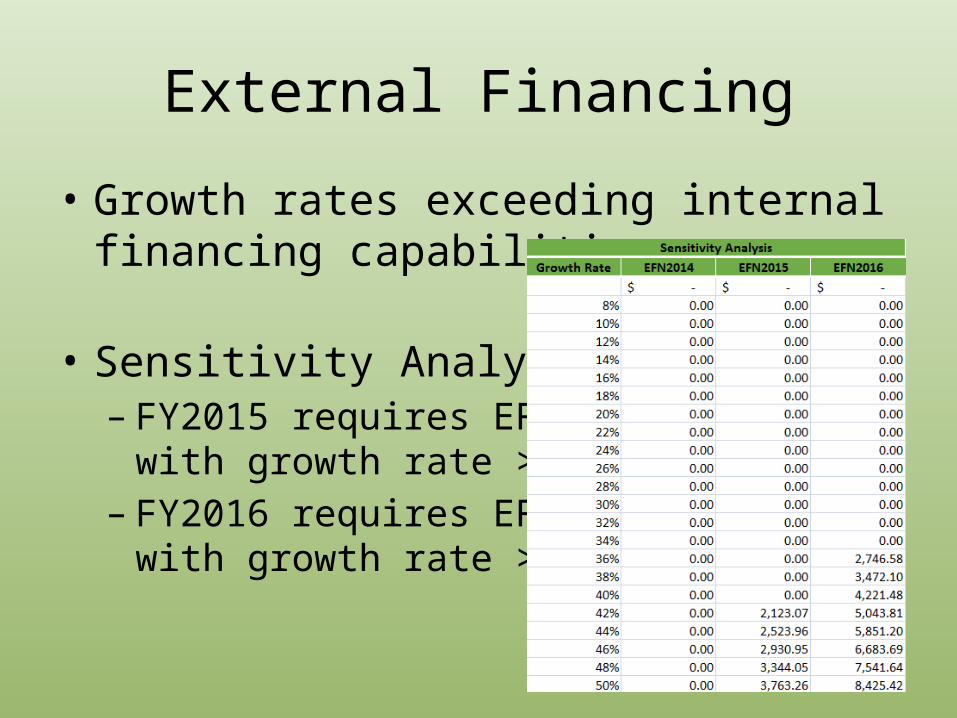
External Financing
• Growth rates exceeding internal financing capabilities
• Sensitivity Analysis– FY2015 requires EFN
with growth rate > 42%– FY2016 requires EFN
with growth rate > 36%
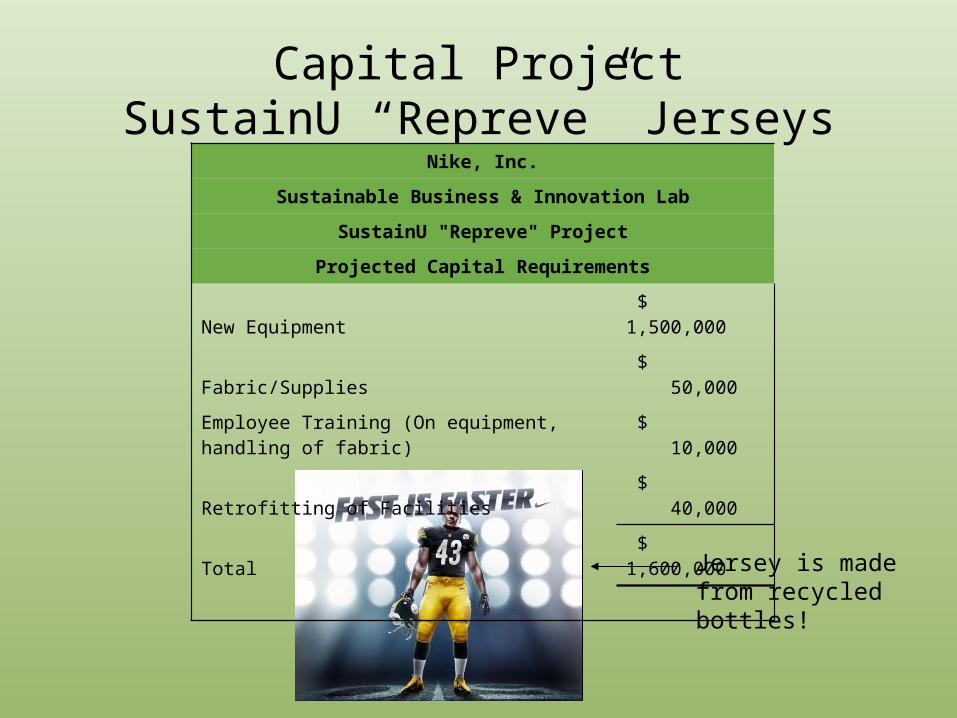
Capital ProjectSustainU “Repreve” Jerseys
Nike, Inc.Sustainable Business & Innovation Lab
SustainU "Repreve" ProjectProjected Capital Requirements
New Equipment $ 1,500,000 Fabric/Supplies $ 50,000 Employee Training (On equipment, handling of fabric) $ 10,000 Retrofitting of Facilities $ 40,000 Total $ 1,600,000
Jersey is made from recycled bottles!

Nike‘s ApproachBelow is an actual Nike Supplier scorecard
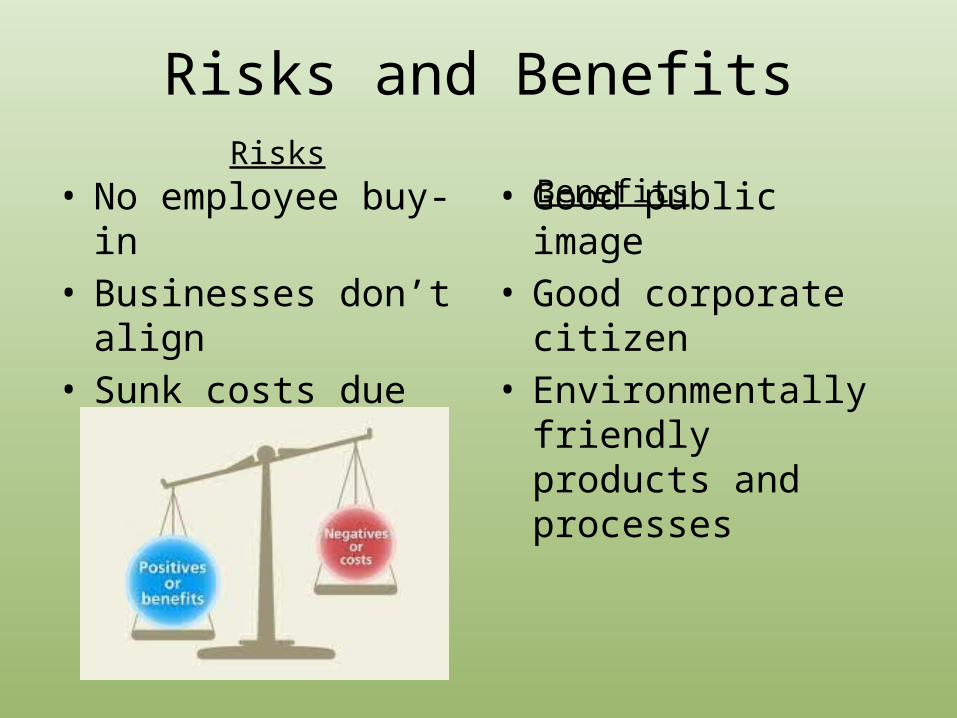
Risks and Benefits
• No employee buy-in• Businesses don’t align• Sunk costs due to lack
of knowledge
• Good public image• Good corporate citizen• Environmentally
friendly products and processes
Risks Benefits

Weighted Average Cost of Capital

Capital Budgeting ScenariosBest Case (10% of sales)
Net Present Value $ 463,651
Internal Rate of Return 128%
Profitability Index $ 4.82
Payback Period During year 1
Discounted Payback Period During year 1
Base Case (7.5% of sales)
Net Present Value $ (23,096)
Internal Rate of Return 94%
Profitability Index $ 3.49
Payback Period During year 2
Discounted Payback Period During year 2
Worst Case (5% of sales)
Net Present Value $ (489,130)
Internal Rate of Return 59%
Profitability Index $ 2.25
Payback Period During year 2
Discounted Payback Period During year 2
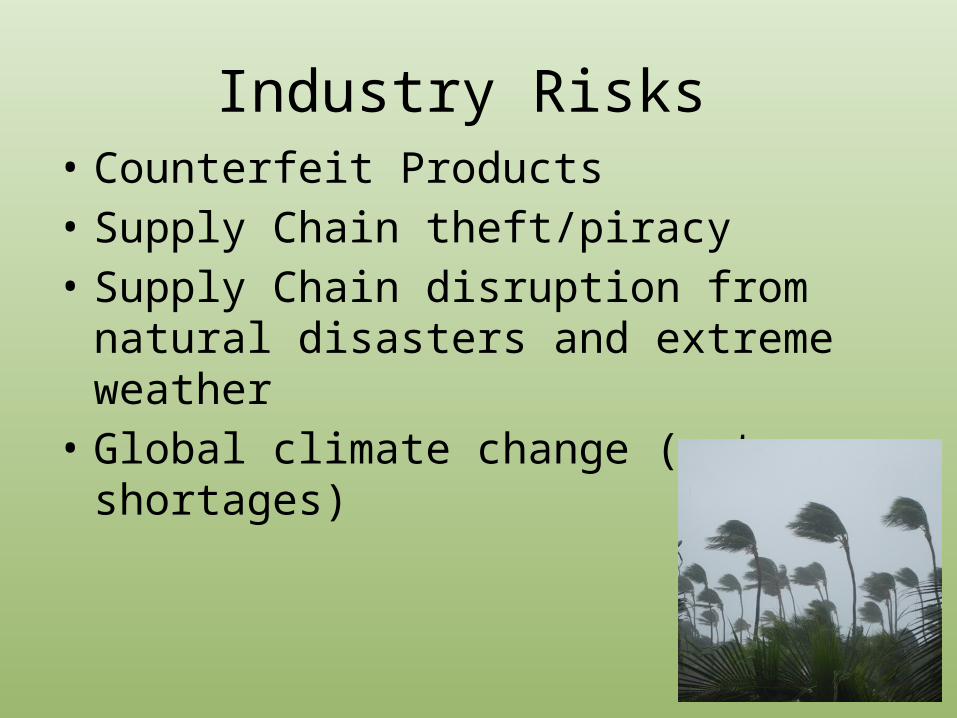
Industry Risks • Counterfeit Products• Supply Chain theft/piracy• Supply Chain disruption from natural disasters
and extreme weather• Global climate change (water shortages)

Environmental Focus• Nike uses eco-friendly materials for athletic
apparel• Nike helps preserve natural resources by using
a waterless dyeing process (uses CO2 instead)• Collaborates with NASA and other
organizations to encourage social and environmental innovation
Waterless Dyeing process!
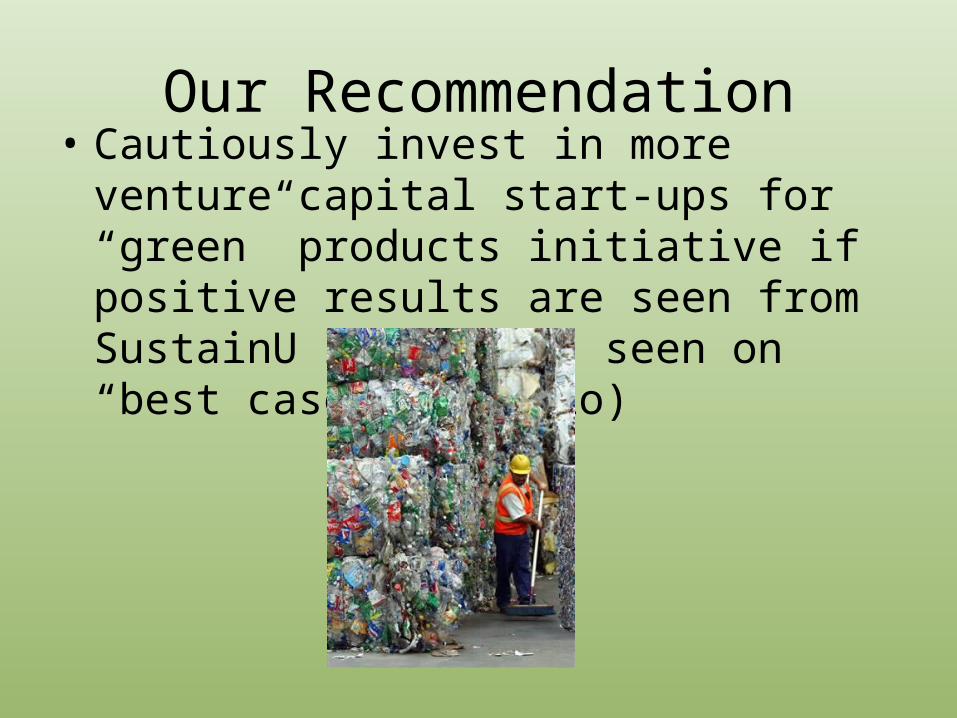
Our Recommendation• Cautiously invest in more venture capital start-
ups for “green” products initiative if positive results are seen from SustainU launch (as seen on “best case” scenario)

Thank You