nina j. baird. investigating health effects from chronic
TRANSCRIPT

ABSTRACT
NINA J. BAIRD. Investigating Health Effects from ChronicWorkplace Exposures Using Existing Databases: A Case Study ofChronic Xylene Exposure. (Under the direction ofDr. Alvis G. Turner)
A database method for associating health effects with
chronic occupational exposures is presented. Exposureinformation is derived from the National Occupational ExposureSurvey (NOES). Information on health conditions and
occupation are taken from the 1988 National Health Interview
Survey (NHIS) Core Questionnaire and the 1988 NHIS
Occupational Health Supplement. Drinking behavior wasdetermined by using the 1988 NHIS Alcohol Supplement.
A case study evaluating the effects of chronic exposure
to two neurotoxicants--alcohol and xylene--was performed. A
working population with chronic xylene exposure was selected,sorted by frequency of alcohol consumption, and analyzed forseveral health effects. A statistically significantdifference in the proportion of doctor-diagnosed hypertension
among abstainers and moderate drinkers (9.90% and 5.62%respectively, p< 0.05) was found.
To determine whether the observed effect was related to
alcohol alone, a comparison group was selected and the overallproportion of hypertension among the two populations wasdetermined. The proportion was found to be significantly
higher among the xylene-exposed population (7.07% versus5.55%) at the 95% confidence level. Logistic regression whichsimultaneously compared the influence of age, gender, race.

1 i»!m;BiM»!iWB-'i|jWU"
drinking frequency and smoking behavior indicated that race,
gender, age and xylene exposure had a significant impact on
hypertension in this analysis. Suggestions for further
applications of the study method and for additional
investigation of cardiovascular effect from chronic solvent
exposure are offered.

-"^j^^p^^"
TABLE OF CONTENTS
XX
Page
List of Tables iv
Introduction 1
Resources for Occupational Database StudiesHealth Effects Information 3
Exposure Data 8
A Case Study of Chronic Xylene Exposure: Phase 1Introduction 12
Literature Review 13
Methods: Phase 1 15
Results 20
Discussion 21
A Case Study of Chronic Xylene Exposure: Phase 2Literature Review 27
Methods 30
Results 31
Discussion 36
Summary and Conclusions
Limitations of Methodology 46Further Applications 47Conclusions 49
References 51

XXX
ACKNOWLEDGEMENTS
My graduate program at Carolina has been a tremendousexperience from start to finish and each member of mycommittee has challenged me to pursue research interestsbeyond the classroom. Dr. Al Turner is both an excellentprofessor and advisor. I am particularly grateful for hisongoing encouragement, guidance, and patience during my three-year Master's degree. Drs. Sandy Stopford and Carl Shy notonly provided useful critiques of this research, but alsobuilt my enthusiasm for occupational health studies by sharingtheir own expertise. Finally, Dr. Virginia Behrens, Dr. PaulSeligman, Mr. Randy Young, Mr. Brent Tompkins, and many othermembers of NIOSH's DSHEFS Surveillance Branch deserve thanksfor making the research possible.

' JH!H^-'ShS*!'i'
LIST OF TABLES
Page
Table 1: Proportion of Doctor-Diagnosed Conditionsin Exposed Group 21
Table 2; Proportion of Doctor-Diagnosed Hypertensionin Exposed and Comparison Group 31
Table 3: Age and Gender Breakdown in Exposed andComparison Group 32
Table 4: Drinking Behavior in Exposed and ComparisonGroup 32
Table 5: Smoking Behavior in Exposed and ComparisonGroup 32
Table 6: Hypertension in Exposed and Comparison GroupStratified on Age, Gender and Drinking Status 33
Table 7: Hypertension in Exposed and Comparison GroupStratified on Age, Gender and Smoking Habits 34
Table 8: Regression Analysis 35

^8BWM^^^gTj,J!»Pg^iilHtfiyif^iaij»i#^»"
INTRODUCTION
Chronic exposures predominate in modern industry, yet
health effects information regarding these exposures is
limited. One of the goals of this study was to attempt to
generate new chronic health effects data. Time constraints
for the research, conducted during a NIOSH summer internship,
dictated a study which used existing data. Fortunately, the
internship was based within NIOSH's Division of Surveillance,
Health Evaluation and Field Studies (DSHEFS), which offered
substantial database resources and expertise in accessing
them.
The case study itself was born of an interest in
neurotoxicity. Large numbers of workers receive chronic
exposures to neurotoxicants in the form of solvents. In the
mid-SO's, NIOSH named neurotoxicity as one of ten leading
work-related diseases and proposed a national strategy for
prevention. A major component of this strategy involved
increased research into the effects of neurotoxic chemicals on
workers.
The method devised for pursuing these goals is a first-
ever linking of several databases to allow characterization of
occupational exposures and health conditions. Although
certain assumptions were required by the methodology,
particularly with regard to exposure, it does seem to have

2
Utility and could be used for further studies of chronic
effects. The case study itself produced an interesting
pattern of health effects when the study was stratified by
drinking behavior, and indicated elevated hypertension among
the exposed population. A limited body of literature exists
to support this finding, but further research into observed
health effects and with this study methodology are proposed.

RESOURCES FOR OCCUPATIONAL DATABASE STUDIES
Health Effects Information:
Both toxicological and epidemiological information about
human health effects from chronic workplace exposures is
limited. An obvious reason for this is the time and expense
involved in conducting long-term studies. An underlying
reason may be a lack of support for such research. In an
indirect way, the tendency for the courts to deny claims for
occupationally-induced illness—Agent Orange, Bendectin and
PCB's are three recent examples^—eases liability pressures
on industry and other funding sources for chronic risk
research. Given the lack of information and time and money
constraints, database research becomes an attractive option.
Although such studies are by themselves inconclusive and would
probably be of limited value in court,^ they can point to a
^Daniel M. Byrd and Walter Gawlak (1991) "The Rules ofthe Game: What Recent Rulings Say about Courts' andRegulators' Differing Approaches to Establishing Causation forChronic Health Risks," in The Analysis, Communication andPerception of Risk, BJ Garrick and WC Gekler, eds.. PlenumPress, New York.
^In analyzing recent court decisions, Byrd and Gawlakemphasize that the tort system evaluates evidence of presentharm quite differently than do regulators assessing futurerisk. Animal studies and "confusing or prejudicial" evidencehas been ruled inadmissible when causation of harm must beproven. The authors state that "if the injury is a humanhealth effect, there must be significant relevant data oncausation of injury to humans." p 380. Because databasestudies with existing information sources required some

4
potential need for further research.
If a researcher is interested in health outcomes that are
tracked within the occupational health system, worker
compensation files or the Bureau of Labor statistics Annual
Survey are potential information sources. Because so little
is known about chronic, low-level exposure, however, their
associated health effects may not be diagnosed as work-related
and would not be captured in occupational health tracking
systems. The challenge then becomes finding alternative
health databases that code occupational information. An
excellent review of available databases—occupational sources
and others—is provided in the 1989 American Journal of Public
Health supplement, "Surveillance in Occupational Health and
Safety." A description of each database, its strengths,
limitations, and prior applications are discussed. For
detailed information, the reader is referred not only to the
AJPH Supplement, but also to someone who has previously worked
with the database. It became clear during this study that
even a printed copy of the survey questionnaire and
description of data collection and coding were poor
substitutes for talking to professionals who had used a file
and could discuss its quirks. A brief summary of alternative
data sources is provided here.
For cancer studies, the registries in four states—Maine,
assumptions or reasoning by inference to assign exposure, theywould probably be regarded on their own as insufficient proof.

5
Massachusetts, Pennsylvania and Connecticut—were offering
industry and occupation (I/O) coding in their files as of
1988. In the early 80's, forty states initiated efforts to
include I/O information in their mortality files. As of 1988,
twenty-three of those states were providing "machine readable"
I/O data to the National Center for Health Statistics.
Hospital discharge records in Minnesota, New Jersey and Rhode
Island were cited in AJPH as sources which have been used for
published studies in occupational disease surveillance. At
least twenty states maintain discharge records on computer andat least nine states have access to these records.^
Morbidity data for the types of conditions that are more
likely to be seen and treated in a doctor's office—conditions
such as respiratory ailments, hematological changes, vision or
hearing impairment, or CNS effects such as memory loss or
personality change—may well be the most important type of
data for research involving chronic low-level exposures.
Until the late Seventies, the Social Security Disability files
could be used for database occupational morbidity studies. In
the early Eighties, however, funding to maintain the
occupationally-related information in the files was cut.
Medical records from the company doctor are another potential
source of morbidity data, but it should be noted that less
than 2% of all facilities and only 25% of all employees have
^James M. Melius et al, "Occupational DiseaseSurveillance with Existing Data Sources," in AJPH Supplement,December, 1989, Volume 79, p. 50.

6
either a part- or full-time physician on site. Fewer than 6%
of all facilities have an on-site health unit staffed by any
kind of health practitioner.*
At present, the best source of morbidity data seems to be
direct surveys. According to Bergman et al in the same AJPH
Supplement, adverse reproductive outcomes are linked with one
or both parents' occupation in the NCHS National Survey of
Family Growth, the National Maternal and Infant Health Survey
and the 1980 National Natality Survey and National Fetal
Mortality Survey. More general morbidity data is offered by
the National Health and Nutritional Examination Survey
(NHANES) and the National Health Interview Survey (NHIS).
NHANES provides a nationally representative sample and
combines questionnaire data with physical and laboratory
examinations. It has been conducted at varying intervals
since 1971, but the study of most interest for occupational
purposes is NHANES III. This is a six-year data collection
effort which began in October, 1988, and is the only NHANES
survey which includes a section on occupational history
(current and longest-held jobs) as well as questionnaire and
examination data on respiratory conditions and work-related
neurotoxicity. Data collection will end in 1994, but the
^National Occupational Exposure Survey, ManagementInterview Responses, NIOSH, 1988.

-••emmi'm^m^
7
first three years of data are already available to NIOSH.^
One limiting factor of NHANES is sample size—30,000 to
40,000—so that narrow I/O categories cannot be accommodated.
Nevertheless, if industries are linked by common exposures, a
statistically valid study could be constructed.
NHIS conducted both an occupational health and alcohol
supplement in 1988 which can be linked to the core
questionnaire. The core is an annual interview survey that
"obtains demographic data and infoinmation on activity
limitations; health care utilization; and the presence,
severity and impact of numerous medical conditions."^ It is
administered to approximately 50,000 households and provides
data on some 130,000 individuals. The survey design is a
multistage, probability-sample strategy representative of the
US civilian, non-institutionalized population. The core
questionnaire remains fairly consistent from year to year,
while the supplements change annually.
The 1988 NHIS Occupational Health Supplement consists of
an occupational history of current and longest-held jobs, and
sections on back pain; hand discomfort; work-related injuries,
skin conditions, and eye, nose and throat irritation; smoking
behavior; use of worker's compensation; and a brief section on
^Personal conversation with Dr. Virginia Behrens,Epidemiologist, NIOSH's DSHEFS Medical Section,(513) 841-4422.
^Ehrenberg, KL, "Use of Direct Surveys in theSurveillance of Occupational Illness and Injury," AJPHSupplement, December, 1989, Vol. 79, p. 12.
8
potentially work-related conditions such as tendinitis,
hepatitis, and chronic bronchitis.
The 1988 NHIS Alcohol Supplement consists of questions
about current and past drinking behavior including frequency,
quantity and type of alcohol consumed; family history of
alcoholism; and health consequences of respondent's drinking.
Records from both of these supplements can be linked to the
core questionnaire and all 1988 data is in the public domain,
available on tape from NCHS.
Exposure Data;
Exposure information is seldom provided in any health
databases except worker compensation files and it is here that
the greatest level of assumption or inference enters into
database occupational studies. Separate databases can provide
exposure information by industry or industry/occupation. The
assumption must be made, however, that everyone within that
particular industry or I/O receives the same exposures.
Information on level of exposure is even more difficult to
obtain and must either be reconstructed from historic exposure
data or must remain unassigned.
Perhaps the most extensive exposure information on file
was compiled by NIOSH in their 1970's National Occupational
Hazard Survey (NOHS) and their 1980's National Occupational
Exposure Survey (NOES). NOES and NOHS are pioneering attempts
at workplace hazard surveillance. They are systematic, on-

9
site surveys of industries, from which were developed
extensive lists of substances and the number of workers
exposed. They are currently the only comprehensive efforts to
estimate the nature and distribution of chemical, physical and
biological agents in industrial and commercial work
environments. NOES also provides information on in-plant
health and safety programs.
NOES was conducted between 1981 and 1983. The 4,490
facilities surveyed were intended to represent all the non-
agricultural, non-mining and non-governmental business covered
under OSHA. As with NOHS, NOES identifies only potential
exposures. For chemical exposures, any agent observed during
a site survey was recorded unless it was in a contained
system. Therefore, NOES only identifies the use of a given
material; it does not indicate whether that use is within a
standard or specific exposure level. Estimates of the number
of workers associated with the use of that substance are
provided, as is information on the presence of industrial
hygiene controls or personal protective equipment. NOES data
is available on computer tape from NIOSH.
OSHA's Computerized Information System (OCIS) offers
exposure data as determined by compliance investigations.
Some files in this system provide actual exposure
measurements; others express exposure level as a proportion of
the permissible exposure limit. For example, the Sample
Reports file provides lab sample results for over 42,000

"ll^^a^s^
10
samples processed at OSHA's Salt Lake City Technical Center
from 1981 to the present. The file can be sorted by chemical,
time period, geographic region or company. Measurements are
expressed as a proportion of the PEL. The Sample Status File
offers lab sample results with actual exposure measurements
for individual inspections. For the period of 4/84-4/88, the
SIC I.H. Information File offers inspection data which can be
sorted by Standard Industry Classification (SIC) code and bychemical name. The level at which a chemical was measured in
the workplace is expressed as a proportion of the permissible
exposure limit. It should be noted that only OSHA-regulated
chemicals will be found on this database. OSHA also employs
a sampling strategy which focuses on a worst-case situation
and tends to sample only where exposure is believed to be the
greatest. Furthermore, not all states report their data to
OCIS.' Public requests for OCIS information can be made
through an OSHA office or through the Technical Data Center in
Washington, D.C.
One currently untapped source of exposure data which
could offer sampling information are the Health Hazard
Evaluation (HHE) files maintained by NIOSH. Since its
inception, NIOSH has been conducting HHE's upon request,
performing workplace audits and medical evaluations, and
'Froines, et al, in "Hazard Surveillance in OccupationalDisease," AJPH Supplement, 12/89, vol 79, pp 26-31, provide agood review of OCIS and other occupational exposure databases.

11
summarizing their findings in printed reports. These reports
can be sorted by computer according to chemicals sampled or by
industry. Actual sampling information is not yet on computer,
although plans to do this have been discussed. Working with
the computer files and printed reports, a list of industries
in which a particular chemical had been found and the levels
at which it was detected in each workplace could be
constructed. HHE reports are in the public domain and are
available through NIOSH. It should be noted that these
reports have a limited print run and are not reprinted.
Making personal copies might be required.

A CASE STUDY OF CHRONIC XYLENE EXPOSURE: PHASE 1
Introduction
A combined exposure of alcohol consumption and xylene was
chosen as the exposure of interest in this study. The reasons
for this were several. First, xylene is in sufficiently
widespread use to allow a sizable exposure group to be
created. Second, there is a reasonably body of literature on
the combined effects of these two chemicals which indicates
that, while both chemicals are CNS depressants, alcohol
consumption does modify xylene metabolism. Third, since
symptoms of neurotoxicity are subtle and exposure to organic
solvents—some of which follow metabolic pathways similar to
xylene—is common, it was felt that a more controlled study
might result from stratifying a group selected for xylene
exposure and stratified according to drinking behavior than by
trying to create a xylene-exposed group and a control group
free from confounding solvent exposures. What we hypothesized
would result would be a pattern of neurologically-related
health effects modified by alcohol consumption. The nature of
that modification, as discussed in the literature review
below, was uncertain, but one of the anticipated outcomes was
that this analysis could elucidate chronic alcohol/xyleneinteraction in humans.

13
Literature Review
Xylene, as an aromatic hydrocarbon, and ethanol, an
aliphatic alcohol, are among the most important groups of CNSdepressants. These depressants are non-electrolytes and alsoinclude aliphatic hydrocarbons, ethers, ketones, chlorinated
hydrocarbons and weak acids and bases. The current theory forinterpreting the effect of a mixture which acts on the same
physiological system or receptor site is to treat the
components additively. According to Djuric (1983), "multipleexposures to ethanol and other aliphatic alcohols, ethers,
ketones and aliphatic, aromatic and chlorinated hydrocarbonswill produce an additive effect."® Studies of alterations in
solvent metabolism with ethanol exposure, however, do not make
that clear. A combined exposure to toluene via inhalation and
ethanol ingestion caused a statistically significant increase
in human blood toluene concentration compared to toluene
exposure with no alcohol. (Waldron et al, 1983). Competition
for alcohol dehydrogenase was proposed. By contrast, toluene-
exposed workers who chronically ingested alcohol had
significantly lower blood toluene concentrations than did
workers from the seune factory who seldom drank (Waldron et al,
1983). An alcohol-induced increase in solvent-metabolizing
MEOS activity was suggested to account for more rapid solventmetabolism.
®World Health Organization (1983) Combined Exposure toChemicals, Interim Document 11, p 151.

'tfW<^^WPIiB!!iP|PiliiPP»Wltli^
14
Savolainen (1980), Savolainen et al (1980) and Riihimaki
(1982) all studied blood xylene concentrations in volunteers
receiving single acute exposures to m-xylene in an inhalation
chamber with and without prior ingestion of a single dose of
ethanol. In each case, a statistically significant increase
in blood xylene concentration was found in subjects with prior
alcohol consumption. Riihimaki observed a transient rise in
blood acetaldehyde while elimination of alcohol from the blood
remained unchanged. Savolainen also looked at body balance
and reaction time. He concluded that the combined adverse
effects of these agents were usually additive, and that the
interaction was pharmacodynamic rather than pharmacokinetic
since doubled blood-xylene concentration alone or in
combination with alcohol did not correspondingly increase
impairment. In its Current Intelligence Bulletin on organic
solvent neurotoxicity (1987), NIOSH stated that human studies
of solvent/ethanol metabolism suggest that blood solvent
concentrations are raised with acute ethanol ingestion through
competition for metabolism, but will be lowered with chronic
ethanol ingestion due to induction of solvent-metabolizing
enzymes. They add that "workplace exposures to several
solvents simultaneously or to solvent mixtures may result in
similar metabolic interactions."
Animal studies have shown that the acceleration in
solvent metabolism induced by chronic alcohol consumption
disappears almost immediately after ethanol is withdrawn.

''g-»ab«#i^WJi#P^i#»^»^j'J#^»Wjj^^ |«aigy
15
Sato et al (1980) found that a one-day withdrawal of ethanol
in chronically-dosed rats abolished the increased rate of in-
vitro metabolism of a wide range of aromatic and chlorinated
hydrocarbons. The metabolic rate of m-xylene in rats fed a
control diet was 21.0 nmol/gram liver/minute, 76.6 nmol/gram
liver/minute in rats fed an ethanol-containing diet, and 22.8
nmol/gram liver/minute in rats removed from an ethanol-
containing diet and fed a control diet only on the day before
death. Ethanol co-existing in large amounts with a foreign
chemical was capable of suppressing the chemical metabolism,
but a single does of ethanol given by gastric intubation was
able to increase the metabolism of toluene and
trichloroethylene by about two-fold 16 hours after ethanol
administration without causing an increase in microsomal
protein and cytochrome P-450. Sato suggested that the effects
of ethanol could be qualitative rather than quantitative,
stimulating enzymes by "modification of the endoplasmic
reticulum membrane environment by allosteric effects, or by
displacement of other endogenous or exogenous substrate bound
to the enzymes."
Methods: Phase 1
The exploratory nature of this study, and its focus on
chronic exposures, presented some methodological challenges.
The use of an existing dataset seemed most appropriate, yet
the demands on that dataset were several. First, it needed to

'^^^^m'^^^sif^mmffmmmK^^m^^m^^ss^^
16
contain sufficient subjects to allow the possibility of
statistical significance. Second, it had to delineate a
subject's occupational history. Third, a wide range of
morbidity information was desirable, and finally, data on
drinking behavior was required.
The 1988 National Health Interview Survey (NHIS), which
offers both an occupational health supplement and an alcohol
supplement in addition to the core questionnaire seemed to be
most appropriate. Linking both supplements to the core
provides an individual occupational history, alcohol
consumption history and record of health status as well as
demographic information. Because NHIS is a multi-stage
probability sampling design, it also produces a nationally
representative sample. This study appears to be the first to
link two supplements of NHIS to the core questionnaire.
Additionally, it is among the first to generate exposure
information by linking NOES to NHIS.
In order to select a xylene-exposed study group from
NHIS, we used NOES data to generate a list of
industry/occupation couplets for which xylene was observed in
the workplace. NOES allows sorting of xylene files by
specific isomers. Since the most common workplace exposure is
to mixed xylenes, however, the database was searched with the
general chemical name, resulting in an extensive list of
industries and occupations in which xylene was named as a
chemical in use.
17
NOES does not provide measures of exposure. Therefore,
we further sorted this list using OSHA sampling data providedin the OSHA OCIS SIC I.H. Information File. Industries in
which xylene was measurable in at least 50% of OSHA samples
were retained in the study group. All occupations associated
with those industries in NOES were retained. As a final step,
the 4-digit SIC codes for industry classification in NOES were
converted to the 3-digit Bureau of Census codes used in NHIS
for industry classification. The Bureau of Census provides
conversion information in its coding document.
The xylene-exposed study group was generated from the
NHIS occupational health supplement. This file provides data
on an individual's longest-held occupation, as well as the
current or most recent (within the past year) job. A program
was written that would sort records using the NOES-generated
industry/occupation (I/O) couplets, and select records with
matching I/O couplets in the job history. In order to select
for chronic exposure, at least five years in one exposed
industry/occupation was required. Records were searched by
current or most recent occupation first, in order to reduce
the number of intervening exposures. If the current or most
recent occupation was not in an "exposed" job, or if it was an
exposed job in which the individual had worked fewer than five
years, the longest-held occupation information was searched.
A list of 3,710 records was obtained from this search.
Records in the supplements and core questionnaire can be
18
linked to one another by matching six specific fields in each
record. Records for the exposure group were matched within
the alcohol supplement to obtain information on drinking
behavior. Because toxicological data on alcohol/xylene
interaction suggests that the presence of alcohol in the
system is the important factor in metabolic alterations,
frequency rather than quantity of alcohol consumption was
chosen as the classifying characteristic. The three
categories used were lifelong abstainers, moderate drinkers
(those drinking five or fewer days per week) and frequent
drinkers (those drinking more than five days per week). In
actuality, most individuals falling within the moderate
category reported drinking only 2-3 days per week, and most of
those in the frequent drinker category reported daily
drinking. Abstainers as defined by the survey are those who
have had twelve or fewer drinks in their lifetime. Drinking
behavior used in this study had to occur simultaneously with
job exposure. Therefore, we selected records for which at
least five years of alcohol consumption occurred during at
least five years of the exposed job. After matching the
occupational history records with those for alcohol
consumption, 3,564 records remained in the exposure group.
From medical and toxicological literature on xylene and
alcohol consumption, a list of potential health effects was
developed. Then the exposure group file was linked with the
core questionnaire to search for corresponding health data.

19
NHIS codes health conditions according to the ICD-9, andhealth status data from the core questionnaire has beensubdivided into three major groups: Recede A, acuteconditions; Recode B, conditions which cause some limitation
in activity; and Recode C, specific chronic conditions andimpairments. Recode C data is appealing in that it can beused to calculate national prevalence rates. The number ofhealth conditions surveyed is limited, however, and only one-sixth of the sample is surveyed about any one condition. Wheninvestigating a small occupational group, therefore, severalyears of data would have to be combined to obtain sufficientnumbers of cases of a given condition.
For the purposes of this study, information from RecodeB was used. This allowed us to investigate all health effectsof interest for our study group. Conditions listed in RecodeB can be reported using one of the survey questions as astatistic, such as the number of people hospitalized for agiven condition. The statistic we chose was the number ofpeople who had seen a doctor for the condition of interest.
Data on the proportion of the xylene-exposed populationwho had seen a doctor for each of several health conditions
were obtained and stratified by drinking status. The standard
errors of these proportions were then calculated with thesoftware program, SUDAAN, a statistical program used with NHISdata so that the correct weights as well as the appropriateformulae will be applied to achieve a nationally

20
representative sample. Confidence intervals were calculated
by multiplying the standard error of the proportion by the
desired z statistic.
Results
Table 1, stratified by drinking status, shows the
proportion of the xylene-exposed population that had seen a
doctor for selected health effects. Table 1 disorders each
represent a grouping of ICD-9 codes used in NHIS for Recode B
conditions. Although some of the toxicological data suggests
tximor development from xylene exposure, no malignant
conditions appear on this list because the numbers were too
small. One notable characteristic of these data is that the
highest proportion of several of these adverse effects—upper
respiratory disorders, urinary disorders, digestive system
disorders, hypertension, eye disorders, and injuries—was
found among abstainers. Statistical significance was reached
only for hypertension, between abstainers and moderate
drinkers.
The proportion of hypertension among the xylene-exposed
population was 9.9% among abstainers, 5.62% among moderates,
and 7.52% among frequent drinkers. The difference between the
abstainers and moderate drinkers is statistically significant
at the 95% level (95% CI 7.78-12.20 for abstainers and 4.52-
6.72 for moderates).

21
TABLE 1
1 Proportion of Doctor-Diagnosed Health Conditions in Exposed Group1 Stratified by Drinlcing Status (%)Drinking Status
1 Disorder Abstainer Moderate Frequent 1
1 Heart disease 2.89 2.48 3.62 11 Upper respiratory 3.65 3.35 2.93 11 Mental disorders 0.94 0.91 1.69 11 Urinary disorders 1.94 1.34 1.36 11 Cerebrovascular 1.04 0.54 1.38 11 Nervous system 2.78 2.30 3.40 11 Digestive system 4.52 3.20 4.37 11 Hypertension 9.99 5.62 7.52 11 Respiratory disorders 4.16 3.50 4.49 11 Eye disorders 4.94 3.08 3.11 11 Injuries (Recede B) 0.95 0.17 0.63 1
Discussion
Because of the way in which disorders were identified inRecede B of NHIS—those causing limitations in activity—the
reporting of all disorders is biased toward the null, perhapsdampening any differences which might be seen among drinkinggroups. Despite a lack of statistically significantdifferences by drinking status for all disorders excepthypertension, the consistent curvilinear relationship betweendrinking status and other disease categories seems worthnoting. All health effects categories showed a higherproportion of disorders among abstainers than moderatedrinkers. Frequent drinkers also displayed a higherproportion of disorders than moderate drinkers in everycategory except upper respiratory conditions. Although the

w^jaiB»pigg-^MM^?WJ#tHM'wpw<»w;j^^
22
relationships may be spurious—and with the exception of
hypertension, were not found to be statistically significant—
the pattern suggests multiple systemic interactions and a
slightly protective effect of alcohol that might bear further
research.
Both chemicals in this case study—ethanol and xylene—
are neurotoxic ants and one of the original assumptions of this
investigation was that modifications in the proportion of
neirvous system disorders, cerebrovascular or mental disorders
would be seen by drinking status. The drinking-stratified
pattern for these categories of disorders was similar to that
for most disorders, however, and did not reach statistical
significance. This may be due to a lack of diagnosis rather
than a lack of disease. In a separate analysis conducted
during the same NIOSH internship, worker compensation claims
filed in Ohio from 1985-89 were studied to assess: the nximber
of claims coded for nervous system or mental disorders, the
stated source of injury for those claims, and the symptoms and
diagnoses on claims for which the stated exposure was a
potential neurotoxicant. Among the most interesting findings
were that only 1% of the claims now coded and filed for
nervous system disorders involve neurotoxicity; most of these
claims are for stress-related mental disorders or nervous
system damage due to contact with electrical current. What
were likely to have been neurotoxic effects were usually coded
as cases of systemic poisoning, apparently because the

23
involvement of multiple body systems was suggested by the
claim form. For example, mentioning inhalation as an exposure
pathway frequently caused a claim to be coded for respiratory
system effects, even if the symptom description did not
include respiratory symptoms. Nausea appeared to imply GI
tract involvement. Finally, even on claims for which a
doctor's diagnosis was provided, a group of classic
neurotoxicity symptoms such as headaches, memory loss,
dizziness, irritability and nausea would not be called
neurotoxicity, nor would the claim be coded as such. These
findings underscored the information provided in textbooks
that neurotoxic symptoms often mimic diseases with other
etiologies and can be misdiagnosed for that reason. Because
the symptoms often develop slowly and subtly, they can also be
overlooked. Laforge suggested that one reason for the
apparent higher prevalence of hypertension among older people
is that they have more opportunities to have their blood
pressure checked and therefore their self-reporting is more
accurate. If we relate this concept to neurotoxicity, since
even doctors have difficulty detecting or diagnosing signs and
symptoms of neurotoxicity and these indicators can often be
attributed to other disorders, it seems reasonable to asstune
that self-reporting about disorders related to nervous system
damage will be quite inaccurate. This misclassification would
have been nondifferential between the two groups, but an
absence of diagnosis would prevent these disorders from
24
influencing the study. It should be noted that SocialSecurity Disability files have been successfully used todetect an excess of neuropsychiatric disability amongpainters, which implies that disorders related to nervoussystem toxicity (pre-senile dementia, affective psychoses,neuroses, personality disorders, other diseases of the brainand alcoholism were considered) are being diagnosed insufficient numbers to influence study results. The use ofRecede B data for this study, which counted health conditionscausing a limitation in activity, and the use of a self-reporting survey may have also affected results. It ispossible that neuropsychiatric disorders would not be self-reported, decreasing the number of cases.
Part of the problem in diagnosis is that the basicmechanisms of neurotoxicity are understood for only a very fewcompounds, so adequate test methods do not exist. Most of thechemicals for which biological exposure indices have beenestablished are potential neurotoxicants (although the effectfor which the BEI is established is often not the chemical's
neurotoxic properties), but this measure only indicatesexposure. Without an understanding of the mechanisms, wecannot interpret a BEI in relation to the chemical's effect onthe nervous system. Furthermore, even if we had thisunderstanding, NOES management survey data suggests thatbiological monitoring occurs among only 38% of workers, in 18%of all facilities (based on responses to a question regarding

"^^WPWKP'
25
blood or urine sampling, which seems to be a reasonablesurrogate question for biological monitoring of any kind).The lack of this kind of monitoring in the workplace, and theunlikelihood that an outside physician might associatesymptoms of neurotoxicity with workplace exposure suggest thatself-reporting of nervous system or cerebrovascular disorderswould be low. The social stigma attached to mental disordersmight also cause the self-reporting figure to be artificiallylow.
Nevertheless, the information that we do have regardingsolvent exposures and metabolism indicates that nervous systemdamage with chronic low-level exposure to these chemicalscould be occurring. Organic solvents are recognizedneurotoxicants. They are lipophilic, and the lipid content ofthe nervous system is high. When solvents dissolve inmembrane lipids, they are protected from enzymatic degradationand from general circulation. Accumulation of these varioustoxicants can occur, resulting in high local concentrations.Leaching of solvent deposits from liver and adipose tissue canalso prolong internal exposure to a compound after externalexposure has stopped. Although the mechanism for the observedneurotoxic effects of xylene, ethanol, and other organicsolvent mentioned here is not understood, the process
described below for the development of vascular degenerativelesions may be related to the CNS effects of organic solvents.
Among those reporting doctor-diagnosed hypertensive

fipsi^^^Pp^PiP
26
disorders, a reverse-J curve was observed among drinking
categories, with a statistically significant differencebetween abstainers and moderate drinkers. In light ofexisting research on the interactive effects of xylene andethanol, this suggested that alcohol-induced enzyme induction
might produce a protective effect among moderate and frequentdrinkers. An initial review of alcohol-hypertensionliterature, however, indicated that reverse-J, U-shaped or J-shaped curves have been found in other studies investigatingrates of hypertension and drinking behavior in the generalpopulation. One possible explanation for our results was thatthe differences among drinking categories was entirelyalcohol-related and that the reason this disorder achieved
statistical significance was that the population was morelikely to have had blood pressure tested and could report such
a condition more accurately than other disorders. For thisreason, we decided to take the study one step further,
creating a comparison study group from the same database, inorder to ascertain whether the observed elevation in
hypertensive disorders could be solvent-related or was morelikely an alcohol-related effect.

A CASE STUDY OF CHRONIC XYLENE EXPOSURE: PHASE 2
Literature Review
A reverse-J, U-shaped, or J-shaped curve has been found
in a number of studies which look at drinking behavior and
hypertension. More recent studies which use regression
modeling to account for the confounding effects of such
characteristics as age, race, gender, body mass and smoking
behavior tend to find a significant effect of alcohol on
hypertension at higher consumption levels, but no protective
effect at moderate levels. For example, Laforge at al (1991)
used 1983 NHIS data to study alcohol consumption, gender and
self-reported hypertension. Drinking behavior was classified
quantitatively according to the number of ounces of alcohol
consumed per week , rather than by the frequency. ]y^Hypertensives were identified by a positive response to the
question of whether a respondent had "ever had hypertension or
high blood pressure." Former drinkers (approximately 6% of
the study population) were excluded because no alcohol
consumption data was available for them. What Laforge found
was a reverse-J curve for the proportion of hypertension among
females stratified by quantity of alcohol consximed per week,
and a J-shaped curve for males. After controlling for body
mass, age, income, marital status, race and smoking with
multiple logistic regression, hypertension cunong females was

28
negatively associated with alcohol consumption at 0-2 oz. per
week and positively associated at 4 oz per week, but did not
reach statistical significance. Increasing age, black race,
increasing BMI, never having been married, and family income
of less than $35,000 per year were significant predictors of
hypertension among females. Among males, alcohol consumption
greater than 4 oz per week, increasing body mass, and black
race were significant predictors.
Weissfeld et al (1988) studied gender and age
interactions in the association between alcohol and blood
pressure. The study was a direct survey using a probability
sample of Michigan adults in 1983. The researchers observed
a J-shaped curve in every age category when respondents were
stratified by number of drinks per day, yet when these data
were adjusted for race, gender, age, Quetelet index, and
current treatment with antihypertensive medications, alcohol
consumption between zero and one drink daily was not
associated with blood pressure. Consumption of more than one
drink daily was significantly associated with increased
systolic and diastolic pressure and prevalence of elevated
blood pressure. It should be noted that this study only
looked at alcohol consumption over the two weeks prior to the
survey, and no lifetime abstainer category was used.
Attributable risk calculations showed that 8.4% and 8.5% of
uncontrolled hypertension among Michigan men and women
respectively could be attributed to consumption of more than

P»BS-«BI^^=S5S"5&^^*T
29
one drink daily.
Klag et al (1990) compared alcohol consumption and blood
pressure in middle-aged (35-59 years of age) Japanese and
American men in white-collar phone company management jobs.
Alcohol use information was obtained by questionnaire, but
blood pressure, blood glucose, cholesterol, serum uric acid
and SCOT levels were clinically measured. Mean blood pressure
was found to be about the same in both groups of abstainers
(the study does not indicate whether this is recent or
lifetime abstention). For the Japanese, blood pressure then
rose in a linear relationship with alcohol intake, whereas for
the Americans, a J-shaped curve was plotted. After adjusting
for other variables, alcohol intake was independently
associated with the prevalence of hypertension in the Japanese
men. The researchers hypothesized, however, that the American
abstainers with the highest blood pressure were in fact
drinkers, based on serum uric acid and SCOT results, and that
if abstainers were excluded, a linear positive relationship
between alcohol consumption and blood pressure would also be
found among American men.
The only recent study considered here in which an
apparently protective effect of lighter drinking persisted is
one by Klatsky et al (1990), which examines cardiovascular
mortality in nondrinkers, former and current drinkers. The
study group consisted of 123,840 HMO members, with 1,002
cardiovascular deaths. Screening, laboratory tests, and a

30
questionnaire on medical history and alcohol consumption were
used for study classification. When adjusted for age, gender,
race, BMI, marital status and education, use of alcohol was
associated with a higher risk of mortality from hypertension,
hemorrhagic stroke and cardiomyopathy, but a lower risk from
coronary artery disease (CAD), occlusive stroke, and
"nonspecific cardiovascular syndromes." A U-shaped alcohol-
CAD curve was observed for groups both with and without
baseline CV or CAD risk. While these researchers acknowledge
that the lower CAD risk among light drinkers (1-2 drinks/day)might be a spurious relationship created by unmeasured traits
in abstainers (psychological, dietary, physical exercise
habits), they suggest that the blood lipid or antithrombotic
effects of alcohol are plausible factors in lowering CAD risk.
Methods; Phase 2
A comparison group was created using the remainder of the
NHIS survey population to determine whether the statistically-significant differences in levels of hypertension amongabstainers and moderate drinkers was an alcohol-related
effect, unaffected by solvent exposure. Restrictions for the
comparison group were at least five years within a givenoccupation, and at least five years of alcohol consumption fornon-abstainers. The xylene-exposed population and the
comparison group of all others were then studied for the
proportion of the population who had doctor-diagnosed

31
hypertension, the one selected health effect for whichdifferences by drinking status were statistically significant.Logistic regression with SUDAAN software was used to controlfor confounding variables and to allow any significantinfluence of solvent exposure to be determined.
Results
A reverse-J hypertension curve, similar to that for theexposed population, was found among drinking categories in thecomparison group: 7.43% for abstainers, 4.41% for moderates,and 6.40% for frequent drinkers (see Table 2). In eachcategory, the proportion of hypertension was smaller than thatfor the comparable xylene-exposed category. The overallproportion of hypertension among the xylene-exposed populationwas 7.07%, while that among the comparison group was 5.55%.This difference is significant at the 95% confidence level(95% CI 6.03-8.10 for xylene-exposed and 5.24-5.85 for allothers).
TABLE 2
Comparative Proportions of Doctor-Diagnosed Hypertension inExposed and Comparison Group, Stratified on Drinking Status (%)
ExposedComparison
Dr nking StatusAbstainer
9.997.43
Moderate5.624.41
Frequent Total7.526.40
7.075.55

32
Age, gender, race, drinking and smoking behaviors, and
body mass index (BMI) are potential confounders of this
relationship. Therefore, the two study groups were stratified
and compared according to each of these characteristics exceptBMI, for which data were unavailable. Comparative profiles of
the groups are shown in Tables 3-5. The most notable
difference between the two groups was by gender: the xylene-exposed population was only 29% female while the comparison
group had an equal proportion of males and females. The ageprofile of both groups was similar, and within each group,
subjects fell roughly into thirds among the age categories:<40 years, 40-60 years, >60 years. Overall, the solvent-
exposed group was slightly older, with 30% over 60 years ofage, versus 24% over 60 for all others.
Profiles of Exposed and Comparison Group*
Table 3 Age and Gender
1 AgeExposed
Male FemaleComparison
Male Femal 1
1 Under 4040-60
1 Over 60
1 Total
25.71
24.97
19.97
70.65
9.15
9.78
10.43
29.36
20.22
18.56
10.82
49.60
18.50 118.75 113.15 1
50.40 1
Table 4 Drinking Frequency
prinking Status Exposed Compariso 1
1 Abstainer1 Moderate1 Frequent
25.22
56.55
18.23
28.34 157.65 114.01 1
Table 5 Smoking Behavior
Smoking Behavior
Never
Former
Current
Exposed
35.82
31.48
32.70
* Because every observation in the NHIS dataset is weighted, actual numbersof observations would be misleading. Proportions are presented here.
Comparison
44.76
27.19
28.05

^B^BftgB^MJ*-''
33
Drinking classification was also similar between both
groups, with abstainers being slightly (3%) more numerous
among the non-exposed group, and frequent drinkers being
slightly (3%) more numerous among the solvent-exposed. The
exposed group was divided roughly into thirds among never-
smokers, former smokers and current smokers. For the
comparison group, a larger proportion of the group (45% versus
36%) reported never smoking.
The proportion of hypertension within age, gender,
smoking and drinking stratifications for each study group was
compared. Tables 6 and 7 present these data. In almost every
category, the proportion of hypertension among the exposed
population exceeded that for the comparison group. Exceptions
to this occurred most noticeably in the oldest age group:
among abstainer males over 60, frequent drinker females over
60, and current smoker males or females over 60.
TABLE 6
1 Proportion of Hypertension in Exposed and Comparison Group 11 Stratified on Age, Gender and Drinl<ing Status (%) 1
Drinking Exposed Comparison |1 Status Age Male Female Male Female 1
Under 40 1.63 2.16 1.24 1.93 11 Abstainer 40-60 7.87 9.86 5.48 6.24 1
Over 60 9.63 18.78 10.45 14.46 1Under 40 1.92 2.25 1.65 0.86 1
1 Moderate 40-60 5.53 5.51 5.57 5.21 1Over 60 10.01 18.09 9.23 13.00 1Under 40 3.08 0.00 2.48 0.77 1
1 Frequent 40-60 10.35 11,66 5.92 7.19 1Over 60 8.49 4.71 9.91 11.53 1

34
TABLE?
Proportion of Hypertension in Exposed and Comparison GroupStratified on Age, Gender and Smol(ing Behavior (%)
1 Smoking Exposed Comparison |1 Behavior Age Male Female Male Female 1
1 Never Under 40 2.59 1.68 1.27 1.32 11 Smolted 40-60 9.84 6.10 5.05 5.11 1
Over 60 12.52 19.93 8.95 13.97 1Under 40 1.27 2.55 1.70 1.33 1
1 Former 40-60 5.26 8.59 6.26 7.27 1Over 60 8.98 19.03 8.98 12.54 1Under 40 2.05 2.52 2.28 0.80 1
1 Current 40-60 7.58 10.79 5.37 5.73 1Over 60 8.6 6.59 12.25 13.91 1
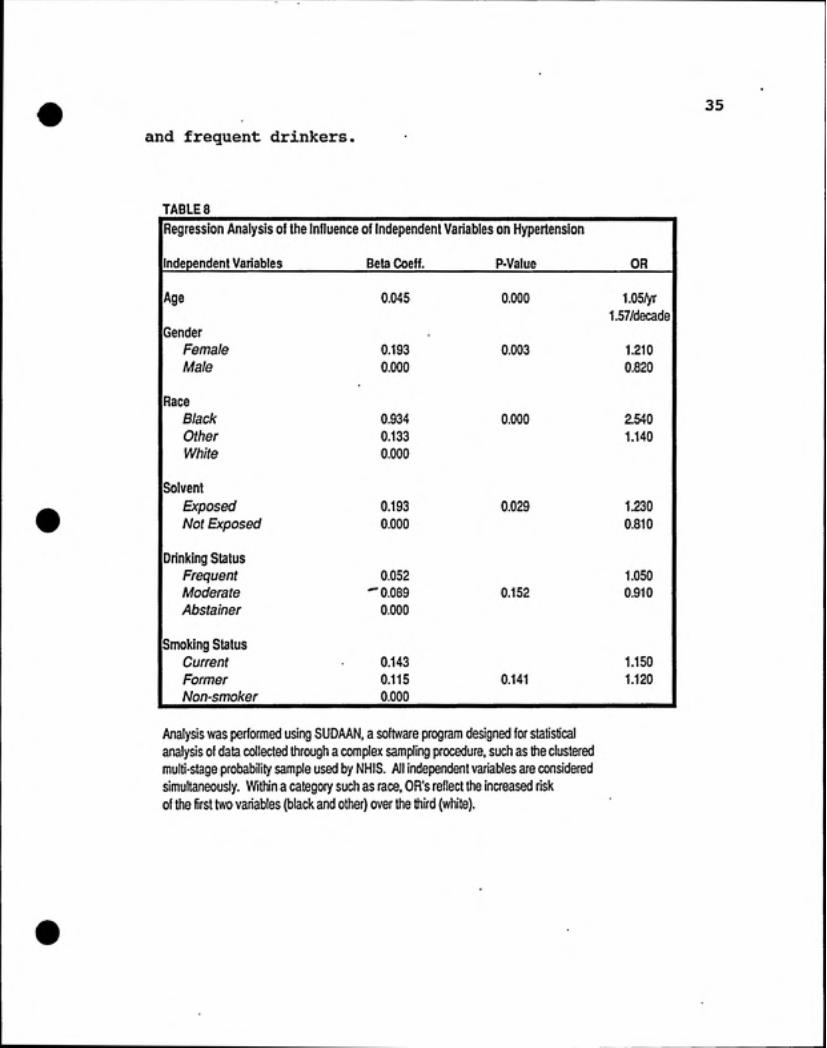
Logistic regression was then used to test the association
between hypertension and solvent exposure, age, gender, race,
drinking frequency and smoking behavior when all variables
were simultaneously compared. Odds ratios for each variable
are shown in Table 8. The greatest risk for hypertension in
this model was black race (OR=2.54). Age was the second
highest risk factor (OR=1.05/yr or 1.57/decade). Solvent
exposure was third (OR=1.23) and female gender was fourth
(0R=1.21). Each of these variables was significant at p<
0.05. Neither drinking frequency nor smoking behavior were
statistically significant in this model, although the odds
ratios indicate slightly elevated risk among current smokers
35
and frequent drinkers.
TABLE 8
[Regression Analysis of the Influence of Independent Variables on Hypertension
llndependent Variables Beta Coeff. P-Value OR 1
lAge 0.045 0.000 1.05/yr 11.57/decad 1
Gender
1 Female 0.193 0.003 1.210 11 Male 0.000 0.820 1JRace1 Black 0.934 0.000 2.540 11 Other 0.133 1.140 11 White 0.000
Solvent
1 Exposed 0.193 0.029 1.230 11 Not Exposed 0.000 0.810 1iDrinking Status1 Frequent 0.052 1.050 11 Moderate -0.089 0.152 0.910 11 Abstainer 0.000
Ismoking Status1 Current 0.143 1.150 11 Former 0.115 0.141 1.120 1\ Non-smoker 0.000
Analysis was performed using SUDAAN, a software program designed for statisticalanalysis of data collected through a complex sampling procedure, such as the clusteredmulti-stage probability sample used by NHIS. All independent variables are consideredsimultaneously. Within a category such as race, OR's reflect the increased riskof the first two variables (black and other) over the third (white).
i!,ippim..y!i.M.wt'
36
Discussion
The national prevalence of hypertension determined by
other studies ranges across all age groups, races, BMI's,
levels of income, and categories of smoking and drinking
behavior, from 17-21% among men and 21-25% among women (NHIS,
1983 and NIH, 1985). Stratification would yield values from
9.5%-55%. Clearly these values are much higher than the
proportions reported in this analysis. There are several
explanations for this, chief among them being the way in which
cases of hypertension are identified. Our study only includes
individuals who have worked at one job for at least five years
and counts as hypertensive those who have seen a doctor for
their condition. The mention of hypertension in an interview
would only have occurred if the condition caused a limitation
in the individual's activity, such as a missed day of work or
school, or if the individual happened to be among the one-
sixth of the sample queried specifically about hypertension as
a chronic condition (see description of Recode C above in
Methods section). Recode B tabulated the combined total of
Recode C cases, and those who report hypertension as limiting
their activity. It seems reasonable that the study group
restrictions would produce a healthier group overall, and that
hypertension would not often be reported as an activity
limitation, resulting in an undercounting of hypertensive
individuals. Nevertheless, we believe that the undercounting
would have occurred similarly in both study groups so that the

37
proportion of hypertension in each group would still be a
valid point of comparison.
The non-solvent independent variables of black race,
female gender and age which were found to have a significant
influence on hypertension have also achieved statistical
significance in other studies, as discussed above. Frequent
drinkers were at a slightly higher risk (OR=1.05) and moderate
drinkers at a slightly lower risk {OR=0.91) for hypertension
than abstainers, although the relationship was not
statistically significant. This lack of significance is in
variance with other studies. Had quantitative alcohol
consumption been used rather than consumption frequency, a
significant positive association might have been seen at
higher constimption levels. The disappearance of a significant
effect of alcohol consumption alone, when controlled on other
variables, seems consistent with other studies in which the
strength of other variables modified the alcohol/hypertension
relationship. It is also possible that the curve for both
groups is biased toward abstainers through self-
misclassification by drinkers. Both Laforge, using NHIS data,
and Klag, comparing Japanese and American men, suggest this
possibility. The bias is unlikely to be differential between
the study groups, but might have decreased the significance of
alcohol as a contributing factor to hypertension if
misclassified abstainers were actually frequent drinkers.
Smoking is considered to be a confounder in studies of

38
hypertension, but its relationship to the disorder is unclearin this and other literature cited. Both current and former
smokers were found to have a slightly elevated risk for
hypertension compared to nonsmokers, but the difference was
not significant. Laforge's analysis of 1983 NHIS data did
not include smoking as a variable. Current smoking was
negatively associated with hypertension in Klag et al. 's study
of Japanese and American men. Weissfeld's Michigan blood
pressure study also omitted smoking behavior as a variable.
A different regression model may be required to elucidate the
influence of smoking on hypertension.
After controlling for other variables, a modest but
statistically significant positive association between xylene
exposure and hypertension was found in this study, an
unanticipated outcome. The literature on cardiovascular
effects from solvent exposure is slim and seems primarily
associated with the more polar solvents. Among hydrocarbons,
the chlorinated hydrocarbons 1,1,1-trichloroethane and
trichloroethylene, and chlorofluorocarbons have been shown tocause cardiac sensitization to the action of chatecholamines
at low levels of exposure. This can result in arrhythmia or
sudden death at high exposure.
Methylene chloride, another chlorinated hydrocarbon
solvent, is metabolized to carbon monoxide. Although
epidemiological evidence on associated health effects is
conflicting, occupational exposure is thought to lead to

39
cardiovascular consequences similar to those associated with
CO: decreased ventricular fibrillation threshold, decreased
maximal exercise capacity, coronary artery disease or
myocardial infarction. One study of Eastman Kodak workers
exposed to methylene chloride (Hearne and Friedlander, 1981)
found a statistically significant increase in deaths from
hypertensive disease (4 deaths) over the internal control
group. In follow-up studies, however (Hearne and Friedlander,
1981, and Hearne et al, 1990) deaths from this cause of
mortality were too few to be presented in the results.
For nonhalogenated solvents, the literature is sparse.
In a multiple solvent study, Wilcosky and Tyroler (1983) found
that phenol had a modest but significant age-adjusted rate
ratio of 1.6 in association with heart disease mortality and
a significant two-fold excess in retired workers. No other
human studies examine this association, but in guinea pigs
Deichmann et al (1944) observed myocardial degeneration,
endothelial hyperplasia in pulmonary vessels, and thrombus
formation in the capillaries with phenol exposure.
Statistically significant elevations in the risk for ischemic
heart disease mortality have also been reported with
dinitrotoluene exposure (Levine et al, 1986) and with ethanol
exposure (Wilcosky and Tyroler, 1983).
The only literature reporting a link between organic
solvent exposure and hypertension appears to be a 1988 study
by Eskenazi et al which found a four-fold increased risk for

40
preeclampsia, a pregnancy disorder characterized by
hypertension, edema and proteinuria, among women exposed to
various organic solvents. A small number of cases limited the
statistical significance of the study, but solvent-exposed
women were 2-3 times more likely to be hypertensive when
controlling for other variables such as alcohol use, smoking,
unemployment, prior use of birth control pills and weeks of
gestation at interview, through multivariate analysis. A
significant increase in cardiovascular disease was also found,
although the numbers were very small (3) and none of the women
had the same diagnosis. The authors suggested that a
plausible explanation linking solvent exposure 'and
hypertensive disorders of pregnancy might be solvent-induced
pathological changes of the glomerules and renal tubules,
which have been observed in kidney biopsies of preeclamptic
women (Roberts, 1984).^ They note that studies of nonpregnantworkers have found a relationship between solvent exposure and
glomerulonephritis, and that other investigations eimong
solvent-exposed workers have found increased rates of
proteinuria.
Renal damage leading to renovascular hypertension from
xylene exposure is one possible explanation for this study'sfindings. Other possible mechanisms, although not describedin the literature, could also be proposed, based on the
'JM Roberts (1984) "Pregnancy-related hypertension," inMaternal Fetal Medicine: Principles and Practice. Creasy, RKand Resnick R, eds. Philadelphia: W.B. Saunders, pp 703-752.

41
metabolism of xylene, alcohol and other chemicals.
First, it is important to note that within the study
population and in the workplace, xylene-exposed workers are
likely to have multiple chemical exposures and almost
certainly multiple solvent exposures. Mixed xylenes contain
15% ethylbenzene, as well as smaller amounts of toluene,
trimethylbenzene, phenol, thiophene, pyridine and non-aromatic
hydrocarbons. During the selection of an exposed group for
this study, both xylene and styrene exposure were being
considered since literature on the neurotoxic properties andon the interactive effects with ethanol exists for both
chemicals. When NOES lists of exposed I/O couplets were
generated, the styrene list proved to be almost a subset of
the xylene list. With minor exceptions, all styrene I/O
couplets also appeared on the xylene list. A comprehensive
list of all exposures within the xylene-exposed population was
not generated because of the anticipated volume of data.
Nevertheless, to test for additional solvent exposures, lists
of I/O couplets for exposure to toluene, ethylbenzene,
acetone, methanol, isopropyl alcohol and ethylene glycol were
also generated and compared to the xylene list. As with
styrene, most of these lists proved to be subsets of the
xylene list, at least by industry group. There was some
divergence in exposure by occupation, and greater divergencebetween the toluene and xylene list. The likelihood of
multiple solvent exposures among this study's xylene-exposed

42
population, however, is great. In a study of organic solvent
use patterns in Japanese industry, Ikeda (1982) found that for
operations in which organic solvent exposure is convmon—
painting, printing, gluing and degreasing—the use of mixed
solvents predominated. The average number of organic solvent
components detected by GC was 3-4 in thinners, 5-6 in paints,
2-3 in inks, 3-4 in adhesives, and fewer than two in
degreasers.
Just as alcohol and xylene can compete for aldehyde
dehydrogenase, so too can xylene and some other solvents.
Xylene and ethylbenzene utilize the same enzyme systems for
biotransformation, requiring the cytochrome P-450 system for
initial oxidation and the alcohol/aldehyde dehydrogenase
enzyme system for further metabolism to excretable
metabolites. Studies have shown that combined exposure in
volunteers yields increased blood concentrations of the parent
compounds and decreased rates of elimination of metabolites.
Combined exposure to toluene and p-xylene, which also share
the same metabolic pathway, did not show this same metabolic
interaction, but the concentrations used (53 ppm toluene and
23 ppm p-xylene) were quite low (Wallen et al, 1985).
With combined exposure between an aromatic and an
aliphatic alcohol such as ethanol or isopropyl alcohol, the
alcohol preferentially binds all or most of the available ADH
enzymes, as has already been discussed. Twelve of the thirty-
one NIOSH HHE reports that document measurable isopropyl
43
alcohol concentrations also report the presence of xylene or
ethylbenzene, suggesting that this combined exposure is not
uncommon.
With or without combined solvent exposure, the rate of
xylene clearance of adipose tissue (half-time = 58 hours)
suggests that ongoing workplace exposure could allow
cumulative storage of this compound. The protective effect of
accelerated metabolic clearance operated in xylene/alcohol
interaction studies only with prior alcohol consiunption;
simultaneous administration resulted in competitive metabolism
and slowed xylene clearance. Combined simultaneous solvent
exposures may have a similar effect.
Competitive metabolism implies competition for the
alcohol/aldehyde dehydrogenase pathway. In ethanol
metabolism, blocking of the ADH pathway leads to a build-up of
acetaldehyde, which in turn has been reported to cause
tachycardia, hypertension, decreased diastolic blood pressure,
increased breathing rate and symptoms of alcohol intoxication.
It seems possible that competitive metabolism among mixed
solvents might result in an increase in aldehyde intermediates
which could have similar effects. In animal studies (Lieber,
1980), chronic ethanol exposure has been shown to result in a
reduced capacity for the liver mitochondria to oxidize
acetaldehyde and an increased susceptibility of the
mitochondria to acetaldehyde's effects. Chronic alcoholism
has also been shown to reduce activities of alcohol and

• '^mmmmm^mf-'
44
acetaldehyde dehydrogenases (Nuutinen et al, 1981). By
analogy, chronic mixed solvent exposure may competitively
stress the ADH system at lower levels, leading to similar
reductions in dehydrogenase activity and increased toxicity
from aldehyde intermediates.
Casarette and Doull's chapter on toxic responses of the
cardiovascular system states that "sustained hypertension is
the most important risk factor predisposing to coronary and
cerebral atherosclerosis." The vascular degenerative lesions
of hypertension are produced by increased vascular
permeability with "entry of blood constituents into the vessel
wall, activation of phospholipase, and release of free
arachinodate." Oxygen-centered free radicals generated in the
arachinodate-prostaglandin pathway are thought to lead to the
development of destructive lesions of endothelium and vascular
smooth muscle.^"
In the earlier discussion of solvent and ethanol
interactions, Sato et al were cited as suggesting that the
effects of ethanol may be qualitative, modifying the
endoplasmic reticulum membrane environment by allosteric
effects of by displacement of substrate bound to the enzymes.
Perhaps other solvents, or mixed solvents which interact
competitively, can also alter the endoplasmic reticulum
^°Balazs T, Hanig JP, and Herman EH, "Toxic Responses ofthe Cardiovascular System," in Casarette and Doull'sToxicology, 3rd edition. New York: MacMillan Publishing Co,1986, p 380.

45
membrane environment and lead to increased vascular
permeability and the associated development of vascular
degenerative lesions.

SUMMARY AND CONCLUSIONS
Limitations of Methodology
A major difficulty in associating effects with exposure
in this study is the lack of specific exposure data. Given
the overall lack of database exposure information, this could
be a limitation in most occupational database research. The
use of NOES-derived industry/occupation couplets, further
sorted by OSHA OCIS sampling results, is at best an assximption
of xylene exposure of undetermined intensity. Furthermore,
multiple solvent exposure almost certainly occurred, as
indicated by the comparison of I/O lists generated by NOES for
the solvents described above. The comparison group
undoubtedly contains individuals exposed to xylene and other
organic solvents. The specific impact of this is not certain,
but this nondifferential misclassification of exposure will
bias results toward the null, strengthening the finding of an
increased proportion of hypertension among the solvent-exposed
group.
The use of Recede B data on health conditions, which
required that the condition cause a limitation of activity,
and the requirement that the respondent have seen a doctor for
the condition, undoubtedly influenced these findings. The
likely effect would be an under-reporting of all conditions
and to the extent that this was nondifferential, it would bias

47
results toward the null. If conditions associated with
chronic solvent exposure are unlikely to limit activity, the
findings would again be differentially biased toward the null.
It is uncertain how under-reporting of conditions by heavy
drinkers might have affected results. If alcohol consumption
and solvent exposure do interact additively, but associated
conditions were under-reported, differential bias would have
occurred.
Lack of specific exposure data and lack of supportinginformation in the literature also make it difficult to draw
conclusions about the pattern of health effects observed in
this study. More controlled studies would be necessary to
test hypothesis generated here. Additionally, the regression
model used did not consider interactions between variables.
Had further analysis been performed, different conclusions may
have resulted regarding the factors significantly related to
hypertension.
Further Applications of Methodology
The current study probably pushed the bounds of the NHIS
datal)ase by selecting a single exposure. Additional
restrictions on the exposed group (five years at exposed job,
and five years simultaneous drinking status data) threatened
to make the study group too small. Nevertheless, working with
these databases made evident other applications of the
methodology:

48
1) Linking groups of analogous chemicals, or industries,
would allow screening for health effects from chronic
exposure, similar to the xylene analysis. Alcohol consumption
information need not be included.
2) The 1988 NHIS occupational health supplement is
currently being used to identify unusual morbidity patterns in
the workplace. It is possible that, by linking it with NOES
data, exposure patterns might also be found. NOES includes
physical agents and chronic trauma as well as chemical agents,
so a wide range of health effects may be investigated.
3) With the current emphasis on—and lack of information
about—mixed exposures, an alternative approach to combining
NOES and NHIS data could be to write a program which screens
NOES data for the most frequent exposure combinations and to
analyze health effects among workers in industries identified
with those mixed exposures.
4) NOES data can apparently be sorted on questions from
the management survey regarding the use of personal protective
equipment and other IH controls. It may be possible to study
the effectiveness of various IH measures by studying health
effects within industries where specific types of IH measures
predominate.
5) Finally, further use of the linking capacity between
the 1988 NHIS occupational health and alcohol supplements and
the core questionnaire, to extend our understanding of the
relationship between alcohol consumption and worker health

49
effects, also seems worthwhile.
Conclusions
When the exposed group was analyzed for the proportion of
several disorders according to drinking behavior, a persistent
J- or reverse-J curve was seen for ten our of eleven
disorders, suggesting a protective effect of alcohol.
Granted, the disorders considered were ones which have been
associated with alcohol, xylene or both, yet existing studies
of alcohol's protective effect do not cover such a wide range
of organ systems. One possible explanation of the pattern is
that moderate alcohol consumption itself confers a metabolic
advantage. Another possibility is that abstention from
alcohol is associated with other behaviors or qualities which
confer a disadvantage. Either possibility lends itself to
further research.
Exposure to solvents may increase the risk for
hypertensive disorders. The mechanism proposed here is that
competitive metabolism arising from concurrent solvent
exposure can increase acetaldehyde blood levels and result in
toxicological responses associated with elevated blood
acetaldehyde. Hypertension is among these responses- This
hypothesis could be tested in a more controlled study and
could contribute to the literature on health effects of mixed
solvent exposures. The widespread use of solvents in industry
and the high prevalence of cardiovascular disorders among
50
workers underscore the importance of further investigation.
Finally, the methodology itself seems to have merit as a
hypothesis-generating tool. The appeal of database studies to
research chronic toxicity in occupational settings is that
these studies can be conducted fairly quickly and
inexpensively and will allow us to accumulate preliminary
health effects information. Datasets which are not
occupationally-based may be most useful for investigating
morbidity patterns among the chronically-exposed, but the
researcher will be limited by the availability of occupation
information in such datasets. The 1988 NHIS may currently be
the most useful resource, because of its size, occupational
health supplement, and ability to produce a representative
national sample. By the mid- to late-90's, NHANES III should
be available, with new data on respiratory disease and
workplace neurotoxicity. An underlying implication is the
importance of developing and maintaining good health effects
databases. A familiarity with existing database information
and the ability to access and link it offer substantial
capacity for new research.

REFERENCES
Baelum J (1990) "Toluene in alveolar air during controlledexposure to constant and to varying concentrations."Int Arch Occup Environ Health 62: 59-64.
Calabrese EJ (1991) Multiple chemical interactions. LewisPublishers, Inc.
Eskenazi B, Bracken MB, Holford TR, Grady J (1988) "Exposure toorganic solvents and hypertensive disorders of pregnancy."Am Jrnl Indust Med 14: 177-188.
Ikeda M (1983) "Interactions and health aspects of exposure tomixtures of organic solvents," in Health Effects ofCombined Exposures to Chemicals in Work and CommunityEnvironments. Copenhagen: WHO Interim Document 11, 77-97.
Klag MJ, Moore RD, Whelton PK, Sakai Y, Comstock GW (1990)"Alcohol consumption and blood pressure: a comparison ofnative Japanese to American men." Jrnl Clin Epidemiology43: No. 12 1407-1414.
Klatsky AL, Armstrong MA, Friedman GD (1990) "Risk ofcardiovascular mortality in alcohol drinkers, ex- drinkersand nondrinkers." Am Jrnl Cardiology 66: 1237-1242.
Laforge R, Williams GD, and Dufour MC (1990) "Alcoholconsumption, gender and self-reported hypertension." Drugand Alcohol Dependence 26: 235-249.
Lieber CS (1980) "Metabolism and metabolic effects of alcohol."Seminars in Hematology 17(2):85-99.
Low LK, Meeks R, and Mackerer CR (1989) "Health effects of thealkylbenzenes. II. Xylenes." Tox and Ind Health5(1) 85-105.
Meyer P (1980) Hypertension: mechanisms and clinical andtherapeutic aspects. London: Oxford University Press.
Mizushima S, Nara Y, Mano N, Sawamura M, Horie R, Yamori Y(1990) "Alcohol consumption as a risk factor for highblood pressure from the cardiovascular diseases andalimentary comparison study," Jrnl Cardiovasc Pharm6:(Suppl. 8) S35-S37.

52
Moushmoush B, Abi-Mansour P (1991) "Alcohol and the heart: thelong-term effects of alcohol on the cardiovascularsystem." Arch Intern Med 151:Jan. 36-41.
National Institute of Health (1985) The Public and HighBlood Pressure: Six-Year Followup Survey of PublicKnowledge and Reported Behavior. NIH Publication No.85-2118.
National Research Council (1992) EnvironmentalNeurotoxicology. Washington, D.C.: National AcademyPress.
NIOSH (1987) "Organic solvent neurotoxicity." CurrentIntelligence Bulletin 48, pub. no. 87-104.
Nuutinen H, Lindros K, Pikkardnen P, and Salaspuro M (1981)Gastroenterology 80:1343.
Pedersen LM (1985) "Influence of solvents, alcohol, smoking andage on biological tests." Int Arch Occup Env Health55:121-131.
Riihimaki V and Hanninen O (1987) "Xylenes," in EthelBrowning's Toxicity and Metabolism of Industrial Solvents,2nd ed. Elseveir Science Publishers B.V., vol. 1.
Sato A, Nakajima T, and Koyama Y (1980) "Effects of chronicethanol consumption on hepatic metabolism of aromatic andchlorinated hydrocarbons in rats." Brit J Ind Med37:382-386.
Savolainen K (1980) "Combined effects of xylene and alcohol onthe central nervous system." Acta pharmacol. ettoxicol. 46: 366-372.
Savolainene H, Vainio H. Helojoki M, Elovaara E (1978)"Biochemical and toxicological effects of short-termintermittent xylene exposure and combined alcoholintake." Arch Toxicol 41:195-205.
Schnare, DW and Karzman MT, eds. (1989) Chemical Contaminationand Its Victims. New York: Quorum Books.
Sedivec V and Flek J (1976) "The absorption, metabolism, andexcretion of xylenes in man." Int Arch Occup Environ Hlth37:205-217.

53
Tarkowski S (1983) "Excretion of methylhippuric acids in theurine of persons exposed to xylene and to mixtures ofsolvents," in Health Effects of Combined Exposures toChemicals in Work and Community Environments,Copenhagen:WHO Interim Document 11, 269-282.
Waldron HA (1983) "The effects of ethanol on blood tolueneconcentrations." Int Arch Occup Env Health 51:365-369.
Weissfeld JL, Johnson EH, Brock BM, and Hawthorne VM (1988) 'S&cand age interactions in the association between alcoholand blood pressure." Am J Epidemiol 128:559-69.
Wilcosky TC and Simonsen NR (1991) "Solvent exposure andcardiovascular disease." Am J Ind Med 19:569-586.
Wills BW and Venable HL (1982) "The Interaction of EthylAlcohol and Industrial Chemicals." Am J Ind Med 3:321- 3B.
World Health Organization International Agency for Researchon Cancer (1988) lARC Monograph on the Evaluation ofCarcinogenic Risks to Humans, vol. 47, pp 125-156.