nitrogen fertilizer management in intensive cropping systems
TRANSCRIPT

Nitrogen Fertilizer Management In Intensive Cropping Systems
Ardell Halvorson USDA-ARS
Fort Collins, COEmail: [email protected]
Research Cooperators: Mike Bartolo, CSU-AVRC, Curtis Reule, USDA-ARS, Abdel
Berrada, CSU-AVRC
Presented at the Irrigation and Nutrient Management Workshop, Rocky Ford, CO, January 30, 2008

N Fertility Studies at AVRC to be discussed
• Onion N15 Study in 1998• Corn N15 Study in 1999• Corn N rate study from 2000 –
2003, following watermelon in 1999.
• Chile Pepper (Sonora) N rate study in 2004 following corn.
• Onion N rate study in 2005 following chile pepper.
• Corn N rate study in 2006 and 2007 (recovery of residual N fertilizer by corn following chile pepper and onion in rotation).
• Second N rate study on onioninitiated in 2006 following soybean. Corn followed onion in 2007.
Halvorson, USDA-ARS, Fort Collins, CO

Problem Being Addressed:• High levels of residual soil NO3-N in irrigated
cropland in Arkansas River Valley.
• High NO3-N levels in groundwater in Arkansas River Valley of Colorado.
• Contributing factors:– High rates of N fertilizer applied to vegetable
crops – Shallow rooting depths of vegetable crops– Inefficient use of applied N fertilizer by crops. – Example, N fertilizer use efficiency (NFUE) by
onion at AVRC was only 15%.
Halvorson, USDA-ARS, Fort Collins, CO

Results of 15N Study (1998-1999)
• N Fertilizer use efficiency (NFUE) by onion:– 11% for the fertilizer applied May 20th
– 19% for the fertilizer applied June 13th
– Only 15% of the N applied to onion in 1998 was utilized by the onions.
• Corn in 1999 used an additional 12% of the fertilizer N applied to onion in 1998.
• Total NFUE was about 27% for the two crops.
Halvorson, USDA-ARS, Fort Collins, CO
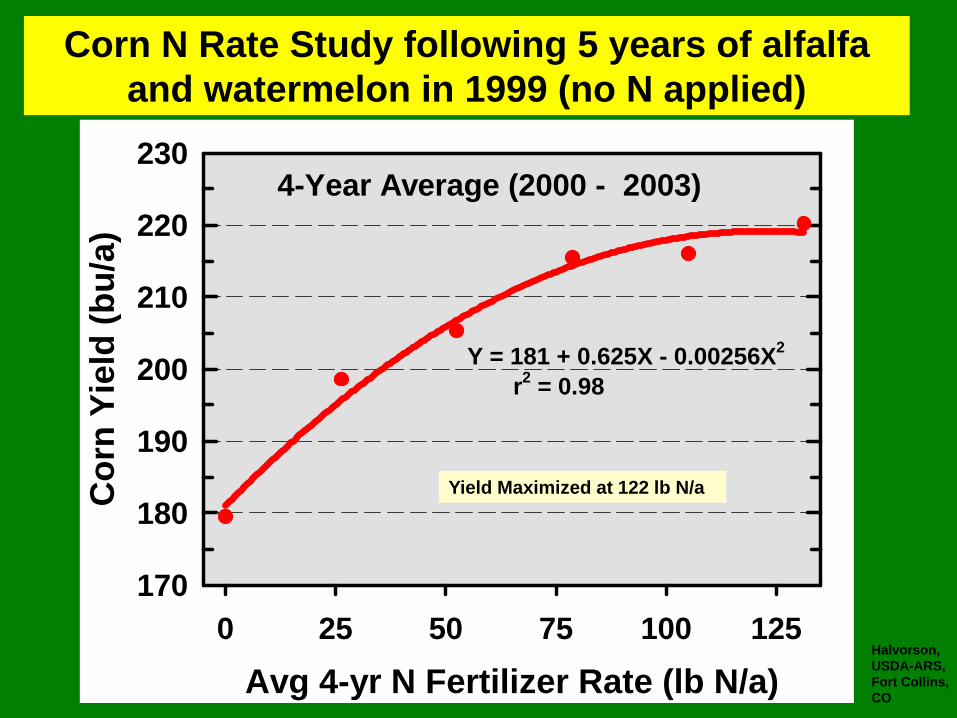
4-Year Average (2000 - 2003)
Avg 4-yr N Fertilizer Rate (lb N/a)0 25 50 75 100 125
Cor
n Yi
eld
(bu/
a)
170
180
190
200
210
220
230
Y = 181 + 0.625X - 0.00256X2 r2 = 0.98
Corn N Rate Study following 5 years of alfalfa and watermelon in 1999 (no N applied)
Yield Maximized at 122 lb N/a
Halvorson, USDA-ARS, Fort Collins, CO

Rocky Ford, CO (2001 - 2003)
Soil N (0-3ft) + Fertilizer N (lb N/A)50 100 150 200 250 300
Cor
n G
rain
Yie
ld (b
u/A
)
120
140
160
180
200
220
240
Y = 81.9 + 1.09X - 0.0023X2
r2 = 0.87
Maximum Yield with 237 lb N/A
Halvorson, USDA-ARS, Fort Collins, CO

Chile Pepper in 2004 following 4-yr of Corn
(Same N plots used for corn)
Halvorson, USDA-ARS, Fort Collins, CO

2004 Chile Pepper N Study, Rocky Ford
N Fertilizer Rate (lb N/a)0 30 60 90 120 150
Fres
h Pe
pper
Yie
ld (b
u/a)
1000
1200
1400
1600
1800
2000
Y = 1142 + 8.61X - 0.0276X2
r2 = 0.96
(20 Sept 04 Harvest)
Y = 1205 + 8.96X - 0.0298X2
r2 = 0.96
(20 Sept + 5 Oct 04 Harvest)
Halvorson, USDA-ARS, Fort Collins, CO

2004 Chile Pepper N Study, Rocky Ford
N Fertilizer Rate (lb N/a)0 30 60 90 120 150
Gro
ss In
com
e ($
/a)
8000
10000
12000
14000
16000
18000
20000
Y = 9637 + 71.67X - 0.239X2
r2 = 0.96
Y = 12046 + 89.58X - 0.298X2
r2 = 0.96
Whole Sale @ $8/buRetail @ $10/bu
Halvorson, USDA-ARS, Fort Collins, CO

2004 N Study on Chile Pepper, Rocky Ford
Day-Of-Year160 180 200 220 240 260 280
N U
ptak
e (lb
N/a
)
020406080
100120140160180200
Peppers
June
7
June
16
July
8 July
22
Augu
st 5
Augu
st 2
4
Whole Plant
Stems & Leaves
Sept
. 1 Sept
. 20
(Uptake data for 150 lb/a N rate)
Halvorson, USDA-ARS, Fort Collins, CO


Onion in 2005 following Chile Pepper in 2004
Halvorson, USDA-ARS, Fort Collins, CO

2005 Nitrogen & Irrigation Study on Onion
• N rates: 0, 40, 80, 120, 160, 200 (lb N/a)
• N Source: Polymer-coated urea (Duration Type III fertilizer with a 120 day release period; provided by Agrium)
• Applied February 22, 2005
Halvorson, USDA-ARS, Fort Collins, CO

Irrigation Methods Used
• Furrow Irrigation (normal practice)
• Drip Irrigation (alternative practice)
• Water Applied to Onions:– Furrow Irrigation = 96 inches– Drip Irrigation = 27 inches
Halvorson, USDA-ARS, Fort Collins, CO

Total Marketable Onions in 2005 at Rock Ford, CO
N Fertilizer Applied (lb N/a)0 40 80 120 160 200
Oni
on Y
ield
(50
lb b
ags/
a)
1200
1300
1400
1500
1600
1700
1800
1900
Furrow
Drip
Y = 1657 + 1.853X - 0.0072X2
r2 = 0.46
Y = 1248 + 4.744X - 0.0114X2
r2 = 0.92
Halvorson, USDA-ARS, Fort Collins, CO
Drip maximized at 129 lb N/a and Furrow at 208 lb N/a
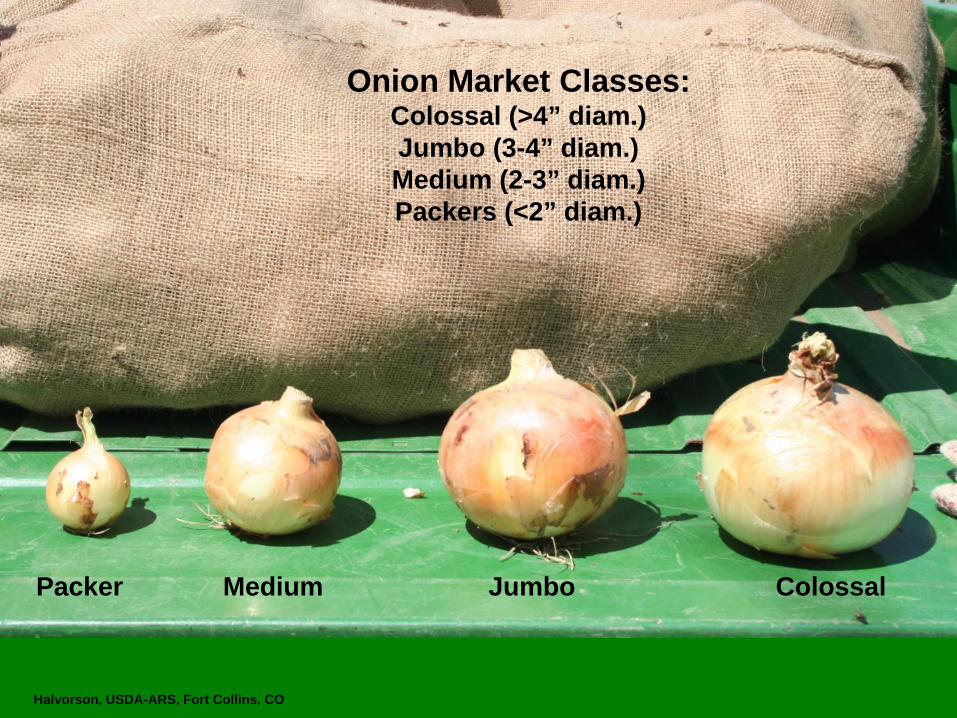
Packer Medium Jumbo Colossal
Onion Market Classes:Colossal (>4” diam.)Jumbo (3-4” diam.)Medium (2-3” diam.)Packers (<2” diam.)
Halvorson, USDA-ARS, Fort Collins, CO

Onion Market Class (2005 Rocky Ford, CO)
N Fertilizer Rate (lb N/a)0 40 80 120 160 200 240
Fres
h O
nion
Yie
ld (b
ags/
a)
0200400600800
1000120014001600
Jumbo
Colossal
Medium
Drip
Furrow
Drip
FurrowDrip
Furrow
Halvorson, USDA-ARS, Fort Collins, CO

Gross Return - Production Costs (N, Water, Drip system)
N Fertilizer Rate (lb N/a)0 40 80 120 160 200
Estim
ated
Ret
urn
($/a
)
9000
10000
11000
12000
13000
14000
15000
Drip
Furrow
Average
Drip:
Furrow:
Average: Y = 11023 + 30.55X - 0.0864X2
r2 = 0.91
Y = 9447 + 43.86X - 0.1062X2
r2 = 0.93
Y = 12600 + 17.22X - 0.0663X2
r2 = 0.50
2005 Onion Crop at Rocky Ford
Halvorson, USDA-ARS, Fort Collins, CO
Drip maximized at 130 lb N/a; Furrow at 206 lb N/a; Average at 177 lb N/a

2006 Nitrogen & Irrigation Onion Study at Rocky Ford(new plot area, soybean in 2005)
Yield and Economics Drip FurrowDifference
Drip-Furrow
Total Marketable Onion Fresh Yield (cwt/a) 722.00 648.71 73.29
Colossal size onion (cwt/a) 8.92 0.77 8.15
Jumbo size onion (cwt/a) 603.61 394.83 208.78
Medium size onion (cwt/a) 159.47 253.11 - 93.64
Packers (discards) (cwt/a) 4.86 9.08 - 4.22
Total Gross Market Value ($/a) $17,288 $13,547 $3,741
Colossal value ($/a) @$28/cwt $ 250 $ 22 $ 228
Jumbo value ($/a) @$24/cwt $14,487 $ 9,476 $5,011
Medium size value ($/a) @$16/cwt $ 2,552 $ 4,050 -$1,498
No significant response to N fertilization or N x irrigation interactions
Halvorson, USDA-ARS, Fort Collins, CO

Halvorson, USDA-ARS, Fort Collins, CO
N uptake of Onion averaged over years (2005-2006), N rates, and irrigation systems at AVRC.
Day-of-Year140 160 180 200 220 240 260
N u
ptak
e (lb
N/a
)
0
20
40
60
80
100
120
Bulbs
Tops
May
22
Jun7
Jun21 Ju
l5Ju
l19
Aug2
Aug16
Aug30
Top + Bulb
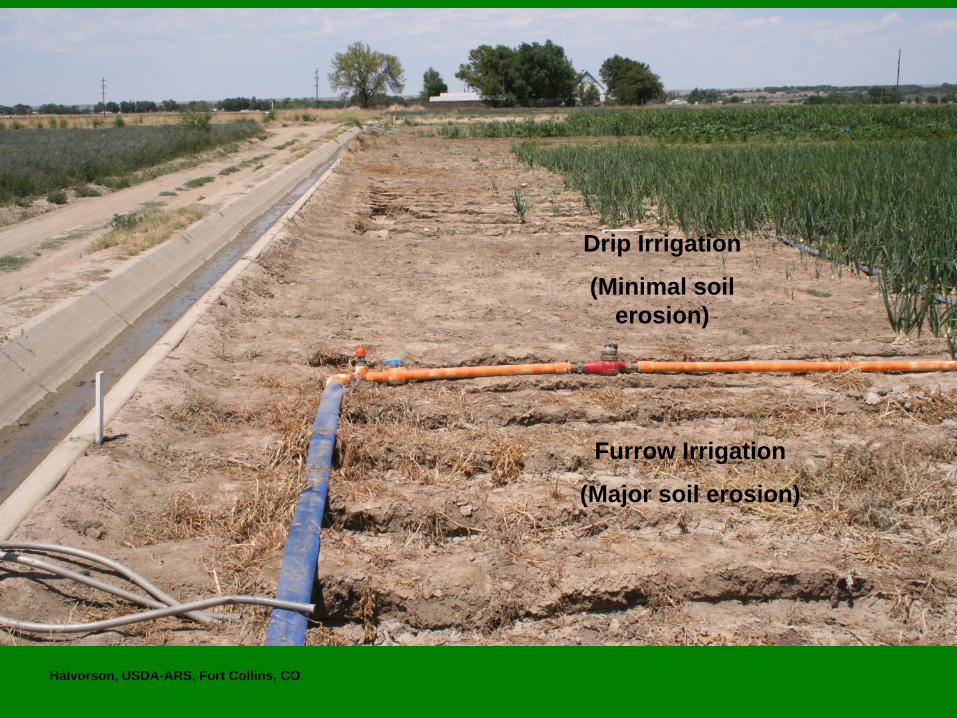
Drip Irrigation
(Minimal soil erosion)
Furrow Irrigation
(Major soil erosion)
Halvorson, USDA-ARS, Fort Collins, CO

April 4, 2006 (0 - 6 ft depth)
2006 Corn Fertilizer N Rate (lb N/a)0 20 40 60 80 100 120
Soil
NO
3-N
(lb
N/a
)
0
50
100
150
200
250
300
350
400
05 Drip Onion Plots
05 Furrow Onion Plots
N Managment I Study at AVRC, Rocky Ford, CO
Initial Soil NO3-Nlevel in Feb. 2005
Corn in 2006 following 2005 Onion StudyResidual Soil N levels following Onion
Halvorson, USDA-ARS, Fort Collins, CO

2006 Corn yields on 2005 Onion plots
Soil NO3-N (0-3ft) + Fertilizer N (lb N/a)0 100 200 300 400 500
Cor
n G
rain
Yie
ld (b
u/a)
140
160
180
200
220
240
260
280
30005 Drip Onion plots05 Furrow Onion plots
Y = 134.76 + 0.722X - 0.00092X2
r2 = 0.73
Corn was furrow irrigated in 2006
Note: Yields near maximum with 250-300 lb N/a
Halvorson, USDA-ARS, Fort Collins, CO

2006 Corn following 2005 Onions, Rocky Ford
N Fertilizer Rate (lb N/a)0 20 40 60 80 100 120
Cor
n G
rain
Yie
ld (b
u/a)
160
180
200
220
240
260
280
05 Drip Onion plots
05 Furrow Onion Plots
Y = 206.3 + 1.41x - 0.0076X2
r2 = 0.98
Y = 165.4 + 1.31X - 0.0040X2
r2 = 0.995
Note: 2006 Corn crop was furrow irrigatedHalvorson, USDA-ARS, Fort Collins, CO

Residual soil NO3-N following onion (2005) and Corn (2006)
2007 Fertilizer N Rate (lb N/a)0 20 40 60 80 100 120
Res
idua
l Soi
l NO
3-N
(lb
N/a
)
020406080
100120140160180200
05 DI 10Apr07
05 FI 10Apr07
(0-6ft soil depth)
2nd Corn Crop, N Management I Study at AVRC
Avg DI & FI 16Oct07
Residual Soil N following 2006 Corn crop and before fertilizing the 2007 corn crop and after harvest
Halvorson, USDA-ARS, Fort Collins, CO

2007 Grain yield following Corn in 2006 and Onion in 2005 at Rocky Ford, CO
Soil NO3-N (0-3ft) + Fertilizer N (lb N/a)0 50 100 150 200 250 300 350
Cor
n G
rain
Yie
ld (b
u/a)
0
50
100
150
200
250
300
Y = 40.54 + 1.31X - 0.0021X2
r2 = 0.90
N Management I Study at AVRC, Rocky Ford, CO
05 Drip Onion Plots05 Furrow Onion Plots
Corn was furrow irrigated in 2007
Halvorson, USDA-ARS, Fort Collins, CO

2007, 2nd Year of Corn on 2005 Onion Plots at Rocky Ford
Fertilizer N Rate (lb N/a)0 20 40 60 80 100 120
Cor
n G
rain
Yie
ld (b
u/a)
406080
100120140160180200220240260
'05 DI plots
'05 FI plots
Grain yield of 2007 Corn crop (furrow irrigated)
Halvorson, USDA-ARS, Fort Collins, CO

N Management I Study at AVRC, Rocky Ford, CO
N Fertilizer TreatmentYear Crop N1 N2 N3 N4 N5 N6
N Removed in Harvested Portion of Crop, lb N/a2000 Corn 149.1 158.3 140.8 145.2 156.5 156.62001 Corn 95.2 107.7 111.9 118.3 123.9 124.72002 Corn 68.6 84.3 91.2 104.8 108.7 116.32003 Corn 72.9 92.9 118.2 125.9 129.2 143.32004 Chile
Pepper62.6 69.8 98.1 90.9 106.7 105.3
2005 Onion 90.3 87.4 100.6 116.9 111.6 117.32006 Corn 76.4 94.4 108.0 122.9 129.5 130.72007 Corn 48.8 65.4 72.8 112.18 151.18 165.2Total N removed
(8 crops)663.9 760.2 830.6 937.3 1017.3 1059.4
Total N added, lb N/a 0 215 430 685 900 1115N Fert. Use Efficiency 45% 39% 40% 39% 35%Avg N Rate, lb N/a 0 26.9 53.8 85.6 112.5 139.4
Halvorson, USDA-ARS, Fort Collins, CO

Rocky Ford, CO (Based on 6 Corn crops)
Average Fertilizer N Rate (lb N/a)0 25 50 75 100 125
Aver
age
Cor
n G
rain
Yie
ld (b
u/a)
150160170180190200210220230240
Y = 163.0 + 0.848X - 0.00267X2
r2 = 0.995
(2000, 2001, 2002, 2003, 2006, and 2007)
Halvorson, USDA-ARS, Fort Collins, CO

Rocky Ford, CO (Based on avg yield of 6 Corn crops)
Average Fertilizer N Rate (lb N/a)0 25 50 75 100 125
Gro
ss R
etur
ns -
N C
osts
($/a
)
625650675700725750775800825850 Corn Grain Price = $3.95/bu
Urea N price = $0.54 and $0.60/lb N
Urea ($550/ton)Urea ($490/ton)
Halvorson, USDA-ARS, Fort Collins, CO

(2007 Corn yield following 2006 Onion crop)
Soil NO3-N (0-3ft) + Fertilizer N (lb N/a)0 50 100 150 200 250 300 350 400
Cor
n G
rain
Yie
ld (b
u/a)
140
160
180
200
220
240
260
280
300 06 Drip Onion plots06 Furrow Onion plots
Y = 135.98 + 0.995X - 0.0018X2
r2 = 0.72
N Management II Study at AVRC, Rocky Ford, CO
Corn was furrow irrigated in 2007
Yield Maximized at 276 lb N/a
2007 Corn yields following 2006 Onion crop(new N study initiated in 2006)
Halvorson, USDA-ARS, Fort Collins, CO

Total N Needs of Corn:Avg = 1.14 lb N/bu
Grain N Removal by Corn:Avg = 0.69 lb N/bu
Halvorson, USDA-ARS, Fort Collins, CO

Conclusions from Onion Studies• Onion response to N fertilization was minimal
following soybean.
• Drip Irrigation resulted in greater marketable onion yields and more large sized onions at lower N rates than the normal furrow irrigation system.
• Drip required less irrigation water.
• Drip irrigation appears to have an economic advantage over furrow irrigation.
• Drip irrigation resulted in less soil erosion.
Halvorson, USDA-ARS, Fort Collins, CO

Strategy Tips for N Management• Use corn as a scavenger to recover unused fertilizer N applied
to vegetable crops.
• Corn can reduce residual soil NO3-N levels.
• Reduce N fertilizer rates applied to corn following onion based on soil test.
• Reduce rates of N applied to Onion.
• Delay N application to Onion crop until late-May and Chile Pepper until mid-June.
• Use polymer-coated urea (controlled release N fertilizers).
• Use drip irrigation on onion and other high cash value vegetable crops to get more efficient use of N by reducing N rates, and a reduction in water application.
• Soil Test for residual soil N before fertilizing.Halvorson, USDA-ARS, Fort Collins, CO

Collecting Corn and Soil Samples from N Management Study at Rocky Ford
Thanks for Listening!!
Questions???Halvorson, USDA-ARS, Fort Collins, CO