nitrogen outlook - fertilizer industry round table | fot - nitrogen outlook.pdf · and the...
TRANSCRIPT

Nitrogen Outlook
Fertilizer Outlook & Technology Conference
Doug Hoadley
Nov 2013
All statements in this communication, other than those relating to historical facts, are “forward-looking statements.” These
forward-looking statements are not guarantees of future performance and are subject to a number of assumptions, risks and
uncertainties, many of which are beyond our control, which could cause actual results to differ materially from such statements.
These statements include, but are not limited to, statements about the benefits, expected timing of closing and other aspects of
the proposed transactions with Mosaic; statements about future strategic plans; and statements about future financial and
operating results. Important factors that could cause actual results to differ materially from our expectations include, among
others: risks and uncertainties arising from the possibility that the proposed transactions with Mosaic may be delayed or may not
occur, including delays arising from any ability to obtain governmental approvals of the transactions; the risk that other conditions
to the closing of the proposed transactions with Mosaic may not be satisfied; difficulties with realization of the benefits of the
proposed transactions with Mosaic; the risk that disruptions from the proposed transactions with Mosaic will harm relationships
with customers, employees and suppliers; the volatility of natural gas prices in North America; the cyclical nature of our business
and the agricultural sector; the global commodity nature of our fertilizer products, the impact of global supply and demand on our
selling prices, and the intense global competition from other fertilizer producers; conditions in the U.S. agricultural industry;
reliance on third party providers of transportation services and equipment; risks associated with cyber security; weather
conditions; our ability to complete our recently announced production capacity expansion projects on schedule as planned and
on budget or at all; risks associated with other expansions of our business, including unanticipated adverse consequences and
the significant resources that could be required; potential liabilities and expenditures related to environmental and health and
safety laws and regulations; our potential inability to obtain or maintain required permits and governmental approvals or to meet
financial assurance requirements from governmental authorities; future regulatory restrictions and requirements related to
greenhouse gas emissions; the seasonality of the fertilizer business; the impact of changing market conditions on our forward
sales programs; risks involving derivatives and the effectiveness of our risk measurement and hedging activities; the significant
risks and hazards involved in producing and handling our products against which we may not be fully insured; our reliance on a
limited number of key facilities; risks associated with joint ventures; acts of terrorism and regulations to combat terrorism;
difficulties in securing the supply and delivery of raw materials, increases in their costs or delays or interruptions in their delivery;
risks associated with international operations; losses on our investments in securities; deterioration of global market and
economic conditions; our ability to manage our indebtedness; and loss of key members of management and professional staff.
More detailed information about factors that may affect our performance may be found in our filings with the Securities and
Exchange Commission, including our most recent periodic reports filed on Form 10-K and Form 10-Q, which are available in the
Investor Relations section of the CF Industries Web site. Forward-looking statements are given only as of the date of this release
and we disclaim any obligation to update or revise the forward-looking statements, whether as a result of new information, future
events or otherwise, except as required by law.
2
Safe Harbor Statement

CF Overview
2014 U.S. Nitrogen Demand Outlook
Medium Term Outlook
Agenda

Global Leader in Plant Nutrient
Manufacturing and Distribution
Founded in 1946 as U.S. based
farm cooperative
IPO in 2005 (NYSE: CF) with a market
capitalization of $880 million
Growth and evolution to a $12B+ publicly
traded company
Largest nitrogen fertilizer producer in North
America and second largest in the world
Serve agricultural and industrial customers
through:
World-scale production facilities
Best-in-class distribution system
Innovative sales and support
Strong commitment to environmental, health
and safety practices
4
*On October 28, 2013, CF Industries announced a definitive agreement to sell its Phosphate business to the Mosaic Co.
for $1.4 billion, subject to adjustment. The sale is expected to close in 2014.
Segment Mix
83%
Nitrogen
Based on 2012 consolidated sales
17%
Phosphate*

2005 Completed IPO and began trading on New York Stock
Exchange under the symbol “CF”
2007 Expanded international presence with acquisition of 50%
interest in Keytrade AG, a leading global fertilizer trading
organization
2010 Acquired Terra Industries, positioned company as a nitrogen
bellwether and stronger player in the global fertilizer industry
2012 Announced $3.8 billion in expansion projects expected to
increase its North American nitrogen manufacturing capacity by
25% upon completion in 2015-2016
2013 Announced set of strategic agreements with the Mosaic Co.
consisting of the sale of the phosphate business for $1.4 billion
and entry into two long-term ammonia supply agreements
CF Industries
5

Unparalleled breadth
of plant locations and
production flexibility
Immediate proximity
to high-demand
regions
Production flexibility
to address changing
market conditions
− Optimize mix of
UAN and urea
− Increase net
ammonia when/if
conditions
appropriate
Source: AAPFCO, CF
6
Production Flexibility
Nitrogen Demand and Production Capacity*
*Thousand Product Tons
Legend
(Thousand Nutrient Tons)
0 1,100
MEDICINE HAT, AB Net Ammonia: 790
Urea: 810
COURTRIGHT, ON Net Ammonia: 265
UAN: 345
Urea: 160
PORT NEAL, IA Net Ammonia: 30
UAN: 800
Urea: 50
WOODWARD, OK Net Ammonia: 140
UAN: 820
Urea: 25
VERDIGRIS, OK Net Ammonia: 30
UAN: 1,965 YAZOO CITY, MS UAN: 160
Urea: 20
AN: 1,075
DONALDSONVILLE, LA Net Ammonia: 1,010
UAN: 2,415
Urea: 1,680
PLANT CITY, FL DAP/MAP: 2,165

Significant inventory
holding capacity − 29 ammonia
facilities– 1.2 million
ton capacity
− 57 UAN facilities –
1.2 million ton
capacity
Critical to providing in-
market and in-season
product availability
− Product distribution in
close proximity to
customers
− Inventory availability
during peak seasonal
demand
− Investments to
increase loading
capabilities = more
inventory turns
Broad Network of Terminal
Facilities
7
0 1,100 Source: AAPFCO, CF
Nitrogen Demand and Terminal Facilities
Production
Distribution
Legend
(Thousand Nutrient Tons)

Sales Overview
8
2012 Sales Volume by Product (Thousand Product Tons)
Ammonia
0
1,000
2,000
3,000
4,000
5,000
6,000
7,000
UAN 32 Ammonia Urea AN Other N Phosphate

2014 Nitrogen Demand Outlook
9

Nitrogen Fertilizer Demand
10
Urea 65%
DA Ammonia
4%
UAN 7%
AN 8%
Other 15%
Urea 28%
DA Ammonia
26%
UAN 30%
Other 16%
World USA
Source: FERTECON
Calendar Year

53%
32%
1%
2%
12%
Ammonia Urea AN Other UAN
11
38%
62%
Imports Domestic Production
North American Nitrogen Market
Source: FERTECON
Calendar Year
2012 N.A. Demand:
23.2 Million Nutrient Tons
2012 Offshore N.A. Imports:
8.8 Million Nutrient Tons
U.S. domestic use was 19.0 million nutrient
tons with 55%, or 10.5 million tons, supplied by
offshore and Canadian imports

51%
16%
3%
30%
Corn Wheat Cotton Other
U.S. Nitrogen Fertilizer Use
by Crop in 2013
12
Source: TFI, USDOC, CF

• Corn Plantings of 92.0 Million Acres and Wheat
Plantings of 56.5 Million Acres
• Total Crop Plantings Unchanged to Slightly Higher
• N Application Rates Stable to Slightly Higher
• “Normal” Weather
• Modest Increase in Industrial Use
2014 U.S. N Demand Assumptions
13

0
2
4
6
8
10
12
14
16
18
20
2004 2005 2006 2007 2008 2009 2010 2011 2012 2013E 2014F
Fertilizer Industrial
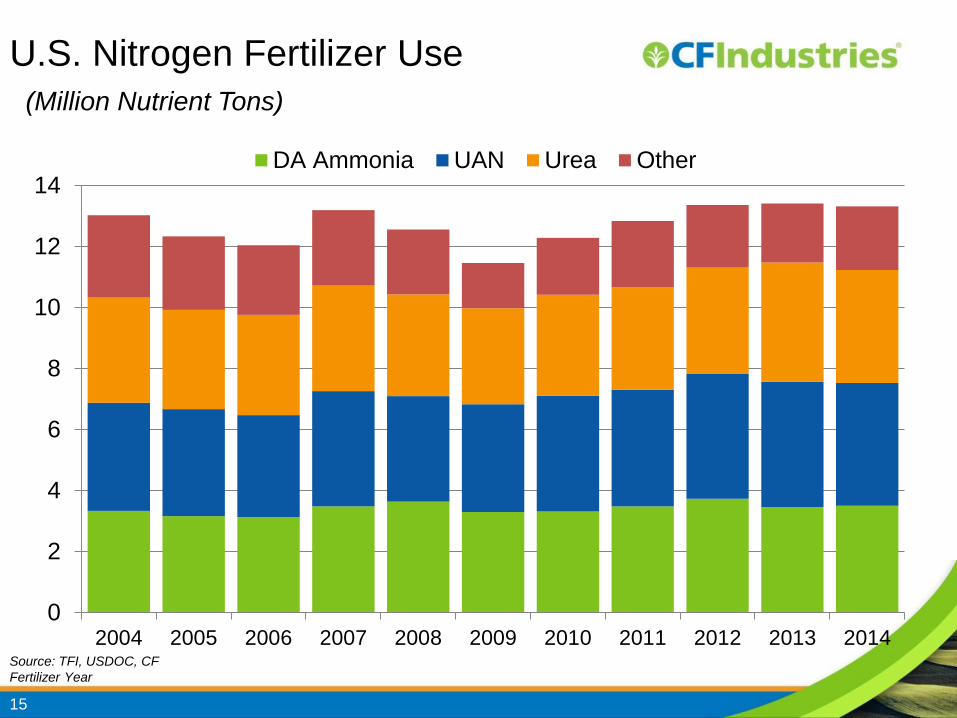
U.S. Nitrogen Use
14
(Million Nutrient Tons)
Source: AAPFCO, DOC, TFI, CF
0
2
4
6
8
10
12
14
2004 2005 2006 2007 2008 2009 2010 2011 2012 2013 2014
DA Ammonia UAN Urea Other
U.S. Nitrogen Fertilizer Use
15
Source: TFI, USDOC, CF
Fertilizer Year
(Million Nutrient Tons)

Fertilizer Demand by Product
(000 Nutrient Tons)
Source: USDA, AAPFCO, TFI, CF
16
2011 2012E 2013E 2014F 2013-14
Change
Nitrogen 12,840 13,360 13,420 13,320 -0.7%
Ammonia 3,484 3,730 3,460 3,500 1.2%
Urea 3,350 3,490 3,910 3,700 -5.4%
UAN 3,824 4,090 4,110 4,025 -2.1%

17
U.S. Dry Urea Shipments
Source: TFI, USDOC, CF
Fertilizer Year
0
1
2
3
4
5
6
7
8
9
2004 2005 2006 2007 2008 2009 2010 2011 2012 2013 2014F
Jul-Dec Jan-Jun
(Million Product Tons)
10-year Average 7.4 MM

U.S. Dry Urea Imports
18
0.0
1.0
2.0
3.0
4.0
5.0
6.0
7.0
8.0
9.0
2004 2005 2006 2007 2008 2009 2010 2011 2012 2013 2014F
10-year Average 6.4 MM
(Million Product Tons)
Source: TFI, USDOC, CF
Fertilizer Year

19
U.S. UAN Shipments
0
2
4
6
8
10
12
14
2004 2005 2006 2007 2008 2009 2010 2011 2012 2013 2014F
Jul-Dec Jan-Jun
Source: TFI, USDOC, CF
Fertilizer Year
(Million Product Tons)
10-year Average 11.8 MM

U.S. UAN Imports
20
0.0
0.5
1.0
1.5
2.0
2.5
3.0
3.5
4.0
4.5
2004 2005 2006 2007 2008 2009 2010 2011 2012 2013 2014F
10-year Average 2.8 MM
(Million Product Tons)
Source: TFI, USDOC, CF
Fertilizer Year

Direct Application
Ammonia Shipments
21
0.0
0.5
1.0
1.5
2.0
2.5
3.0
3.5
4.0
4.5
5.0
2004 2005 2006 2007 2008 2009 2010 2011 2012 2013 2014F
Jul-Dec Jan-Jun
10-Year Avg. 4.2 MM
Source: TFI, USDOC, CF
Fertilizer Year
(Million Product Tons)

U.S. Ammonia Imports
22
0.0
1.0
2.0
3.0
4.0
5.0
6.0
7.0
8.0
9.0
10.0
2004 2005 2006 2007 2008 2009 2010 2011 2012 2013 2014F
10-year Average 7.7 MM
(Million Product Tons)
Source: TFI, USDOC, CF
Fertilizer Year

N Medium Term Supply Outlook
23

DEF Demand in North America
0
200
400
600
800
1000
1200
1400
2012 2013 2014 2015 2016 2017 2018
24
(Equivalent 000 Tons of Urea)
Source: Integer, CF

CF Capacity Expansion Projects
Tons per
Day
Annual
Capacity (thousand tons)
Typical
Product
Mix (thousand tons)
Donaldsonville, LA
- Ammonia 3,640 1,274 184
- Urea 3,850 1,348 686
- Nitric Acid 1,675 586 --
- UAN 5,050 1,768 1,768(1)
Port Neal, IA
- Ammonia 2,425 849 81
- Urea 3,850 1,348 1,348
25
Notes: All production volume shown as short tons.
Production volume based on 350 operating days a year
Expansion Projects Capacities
and Typical Product Mix
(1) At 1.8M tons of UAN, 2.0M tons of granular urea can be
produced. Granular urea production could be increased by
decreasing UAN production.

Company Location Products Start-up Capacity (000 t) Notes
Agrium Borger, TX Ammonia, Urea 2016 380 Ammonia
640 Urea Debottleneck
CF Industries Port Neal IA Ammonia, Urea,
UAN, DEF 2016
849 Ammonia
1.3 mil Urea Brownfield/Debottleneck
CF Industries Donaldsonville, LA Ammonia, Urea,
UAN, DEF 2016
1.3 mil t Ammonia
1.3 mil Urea
1.8 UAN
Brownfield/Debottleneck
Iowa Fertilizer Co. (OCI) Wever, IA Ammonia, Urea,
UAN, DEF 2016
850 Ammonia,
463 Urea
1.7 UAN
$1.3 billion, greenfield
Koch Various Ammonia, Urea,
UAN 2016-2018 2.0 mil t various Debottleneck
LSB El Dorado, AR Ammonia 2017 375 Ammonia Brownfield, $300 million
Dyno Nobel (IPL) Waggaman, LA Ammonia 2016 880 Ammonia Site at Cornerstone Chemical
(formerly Cytec)
Rentech Nitrogen E. Dubuque, IL Ammonia 2014 70 Ammonia Expansion/Debottleneck
U.S. Nitrogen/Austin Powder Greene County, TN Ammonia, AN 2014 68 Ammonia
143 AN liquid
Ammonia upgraded
to AN
Total Estimate 5.1 mt Ammonia
4.3 mt Dry Urea
3.4 mt UAN
North American Nitrogen Projects
(000 Tons per Year)
26 Source: Company announcements and industry publications

27
North American Proposed
Nitrogen Projects
Source: Company announcements and industry publications
Company Location Products Start-up Capacity (000 t/a) Notes
Agrium TBD Ammonia, Urea - 2.0 mil t various Greenfield, Tabled
Agrium Kenai, AK Ammonia, Urea - 1.4 mil Ammonia
1.2 mil Urea
Proposed Restart
Pending Gas Avail.
Agrium Redwater, AB Urea - 187 Urea Debottleneck; decision late
2013/early 2014
CHS Spiritwood, ND Ammonia, Urea, UAN 2018 800 Ammonia Greenfield, decision early 2014
Dakota Gasification Beulah, ND Ammonia, Urea 2017 391 Ammonia, Brownfield at Synfuels Plant
Eurochem Louisiana Not Announced - Not Announced $1.5 billion, greenfield
Invista Chemical
(Koch Subsidiary) Victoria, TX Ammonia 2018 400 Ammonia Proposed Chemicals Upgrading
KIT/IFFCO Canada JV Becancour, QB Ammonia, Urea 2017 820 Ammonia
1.4 mil Urea Greenfield, decision early 2014
Cronus Chemicals IA or IL Not Announced - Not Announced $1.2 billion, greenfield
Midwest Fertilizer (Fatima) Posey County, IN Not Announced - Not Announced $2.1 billion, greenfield
Mosaic Faustina, LA Ammonia - 820 Ammonia Existing site; Tabled
Northern Plains Nitrogen
(North Dakota Corn Growers) Western ND Not Announced - Not Announced $1.0 billion, greenfield
Ohio Valley Resources Rockport, IN Ammonia, Urea, UAN,
DEF 2018
847 Ammonia, 1.1
mil UAN, 100 DEF Greenfield
Southeast Idaho Energy American Falls, ID Ammonia, Urea, UAN 2019 182 Ammonia, 655
Urea, 260 UAN Greenfield
Summit Power Group West Texas Ammonia, Urea 2018 710 Urea Coal gasification, Greenfield
Yara Belle Plaine, SK Ammonia, Urea, UAN,
DEF -
800 Ammonia
1.3 mil Urea (DEF) Existing site, Tabled
Yara/BASF Gulf Coast Ammonia - “World Scale
Ammonia” Proposed

28
0
5
10
15
20
25
30
2005 2007 2009 2011 2013F 2015F 2017F
Demand
Source: IFA, FERTECON, CF
Calendar Year
(Million Nutrient Tons)
North American Nitrogen
Capacity and Demand Outlook

29
0
2
4
6
8
10
2010 2011 2012 2013E 2014F 2015F 2016F 2017F 2018F
Ammonia Urea UAN AN
(Million Nutrient Tons)
North America Offshore Imports
Source: TFI, USDOC, CF
Fertilizer Year

For more information, please visit www.cfindustries.com
30