noise mapping in australia in15-380
TRANSCRIPT
Noise mapping in Australia: completed studies, goals and outcomes
Benjamin Hinze
a)
SLR Consulting Ltd
Level 2, 15 Astor Terrace, Spring Hill, Brisbane, Queensland, 4000, Australia
Noise mapping over geographically large regions such as cities has yet to make a large
impact in Australia, with only a handful of noise mapping studies completed over the past
decade. Unlike the European Union (EU), where noise maps are used extensively and
carried out to achieve numerous outcomes, projects to date in Australia have been
undertaken to achieve more specific goals, with additional positive outcomes emerging
after project completion. This paper provides an overview of the key noise mapping
projects delivered in Australia to date, summarising their primarily goals and outcomes.
1 INTRODUCTION
Put simply, a noise map is the calculation of noise from a nominated source type, typically
presented visually across a large geographical area. A noise map typically represents sections of,
or entire cities, however can also be used to describe long road or rail corridors, either between
cities or throughout a larger region.
Australia has been slower to embrace noise mapping when compared to the EU. Feedback
from state and local governments suggest that this is primarily because – with the exception of
some inner city areas – Australia’s population densities are limited near major transportation and
industrial noise sources. Consequently, policies tend to address noise impacts targeted to
individual roads, rail lines or developments, rather than holistically on a wider scale.
In the EU, the European Union Environmental Noise Directive (2002/49/EC)b) relates to the
assessment and management of environmental noise, predominantly delivered through the
completion of noise maps. This directive features the following underlying principlesc)
:
a)
email: [email protected]
b) The European Parliament and the Council of the European Union. Directive 2002/49/EC of the European
Parliament and of the Council of 25 June 2002 relating to the assessment and management of environmental noise.
OEJC 2002;189:12–25 c)
European Commission Working Group Assessment of Exposure to Noise (WG?AEN). Position Paper: Good
Practice Guide for Strategic Noise Mapping and the Production of Associated Data on Noise Exposure. European
Commission, 2003
• monitoring the environmental problem, which is used to assess the number of people
annoyed and sleep?disturbed respectively throughout Europe
• informing and consulting with the public about noise exposure, its effects and the measures
considered to address noise
• addressing local noise issues by requiring competent authorities to draw up action plans to
reduce noise where necessary and maintain environmental noise quality where it is good
• developing a long?term strategy which includes objectives to reduce the number of people
affected by noise in the longer term, and provides a framework for developing existing
community policy on noise reduction.
The noise mapping works completed within Australia to date have not intended to address
all of the above principles, but rather have been tailored to achieve specific objectives, namely to
provide:
• information to the public about the road traffic noise levels within inner city areas
• an asset and budget planning mechanism to chart what noise mitigation treatments are
required, where and when.
• calculated and predicted noise levels to direct action plans or policy to address
environmental noise impacts on local residents.
However, it was after the studies were completed that the maps and datasets immediately
provided secondary benefits:
• The ability to assess the impact of changing noise criteria was improved. This included the
ability to assess existing noise barrier performance and gauge – as much as practical – the
performance of existing noise infrastructure when set against a revised criteria.
• Another benefit was improved handling of noise complaints. When a member of the public
issues a complaint about road or rail noise, the controlling authority can access the noise
map to achieve a good indication of the actual noise levels at that property. From there, an
educated decision can be made regarding whether to apply resources to further investigate
the complaint.
• They also provide a shortcut for various governments to assess development applications for
new sensitive buildings.
In 2006, it is believed that Australia’s first city noise map was commissioned for the
Adelaide city centre, considering road traffic noise only. Since then, Victoria and Queensland
have been the leading states to develop larger noise maps, namely:
• Melbourne’s VicRoads Highways / Freeways Retrofit Noise Assessment (2010–2011)
• EPA Melbourne Noise Map (2013–2014)
• Queensland Development Code Noise Categories study (QDCNCS; 2010, revised in 2015).
A summary of the noise mapping studies completed to date in Australia is presented in the
following sections.

2 PROGRESSION OF NOISE MAPPING WITHIN AUSTRALIA
2.1 Adelaide City Centre and Greater Adelaide Road Traffic Noise Maps
A road traffic noise model was created by Bassett Acoustics (now AECOM) with
collaborative assistance from the Adelaide City Council, the South Australian Department of
Transport, Energy and Infrastructure, the South Australian Environment Protection Authority
(EPA) and Department of Planning, Transport and Infrastructure (DPTI). The model provided a
road traffic noise map which focused on the inner city area of Adelaide (City of Adelaide) and
fed into a noise technical fact sheet aimed at introducing road traffic noise levels to the general
public. The model and subsequent map covered an area of approximately 15 km2 and featured
terrain and buildings in addition to the local road network. Figure 1 presents the calculated road
traffic noise levels throughout the inner city study area presented by the Adelaide City Council.
Following the inner city model, a wider road traffic noise map was created by AECOM in
2008. This map used road sources only, and covered the wider DPTI road network within the
greater Adelaide region.
Both maps calculated the LA10 (18hr) road traffic noise levels from 6:00 am to 12:00
midnight. At the time of this assessment, the LA10 (18hr) noise level was the descriptor used to
assess road traffic noise within a number of Australian states for residential dwellings. The LA10
noise level is representative of the level of noise exceeded for 10% of any period (usually one
hour). The LA10 (18hr) is an arithmetic average of the LA10 (1hr) noise levels over the 18
consecutive hours between 6:00 am and 12:00 midnight on a weekday.
Adelaide City Council stated that the benefits of the Adelaide City Road Traffic Noise Map
and noise technical fact sheet were:
• improved noise management in South Australia
• assistance with planning for new development
• help for new residents to understand the existing noise environment within the city.d)
The noise map and other technical fact sheets form part of a larger noise management
program. The program incorporates acoustic advisory service site visits from acoustic engineers
to provide solutions for residents concerned about external noise, funding towards the cost of the
solutions, and other noise management services.
To date, Adelaide City Council has not conducted further public studies in relation to
mapping traffic noise.
d)
Adelaide City Council, Noise Technical Fact Sheet, Fact Sheet 9 – Adelaide City Road Traffic Noise Map, viewed
25 May 2015, www.adelaidecitycouncil.com/assets/noise_fact_sheet_9_adelaide_city_road_traffic_noise_map.pdf

Figure 1 – Adelaide City Road Traffic Noise Map Image provided by Adelaide City Council – Noise Technical Fact Sheet #9
2.2 Melbourne – VicRoads Highways / Freeways Retrofit Noise Assessment
In 2010 VicRoads, under the requirements of its traffic noise reduction policy, looked to
investigate the requirement of retrofitting (i.e. increasing the height and / or length) of existing
noise barriers and / or the construction of new noise barriers for the state controlled road network
within Melbourne. Approximately 786 km of Melbourne’s highway and freeway network was
modelled by AECOM, with noise modelling taking into consideration terrain, buildings, noise
barriers, reflective ground surfaces and the road sources themselves. Traffic volumes and
composition were adjusted based on modelled growth rates through the road network to predict
the road traffic noise levels every 5 years for the next 25 years.
The need for a barrier to be retrofitted was based on road traffic noise levels calculated for
the year 2011 at surrounding residences, and predicted noise levels for the following 25 years.
Where a dwelling had a road traffic noise level that exceeded the retrofit trigger noise level of
68 dB(A) LA10 (18hr), VicRoads sought to understand the height and location of retrofits to
existing noise barriers and/or requirement for new noise barriers in an attempt to lower the
modelled road traffic noise levels at all dwellings to meet the retrofit trigger noise level; and
when these works would be required.
The VicRoads noise reduction policy also considers the ‘whole?of?life’ aspect of the
retrofitting of noise barriers. The purpose is to ensure that the ability of a noise barrier to reduce
road traffic noise levels at the surrounding dwellings to meet 68 dB(A) LA10 (18 hr) matches
closely the physical life time of the noise barrier. In other words, noise barriers should approach
the end of their physical life as the retrofit trigger noise level is approached, in line with the
increase in traffic volume over the years. VicRoads has been retrofitting traffic noise barriers to
existing freeways since the mid?1970s. The program of retrofitting noise barriers is based on
retrofit trigger noise levels being exceeded and funds for the retrofitting being made available.
An important aspect of this project was verification of the calculated road traffic noise levels
against actual measured data. Noise measurements provided noise levels to compare against the
calculated noise levels from the road traffic noise model. Over 200 measurements were included,
with a goal for the noise model to calculate the measured noise level to within ± 2 dB without the
need for corrections outside of those for varying road pavement surfaces. This was not achieved
throughout the model, with calculated noise levels on some sections of freeway being
significantly higher than measured due to heavy congestion.
Once completed, a summary detailing where and when noise attenuation measures would be
required was completed for the entire highway / freeway network. The predicted noise levels at
each dwelling and noise contour lines were then brought into Google Earth. This step allowed
users to enter a physical address to determine the calculated / predicted noise level at that
address, in addition to the noise environment throughout the localised area. This tool assisted
VicRoads to respond to noise complaints.
Figure 2 provides a snapshot of a section of a road traffic noise model within Google Earth,
presenting the road source lines, buildings (shaded according to calculated noise level), existing
noise barriers and concrete crash barriers, noise contours and areas of reflective ground.

Figure 2 – Calculated noise levels presented in Google Earth Image © Sinclair Knight Merz & Fugro, 2015, Courtesy of Google ©
Today VicRoads still uses its map when responding to noise complaints from residents. In
most cases, complaints come from locations where noise levels are well below the criteria for
consideration of noise mitigation works. This has eradicated the need for consultants who would
previously have been engaged to physically measure noise levels at these locations. VicRoads
also use the map for scenario testing possible noise policy changes.
2.3 EPA Melbourne Noise Map
The Victorian EPA considers community noise, or environmental noise, as one of the most
common pollutants. It is defined by the World Health Organization (WHO) as noise emitted
from all sources, except noise at the industrial workplace. ‘Community noise includes the
primary sources of road, rail and air traffic, industries, construction and public works and the
neighbourhood’e)
.
Environmental noise is increasingly becoming a community concern both internationally
and in Australia. Despite efforts over the past four decades to reduce noise impacts from
transportation sources such as road and rail traffic and aircraft, many of the benefits of these
efforts have been lost due to increased traffic volumes (by all modes) over longer periods of the
day and evening.
e)
World Health Organisation 1999, Guidelines for Community Noise, viewed 25 May 2015,
http://www.who.int/docstore/peh/noise/guidelines2.html

At the same time, urban population increases have resulted in greater exposure of a larger
percentage of the population to increased noise levels. There is now sufficient evidence
internationally that community noise may pose a general public health risk. To date, the financial
and social cost of due to the health burden from environmental noise is unknown.
The Victorian EPA has a long?term aim of achieving a minimal disturbance from noise. A
key measure of this aim is the health burden from environmental noise. To understand the health
burden associated with environmental noise, first the population exposed to various ranges of
noise levels needs to be established. In 2013, this was achieved through the construction of a city
wide noise model by WSP / Parsons Brinckerhoff for the greater Melbourne region. This was a
collaborative effort between the Victorian Government Departments of the EPA, VicRoads,
Department of Transport, the Department of Sustainability and Environment and the City of
Melbourne local council.
Visualising noise exposure as a noise map and calculating the noise related health burden
was intended to inform the EPA’s input into activities such as land use planning, transportation
planning and design standards that change the community’s exposure to noise. In 2011, the
WHO published a report on the burden of disease from environmental noise based on a health
risk assessment approachf).
The process for quantifying the environmental noise related health burden used by the WHO
was adopted for the Melbourne Noise Map. This included modelling outputs (noise level
descriptors and number of people exposed) suitable for use in the exposure?response
relationships documented by the WHO. The measure for noise exposure was based on LAeq
noise levels that were calculated for the day, evening and night time periods. The LAeq can be
described as an equivalent continuous noise level over a nominated the time period. It is a level
of a notional steady sound that would contain the same amount of sound energy as an actual,
possibly fluctuating, noise source.
One?off maximum noise levels (e.g. truck air brakes or train horns) were not considered. It
was recognised that alterations in sleep structure and awakenings from noise events depend on
‘the number of noise events, the acoustical properties (such as maximum sound pressure levels,
LAmax) of single noise events, the placement of noise events within the night, and noise=free
intervals between noise events’g. However, as described by the WHO, it is currently not clear
how the instantaneous effects such as awakenings could be used to assess the burden of disease.
The Melbourne Noise Map covers an area of approximately 5,600 km2 and features the
noise contribution from road, rail and industrial noise sources. Approximately 8,000 km of
Melbourne’s road network was assessed in conjunction with 1,100 km of rail line, featuring
metro, V/Line (regional express), freight and tram services. Noise from industry was also
considered, with a simplistic representation of approximately 58,500 cadastral land parcels zoned
for industrial use throughout the city. Other noise model inputs included the existing noise
barrier network, bridges (including concrete crash barriers), a digital terrain model built from
LiDAR survey and areas of hard ground.
f) World Health Organisation 2011, Burden of disease from environmental noise: quantification of healthy life years
lost in Europe , WHO Regional Office for Europe, Copenhagen, viewed 25 May 2015,
http://www.euro.who.int/__data/assets/pdf_file/0008/136466/e94888.pdf g)
World Health Organisation, Copenhagen, 2011
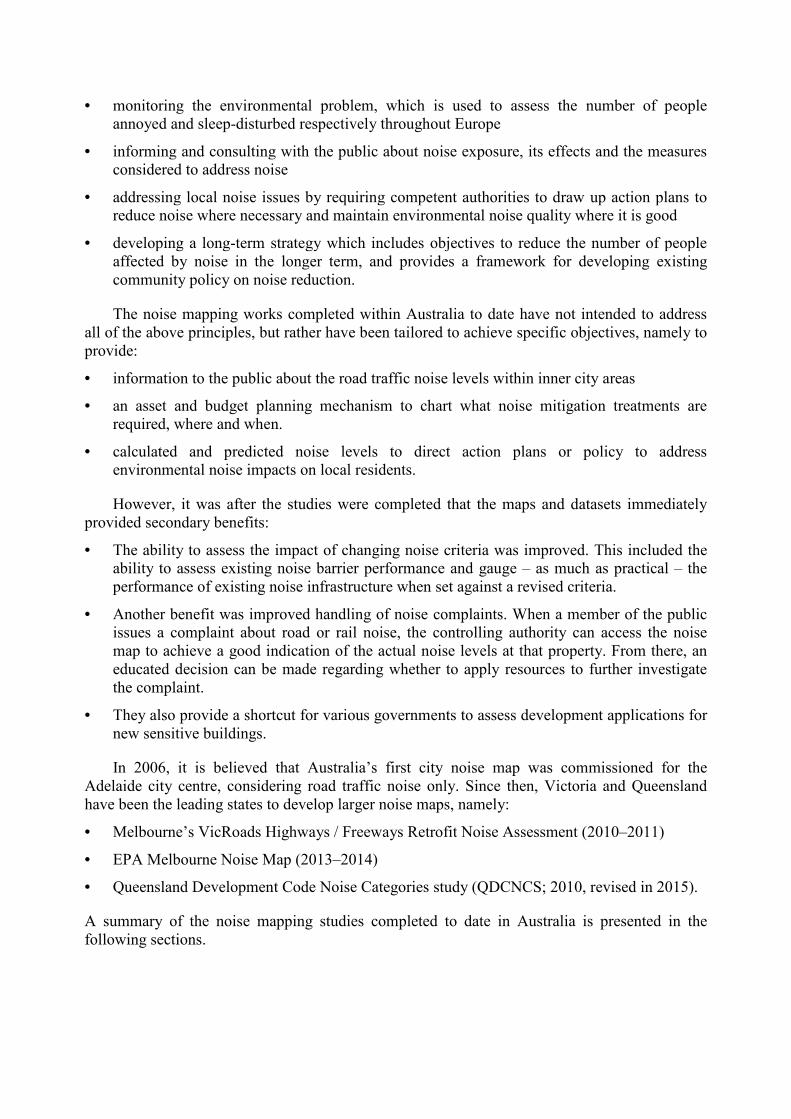
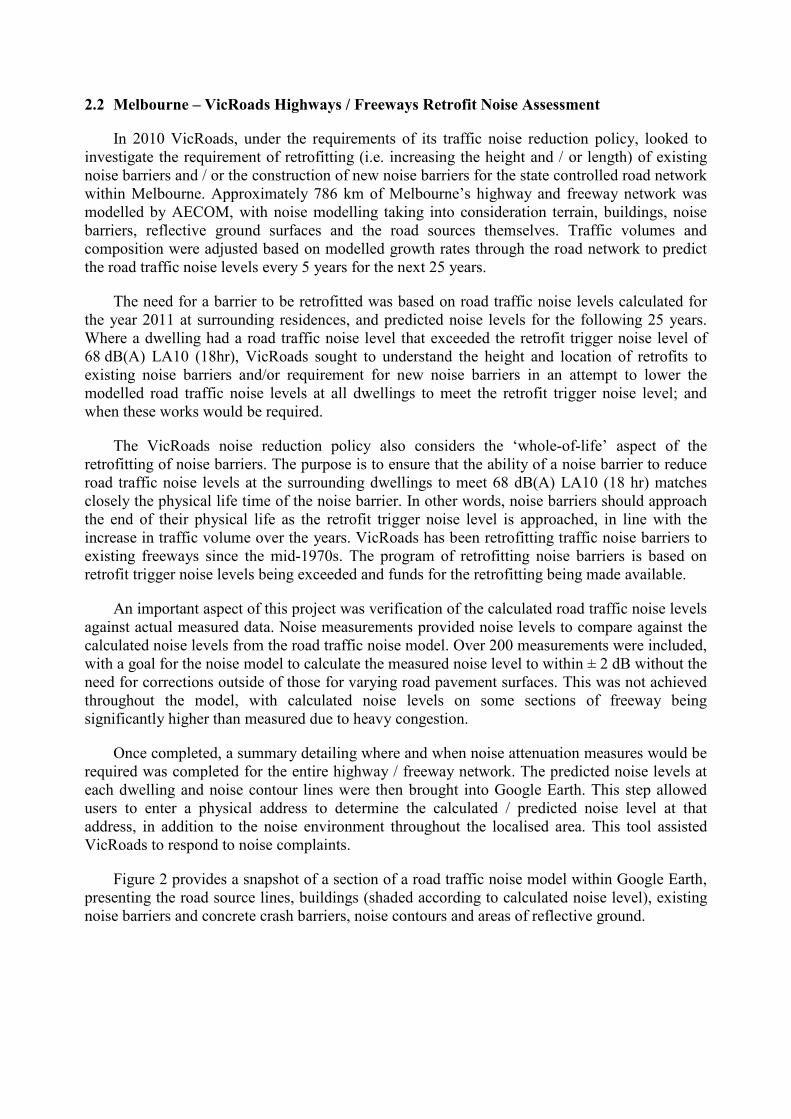
Figure 3 presents a map of the calculated road and rail traffic noise levels within the
Melbourne CBD – a minor section within the study ? while Figure 4 demonstrates a façade noise
map within the CBD, where the noise levels were calculated for every level on every façade.
Figure 3 – Calculated road and rail traffic noise levels within Melbourne CBD Image supplied by WSP / Parsons Brinckerhoff
Fig. 4 – Building façade noise levels within Melbourne CBD Image supplied by WSP / Parsons Brinckerhoff

The noise models were segregated into the 32 local government areas that stretch throughout
greater Melbourne. They featured over 2 million buildings, where the noise level at every level
of every façade of every habitable building in the project area was calculated. Noise
measurements were taken at key locations throughout the project area. These were used to
validate both the source noise levels used within the study, and to verify the road and rail traffic
noise results of the noise model.
The number of inhabitants for each dwelling was calculated based on the 2011 Australian
Census data, with a distribution of population based on the physical volume of each dwelling
within each Census area (i.e. the building area multiplied by the number of storeys). This process
allowed a larger proportion of residents to be allocated to apartment buildings that typically have
a larger footprint and multiple storeys.
In addition to the calculated noise levels, the percentage of the 3.8 million residents exposed
to various noise sources throughout the day, evening and night time periods was reported. This
data fed into a wider study on the health burden of noise on the general population.
2.4 Queensland Development Code Noise Categories Study
In September 2010, the Queensland Department of Housing and Public Works (QDPW)
released the policy Queensland Development Code Mandatory Part 4.4 – Buildings in Transport
Noise Corridors (QDC MP4.4)h. The purpose of the policy was to ensure that new residential
buildings located near roads and railways are constructed in a way that attenuates any adverse
noise impacts for building users / occupiers and focuses on land designated as a ‘Transport Noise
Corridor’ under the Queensland Building Acti for QDC MP4.4.
Previously, building applications for the construction of residential buildings on properties
near state?controlled roads generally required an on?site noise assessment and a supplementary
state government approval. This approval was often conditional on certain noise reduction
measures, such as specific building materials being included in the building’s design and
construction. The QDC 4.4 provides a more consistent standard across the state and reduces the
time and costs involved in gaining final building approvals. It also continues to minimise the
effects of transport noise on the building occupant’s health and acoustic amenity from major
transport corridors.
Transport noise corridors were declared for all state?controlled roads in Queensland in
September 2010. Under the Building Act, land can be designated as a transport noise corridor if
it is within 100 metres of a state?controlled road or railway (or up to 250 metres where the level
of noise emissions exceeds certain thresholds stipulated in the Building Act)j.
h)
Queensland Department of Housing and Public Works, Queensland Development Code, Mandatory Part 4.4 –
Buildings in Transport Noise Corridors, viewed 25 May 2015,
http://www.hpw.qld.gov.au/SiteCollectionDocuments/mp?4?4?buildings?in?transport?noise?corridors.pdf i) Office of the Queensland Parliamentary Counsel 1975, Building Act, Section 246(X), viewed 25 May 2015,
https://www.legislation.qld.gov.au/LEGISLTN/CURRENT/B/BuildA75.pdf j) Office of the Queensland Parliamentary Counsel 1975, Building Act, Section 246(Z), (1975)

Noise categories were calculated based on the traffic volume, composition, speed and road
surface pavement for each state?controlled road throughout the neighbouring transport noise
corridor. The calculations were produced using a ‘flat?earth’ model and did not take into account
topography, existing buildings, or existing noise barriers – attributes which can significantly
affect the extent of land adjacent to a state?controlled road that is impacted by noise.
To complement the transport noise corridors for state?controlled roads, transport noise
categories were calculated for major local roads within the Logan and Brisbane city local
government areas by their respective councils, with Logan including ground terrain.
The purpose of the QDC MP4.4 policy is to provide guidance on requirements for the
construction of new dwellings or upgrades to existing sensitive properties that are located within
a transport noise corridor. The general public can log on to the online portal, look up their
property and easily determine the noise category the building envelope would reside in. This is
done through the QDPW Noise Affected Properties mapping (NAPmap) portalk. Based on the
appropriate noise category, construction materials and techniques to limit noise ingress into the
property are recommended within QDC MP4.4.
Figure 5 presents an example of noise categories for some of Queensland’s state?controlled
roads and Logan City’s designated local road networks.
Figure 5 – Noise categories for Queensland State and Logan City designated local roads Image from QLD Department of State Development and Infrastructure and Planning
k)
Queensland Department of Housing and Public Works, Transport Noise Corridors
The NAPmap portal is somewhat limited by its simplicity. For example, factors which may
directly affect noise levels such as other buildings, noise barriers and topography are not
considered within the portal. This simplicity of modelling in generating noise categories has
generated some angst among builders and home owners who have found their property to fall
within a higher noise category despite, for example, being screened by other dwellings or a noise
barrier. In order to have the noise category reduced, an acoustic consultant is required to
complete a study, adding a cost that builders and owners have felt unwarranted.
Property owners and building designers have the choice to either adopt the code's acceptable
solution for the relevant noise category from the NAPmap search result (which will be deemed to
satisfy the performance requirement), or to have an on?site noise assessment completed to
identify alternative options for meeting the noise reduction targets. An on?site noise assessment
can also be used to identify situations where a lower noise category might apply to the property
and features. For example, other buildings, noise barriers or topography not considered within
the Napmap portal.
Currently the Queensland Department of Transport and Main Roads (DTMR) are in the
process of revising the noise categories for the state controlled road network through more
detailed modelling completed by SLR Consulting. This modelling included ground terrain, noise
barriers and buildings extending 500 m each side of the road centreline for 33,353 km of state
controlled roads.
3 PRECEIVED FUTURE OF NOISE MAPPING IN AUSTRALIA
Unlike the Environmental Noise Directive (2002/49/EC) within the EU, there is no
overarching policy within Australia that requires noise mapping or city noise modelling, with the
exception of the QDC MP4.4.
In 2014, a draft issue of the National Construction Code (NCC)l featured the inclusion of
measures to address noise intrusion into habitable rooms. The NCC is developed to incorporate
all on?site building requirements into a single code and sets the minimum requirements for the
design, construction and performance of buildings throughout Australia. Consideration of noise
intrusion was abandoned prior to release of the NCC 2015. However should it return, an
understanding of the local noise environment would prove invaluable for regulatory authorities
for building approvals.
Slowly but surely, consideration of noise intrusion has already begun for council planning
schemes, in particular within Queensland. Currently, the Redland City Council in Queensland’s
south east is looking to build a detailed city noise model for road and rail noise to feed into the
Redland City Council planning scheme. If constructed, the noise model would provide indicative
road and rail noise levels to assist with mitigating noise into private outdoor and internal living
areas of new – or upgrades to existing ? dwellings and sensitive buildings.
Similar (albeit simplified) examples of this approach have already been undertaken by
Brisbane City and Logan City councils for road traffic noise, complimenting the QDC MP4.4
policy for state controlled roads.
l) Australian Building Codes Board 2015, National Construction Code, view 25 May 2015,
http://www.abcb.gov.au/ncc?products
Generally, interest has been raised throughout Australia by various state and local levels of
government on the potential of noise mapping, however at the time of writing no other active
progression had been made.
Based on the noise mapping work completed within Australia to date, the points below
summarise the direct and actively used benefits of noise mapping:
• It is an education tool to help the community understand more about noise levels, and help
people understand the noise environment when moving to a new area.
• Noise mapping provides a method for quantifying the population exposed to environmental
noise levels for further health studies.
• It shortcuts the screening process for development or building applications.
• Noise mapping offers an asset management and budget planning tool, to firstly understand
what noise mitigation infrastructure exists, but secondly to gain an understanding on where
and when the existing infrastructure will need to be supplemented with either new noise
barriers, or retrofit to existing.
• It helps prioritisation of infrastructure projects to target areas that are currently exposed to
higher noise levels, while aiming to preserve quieter areas.
• Noise mapping acts as a first pass to gauge response for community noise complaints.
4 DISCUSSION
As previously mentioned, Australia has taken a relatively slow move into large scale noise
mapping, with current polices targeting specific sections of road or rail line as they are either
newly built or upgraded.
It is the author’s opinion that noise mapping is not solely an acoustic based exercise. Rather
it’s a geographical information systems (GIS) exercise with an acoustic lead. While the majority
of data collation, manipulation and processing is completed in a GIS domain, it’s important to
have the acoustic knowledge to understand the implications of the processes completed and how
data in the GIS environment can be manipulated to best serve an acoustic model.
As the majority of the work to create a noise map is GIS based this background work is
often completed internally by councils and state governments. When these levels of government
are considering undertaking a noise mapping exercise, it may be prudent to consider noise maps
as a by?product of datasets acquired for alternate studies. For example, a detailed digital terrain
model often forms the backbone of most internal geographical datasets and typically would
already exist. However the survey of building footprints and impervious ground surfaces is
predominantly aimed to assess flooding. Traffic volumes are collated through traffic modelling
and the documentation / survey of existing noise barriers is often an asset management exercise.
When all of these datasets are combined, a digital, 3D model of the city or local government
area can be built, allowing noise levels (and air quality levels if atmospheric data is available) to
then be easily calculated.

As illustrated in the case studies presented within this paper, alternative benefits are often
realised with a 3D model of a city after the model is completed. The author’s observations from
state and local government city noise maps, is that often greater benefits are realised once the
studies are completed and the model is accessible.
In other words, ‘if you build it, he will come’m
5 ACKNOWLEDGEMENTS
I would like to thank James McIntosh (VicRoads), Dung Nguyen (Victorian EPA), Rebecca
Draysey and Megan Cox (Adelaide City Council) and Sheng Zhang (Queensland Department of
Transport and Main Roads) for their assistance.
I also wish to thank Melanie Hinze (Sirona Communications) for editorial revisions in
helping to transform my ramblings into something more legible.
6 REFERENCES
1. The European Parliament and the Council of the European Union. Directive 2002/49/EC of
the European Parliament and of the Council of 25 June 2002 relating to the assessment and
management of environmental noise. OEJC 2002;189:12–25.
2. European Commission Working Group Assessment of Exposure to Noise (WG?AEN).
Position Paper: Good Practice Guide for Strategic Noise Mapping and the Production of
Associated Data on Noise Exposure. European Commission, 2003.
3. Adelaide City Council. Noise Technical Fact Sheet 9: Adelaide City Road Traffic Noise
Map, Adelaide, viewed 25 May 2015,
www.adelaidecitycouncil.com/assets/noise_fact_sheet_9_adelaide_city_road_traffic_noise_
map.pdf
4. World Health Organisation 1999, Guidelines for Community Noise, viewed 25 May 2015,
http://www.who.int/docstore/peh/noise/guidelines2.html
5. World Health Organisation 2011, Burden of disease from environmental noise: quantification
of healthy life years lost in Europe , WHO Regional Office for Europe,
Copenhagen, viewed 25 May 2015,
http://www.euro.who.int/__data/assets/pdf_file/0008/136466/e94888.pdf
6. Queensland Department of Housing and Public Works 2011, Queensland Development
Code, Mandatory Part 4.4 – Buildings in Transport Noise Corridors, viewed 25 May 2015,
http://www.hpw.qld.gov.au/SiteCollectionDocuments/mp?4?4?buildings?in?transport?noise?
corridors.pdf
7. Office of the Queensland Parliamentary Counsel 1975, Building Act, Section 246(X) and
Section 246(Z), viewed 25 May 2015,
https://www.legislation.qld.gov.au/LEGISLTN/CURRENT/B/BuildA75.pdf
8. Australian Building Codes Board 2015, National Construction Code, viewed 25 May 2015
http://www.abcb.gov.au/ncc?products
9. Field of Dreams, 1989, motion picture, Universal Pictures, USA
m)
Field of Dreams, 1989, motion picture, Universal Pictures, USA