nordic concrete research · nordic concrete research is since 1982 the leading scientific journal...
TRANSCRIPT

Nordic Concrete
Research
THE NORDIC CONCRETE FEDERATION 2/2015 PUBLICATION N0. 53

PUBLICATION NO. 53 2/2015
NORDIC CONCRETE RESEARCH EDITED BY THE NORDIC CONCRETE FEDERATION CONCRETE ASSOCIATIONS OF: DENMARK FINLAND ICELAND NORWAY SWEDEN PUBLISHER: NORSK BETONGFORENING POSTBOKS 2312, SOLLI N - 0201 OSLO NORWAY
VODSKOV, DECEMBER 2015


Preface Nordic Concrete Research is since 1982 the leading scientific journal concerning concrete research in the five Nordic countries, e.g., Denmark, Finland, Iceland, Norway and Sweden. The content of Nordic Concrete Research reflects the major trends in the concrete research. Nordic Concrete Research is published by the Nordic Concrete Federation which also organizes the Nordic Concrete Research Symposia that have constituted a continuous series since 1953 in Stockholm. The next Nordic Concrete Research Symposium, no. XXIII, will be held Aalborg, Denmark 21. - 23. of August 2017. We do look forward to welcome you there. Since 1982, 428 papers have been published in the journal. Since 1994 the abstracts and from 1998 both the abstracts and the full papers can be found on the Nordic Concrete Federation’s homepage: www.nordicconcrete.net. The journal thus contributes to dissemination of Nordic concrete research, both within the Nordic countries and internationally. The abstracts and papers can be downloaded for free. Proceedings from miniseminars and the proceedings from the Research Symposia are about to be published on the homepage as well. The high quality of the papers in NCR are ensured by the group of reviewers presented on the last page. All papers are reviewed by three of these, chosen according to their expert knowledge. Currently we are investigating the possibility to have NCR published by a larger international publisher, in order increase the number of readers, and to have NCR accepted by international scientific databases. More information about this will be published on our homepage. Since 1975, 77 Nordic Miniseminars have been held – it is the experience of the Research Council of the Nordic Concrete Federation, that these Miniseminars have a marked influence on concrete research in the Nordic countries. In some cases, the information gathered during such Miniseminars has been used as Nordic input to CEN activities. The latest Miniseminar " Residual capacity of deteriorated concrete structures" was held in Oslo, 21st of April. Extended abstracts from this miniseminar is published in this volume of NCR. Vodskov, December 2015 Dirch H. Bager Editor, Nordic Concrete Research Chairman, Research Council of the Nordic Concrete Federation


PUBLICATION NO. 53 2/2015
CONTENTS 1 YanjuanChen, JianmingGao & Tang Luping 1 Effect of a new polymer grinding aid on the durability of cement mortar
2 Dimitrios Boubitsas, Tang Luping & Peter Utgenannt 19 Estimation of Chloride Threshold Values in Concrete exposed to Swedish
Marine Environment over 20 years
RESIDUAL CAPACITY OF DETERIORATED CONCRETE STRUCTURES Proceedings from a Nordic Miniseminar
33
Karin Lundgren, Mario Plos, Mohammad Tahershamsi & Kamyab Zandi 35 3D Modelling of the bond behaviour of naturally corroded reinforced
concrete
Mahdi Kioumarsi, Max A. N. Hendriks & Mette Geiker 39 Failure probability of a corroded beam with interference effect of localised
corrosion
Karin Lundgren, Mario Plos, Kamyab Zandi & Mohammad Tahershamsi 43 Anchorage of corroded reinforcement – from advanced models to practical
applications
Ane de Boer 49 Re-examinations of existing RC highway bridges and viaducts in the
Netherlands
Jiangpeng Shu, Mario Plos, Kamyab Zandi & Karin Lundgren 53 A Multi-level Structural Assessment Proposal for Reinforced Concrete
Bridge Deck
Niklas Bagge, Jiangpeng Shu, Mario Plos & Lennart Elfgren 57 Punching Capacity of a Reinforced Concrete Bridge Deck Slab Loaded to
Failure
Ricardo Antonio Barbosa & Søren Gustenhoff Hansen 61 Severe ASR damaged concrete bridges - Full scale shear tests and
material properties
Rita Esposito & Max A.N. Hendriks 65 Measuring and modelling the deteriorating impact of Alkali-Silica Reac-
tion in concrete on the mechanical characteristics
Manouchehr Hassanzadeh 69 Residual bearing capacity of the frost-damaged reinforced concrete beams
Research Council and Editorial Board of NCR 73 Review Group for NCR 75 Miniseminars 1975 - 2015 77


1
Effect of a new polymer grinding aid on the durability of cement mortar
YanjuanChen M.Sc, Ph.D. School of materials science and engeering, southeast University Nanjing, CN211189, China E-mail: [email protected] Corresponding author JianmingGao Ph.D., Professor Room 210, School of materials science and engeering, southeast University Nanjing, CN211189, China E-Mail: [email protected] Luping Tang Ph.D., Professor Division of Building Technology Chalmers University and Technology SE41296 Gothenburg Sven Hultins gata8 E-Mail: [email protected] ABSTRACT Effect of a new polymer-based grinding aid on the durability of cement mortar is analyzed in this paper. Compared with cement mortar without grinding aid, carbonation resistance , freeze-thaw resistance increase whereas dry shrinkage resistance decrease with the addition of grinding aid, according to the variation of relative dynamic elastic modulus and loss ratio in weight. Key words: cement mortar, grinding aid, carbonation depth, relative dynamic elastic, mass loss ratio.
1. INTRODUCTION With grinding aid mixed in the production of cement, the grinding system will be greatly changed. The addition of grinding aids can result in improvement of particle surface and grindability index, due to the fact that the grinding aids not only reduce resistance to comminution, but also prevent the powder from agglomeration and coating on the balls and mill

2
[1-3]. Synthetic polymer grinding aid combining various kinds of functional groups with the polymer chain structure has even better improvement on grinding effect and lower mixing dosage in cement compared with mixed type of grinding aids [4-7]. It is, however, still not sure if the addition of grinding aid can affect the durability of concrete. Moreover, there may exists an optimal range of mixing dosage of synthetic polymer grinding aid, which will not only improve the grinding effectiveness but also assure durability of concrete [8]. Further, it is well known that synthetic high polymer grinding aid has advantages of low production costs, good performance and high comprehensive benefit, and has a broad application prospect. Actually, there are more and more research efforts on synthetic polymer grinding aid, and the technology is relatively mature, whilst its effect on durability of concrete is still in infancy at present [9]. In this article, the effect of grinding aid on the durability of cement mortar will be presented through different durability tests (including the drying shrinkage, carbonization, freeze-thaw cycle, sulphate erosion, and so on).
2. MATERIALS AND METHODS 2.1 Materials
Raw materials Two types of raw materials used for cement mortar were: Portland cement clinker from a plant of Anhui Conch Cement Company Limited, and dihydrate gypsum from a factory in Shandong province, China. The chemical and mineral compositions of them are shown in Table 1.
Table 1 - Chemical and mineralogical composition of raw materials Chemical composition (wt.%)
clinker gypsum SiO2 22.7 6.60 Al2O3 8.82 2.51 Fe2O3 2.597 - CaO 56.77 33.84 SO3 2.15 37.12 H2O+ - 17.48 L.O.I 6.963 2.45 Mineralogical composition (wt.%)
clinker gypsum C3S C2S C3A C4AF
56.24 11.71 18.97 7.90
- - - -

3
Polymer-based grinding aid A new polymer-based grinding aid (“GA” for short) which was developed by the research group in China was used in the test. Table 2 shows a summary of the physical characteristics of GA. Figure 1 presents the FT-IR spectra of GA. IR spectroscopy is generally used in order to give information about the composition of a sample and its structure. The bands occurring in the FTIR spectra of the examined GA can be characterized as follows: The distinct broad band at 3600-3200 cm-1 attributes O-H. The O-H stretching vibration is normally observed at about 3500 cm-1, meanwhile the band at 2900 cm-1 is due to the presence of C-H stretching vibration in aliphatic structures. The band observed at 1620 and 1760 cm-1 were assigned to -COO- and -C=O stretching vibrations in aromatic groups, respectively. The band at 1400 cm-1 is due to the presence of -CH2 angle variable vibration, whereas the wide band around 1100 cm-1 is attributed to the -SO3 antisymmetric stretching vibration, straight chain C-C and C-O-C stretching vibration. It suggests the presence of sulfo, hydroxyl and carboxyl groups in the molecular of GA. Moreover, hydroxyl groups are hydrophilic and carboxyl groups provide electrostatic repulsion aiming to play retarding effect. In addition, sulfo groups can improve the dispersion properties of GA effectively.
Table 2- Physical characteristics of GA Solid contend (%)
Viscosity (mPa.s) PH value molecular weight
Mn Na contend (ppm)
30 110 2.5 6159 3750
4000 3500 3000 2500 2000 1500 1000 50080
90
100
Tran
sim
ttanc
e(%
)
Wavenumbers(cm-1)
3500
2900
176016201400
1100
Figure 1 – FT-IR spectra of the examined GA

4
Dosage of GA In order to obtain outstanding grinding performance, a certain amount of grinding aid and cement clinker were blended in a ball mill (Type SM-500 for cement test, manufactured by WUXI JIANYI experiment instrument CO.LTD, size Φ500×500 mm), and the grinding time was kept 30 min at the drum speed 45 r/min. The adjustment of both dosage of GA and clinker was carried out on an empirical basis. The values of specific surface area, particle size distribution and oversize (residue) of 45 μm sieve for grinded cement with different dosages of GA are shown in Table 3. It is clear from Table 3 that the specific surface area increased and the oversize (residue) of 45 μm sieve decreased as the dosage of GA increased (for dosage <0.03%). At GA dosages above 0.03%, the specific surface area and 45 μm sieve residue only slightly changed, implying that the value of 0.03% is the point of saturation dosage. At dosages exceeding the saturation dosage, grinding effect no longer enhanced [10]. Many attempts have been made to correlate the particle size distribution with its properties of cement. It has been reported that the strength is greatly influenced by particle size in the range of 3-30 µm, whereas particles larger than 60 µm have only a “filling effect” and make practically no contribution to strength develop [11,12]. Investigations on Portland cements have shown that, for equal specific surface area, cements with a narrow particle distribution have a distinctly higher standard strength than those with a wide distribution, and they claimed that the range of 15-32 µm is the determinant particle size range for strength development [13]. Tsivilis et al. [14] reported that the best size distribution of a cement should be continuous and steep with >65% in the range close to -32+3 µm fraction, ≈10%<3 µm., and they claimed that the fraction 16-24 µm was the fraction which contribution most to strength development. An increase of very fine particles (<3 µm) may result in higher early strengths, but also may cause problems during setting, i.e. undesirable volume changes and deterioration in rheological properties [12]. Combining Table 3 and Figure 2, it is evident that the cement with dosage of 0.03% and 0.05% has the larger fractions in all the three range (3-30 µm, 15-32 µm and 16-24 µm, respectively), and the steep in the -32+3 µm fraction is the most close to 65% compared with the other samples. Considering the economic factors, so we can conclude that the particle size distribution is optimal for cement with the dosage of 0.03% based on the literature references above.
Table 3 - Specific surface area, 45 μm sieve residue, particle size distribution of cement with different GA dosages
Dosage(%)
Specific surface area(m2/kg)
45μm sieve residue
Particle size distribution(%)
<3μm 3~30μm 30~60μm >60μm
0 355.8 25.43 12.14 50.62 22.82 14.42 0.01 375.8 16.23 18.98 57.22 15.24 8.56 0.02 387.7 12.87 19.83 59.98 13.41 6.78 0.03 395.6 9.76 20.43 64.76 10.93 3.88 0.04 400.5 9.27 20.87 64.11 11.06 3.96 0.05 401.1 8.80 21.38 63.33 11.73 3.86 0.06 401.6 8.77 21.79 62.35 12.14 4.22 0.07 402.4 8.69 21.43 62.33 12.18 4.01 0.10 403.0 8.16 17.64 62.04 14.60 4.72 0.15 402.9 7.78 17.07 61.96 15.48 4.49 0.20 404.1 7.92 17.42 61.82 15.43 4.83

5
0 20 40 60 80 100 120
0,000
0,005
0,010
0,015
0,020
0,025
0,030
Nor
mal
ized
par
ticle
siz
e di
strib
utio
n(%
)
Particle size (m)
GA 0% GA 0.01% 0.03% 0.05% 0.10% 0.20% PI 52.5 cement
Figure 2 – Influences of dosage on particle size distribution
In Figure 2 it can be seen that the particle size distribution of a commercial type of Portland cement (PI 52.5) is close to those with 0% and 0.01% GA, although the actual type of grinding add in this commercial cement is unknown. Therefore, in the experiments the cement with 0% GA but with the same chemical compositions was used as reference for comparison. Figure 3 shows a comparison among cement with different dosages of GA. Figure 3 (a) shows that the Ref cement (without GA) presented a heterogeneous mixture of angular particles and the surface has obvious concavo convex. Compared with Figure 3 (a), Figure 3 (b), (c), (d) presented a heterogeneous mixture of spherical particles and the surface slippery. In particular, cement with GA dosage of 0.03% has relative uniform distribution as shown in Figure 3 (b).

6
Figure 3 – SEM images of cement powder with different GA dosages. (a) 0%, (b) 0.03%, (c) 0.05%, and (d) 0.20%
0.00 0.05 0.10 0.15 0.20
0.95
1.00
1.05
1.10
1.15
1.20
1.25
1.30
1.35
Rel-3d Rel-7d Rel-28d
Rel
ativ
e fle
xura
l stre
ngh
(MPa
)
Dosage of grinding aid (wt%)
0.00 0.05 0.10 0.15 0.200.94
0.96
0.98
1.00
1.02
1.04
1.06
1.08
1.10
1.12
Rel
ativ
e co
mpr
essi
ve s
treng
th (M
Pa)
Dosage of grinding aid (wt%)
Rel-3d Rel-7d Rel-28d
Figure 4 – Flexural strength change as a function of the dosage of grinding aid
Figure 5 – Compressive strength change as a function of dosage of grinding aid
As Figures 4 and 5 shown, it is clearly that the flexural strength and compressive strength are optimal for cement at the dosage of 0.03%. At dosages exceeding 0.03%, flexural strength and compressive strength began to decrease. This signifies that, the optimal particle size distribution contribute a lot to the improvement of cement mortar strength.
(a))
B-cement GA-

7
Figure 6– SEM images of cement mortars after 28 days.
As shown in Figure 6, the morphology of sample B-cement appears loosely and more porosity, and less small rounded masses of likely ettringite are visible. At the same hydration time, the morphology of GA-cement is completely different: more small rounded and prismatic needles masses is visible, moreover, many needle-like crystals of likely ettringite with different dimensions are present everywhere. This may account for GA-cement has a higher strength than B-cement as shown in Figure 4 and Figure 5.
2.2 Methods In this study the main purpose is to evaluate the effects of grinding aid on durability of cement mortar by means of a series of tests including the shrinkage test, accelerated carbonation test, sulphate stability test and freeze-thaw test. Mortars were prepared according to the following mixture proportions: 95 wt% of cement clinker, 5 wt% of gypsum and 0.03 wt% of grinding aid, while w/c ratio was maintained constant at 0.5. The Ref mortars (marked as B-cement) contains the cement with the same portions of clinker and gypsum but no grinding aid (0% GA). The size of mortar specimens was 40×40×160 mm3, which were demoulded one day after casting and then cured in the standard curing room at temperature (20±2) ℃ and relative humidity ≥95% until the specified age for various tests.
Overview of shrinkage test The drying shrinkage strain of mortar was measured according to Chinese standard JC/T603-2004 “Standard test method for drying shrinkage of mortar”. In this test, mortar specimens were prepared for measuring the drying shrinkage strain at the age of 90 days. The mortar specimens with the embedded metal (stainless steel) studs on the centre of two longitudinal ends were cured in the standard curing room as described above. At the age of 7 days (according to the time of adding water into the mortar), specimens were moved into the chamber with constant temperature of (20±2) ℃ and relative humidity of (60±5) %. After storage for 4 h, the initial length was measured by vertical mortar contract meter with a standard rod length of (176±1) mm and measurement precision of 0.01 mm. Thereafter, the length of specimens (3 replicates per mix) was measured according to the following specified time interval: 7, 14, 21, 28, 56, and 90 d.
Overview of the freeze-thaw test Slow freezing method was used to measure the frost resistance of mortar according to the Chinese standard JGJ/T70-2009 “Standard for test method of performance on building mortar”,

8
in which the mass loss rate and relative dynamic elastic modulus are used for evaluation of the frost resistance of mortar. Ultrasonic-detection technology was used to detect relative dynamic elastic modulus to characterize defect developments and structural changes of mortar in the tests of frost resistance and sulphate attacks in this study. The NM-4A type non-metallic ultrasonic detector was used to measure the time of ultrasonic wave passed through the specimen. Since we only focus on the damage deterioration tendency of different cement mortar specimens, rather than the specific values of dynamic elastic modulus, the relative dynamic elastic modulus was calculated using the following equation:
2 20 100n nE V V (1)
En - Relative dynamic elastic modulus after n freeze-thaw cycles, calculated from the average of three specimens. V0 - The velocity of ultrasonic wave before freeze-thaw cycle (km/s); Vn - The velocity of ultrasonic wave after n freeze-thaw cycles (km/s). The mortar specimens were cured in the standard curing room until the age of 26 days, and immersed in water for another 2 days. The surface water on the mortar specimens was wiped away with moist cloth and the initial velocity of ultrasonic wave and the mass of each specimen. After that, mortar specimens were frozen for 4 h in a freezer box (temperature waved from -15 to -20 ℃), and then immersed in the water with the temperature maintained between 15 and 20 ℃) for 8 h for thawing, as a freeze-thaw cycle. This freeze-thaw cycle was repeated for more than 60 cycles. Visual inspection and measurements of the velocity of ultrasonic wave and the mass of each specimen (8 replicates per mix) were carried out after every 10 cycles.
Overview of carbonization test Carbonization test was carried according to the Chinese standard GB/T 50082-2009“Test methods of long-term performance and durability of ordinary concrete”. The oven-drying specimens in mature age (28 days) were put into a carbonization box, which was “CCB-70A concrete carbonation test box”. In the box, the concentration of CO2 was (20±3) %, and relative humidity was (70±5) % and temperature was (20±2) ℃ according to the manufacturer’s technical specification. Specimens were split after carbonization for 3, 7, 14 and 28 days, respectively. After removal of loose particles on the split surfaces of the specimen the surfaces were sprayed with phenolphthalein alcohol solution with the concentration of 1% phenolphthalein in the solution of distilled water:alcohol 20%:80% by weight. After 30 seconds, the average carbonation depth was measured through more than five points per specimen (3 replicates per mix). It should be noted that the concentration of CO2 in this Chinese standard is much higher than the natural carbonation concentration and also significantly higher than the Nordic accelerated carbonation test NT BUILD 357 (3% CO2 ). Therefore, the test results can be used only for comparison between similar types of cement, as used in this study.
Resistance to sulphate attack test Resistance to sulphate attack test was evaluated according to the Chinese standard GB/T 50082-2009. The mortar specimens were cured in the standard curing room until the age of 26 days and

9
then dried in the oven at 80±5 ℃ for 48 hours. Similar to the freeze/thaw test, the initial velocity of ultrasonic wave and the mass of each specimen were measured after cooling in the air at the room temperature for 2 hours. Mortar specimens were then immersed in the 5% sodium sulphate solution for 15 hours, dried in the air at the room temperature for 1 hour, further dried in the oven at the temperature of 80±5 ℃ for 6 hours, and then cooled in the air at the room temperature for 2 hours, which represents a wet-dry cycle for one day. Visual inspection and measurements of the velocity of ultrasonic wave and the mass of each specimen (8 replicates per mix) were carried out after every 5 cycles. Specimens were split to get samples for the analysis by scanning electronic microscopy (SEM) after they were sulphate erosion for 30 cycles. 3. RESULTS AND DISCUSSION
The results from various tests will be repented and discussed in the following sections. Because in most of the tests 3-8 replicates were used, the mean values were used for drawings and the respective value of standard deviation was shown as a deviation bar of each mean value.
3.1 Drying shrinkage The results of tests for drying shrinkage, hydration heat and pore structures are shown in Figures 7 to 9.
As shown in Figure 7, before 30 days, the dry shrinkage of both mortars increased rapidly, but afterwards the increase became slow. Compared with Ref mortar (B-cement), the dry shrinkage mortar with GA is in general larger after the age of 7 days. This signifies that the dry shrinkage of cement increased in the presence of GA. At early age, the dry shrinkage of mortar with GA was similar to Ref mortar, but the gap between them increased gradually with the time prolonged. This is because that at different ages the key factor influencing dry shrinkage may not be the same, that is, the hydration reaction is dominant at the early age, while the pore structure at the late age [15-18]. At the early age both kinds of mortar specimens have similar hydration degree which can be seen from their hydration heat rate as shown in Figure 8. Thus, similar hydration reaction led to the similar increase of the solid phases and at the same time water loss from the larger pores in both the mortars contributed to similar early shrinkage. At the late age, the mortars became more and more dried and the smaller pores began to loss water forming strong contraction. Meanwhile, the hydration reaction has reached a stable stage so that the pore structure became a key factor influencing the drying shrinkage [19]. It can be seen from Figure 9 that, compared with Ref mortar, the mortar with GA contained more micro pores (<10 nm) which could lead to larger contraction due to stronger surface tension in the smaller sizes of pores. This is in agreement with the findings by Mehta and Monteiro [20], that is, capillary pores with diameters less than 50 nm play an important part in drying shrinkage and creep.

10
0 20 40 60 80 100-10
0
10
20
30
40
50
60
70
80 B-cement GA-cement
D
ry s
hrin
kage
(10-5
)
Time (d)
Figure 7 – Time-dependent dry shrinkage behaviour from cement mortar
0 200 400 600 800 1000 1200 14000.000
0.002
0.004
Hyd
ratio
n ex
othe
rmic
rate
(W/g
)
Hydration time (min)
B-cement
GA-cement
Figure 8 – Hydration exothermic rate curve

11
1 10 100 1000 10000 100000-0.02
0.00
0.02
0.04
0.06
0.08
0.10
0.12
0.14
0.16
0.18
0.20
0.22
0.24
0.26
B-cement 28day GA-cement 28day
Log
Diff
eren
tial I
ntru
sion
(mL/
g)
Pore size Diameter (nm)
1 10 100 1000 10000 1000000
4
8
12
16
20
24
28
32
36
B-cement 28day GA-cement 28day
Poro
sity
(%)
Pore Diameter(nm)
Figure 9 – Pore size distribution and porosity of cement mortars after 28 days hydration
3.2 Accelerated carbonation
Figure 10 shows the results from the accelerated carbonation test and Figure 11 is the spectra of X-ray diffraction (XRD) of both mortar samples.
It is demonstrated that the carbonation depth of mortar mixed with GA was lower than that of Ref cement mortar at every carbonation ages. From Figure 11 it can be seen that the specimen with GA revealed slightly stronger intensity of peaks related to Ca(OH)2 (noted as CH) than Ref cement mortar after cured for 28 days, indicating a higher degree of hydration, probably due to its finer particle size distribution as shown in Figure 2. This finer particle size of cement with GA might also contribute to its finer pore size distribution after hydration, as shown in Figure 9. Both higher amount of Ca(OH)2 and finer pore structure positively increased the resistance to carbonation [21, 22].
3d 7d 14d 28d
0
2
4
6
8
10
12
B-cement GA-cement
Car
bona
tion
dept
h (m
m)
Time (d)
Figure 10 – Carbonation depth change as a function of carbonation time.

12
0
5
10
15
20
25
30
10 20 30 40 50 60 70 80
0
5
10
15
20
25
30
1 CH2 CSH3 C3S,C2S,C4AF
11,211
1,2
2321
11
2
28 day
GA-cement
B-cement
1,221
2,3 11,21
11
Inte
nsity
(Cou
nt)
2°
Figure 11 – XRD spectra of cement mortars
3.3 Freeze-thaw resistance
The results from the freeze-thaw test are shown in Figures 12 and 13.
It can be seen from Figure 12 that the mass loss rate increased with freeze-thaw cycles, and the tendency became dramatically after 30 freeze-thaw cycles. This indicates that the overall structure of both two cement mortars had changed under the freeze-thaw cycles. Meanwhile, the mass loss rate of mortar mixed with GA was always lower than that of Ref mortar. After 60 freeze-thaw cycles the mass loss rate of mortar mixed with GA was 3.2% while the mass loss rate of Ref mortar was up to 6.2%. As shown in Figure 13, the relative dynamic modulus of both mortars slightly increased in the beginning, followed by a decrease, especially after 30 and 50 freeze-thaw cycles, respectively for Ref and GA mortars. This signifies that the damages of internal structure of mortar was not apparent under a few of freeze-thaw cycles, under which the internal structure of mortar was further improved owing to the further hydration and thus the relative dynamic modulus increased slightly. The damage of internal structure of mortar became more obvious with increased number of freeze-thaw cycles, which led to a rapid decline of relative dynamic modulus of mortar. Meanwhile, the relative dynamic modulus of Ref mortar declined more significantly than that of the mortar mixed with GA, the former was declined to 75% after 60 freeze-thaw cycles while the latter declined to the similar level after 80 freeze-thaw cycles. The better freeze-thaw resistance of the mortar with GA may also be attributed to its finer pore structure containing more innocuous pores (size <10 nm) [23] and higher strengths, especially its higher flexural strength, as shown in Figure 3.

13
0 10 20 30 40 50 60 70 80 90 100
0
2
4
6
8
10
12
Mas
s lo
ss ra
te(%
)
Freeze-thaw Cycles
B-cement GA-cement
Figure 12 – Mass loss rate under the action of freeze-thaw cycles
0 10 20 30 40 50 60 70 80 90 1000,6
0,7
0,8
0,9
1,0
1,1
Rel
ativ
e dy
nam
ic m
odul
us
Freeze-thaw cycles
B-cement GA-cement
Figure 13 – Relative dynamic modulus under the action of freeze-thaw cycles

14
3.4 Sulphate resistance The results of the sulphate erosion test are shown in Figures 14 and 15.
0 10 20 30 40 50 60 70 80-4
-2
0
2
4
6
8
10
12
14
Mas
s lo
ss ra
te(%
)
Sulfate Cycles
B-cement GA-cement
Figure 14 – Mass loss rate under the action of sulphate erosion cycles
0 10 20 30 40 50 60 70 80
0,2
0,4
0,6
0,8
1,0
1,2
Sulfate Cycles
B-cement GA-cement
Rel
ativ
e dy
nam
ic m
odul
us
Figure 15 – Relative dynamic modulus under the action of sulphate erosion cycles

15
As shown in Figure 14, the mass loss rates of both mortars were negative in the beginning, and converted slowly to positive value, followed by a rapid increase after some 40 to 50 cycles. This signifies that the hydration products of both mortars reacted with the sulphate solution generating ettringite or gypsum which led to a mass increase and denser structure by filling internal pores. As a result, relative dynamic modulus increased under the early cycles as shown in Figure 15. Then, the surface layers of both mortars began to scale due to further expanding of hydration products that damaged the structure of mortar after more cycles of sulphate erosion. As a consequence, mass loss rate increased and relative dynamic modulus decreased after 30 cycles. Meanwhile, the mass loss rate of the mortar mixed with GA was always lower than that of Ref mortar while the former’s relative dynamic modulus was higher than the latter. This signifies that the resistance of cement mortar to sulphate attack can be improved by mixing with grinding aids.
Figure 16 – SEM images of mortars after 30 cycles of sulphate erosion
As shown in Figure 16, the ettringites generated in Ref mortar were thick and heavily piled together, which might strongly expand to damage the structure of mortar, while the ettringites generated in the mortar mixed with GA appeared thin and loosely glued together, which could fill in the internal pores and improve the compactness of mortar [24-25]. The formation of thinner ettringites in the mortar mixed with GA is also attributed to its finer pore structure which reduced the ingress of sulphate ions and retard the formation rate of ettringite.
4. CONCLUDING REMARKS
In this study, the durability of cement mortar mixed with a polymer type of grinding aid was evaluated through a series of tests including drying shrinkage, carbonation, freeze-thaw attack, and sulphate erosion attack. As a result, it revealed different performances in the four durability indicators, and can be summarized as follows:
The dry shrinkage rate of cement mortar mixed with grinding aid was higher than that of Ref cement mortar, because of its more micro pores (<10 nm), which promote drying shrinkage.
The resistance of cement mortar mixed with grinding aid to carbonation was higher than that of Ref cement mortar, partly because of its better hydration which produced more

16
Ca(OH)2 as buffer for damping carbonation and partly due to its finer pore structure, which reduced the diffusion of carbon dioxides.
The resistance of cement mortar mixed with grinding aid to freeze-thaw attack was higher than that of Ref cement mortar, because its finer pore structure and higher flexural strength.
The resistance of cement mortar mixed with grinding aid to sulphate attack was higher than that of Ref cement mortar, also because its finer pore structure, which might reduce the ingress of sulphate ions and promoted the formation of less harmful thin ettringites.
It should be noted that, because of the limited test series, it is not sure that the above observed improvement in durability is due to the chemical components of the polymer grinding aid or due to the increased fineness of the cement. Nevertheless, the results from this study demonstrate that the use of polymer grinding aid with small dosage does not impair but improve the durability of concrete, possibly through the increased fineness of the cement. ACKNOWLEDGES The authors gratefully acknowledge the financial support from 973 Program (2015CB6551002), National Natural Science Foundation of China (51278096 and 51308343). REFERENCES 1. M.katsiotiet,al.“Characterization of various cement grinding aids and their impact on
grindability and cement performance, ”Construction and Building Materials,Vol. 23, 2009, pp. 1954-1959.
2. A.T. Albayrak, M. Yasar, M.A. Gurkaynak, I. Gurgey, “Investigation of the effects of fatty acids on the compressive strength, of the concrete and the grindability of the cement,”CemConcr Res, Vol.35, No.2, 2005,pp. 400–404.
3. P.J. Sandberg, F. Doncaster, “On the mechanism of strength enhancement of cement paste and mortar with triisopropanolamine, ”CemConcr Res,Vol.34, No. 6, 2004, pp. 973–976.
4. H.Y.Qian, Q.G.Kong, B.L.Zhang, “The effects of grinding media shapes on the grinding kinetics of cement clinker in ball mill, ”Construction and Building Materials, Vol. 235, 2013, pp. 422-425.
5. D. Touil, S. Belaadi, C. Frances,“The specific selection function effect on clinker grinding efficiency in a dry batch ball mill’, International Journal of Mineral Processing, Vol. 87, 2008, pp.141–145.
6. Ö. Gença, Ş.L. Ergün, A.H. Benzer, “The dependence of specific discharge and breakage rate functions on feed size distributions, operational and design parameters of industrial scale multi-compartment cement ball mills, ”Construction and Building Materials, vol. 239, 2013, pp. 137-146.
7. Deniz V, “A study on the specific rate of breakage of cement materials in a laboratory ball mill,” Cement and Concrete Research, Vol. 33, No. 3, 2003, pp. 439-445.
8. Rossi M, Pina C D, Pagliaro M, “Greening the construction industry Enhancing the performance of cements by adding bioglycerol ,”ChemSusChem, Vol.1, No. 10, 2008, pp. 809-812.
9. JING Chao-hua, YAN Sheng, “Multifunctional composite cement grinding aid, ”Journal of Hohai university(Natural Science), Vol.30, No. 4, 2003, pp. 428-431.
10. Ouyang Kelian, “Evaluation of the grinding effect of alkanolamines and its influence on alite hydration” Doctoral thesis, South China University of Technology, China.

17
11. D. Qingyun, “The effect and analyzing method of particle characteristic to cement performance,”2005 http://www.bettersize.com/english/E-technology3.htm.
12. F. Škavára, K. Kolár, J. Novotnŷ, Z. Zadák, “The effect of cement particle distribution upon properties of pastes and mortars with low water to cement ratio,” CemConcr Res, Vol. 11, 1981, pp. 247-255.
13. K. Kuhlmann, H.G. Ellerbrock, S. Sprung, “Particle size distribution and properties of cement, Part I: strength of Portland cement,” ZKG, Vol. 6, 1985, pp. 136-145.
14. S. Tsivilis, S. Tsimas, A. Benetatou, “Study on the contribution of the fineness on cement strength,” ZKG, Vol. 1, 1990, pp. 26-29.
15. Kovler K, Zhutovsky S,“Overview and Future Trends of Shrinkage Research, ”Materials and Structures, Vol. 39, No. 9, 2006, pp. 827-847.
16. L. T. Kataoka,M. A. S. Machado, T. N. Bittencourt, “Short-term experimental data of drying shrinkage of ground granulated blast-furnace slag cement concrete, ”Materials and structures, Vol. 44, No. 3, 2011, pp. 671-679.
17. M. Bouasker, P. Mounanga, P. Turcry, A. Loukili, A. Khelid, ”Chemical shrinkage of cement pastes and mortars at very early age: effect of limestone filler and granular inclusions,”CemConcr Res, Vol. 30, 2008, pp. 13-22.
18. P.Mounanga, A.Khelidj, A.Loukili, V.Baroghel-Bouny, “Predicting Ca(OH)2 content and chemical shrinkage of hydrating cement pastes using analytical approach,”CemConcr Res, Vol. 34,2004, pp. 255-265.
19. Juenger M C G, Jennings H M,“Examining the relationship between the microstructure of calcium silicate hydrate and drying shrinkage of cement pastes, ”Cement and Concrete Research, Vol. 32, No. 2, 2002, pp. 289-296.
20. Mehta PK, Monteiro PJM. Concrete-Microstructures, Properties, and Materials[M]: McGraw-Hill, 2006, pp. 24-34.
21. Qiang Wang, Peiyu Yan, GuidongMi, “Effect of blended steel slag–GBFS mineral admixture on hydration and strength of cement, ”Construction and Building Materials, Vol. 35, 2012, pp. 8-14.
22. WU Z W, LIAN H Z. High Performance Concrete [M](in Chinese):1999, pp. 22-27. 23. Y.fukudome,et,al, “A study on durability of concrete using CaO-2Al2O3fine powder
under marine environment,” In: 3rd International Conference on the Durability of Concrete Structures. 2012, Northern Irland,UK, MAT1-7.
24. Heren Z, ölmez H, “The influence of ethanolamines on the hydration and mechanical properties of portland cement,”Cement and Concrete Research, Vol. 26, No.5, pp. 701-705.
25. Albayrak A T, Yasar M, Gurkaynak M, “Investigation of the effects of fatty acids on the compressive strength of the Concrete and the grindability of the cement” Cement and Concrete Research, Vol. 35, 2005, pp. 400-404.

18

19
Estimation of Chloride Threshold Values in Concrete exposed to Swedish Marine Environment over 20 years
Dimitrios Boubitsas Lic.Eng., Ph.D. Student University of Lund, Sweden CBI Swedish Cement and Concrete Institute Box 857, SE-501 15 Borås, Sweden E-mail: [email protected] Tang Luping Ph.D., Prof Chalmers Univ. of Techn. Div. of Building Technology SE-412 96, Gothenburg E-mail: [email protected] Peter Utgenannt Ph.D. CBI Betonginstitutet c/o SP SE-501 15, Borås E-mail: [email protected] ABSTRACT
This paper presents results from corrosion measurements of reinforced concrete slabs exposed to Swedish marine environment up to over 20 years. The corrosion conditions of the rebars were measured after 13 and 20 years’ field exposure using a non-destructive method (galvanostatic pulse method). For many slabs destructive visual examinations were also carried out to confirm the results from the non-destructive method. Estimation is made of the chloride threshold value from evaluation of the corrosion conditions and the chloride contents at the cover. It is estimated that a chloride threshold value of at about 1% by weight of binder is necessary to initiate and maintain active corrosion. Key words: Corrosion, chlorides, concrete, durability, field exposure.
1. INTRODUCTION Chloride-induced reinforcement corrosion is a common degradation processes in reinforced concrete structures exposed to a marine environment and road environment where de-icing salt

20
is used. Steel in concrete is normally protected by the high alkaline nature of the pore solution in concrete which leads to the formation of a passive protective film on the steel surface [1, 2]. However, when chloride ions ingress into concrete and reach a certain critical concentration (chloride threshold value) at the depth of the reinforcement the passive film is broken down and the steel starts to corrode. A lot of research has been devoted to try to determine the chloride threshold value (CTV) and several parameters have been identified to affect it. In the recent years comprehensive literature reviews on the subject have been published [3, 4], in these reviews a large scatter in the reported values was found. One of the decisive parameters for the CTV has been identified to be the pH of the pore solution which mainly depends on the binder type [5]. To a large extent the current knowledge of CTV are based on experience from structures with ordinary Portland cement (CEM I) as binder. One of the reasons for this is that limited results are available in the literature with regard to binders such as blended cements, including silica fume, fly ash and blast furnace slag [6]. As the use of CEM I is gradual decreasing, and replaced more and more with blended cements an urgent need of an increased knowledge on the influence of the blended cements on the CTV and corrosion related durability in general is needed [6]. This paper presents and analyses results from three research projects, dealing with reinforcement corrosion measurements in concretes with e.g. different binder types exposed to up to 20 years in Swedish marine environment [7, 8, 9]. In this paper the main focus is to identify how much the type of binder can influence the CTV in specimen exposed to natural environment. Due to prevailing testing circumstances the CTV is defined in this study as the chloride content necessary to initiate active corrosion. 2 EXPERIMENTAL
More than 40 types of concrete slabs were exposed to seawater at the field site, more details on specimen design, the field test site and all tested mixture proportions can be found in [7]. Concrete slabs with the dimensions of 1000×700×100 mm were cast. In most of the exposed slabs three rebars were embedded, one stainless steel and two regular carbon-steel rebars (see Fig. 1). The holes in the concrete slab in Fig. 1 are from previous core sampling for chloride profiling. Apart from different binders and water-binder ratios, different steel dimensions and concrete covers were also included. Some slabs placed at the test site were also prepared before exposure with “Artificial cracks” and “Natural cracks” (Fig. 2). The so-called “Artificial cracks” were achieved by placing metal discs of different thickness (0.5, 0.3, 0.1 and 0.05 mm) in the concrete when it started to set. How the so-called “Natural cracks” were achieved is not clear. From the appearance of the slab it can be concluded that the concrete cover was damaged pointwise in a rather symmetrical pattern.

21
Figure 1. Concrete slab after 20 years of exposure and the division in different exposure zones.
Figure 2. Concrete slabs with simulated cracks. Left slab with “Artificial cracks” and right slab with so-called “Natural cracks”. After moisture curing for about two weeks, the slabs were transported to the field site (located in southwest Sweden) and mounted on the sides of pontoons for exposure with the bottom side of the slab facing the seawater (Fig. 3). The chloride concentration in the seawater varies from 10 to 18 g Cl- per litre, with an average value of about 14 g Cl- per litre. The water temperature has an annual average of +11°C.

22
Figure 3. Overview of the field site. The exposure condition of the slabs was divided into three major zones as illustrated in Fig. 1, an atmospheric, a splash (further sub-divided into three zones) and a submerged zone. The splash zone was as mentioned divided into three zones: a zone mostly above sea level (Sa), a zone at sea level (splash), and a zone mostly below sea level (Su). For all concrete slabs one core for chloride profile was taken from the submerged zone, for some slabs cores from up to four exposure zones were taken. More details about the sampling, chloride and calcium analysis can also be found in [7] Hence, the calcium content also was determined for each individual sample (parallel with the chloride content), the CTVs in this study are expressed as total chloride content relative to the weight of binder. Corrosion rate measurements were performed for most of the reinforced concrete slabs after 13 years [8] and 20 years of exposure [7]. In some cases corrosion rate was measured only at one occasion after 18 or 19 years of exposure [7]. Chloride content measurements were performed for most of the slabs at least after 10 [9], and 20 years of exposure [7]. The commercially available RapiCor instrument based on galvanostatic pulse technique was used to measure the corrosion state of the rebars. RapiCor provides an indication of the instantaneous corrosion conditions of the rebars by measuring corrosion rate, corrosion potential and concrete resistivity. The measurement principle for this galvanostatic pulse method is given in [7]. Because the corrosion conditions were not continuously monitored during the exposure, it is unknown when exactly corrosion was initiated. Therefore, it is not possible to exact determine the chloride threshold values from the instantaneous corrosion measurements and chloride profiles. However, estimation is made of the chloride threshold value from evaluation of the corrosion conditions after a certain time and the chloride contents at the cover depth at that time. The following methodology was used in this paper for estimating the chloride threshold values in concrete exposed in the field exposure site:
Mapping the instantaneous corrosion rate of rebar using the non-destructive test method at one or two different occasions
Determining chloride profiles at various occasions Verifying the above non-destructive test by destructively detaching some rebars with
different measured corrosion rates for visual examination. Based on the results from the visual examinations, the following criterion was
established, rebars showing instantaneous corrosion rate:

23
≤ 5 m/yr is considered to be passive 5-10 m/yr uncertain corrosion condition > 10 m/yr active corrosion
Assessing the chloride contents at the cover depth mostly from the chloride profiles. Verifying the estimated CTV by destructively releasing some more rebars for visual
examination and measurement of chloride content at the cover depth. Already at the first project [8] dealing with reinforcement corrosion measurements of the slabs it was detected that a poor interface between the concrete and mortar distance spacer resulted in early corrosion. This was also confirmed in this study, where often corrosion products were visible on the surface of the concrete slabs, at the level of the spacer, or a very high corrosion rate was measured at the lower end of the rebars (~90 cm from the top of the slab). In both these cases most of the rebars were omitted from the procedure of estimating the chloride threshold value because the actual chloride content initiating corrosion was not possible to estimate. 3 RESULTS AND DISCUSSION Figure 4 shows the chloride ingress in some slabs after 20 years of exposure in marine environment. Both the dependency of the exposure zones as defined in Fig. 2 and the effect of the binder (binder compositions are given in the following text) on the chloride ingress is elucidated in Fig. 4. The result showed that the chloride ingress was in general more severe in the submerged zone, and that pozzolanic additions such as fly ash and silica fume can effectively reduce chloride ingress. Further details on the development of chloride ingress through the 20 years of exposure and validation test of two prediction models are given in [7].
Figure 4. Profiles of chloride ingress in the concrete slabs after 20 years of exposure in marine environment. a) The dependency of exposure zone. b) The effect of binder type. Figure 5 shows examples of corrosion rate measurements and photographic images from the visual examination. Also in Fig. 5 the corrosion rate limits (dashed red lines) dividing passive (≤ 5 m/yr) and active (> 10 m/yr) corrosion are plotted. Each rebar was measured at nine locations at an interval of 10 cm from the top edge of the concrete slab. As the previous investigation [8] from the same field site has shown, the corrosion rate is the most accurate way to identify the corrosion condition of the embedded rebars. Both corrosion potential and

24
concrete resistivity give greater response to the environment of the exposure zone rather than to the corrosion condition of the rebar. In the following only the corrosion rate will be addressed to for the evaluation of the corrosion condition.
Figure 5. Photographic images from the visual examination of detached rebars from slab 50-5 and corrosion rate measurements. Table 1 to 4 summaries the data of corrosion conditions and chloride content at the cover depth (based mainly on chloride profiles) for concretes exposed at the field site for up to 20 years. All data analyzed in this paper and additional data can be found in more detail in [7, 8, 9]. As previous mentioned in this study the main focus is to identify if the type of binder can influence the chloride threshold value, and therefore the division of the Tables 1 to 4 is based on binder type. Besides the binder type the following information is given about the different concrete mixes in the Tables 1 to 4; the mix number (MIX) in accordance with previous reports [7, 8 9], water binder ratio (w/b), air content (air) and the 28 days cube compressive strength (fc28d). The water-binder ratios were calculated assuming that the efficiency factor (k-value) for silica fume is 1 and for fly ash 0.3 in accordance with previous reports [7, 9]. Further, the maximum corrosion rate (Corr. max) and the position (Dist.) measuring it from the top edge of the slab after various times of exposure is given. Also the chloride content (Cl) at the time of the corrosion measurements performed at 18, 19 and 20 years of exposure is given in the Tables 1 to 4. However, determination of the chloride content was not performed for most of the concrete mixes when corrosion measurements were performed after 13 years of exposure. So, in some relevant cases the chloride content after 13 years of exposure is calculated by using the empirical model based on Fick’s second law (Eq. 1).

25
tDxerfCCCtxC
ainisaini 2
1, (1)
Where Cini is the initial chloride content in concrete, C(x, t) is the total chloride content (mass-% of binder) at depth x at time t, Da is the apparent diffusion coefficient and Csa the apparent surface chloride content. It was assumed that Da and Csa did not change considerably with time after 10 years of exposure, as was evident from the results in [7]. In Tables 1 to 4 also the exposure zone (in brackets) can be found where the stated chloride content was determined, ATM, stands for atmospheric, SUB, stands for submerge and SPL for splash zone. The abbreviation SPOT that also can be found in between brackets means that the chloride content in those cases was determined by taking concrete samples direct at the depth of the rebar as is explained in [7], and not by profiling. Table 1 summarizes the data for concretes with binder 100% Anl (Swedish SRPC, CEM I 42.5N MH/SR/LA). Table 1 shows that already after 13 years of exposure all rebars embedded in concrete slabs showed corrosion initiation according to the corrosion criterion in this study. The chloride contents at the cover depth varied from 1.5 to 3.3% depending mainly on the cover depth and the w/b. No estimation of the CTV could be carried out. However, it can be concluded that the CTV most likely is less than 1.5%. Table 1. Corrosion conditions of rebars after different exposure times for concretes with 100% Anl. as binder.
1) Calculated, assumed that DF2 and Cs do not change considerably from 13 years to 20 years. 2) Calculated, assumed that DF2 and Cs do not change considerably from 10 years to 13 years. Table 2 summarizes the data for binder 95% or 90% Anl plus 5% or 10% SF. This binder is combined with the Swedish SRPC and silica fume from Norway manufacture by Elkem. In Table 2 it is apparent that several rebars (embedded in slabs H5, H2, 30-5) did not show signs of corrosion initiation even after 20 years of exposure. The main reason being a low chloride content (0.1-0.5%) at the depth of the rebars. This is due to a relatively thick concrete cover, and a high resistant to chloride ingress. A chloride content of >1.0% at the depth of the rebars was necessary for the slab with 95% Anl+5%SF to yield corrosion rates > 10 m/yr, which is defined as active corrosion. Corrosion products were also confirmed in the visual examinations. With

26
the available data in Table 2 the CTV for the binder combination 95% Anl and 5% SF can be estimated to be about 1.0%. Because of the limited data, no estimation of the CTV can be made for the binder combination of 90% Anl + 10% SF, however, one rebar in slab H2(III), showed a corrosion rate of 10 m/yr at chloride content of 0.5% (based on the calculation), but no visible corrosion could be found at that position after 20 years of exposure. Table 2. Corrosion conditions of rebars after different exposure times for concretes with Anl +5 or 10% SF. as binder.
1) Calculated, assumed that DF2 and Cs do not change considerably from 10 years to 13 years. Table 3 summarizes the data for 100% Slite (Swedish OPC, CEM I 42.5R). The results in Table 3 show some discrepancies. For some rebars embedded in slabs 8-35, 8-40(I) no significant corrosion rate indicating active corrosion was developed, despite the fact that the chloride content was about 2%. However, for the rebars embedded in slabs 2-352 and 8-40 (II), with chloride content of ≥1.3% at the depth of the rebars corrosion rates indicating active corrosion was measured, and this was confirmed by the visual examination. Because, none of the rebars

27
showed corrosion rates above 10 µm/yr for a chloride content of <1.3 mass-% of binder, the CTV for the Slite cement is estimated to be about 1%.
Table 3. Corrosion conditions of rebars after different exposure times for concretes with 100% Slite as binder.
1) Calculated, assumed that DF2 and Cs do not change considerably from 10 years to 13 years. Table 4 summarizes the data for various binder combinations, these are:
Ternary binder of 85% Anl plus 10% FA (fly ash from Aalborg in Denmark) and 5% SF Binder combined with 95% Deg (Degerhamn 400, another Swedish SRPC, CEM I 52,5
N SR/LA) and 5% SF Blast furnace slag cement from the Netherlands, CEM III/B 42.5N
In Table 4 the two first concrete mixes (12-35 and 94-4C) contained a binder combination of 85%Anl+10%FA+5%SF. In the first slab (12-35) after 20 years of exposure high chloride contents (about 3% by mass of binder) was measured at the depth of the rebars, however, the corrosion rates (5-15 µm/yr) were quite low. Especially for the rebar with a concrete cover of 15 mm the corrosion rate was so low that according the corrosion criterion in this study it could be considered as passive. However, this rebar was detached from the slab and the visual examination revealed corrosion initiation (Fig. 6, left hand side). The corrosion attacks was not as severe as those showed in Fig. 5, but still evident. As the corrosion rates were even lower after 13 years of exposure and the visual examination after 20 years did not revealed severe corrosion attacks the CTV is estimated to be about 2%. The other slab (94-4C) with the same multi-pozzolanic additions was prepared prior to exposure with “Natural cracks”. The measured corrosion rates in this case was considerable higher for almost half the chloride content of that in slab 12-35. This can be due to the fact that the cracks can e.g. generate concentration cells (chloride and oxygen gradients) enhancing the susceptibility to corrosion initiation. Alanso and Sanchez 3 pointed out that the presence of cracks can cause the decay of the CTV. The same pattern was observed for the rebars in the slabs with CEM III/B as binder (94-1A and 94-1B). Negligible corrosion rates were measured for the rebars embedded in the slab without cracks while for the slab with cracks the measured corrosion rates indicated corrosion initiation. This was also confirmed by the visual examination; see Fig. 6 (right hand side), however these corrosion attacks were not severe. From the data in Table 4 the CTV for the slag cement (slab without simulated cracks) is estimated to be about 2%. It must be pointed out that only one chloride profile for slab 94-1B was measured and that the same chloride ingress is assumed to be valid for slab 94-1A.

28
Finally, Table 4 shows the results for the slab with 95%Deg+5%SF. For the only rebar that it was possible to make an assessment a rather high CTV can be estimated, after 13 years of exposure and with a chloride content of 2% at the rebar depth the corrosion rate was negligible (< 5 m/yr).
Table 4. Corrosion conditions of rebars after different exposure times for concretes with various binder combinations.
1) Calculated, assumed that DF2 and Cs do not change considerably from 10 years to 13 years.
Figure 6. Photographic images from the visual examination of detached rebars from slab 12-35 (left hand side) and from slab 94-1B (right hand side) with corresponding corrosion rate measurements.

29
As is mentioned in [4] two different ways of defining CTV are common: A scientific point of view (definition 1), where the CTV is defined as the chloride content required for depassivating the rebars, and a practical engineering point of view (definition 2), which is usually the chloride content associated with an acceptable degree of corrosion. Due to the fact that the corrosion condition was not continually monitored in this study, and consequently the exact depassivation time is not known, definition 2 was adopted. With support from corrosion rate measurements and visual examinations the corrosion criterion was established. With this corrosion criterion it is reasonable to assume a chloride threshold value of about 1% by weight of binder for binders including ordinary Portland cement (Slite), sulphate resistance Portland cement blended with 5% silica fume (95% Anl + 5% SF), with different water-binder ratios in a range of 0.3 to 0.5. As previous mentioned a large range of scatter for reported chloride values is found in the literature [3, 4], and it is difficult to make a direct comparison between studies due to the numerous parameters affecting chloride threshold values. However, the estimation of 1% by weight of binder for the above types of concrete made in this study is in line with the mean values reported in the statistical analysis of published chloride threshold values (1.24% by weight of binder) made by Alonzo and Sanchez [9], for which they referred to as “natural methods”. For the ternary binder (85% Anl + 10% fly ash + 5% silica fume) and the slag cement (CEM III/B) with water binder ratios 0.35 in the present study, the chloride threshold value can be as high as 2% by weight of binder content. This is somewhat contradictory to the conclusions in [6]. In [6] it was concluded that blended cements tend to decrease the CTV compared with ordinary Portland cement. The reason for this is that the pozzolanic reaction occurring when blended binders hydrate reduces the pH, which in turn increase the susceptibility to chloride attacks. If definition 1 was adopted for the CTV the same conclusion could possible been drawn for the specimens with mineral additions (e.g. the slabs in Fig. 6) in this investigation. However, by adopt definition 2 for the CTV, and according to Tuutti´s model [1], not only the initiation stage (as in definition 1) but also the propagation stage is included. This means that the development of the corrosion rate will have a large influence on the CTV as it will determine the “corrosion initiation time”, as illustrated in Fig. 7. As an example in Fig. 7, assuming that the chloride ingress is similar for both binders, Binder 1 is a CEM I and Binder 2 is a blended binder with mineral additions. Because of a reduced pH value the depassivation occurs earlier for Binder 2, which means a lower CTV than for Binder 1, if definition 1 is adopted. However, the corrosion rate in the propagation stage is lower for Binder 2, and depending on the level of the threshold for acceptable corrosion (definition 2) the CTV can be higher for Binder 2. This means that the adopted definition of the CTV can produce different result in the assessment of the influence of different binders.

30
Figure 7. The influence of the corrosion rate on the “corrosion initiation time” as consequence of the adopted definition of the CTV (Fig. based on Tuuttis´s model). 4 CONCLUSIONS With the adopted definition of the chloride threshold value, that is, the chloride content necessary to initiate and maintain active corrosion (> 10 m/yr), the following major conclusions can be drawn from this investigation:
The chloride threshold value is estimated to be about 1% by weight of binder for reinforcement steel embedded in many of the concretes exposed to the marine environment at the Swedish west coast. This threshold value seem valid for various unitary and binary binders including ordinary Portland cement, sulphate resistance Portland with 5% silica fume, and with different water-binder ratios in a range of 0.3 to 0.5.
For the slag cement (CEM III/B) with w/b 0.35 and for the ternary binder, blended with 85% Portland cement, 5% silica fume and 10% fly ash with w/b 0.35, the chloride threshold value can be as high as 2% by weight of binder in the prevailing circumstances.
However, the adopted definition of the chloride threshold value can produce different result in the assessment of the influence of different binders.
REFERENCES 1. Tuutti, K., “Corrosion of steel in concrete”, Dissertation, Swedish Cement and Concrete
Research Institute, Stockholm, 1982, 469 pp. 2. Page, C.L., Treadaway, K.W.J., “Aspects of the electrochemistry of steel in concrete”,
Nature, Vol. 297, May, 1982, pp. 109-115.

31
3. Alonso, M.C., Sanchez, M., “Analysis of the variability of chloride threshold values in the literature”, Mater. Corros. 60, 2009 pp. 631-637.
4. Angst, U., Elsener, B., Larsen, C.K., Vennesland, Ø.,“Critical chloride content in reinforced concrete – A review”, Cem. Concr. Res. 39, 2009 pp. 1122-1138.
5. H.F.W. Taylor, Cement Chemistry, second ed., Thomas Telford, London, 1997. 6. Alonso, M.C., Sanchez, M., Angst, U., Garcia-Calvo, J.L., “The effect of binder type on
chloride threshold values for reinforced concrete”, Chapter 13, Conference book, 3rd International Conference on Concrete Repair, Rehabilitation and Retrofitting, Edited by Pilate Moyo, CRC Press 2012, pp. 95-100.
7. Boubitsas, D., Tang, L., Utgenannt, P., “Chloride ingress in concrete exposed to marine environment - Field data up to 20 years’ exposure”, SBUF Report 12684, Borås, Sweden, 2014.
8. Tang L., Utgenant P., Fidjestøl, P., “Evaluation of Chloride-Induced Corrosion of Steel in Concrete after Long-Time Exposure in a Marine Environment”, SP Report 2005:54, Borås, Sweden, 2014.
9. Tang L., “Chloride Ingress in Concrete Exposed to Marine Environment – Field Data Up to 10 Years Exposure”, SP Report 2003:16, Borås, Sweden, 2003.

32

33
Residual capacity of deteriorated concrete structures
Concrete structures are susceptible to a variety of deterioration mechanisms, including corrosion of the reinforcement, freeze-thaw attack and alkali-silica reaction (ASR). The deterioration can affect the integrity and load carrying capacity of bridges, tunnels, dams and other concrete civil works exposed to out-door climate. Against the background of an increasing age of the infrastructure in combination with more demanding loading requirements, a Nordic miniseminar under the auspices of the Nordic Concrete Federation was held on 21 April 2015 at the premises of the Norwegian Vegdirektoratet in Oslo.
The miniseminar brought together researchers involved in assessments of existing bridges and other concrete structures. Eleven presentations were alternated with lively discussions:
1. Capacity control and evaluation of a severely corroded 50 years old multispan concrete bridge exposed to harsh coastal climate - Terje Kanstad - NTNU, Trondheim
2. 3D Modelling of the bond behavior of naturally corroded reinforced concrete - Karin Lundgren, Mario Plos, Mohammad Tahershamsi & Kamyab Zandi - Chalmers, Göteborg, Sweden
3. The effect of interference of corrosion pits on the failure probability of a reinforced concrete beam - Mahdi Kioumarsi, Max A.N. Hendriks & Mette Geiker - NTNU, Trondheim
4. Anchorage of corroded reinforcement – from advanced models to practical applications - Karin Lundgren, Mario Plos, Kamyab Zandi & Mohammad Tahershamsi - Chalmers, Göteborg, Sweden
5. Re-examinations of existing RC highway bridges and viaducts in the Netherlands - Ane de Boer - Ministry of Infrastructure and the Environment, The Netherlands
6. A Multi-level Structural Assessment Proposal for Reinforced Concrete Bridge Deck Jiangpeng Shu, Mario Plos, Kamyab Zandi & Karin Lundgren, Chalmers, Göteborg, Sweden
7. Punching Capacity of a Reinforced Concrete Bridge Deck Slab Loaded to Failure - Niklas Bagge, Jiangpeng Shu, Mario Plos &Lennart Elfgren - LTU, Luleå, Sweden and Chalmers, Göteborg, Sweden
8. Large scale bond tests of ASR damaged concrete from Nautesund bridge - Hans Stemland & Eva Rodum - Sintef and SVV, Trondheim
9. Severe ASR damaged concrete bridges - Full scale shear tests and material properties. - Ricardo Antonio Barbosa & Søren Gustenhoff Hansen – DTU and SDU, Denmark
10. Measuring and modelling the deteriorating impact of Alkali-Silica Reaction in concrete on the mechanical characteristics - Rita Esposito & Max A.N. Hendriks - TU Delft and NTNU, Trondheim
11. Residual bearing capacity of the frost-damaged reinforced concrete beams - Manouchehr Hassanzadeh - Vattenfall AB & Lund University
The presenting authors are underlined. Nine authors prepared an extended abstract of their presentation (2, 3, 4, 5, 6, 7, 9, 10, 11). These abstracts are compiled in this issue.
The organizers of the miniseminar gratefully thank all participants of the workshop for their active participation, all presenters and authors for contributing to this issue and the Norwegian Public Road Administration for hosting the miniseminar.
Mikael Hallgren, KTH and Tyréns (co-organizer of the miniseminar) Max A.N. Hendriks, NTNU and TU Delft (co-organizer of the miniseminar) Dirch H. Bager (editor of this special issue) December 2015

34

35
3D Modelling of the bond behaviour of naturally corroded reinforced concrete
Karin Lundgren, Ph.D., Professor Chalmers University of Technology [email protected]
Mario Plos, Ph.D., Associate Professor Chalmers University of Technology [email protected]
Mohammad Tahershamsi, M.Sc., Ph.D. candidate Chalmers University of Technology mohammad.tahershamsi @chalmers.se
Kamyab Zandi, Ph.D., Researcher Chalmers University of Technology CBI Swedish Cement and Concrete Research institute [email protected]
ABSTRACT Corrosion of steel reinforcement causes cracking and spalling of concrete cover which affects the bond; this is a crucial factor in deterioration of concrete structures. Earlier, anchorage tests have been carried out on specimens with naturally corroded reinforcements. In an ongoing study, the focus is given to the modelling of these specimens. The aim is to evaluate the structural behaviour of the tested naturally corroded specimens. The analyses are performed in the FE program Diana. The frictional bond and corrosion models developed by Lundgren and Zandi are implemented in interface elements to model the interaction between the concrete and reinforcements. The preliminary results of the analysis showed differences in the shear crack pattern in comparison with the experiments. In the analysis, a longer remaining anchorage length was obtained in comparison with the experiment which resulted in a wrong failure mode. The issue might be related to the influence of aggregate interlock in FE analysis. Keywords: FE-modelling, natural corrosion, anchorage, bond behaviour, RC structures. 1. INTRODUCTION Corrosion of steel reinforcement has always been a major issue in RC structures. Study of corrosion effects is essential for a better understanding of the structural behaviour of existing deteriorated concrete structures. The most severe effect of reinforcement corrosion is the alteration of bond properties between the steel and concrete. Volumetric expansion of rust causes splitting stresses along corroded reinforcement which can be harmful to the surrounding material. Generally, the splitting stresses are not tolerated by concrete, and that leads to cracking and eventually spalling of the cover.
Effects of corrosion on bond have been studied by many research groups, see [1] and [2]. Tests of low rated artificial corrosion indicated a relatively close relation to the natural corrosion conditions, however, literature shows that accelerated corrosion methods may still result in superficial bond deterioration and change the anchorage behaviour, see [3] and [4].
In the presented work, modelling of the anchorage capacity in naturally corroded specimens were investigated. Three-dimensional non-linear finite element analysis was performed to

36
describe the anchorage behaviour of a tested naturally corroded specimen. The results of the numerical model was compared with the experimental data.
2. EXPERIMENTAL The experiments have been carried out at Chalmers University of Technology. The test setup and the test results are described in detail in [5] and [6]. The specimens were extracted from the edge beams of an existing girder bridge with a concrete slab; the edge beams showed different levels of corrosion-induced damage. Based on the damage patterns, the specimens were categorized in three different groups: Reference (R) beams with no visible damage, Medium (M) damaged specimens with only splitting cracks, and Highly (H) damaged specimens with spalling of the cover. One of these experiments (specimen M4) is presented and compared with the FE analysis in this paper. The drawing and a photo of the designed test set-up are shown in Figure 1.
Figure 1 – Photo and drawing of the indirectly supported four-point bending test. An indirectly supported four point bending test configuration was used for the experiments, see Figure 1. The load was applied by means of two hydraulic jacks defining a central constant moment zone and two shear spans. The beams were suspended by means of a frame which at the same time was used to fix the jacks. The support settlements as well as the mid-span deflection were measured by means of displacement transducers. The end-slip behaviour of the reinforcement bundles was recorded at both ends. The support zones were strengthened to avoid undesirable failure at these locations.
3. FE MODEL 3D non-linear finite element analyses were performed to describe the behaviour and capacity of the anchorage regions. The commercial software DIANA with pre- and post-processor FX+ was used for the numerical simulations. 3D tetrahedral elements were used for both the concrete and the tensile reinforcements. The interface elements were used to model the interaction between the concrete and reinforcements. The frictional bond and corrosion models were implemented in the interface elements. The models used for bond and corrosion were developed by Lundgren [7] and further developed by Zandi [8]. Due to symmetry, only one half of the beam was modelled as shown in Figure 2.
37
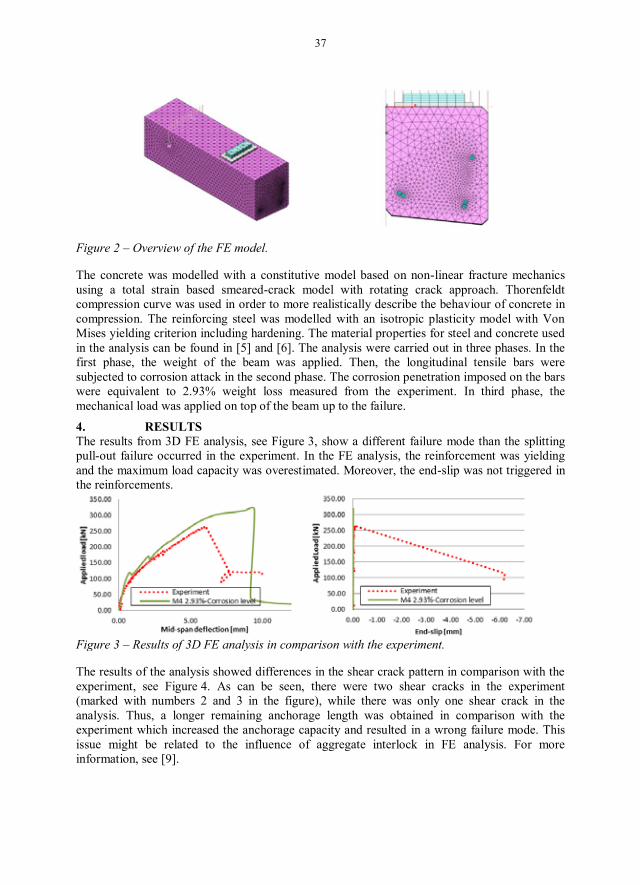
Figure 2 – Overview of the FE model.
The concrete was modelled with a constitutive model based on non-linear fracture mechanics using a total strain based smeared-crack model with rotating crack approach. Thorenfeldt compression curve was used in order to more realistically describe the behaviour of concrete in compression. The reinforcing steel was modelled with an isotropic plasticity model with Von Mises yielding criterion including hardening. The material properties for steel and concrete used in the analysis can be found in [5] and [6]. The analysis were carried out in three phases. In the first phase, the weight of the beam was applied. Then, the longitudinal tensile bars were subjected to corrosion attack in the second phase. The corrosion penetration imposed on the bars were equivalent to 2.93% weight loss measured from the experiment. In third phase, the mechanical load was applied on top of the beam up to the failure.
4. RESULTS The results from 3D FE analysis, see Figure 3, show a different failure mode than the splitting pull-out failure occurred in the experiment. In the FE analysis, the reinforcement was yielding and the maximum load capacity was overestimated. Moreover, the end-slip was not triggered in the reinforcements.
Figure 3 – Results of 3D FE analysis in comparison with the experiment.
The results of the analysis showed differences in the shear crack pattern in comparison with the experiment, see Figure 4. As can be seen, there were two shear cracks in the experiment (marked with numbers 2 and 3 in the figure), while there was only one shear crack in the analysis. Thus, a longer remaining anchorage length was obtained in comparison with the experiment which increased the anchorage capacity and resulted in a wrong failure mode. This issue might be related to the influence of aggregate interlock in FE analysis. For more information, see [9].

38
Figure 4 – Comparison of the crack pattern for the beam M4; the remaining anchorage length is given in cm.
5. CONCLUSION AND OUTLOOK Anchorage behaviour of a naturally corroded tested specimen was modelled in detail. The aim was to predict the bond behaviour of naturally corroded tensile reinforcements in concrete. However, the analysis results were deviating from the experiment in terms of crack pattern, end-slip behaviour and failure mode. In continuation, modelling a virtual notch in the concrete geometry will be investigated in order to enhance the behaviour. This solution might trigger the second shear crack in the right location and lead to more realistic results compared with the observations.
REFERENCES 1. Sæther I (2011) Bond deterioration of corroded steel bars in concrete. Struct Infrastruct
Eng 7:415–429. doi: 10.1080/15732470802674836 2. Zandi Hanjari K, Coronelli D, Lundgren K (2011) Modelling of Corroding Concrete
Structures. RILEM Bookseries. doi: 10.1007/978-94-007-0677-4 3. Austin SA, Lyons R, Ing MJ (2004) Electrochemical behavior of steel-reinforced
concrete during accelerated corrosion testing. Corrosion 60:203–212. 4. Saifullah M, Clark LA (1994) Effect of Corrosion Rate on the Bond Strength of Corroded
Reinforcement. In: Swamy RN (ed) Corros. Corros. Prot. Steel Concr. University of Sheffield, Sheffield, South Yorkshire, Great Britain, pp 591–602
5. Tahershamsi M, Lundgren K, Zandi K, Plos M (2014) Anchorage of naturally corroded bars in reinforced concrete structures. Mag Concr Res 1–16. doi: 10.1680/macr.13.00276
6. Lundgren K, Tahershamsi M, Zandi K, Plos M (2014) Tests on anchorage of naturally corroded reinforcement in concrete. Mater Struct. doi: 10.1617/s11527-014-0290-y
7. Lundgren K (2005) Bond between ribbed bars and concrete. Part 2: The effect of corrosion. Mag Concr Res 57:383–395.
8. Zandi K (2015) Corrosion-induced cover spalling and anchorage capacity. Struct Infrastruct Eng 1–18. doi: 10.1080/15732479.2014.979836
9. Zandi K, Flansbjer M, Lindqvist J, Silfwerbrand J (2012) Structural analysis of concrete members with shear failure. Proceeding fib Symp. Concr. Struct. Sustain. Community. Stockholm, pp 165–168

39
Failure probability of a corroded beam with interference effect of localised corrosion Mahdi Kioumarsi
Assistant Professor HiOA, Department of Civil Engineering and Energy Technology Pilestredet 35, Oslo E-mail: [email protected] Max A.N. Hendriks Professor NTNU, Department of Structural Engineering Rich. Birkelandsvei 1A, NO-7491 Trondheim TU Delft, Department of Structural Engineering Stevinweg 1, NL-2628CN, Delft, the Netherlands E-mail: [email protected] Mette Geiker Professor NTNU, Department of Structural Engineering Rich. Birkelandsvei 1A, NO-7491 Trondheim E-mail: [email protected]
ABSTRACT The present paper studies the effect of the spatial variation of localised reinforcement corrosion on the structural reliability of a reinforced concrete (RC) beam, with particular emphasis on the interference of localised corrosion on adjacent tensile rebars. Variability of localised corrosion along rebars is also considered and probability of failure at location of each pits is calculated. This is based on both probabilistic and analytical analyses. Probabilities of failure are evaluated using Monte Carlo simulation. Results reveal a significant influence of the pit interference on the probability of failure of the RC beam. Key words: Concrete structure, localised corrosion, pitting, probability of failure, interference of pits. 1. INTRODUCTION To predict the residual capacity of corroded structure, it is important to take into account the the maximum cross section area loss, including local corrosion effects or pits [1, 2]. In current guidelines [3-5] the impact of corrosion is modelled via empirical relations for stiffness, strength and ductility of the corroded reinforcement bars. The mechanisms resulting from localised corrosion have received limited attention. Recently, the impact of localised corrosion on the ultimate capacity and the possible interference of corrosion pits on adjacent rebars were quantified [1, 2]. It shown that the interference of localised corrosion has substantial influences

40
on residual capacity of corroded reinforced concrete (RC) beam. In the recent years, there has been considerable effort in the reliability assessment of RC members with corroding rebar [6-9]. In general, these probabilistic assessments have been focused on spatial variability of the localised corrosion based on sectional analysis where the effect of corrosion is accounted for each cross sectional area of RC elements. While much work has progressed to assess the effect of spatial variation of localised corrosion on reliability of RC beams, there is no work on reliability assessment considering possible interference of localised corrosion on adjacent rebars in RC beams. This paper studies the effect of interference of corrosion pits on adjacent rebars on the probability of failure of a corroded under-reinforced concrete beam. 2. INTERFERENCE OF LOCALISED CORROSION ON ADJACENT REBARS Kioumarsi et al. [1, 2, 10] selected an idealized case to quantify the possible interference of localised corrosion on adjacent rebars in an under-reinforced beam subjected to bending. In the idealized case two adjacent rebars were considered with one corrosion pit each. The two corrosion pits were equal in size. In a series of nonlinear finite element models the combined influence of two variables on the ULS was quantified: the ratio of the distance between pits in two adjacent rebars to the distance between tensile rebars, , and the ratio of the cross section reduction of the rebar due to localised corrosion to the initial cross section of rebar . From the numerical simulations it was found that pits interfere within a critical distance. Interference of localised corrosions reduces gradually for increasing distance between pits in two adjacent rebars . For the investigated beam with 80 mm distance between two adjacent rebars ( ) the critical distance was 100 mm; i.e. for higher ratios of > 100/80 = 1.25 no interference was observed. Current analytical design rules cannot quantify the interference of localised corrosions for intermediate ratios [2, 10]. In order to take into account the possible interference of localised corrosions, Kioumarsi et al. [10] proposed using a modified total residual cross section of corroded tensile rebars in an analytical analysis of the strength of the cross section: (1) (2) where is the modified total residual cross section of two rebars after uniform and localised corrosion, is the initial cross section of a rebar, is the cross section reduction of a rebar due to uniform corrosion, is the additional cross section reduction of a rebar due to localised corrosion. The interference of localised corrosion is introduced by an interference factor which is only a function of the ratio of the distance between pits in two adjacent rebars to the distance between tensile rebars. 3. PROBABILISTIC ANALYSES To quantify the failure probability of a corroded beam with interference effect of localised corrosion, the probability of failure is estimated using Monte Carlo simulation. The limit state function is expressed as:

41
(3)
where is the steel yield strength, is the concrete compressive strength, is the beam width, is the effective height, is the modified total residual cross-section of two rebars after uniform and localised corrosion, ta king into account possible interference, is self-weight, is live load, is the location of pit along tensile rebar and is length of beam span. 3.1 Case study Since under-reinforced beams are most common in practice only this type of beam was considered. Analyses were carried out for a simply supported RC beam. The beam’s dimensions are length 6 m, height 0.35 m and width 0.2 m. 3.2 Statistical properties of random variables Uncertainties in material properties, geometry, loads, corrosion modelling and pit distances are taken into account. The distances between pits and pit sizes in each tensile rebar is represented by an exponential and gamma distribution functions, respectively. Detail of all statistical variables of the RC beam used in the probabilistic analysis and their distribution functions are given in Table 1. Table 1 – Statistical properties of random variables
Variable Symbol Distribution Mean ( ) COV Pit width (mm) Deterministic 10 - Effective beam depth (mm) Log-normal 288 0.03 Beam section width (mm) Normal 200 0.02 Original rebar diameter (mm) Normal 24 0.02 Distance between adjacent tensile rebar (mm) Normal 80 0.05 Self-weight (kN/m) Normal 1.5 0.1 Live load (kN/m) Gamma 4.7 0.6 Concrete compressive strength (MPa) Log-normal 47.7 0.18 Steel yield strength (MPa) Log-normal 592 0.1
4. RESULTS The probability of failure (Pf) of the selected case is presented in this section. The results were presented for three different cross section reduction models:
a) only uniform rebar cross-section reduction without considering the spatial variation of pits, b) cross-section reduction of rebar due to uniform corrosion and spatial variation of remaining pits without considering the interference of pit, c) cross-section reduction of rebar due to uniform corrosion and spatial variation of remaining pits with the interference of pit.
Figure 1 illustrates the Pf of the corroded RC beam for different assumed values of uniform corrosion. The results are presented for three mentioned cross-sectional reduction models. According to results, taking into account the localised corrosion (red rhombs in Figure 1) and the interference of localised corrosion (green rectangles in Figure 1) in the analytical design rules have substantial influence on the Pf. On the other hands, model with only uniform corrosion without taking into account the spatial variation of pits (blue circles in Figure 1) results in an under estimation of the Pf.

42
Figure 4.3 – Probabilities of failure with different assumption of uniform corrosion for models with a) only uniform cross section reduction, b) uniform cross section reduction with spatial variation of pits without interference and c) uniform corrosion cross section reduction spatial variation of pits with interference. 4. CONCLUSION This paper considered the spatial variation and possible interference of localised corrosion on the failure probability of an under-reinforced concrete beam. Probabilities of failure were estimated using Monte Carlo simulation. The following conclusions can be drawn
Considering spatial variation of localised corrosion without interference of pits in the analytical design rules has significant influence on probabilities of failure. This influence increases if the effect of interference of localised corrosion is taking into account.
Percentage of assumed uniform corrosion affects the probability of failure. If amount of assumed uniform corrosion increases the probability of failure, also increases.
With increasing the value of the uniform corrosion, the effect of the interference of pits is decreased. In this case study, after 40% assumed uniform cross section reduction pits don’t interfere each other.
REFERENCES 1. Kioumarsi, M.M., Hendriks, M.A.N., Geiker, M.R. Effect of mesh alignment on simulated interference of
localised corrosion on adjacent reinforcement rebars in XXII Nordic Concrete Research Symposium. 2014. Reykjavik, Iceland.
2. Kioumarsi, M.M., Hendriks, M.A.N., Geiker, M.R., Quantification of the interference of localised corrosion on adjacent reinforcement bars in a concrete beam in bending. Nordic Concrete Research (NCR), 2014. 49: p. 39-57.
3. Cairns, J., et al., Mechanical properties of corrosion-damaged reinforcement. ACI Materials Journal, 2005. 102(4): p. 256-264.
4. Du, Y., L.A. Clark, and A.H.C. Chan, Impact of reinforcement corrosion on ductile behavior of reinforced concrete beams. ACI Structural Journal, 2007. 104(3): p. 285-293.
5. Du, Y.G., L.A. Clark, and A.H.C. Chan, Residual capacity of corroded reinforcing bars. Magazine of Concrete Research, 2005. 57(3): p. 135-147.
6. Li, C., Life-cycle modeling of corrosion-affected concrete structures: propagation. Journal of Structural Engineering, 2003. 129(6): p. 753-761.
7. Stewart, M.G., Mechanical behaviour of pitting corrosion of flexural and shear reinforcement and its effect on structural reliability of corroding RC beams. Structural Safety, 2009. 31(1): p. 19-30.
8. Stewart, M.G. and Q. Suo, Extent of spatially variable corrosion damage as an indicator of strength and time-dependent reliability of RC beams. Engineering Structures, 2009. 31(1): p. 198-207.
9. Val, D.V., Deterioration of strength of RC beams due to corrosion and its influence on beam reliability. Journal of Structural Engineering, 2007. 133(9): p. 1297-1306.
10. Kioumarsi, M.M., Hendriks, M.A.N., Geiker, M.R., Interference of localised corrosion in adjacent reinforcement bar of a beam in bending, in Concrete innovation conference_CIC. 2014: Oslo, Norway.
0
0.02
0.04
0.06
0.08
0 10 20 30 40 50 60
Prob
abili
ty o
f fai
lure
Uniform corrosion Auni/A0 (%)
Uniform+pit with interference
Uniform+pit without interference
Uniform only (no pit)

43
43
Anchorage of corroded reinforcement – from advanced models to practical applications
Karin Lundgren, Ph.D., Professor Chalmers University of Technology [email protected]
Mario Plos, Ph.D., Associate Professor Chalmers University of Technology [email protected]
Kamyab Zandi, Ph.D., Researcher Chalmers University of Technology CBI Swedish Cement and Concrete Research institute [email protected]
Mohammad Tahershamsi, Ph.D. candidate Chalmers University of Technology [email protected]
ABSTRACT When reinforcement in concrete corrodes, splitting stresses around corroded bars may lead to cover cracking and even cover spalling, affecting the anchorage. The aim of this paper is to give an overview on both advanced and practical models for anchorage capacity of corroded reinforcement which have been developed at Chalmers, and to show how these models can be applied in the assessment of existing bridges. The application of the practical model is exemplified in assessment of two bridges built in the 1960s. The bridges exhibit systematic damage in the form of spalled concrete on the bottom side of the main beams at cast joints where large amounts of reinforcement are spliced. The anchorage length needed to anchor the yield force was calculated from the bond-slip response, using the one-dimensional bond-slip differential equation. The model proved to be easy to use in practical design work. Furthermore, the bridges could be shown to have sufficient capacity, and costly strengthening could be avoided. This work clearly demonstrates the potential to certify sufficient load-carrying capacity of corroded reinforced concrete structures through improved models. Keywords: Keywords: Anchorage, Corrosion, Bond-slip, Concrete, Reinforcement
1. INTRODUCTION Infrastructures represent a large capital investment in all developed countries. To establish sustainable development, it is of great importance that the investments result in safe structures with predictable performance. Despite significant advances in construction design and practice, corrosion in reinforced concrete (RC) structures is still a leading cause of deterioration worldwide. This situation has led to a growing demand for better assessment of existing concrete structures and has revealed a need for an improved understanding of the structural effects of corrosion.
Corrosion of the steel reinforcement has two major effects: 1) reduction of the effective rebar area, and 2) change of bond properties between the reinforcement and the concrete, which is the topic of this paper. This has been studied by many researchers; for a state-of-the-art report see [1]. Advanced three-dimension Nonlinear Finite Element (3D NLFE) analysis has proven to be capable of describing the behaviour of reinforced concrete in a comprehensive way provided that appropriate constitutive models have been adopted. Furthermore, the effect of corrosion on the load-carrying capacity and the structural performance of existing structures can be more

44
44
realistically predicted; such models have been developed at Chalmers, see e.g. [2-5]. Although 3D NLFE analyses allow for a more accurate description of the deterioration and enable a better understanding of the structural effects at the material and structural levels, they are numerically expensive and thus incomprehensible for full-scale practical applications. Thus, there is also a need for simple model predicting the bond-slip behaviour for corroded bars, as the one presented by Lundgren et al. [6] and further validated in Zandi et al. [5]. The aim of the present study is to give an overview on both advanced and practical models for anchorage capacity of corroded reinforcement which have been developed at Chalmers, and to show how these models can be applied in assessment of existing bridges.
2. ADVANCED NLFE MODELS The volume expansion of corrosion products locally may lead to cover cracking/spalling and steel-concrete bond deterioration, and globally may result in a decrease in the load-carrying capacity and a change in the structural performance of concrete structures. These effects has been simulated in 3D NLFE analysis using a deterioration model previously developed by Lundgren [2-3], and thereafter extended by Zandi [4-5]. Major milestones throughout the development phase of the model, shown in Figure 1, include: (a) development of bond and corrosion models and validation with several experiments [2-3], (b) extending the model accounting for the flow of rust throughout cracks and experimental validation [4], and (c) developing a new computation scheme enabling the simulation of cover spalling for high corrosion attacks [5].
Figure 1. Overview of the earlier developments of deterioration model including major milestones.
3. A SIMPLIFIED MODEL FOR PRACTICAL APPLICATION A simplified 1D model for the Assessment of anchorage in corroded Reinforced Concrete structures; referred to as 1D-ARC model in this paper, has been established at Chalmers [6]. Major milestones throughout the development phase of the model are shown in Figure 2. The 1D-ARC model was originally formulated based on the analytical bond-slip model in Model
1999-2005
• development of bond and corrosion model
and validation
2006-2010
• Extending the corrosin model for flow of rust
and validation
2011-2014
• Simulated cracking & spalling and validation
σt
Stress in the inclined compressive struts
μ
-c
Yield line F1: friction
σn
σt
-σn
c
Yield line F2: the upper limit at a pull-out failure
Steel bar
ut σn
σt
un
Bond and corrosion layers

45
45
Code 1990 [7] combined with a parametric study using 3D NLFE analyses and several experiments [6]. The model was later verified by results from test specimens with natural corrosion [8]. Moreover, the model was recently validated by 3D NLFE analyses and experiments for high corrosion attacks leading to cover spalling [5]. This model was even applied in practice in a pilot study including two bridges, thereby demonstrating its excellent potential for practical use; this is further discussed in section 4. Moreover, the 1D-ARC model has recently been adopted by fib-SAG7 – Modelling of structural performance of existing structures – to be included in the planned Model Code for the assessment of existing structures. This demonstrates that the model has been internationally recognized which can be considered as a major milestone in the development of the model.
Figure 2. Overview of the earlier developments of the 1D-ARC model including major millstones.
4. APPLICATION OF THE 1D-ARC MODEL IN ASSESSMENT OF TWO BRIDGES The methodology is exemplified in assessment of two bridges, “Blommenbergsviadukten” and “Gröndalsviadukten”, bridges in Stockholm built in the 1960s. The bridges were built in phases; the first phase consisted of columns, cross beam, and a part of the superstructure, see Figure 3. Thereby, a cast joint was placed at each main beam on either side of each row of columns. This led to that large amounts of reinforcement were spliced at each cast joint; see Figure 3. Today, the bridges exhibit systematic damage in the form of spalled concrete on the bottom side of the main beams at these cast joints; an example is shown in Figure 3. At the assessment of the bridges, sufficient capacity could be shown if the structure was assumed to be undamaged. Considering the visible damages, this was however considered to be an unrealistic assumption. As the documented damages are located close to points where the bending moment is zero, it was first examined whether a simplified assumption that the bond strength was zero in the damaged areas would be enough; however, this conservative assumption resulted in insufficient capacity. Accordingly, a more detailed investigation on the anchorage in the damaged sections was needed. Thus, the model by Lundgren et al. [6] was applied. The bond versus slip was obtained first, and the anchorage length was calculated by numerical solving the basic 1D bond-slip differential equation along a bar.
2006-2007
•Formulation of 1D-ARC model
2008-2010
•Validation with 3D NLFE analyses and experiments
2011-2014
•Validation for natural corrosion and cover spalling
2014
•Pilot study for two bridges
s
τ
ax sp
Unloading
Uncorroded
Corroded
Uncorroded, shifted
Asw/s = 0.0
Corrosion weight loss [%]0.0 0.5 1.0 1.5 2.0 2.5 3.0No
rmali
zed b
ond s
treng
th, b
[%]
0
20
40
60
80
100
120
1 c/ c/ = 1.50
5
10
15
0 50 100 150 200
FE1D
Maximum bond stress [MPa]
Corrosion penetration [μm]
2014-…
Ado
pted
by
fib S
AG
7
-8000
-6000
-4000
-2000
0
2000
4000
6000
8000
36 41 46 51 56 61
Mom
ent (
kNm
)
Ytterbalk, fack 3 (m)
MEdMRdS0MRdSMRdO
38 m
34
Skadat område Skadat område

46
46
Figure 3. Left: Photo from the time of construction, showing the large amount of reinforce-ment spliced at the cast joints. Right: Example of a damage with spalled cover at a cast joint at the bridge today.
5. CONCLUSIONS AND OUTLOOK Models for anchorage capacity of corroded reinforcement, developed at Chalmers, were briefly reviewed. The 1D-ARC model was validated for anchorage in RC structures with cover cracking and spalling. The validation was conducted through a comparison to 3D FE analysis and experiments. Thereby, sufficient knowledge and models exist to calculate the anchorage capacity in concrete structures damaged by reinforcement corrosion. The model proved to be very useful in practical engineering work. Application to two bridges showed its potential to demonstrate sufficient load-carrying capacity, and thereby avoiding costly strengthening. The economical saving is around 27 million SEK for the two studied bridges only. For the bridges in question, a more detailed damage mapping will be performed, focusing on details that showed to be critical in this evaluation. A problem in the assessment of existing structures is to evaluate the current corrosion penetration. Measurement methods for the corrosion rate exist; however as the corrosion rate typically varies over time, and as the measurements must be combined with assumptions about how long time the corrosion has progressed, the resulting corrosion penetrations become very uncertain. In an ongoing research project, the real corrosion penetration will be measured in a relatively large number of specimens, and the results will be correlated with the visible damages in the form of crack pattern and crack widths. In this way, we hope to develop methods to link visible damages to the effect on load-carrying capacity.
REFERENCES [1] fib Bulletin 10 (2000), Bond of reinforcement in concrete, State-of-art report.
Fédération internationale du béton (fib), prepared by Task Group Bond Models, Lausanne, Switzerland.
[2] K. Lundgren, Bond between ribbed bars and concrete. Part 1: Modified model, Magazine of Concrete Research, 57 (7), 371-382 (2005).
[3] K. Lundgren, Bond between ribbed bars and concrete. Part 2: The effect of corrosion, Magazine of Concrete Research, 57 (7) 383-395 (2005).
[4] K. Zandi Hanjari, K. Lundgren, M. Plos, D. Coronelli, Three-dimensional modelling of structural effects of corroding steel reinforcement in concrete, Structure and Infrastructure Engineering, 9 (7) 702-718, (2013).
[5] K. Zandi, Corrosion-Induced Cover Spalling and Anchorage Capacity, Structure and Infrastructure Engineering: Maintenance, Management, Life-Cycle Design and Performance, 2015. DOI: 10.1080/15732479.2014.979836.
[6] Lundgren, K., Kettil, P., Zandi Hanjari, K., Schlune, H. & Soto San Roman, A. (2012), Analytical model for the bond-slip behaviour of corroded ribbed reinforcement. Structure and Infrastructure Engineering, 2012. Vol. 8, No. 2, pp. 157-169.
[7] CEB. (1993). CEB-FIP Model Code 1990. Bulletin d'Information 213/214, Lausanne, Switzerland.

47
47
[8] Perez, I. F., Tahershamsi, M., Marí, A. R., Bairán, J., Lundgren, K., Zandi, K., Plos, M., 1D and 3D analysis of anchorage in naturally corroded specimens, Proceedings of the 10th fib International PhD Symposium in Civil Engineering, Université Laval, 21 – 23 July 2014, Québec, Canada p. 547-552.

48
48

49
Re-examinations of existing RC highway bridges and viaducts in the Netherlands
Ane de Boer M.Sc, Ph.D. Griffioenlaan 2 3526LA UTRECHT, the Netherlands E-mail: [email protected]
ABSTRACT The last seven years a lot of improvements has been developed to get more remaining bearing capacity for the old reinforced structures. The combination of research in the lab and re-examinations of structures in the field has been done by the InfraQuest partners Delft University of Technology, TNO Research and Rijkswaterstaat, the road infrastructure division of the Dutch Ministry of Infrastructure and the Environment. Differences between old and new concrete, shear force behaviour in beams, slabs loaded by wheel prints nearby the support line, intermediate slabs between prestressed beams and sustainability, together with the evaluation of the current heavy traffic load has lead to alternative approaches to the ModelCode2010 or the Eurocode2. And last but not least the introduction of guidelines to nonlinear analysis of concrete structures. Key words: Assessment, concrete, experiments, nonlinear analysis 1. INTRODUCTION The last eight years a lot of topics are researched related to existing structures to get extra remaining capacity on the material concrete side and continuation of evaluation of (heavy) traffic passages at different locations on the Dutch highway network. This research is done in the InfraQuest environment, where Delft University of Technology, TNO Research and Rijkswaterstaat are working together to get a more sustainable network. In this framework research topics can be mentioned like 1) the strength relation between compression and tension at old(50 years) and new concrete, 2) concentrated wheel print load nearby a continuous support line and a partly support line, 3) transversal prestressed slab panels between longitudinal prestressed T-shaped beams, 4) development of a guideline for nonlinear analysis, 5) fatigue of concrete and stretched welded reinforcement, 6) evaluation of the heavy traffic passages and the Weigh in Motion locations in the Netherlands, 7) shear failure of old(50 years) reinforced beams, sawn form a slab viaduct, 8) introduction of proof loading on slab viaducts as ultimate process to keep old concrete structures in the highway network for a period of 15 till 30 years and 9) extend the roll of inspections of structures in general. Some of these topics, linking analysis in re-examination engineering, experiments in the lab and in-situ as well as evaluation of the heavy traffic passages are described in the following pages. 2. EXPERIMENTS IN THE LABORATORIUM AND IN-SITU The first research in the lab within the program of Renovation of concrete bridges was the relation of the tension and compression strength of old and new beams. The ModelCode 2010 gives these relations already, but the is focussed on new structures with the concrete material

50
properties of today. For old concrete it was possible to get another relation between both mentioned strengths. Also the shear force behaviour between both beams and the extension to slabs was part of this experimental program. Figure 1 shows the setup of the beam experiment, figure 2 shows the setup of the slab experiment.
Fig.1: Beam experiment Fig.2: Slab experiment Figure 1 shows the second test on the same beam, where figure 2 shows a slab of 2.5m×5m and wheel print load in the centre of the slab nearby a support line. The result of the old and new concrete beams shows a similar equation relation between the tension and compression strength for the old and new concrete. The result of the slab experiments was a modification of the force flow from the wheel print load to the support line. This French load spreading method is demonstrated in figure 3. An additional tool for experiments in-situ is the use of acoustic emission sensors, to get a sign of cracks in the concrete by loading a slab or a beam. In-situ are many expected and disturbing for the experiment sources of noise, where the lab circumstances are rather pure. Figure 4 gives a bottom view of a slab where sensors are installed to get the mentioned crack noise.
Fig.3: French load spreading method Fig.4: Bottom view slab with acoutic emmission sensors Both figures 3 and 4 are very helpful to make some predictions and postdictions of proofloadings of slabs in situ. Figure 3 helps to locate the wheelprint load on the top surface of the bridgedeck, where the sensors cathing the crack noise spreading over the slab. The proofloading of a slab is the last chance to keep the object in the highway network. When the re-examination analysis doesn’t reach the desired reliability of the object, coming form the current checking recommendation, only the proofloading can save the object. Different ways of setup of proofloadings are already used. Figure 5 shows a quick and dirty setup, a fixed setup and a movable setup.

51
Fig.5: Different setups proof loading slab viaducts The quick and dirty setup left top is just a slab span with sand bags and no measurements at all or two heavy trucks loaded by concrete blocks, left below is a steel bridge deck installed over the concrete bridge deck span, where the bottom surface of the concrete bridge deck is filled with a lot of sensors, LDVT’s and deformation sensors. Right below the figure shows a special heavy vehicle which can be driven over the span, where the wheel print load can be located to different location of the slab with the vehicle as contra loading. Also here the slab will be instrumented similar to the left below setup. 3. EXTENDED ANALYSIS TOOLS Coupled to the predictions and re-examinations of concrete structures refinements of models in the linear elastic field are extended. Refinements like the real load area of a wheel print, the real support area of a support location are recommended in the Dutch guideline for re-examinations of structures. The difference in normal and transverse stiffness between steel and rubber support locations is also described in this guideline. An automated process, based on a basic analytical linear elastic application in Excel is setup for slabs, prestressed beams and culverts. In this way a total number of 3500 objects can be re-examined in a automatic way. In the future every recommendation change can be solved by changing the basic application. Damage to the structure, discovered within the periodic inspections can be included in the input file of the specific object. The Unity Check of the structure gives a first idea of the influence of the damage. The introduction of the ModelCode 2010 with the safety formats for nonlinear analysis gave an opportunity to come to nonlinear guideline, where the analyst and the checking authority get ideas for a robust nonlinear analysis and a reliable unity check report of a concrete structure. To validate this nonlinear guideline a lot of experiments are simulated by a lot of partners and software codes. The human and software factor were at the start of this project very relevant but after publishing the final draft of the guideline it should be reduced. Organising an

52
international contest on the failure of one of the T-beams shows a very small scatter in ULS load. Numerical nonlinear finite element analysis is often used for predictions and postdictions of the behaviour of failure of structures. The checking methods are now described by the safety format procedures in the ModelCode 2010. Figure 6 gives a view of the model of the prestressed T-beams and transversal prestressed slab panels between the T-beams, experimented at the Delft University of Technology.
Fig. 6: Wheel print load on slab panels located between T-beams 4. EVALUATION OF THE HEAVY TRAFFIC PASSAGES Till now the material side had the focus at the previous chapters, but the variable traffic load side is also an important research subject. Today on twenty locations the traffic passages are measured. Axle loads and speed of axles are measured, where vehicles, speed of vehicles and intermediate distances between axles and vehicles are derived. This leads to a prediction of the axle and vehicle load of the remaining period of an existing structure. This can be illustrated by figure 7. The figure shows a maximum Eurocode vehicle design load of 1500kN during 100 years of lifetime with 2.5million passages each year. When the passages of vehicles is less the vehicle load will be decreased. Fig. 7: Prediction of the Eurocode vehicle design load REFERENCES 1. Fib ModelCode 2010, Final Draft Volume I and II, fib, Lausanne, 2012 2. Lantsoght, E.O.l., Shear in Reinforced Concrete Slabs under Concentrated Loads close to
Supports, PhD thesis, Delft University of Technology, June 2013 3. Yang, Y, Shear Behaviour of Reinforced Concrete Members without Shear
Reinforcement, PhD thesis, Delft University of Technology, April 2014 4. Amir, S, Compressive Membrane Action in Prestressed Concrete Deck Slabs, PhD thesis,
Delft University of Technology, June 2014 5. Hendriks, M.A.N and others, Guideline for Nonlinear Finite Element Analysis of Concrete
Structures, RTD1016:2012, Rijkswaterstaat

53
A Multi-level Structural Assessment Proposal for Reinforced Concrete Bridge Deck Slabs
Jiangpeng Shu, M.Sc., Ph.D. Student Chalmers University of Technology SE-412 96 Göteborg, Sweden [email protected]
Mario Plos, Ph.D., Associate Professor Chalmers University of Technology [email protected]
Kamyab Zandi, Ph.D., Researcher Chalmers University of Technology CBI Swedish Cement and Concrete Research Institute [email protected]
Karin Lundgren, Ph.D., Professor Chalmers University of Technology [email protected]
ABSTRACT This study proposes a multi-level assessment strategy for reinforced concrete bridge deck slabs. The proposed methods were used for the analysis of previously tested two-way slabs subjected to bending failure and a cantilever slab subjected to a shear type of failure, in both cases loaded with concentrated loads. The case studies show that the proposed assessment strategy and the analysis methods are feasible and give conservative estimates of the load-carrying capacity. Keywords: Multi-level assessment, Reinforced concrete slabs, nonlinear FEA 1. INTRODUCTION Bridge deck slabs are among the most exposed bridge parts and are often critical for the load-carrying capacity. Consequently, it is important to have appropriate methods for assessment of the load-carrying capacity and the response of bridge deck slabs. With such methods, higher load-carrying capacity can be detected in the assessment of existing bridge deck slabs. A step-level procedure for the structural assessment of existing bridges has been proposed with successively improved evaluation integrated with the decision process [1]. The aim of this paper is to propose an assessment strategy for the structural assessment of RC bridge deck slabs and to demonstrate and examine the proposal on two case studies.
2. A MULTI-LEVEL STRUCTURAL ASSESSMENT STRATEGY The multi-level assessment strategy proposed in this paper for RC bridge deck slabs is based on the principle of successively improved evaluation in structural assessment [1]. For RC slabs, different levels of assessment can be recognized in Figure 1. Assessments of load-carrying capacity with associated responses can be conducted through the following levels and methods: (I) simplified analysis, (II) 3D linear shell (FE) analysis, (III) 3D nonlinear shell (FE) analysis, (IV) 3D nonlinear FE analysis with continuum elements and fully bonded reinforcement and (V) 3D non-linear FE analysis with continuum elements including the slip between reinforcement and concrete. This method differs from MC2010 [2] in that MC2010 focuses on resistance models for different failure modes while this approach focuses on the structural analysis of the slab; furthermore, this approach connects the structural analysis on different levels with resistance models on different levels from EC2 [3] or MC2010 [2].

54
Figure 1. Scheme for multi-level assessment of reinforced concrete bridge deck slabs
3. CASE STUDIES The proposed methods were used for the analysis of previously tested two-way slabs subjected to bending failure [4] (see Figure 2) and a cantilever slab subjected to a shear type of failure [5] (see Figure 3). Details can be found in Shu [6].
Figure 2. Case 1: application to two-way slabs subjected to bending failure

55
Figure 3. Case 2: application to a cantilever slab test
4. RESULTS AND DISCUSSION Table 1 presents the failure modes of the slabs occurred in the structural analyses at different levels of assessment. Table 1. Failure mode at multi-level assessment of slabs
Levels Two-way slabs Cantilever slab Bending Shear (punching) Anchorage Bending Shear (punching) Anchorage
V IV III II I
: need to check with separate resistance model :reflected in the structural analysis
□:failure load determine load-carrying capacity
Figure 4 summarizes the load-carrying capacity from the analyses at the different assessment levels and from the experiments. It is obvious that generally the detectable load-carrying capacity increased for higher levels of assessment, but was always less than the experimental value. Similar results were also obtained by Belleti et al. [7]. However, this may not always be the case. For example, in case study 1, the load-carrying capacity obtained at level IV was higher than for level V.

56
Figure 4: Load-carrying capacity of two-way slabs (left) and a cantilever slab (right) at
different levels
5. CONCLUSIONS The case studies show that the proposed assessment strategy and analysis methods are valid and give conservative estimates of the design capacity. Furthermore, the results show that, generally, more advanced methods are capable of demonstrating a load-carrying capacity closer to the reality. However, when choosing if to proceed with assessment on more enhanced levels, it is necessary to consider the increased cost in terms of more working hours and computation time in relation to what might be gained by analysis on the higher level. The benefit of doing more advanced structural analysis must also be weighed against other methods to improve the assessment. When enhanced analysis is judged to be a favourable, the proposed multi-level assessment strategy can provide a structured approach to successively improved assessment.
ACKNOWLEDGEMENT The authors would like to gratefully acknowledge the support and funding from Swedish Transport Administration (Trafikverket), which made the research possible.
REFERENCES [1]. Sustainable Bridges, “Guideline for Load and Resistance Assessment of Existing
European Railway Bridges: Advices on the use of advanced methods.,” 2007. [2]. CEB-FIP, fib Model Code for Concrete Structures 2010. Lausanne, Switzerland, 2013. [3]. EN 1992-1-1, Eurocode 2: Design of concrete structures - part 1-1: General rules and rules
for buildings. Brussels, Belgium: CEN European Committee for Standardization, 2004. [4]. D. Fall, J. Shu, R. Rempling, K. Lundgren, and K. Zandi, “Two-way slabs: Experimental
investigation of load redistributions in steel fibre reinforced concrete,” Eng. Struct., vol. 80, pp. 61–74, Dec. 2014.
[5]. R. Vaz Rodrigues, M. Fernández Ruiz, and A. Muttoni, “Shear strength of R/C bridge cantilever slabs,” Eng. Struct., vol. 30, no. 11, pp. 3024–3033, Nov. 2008.
[6]. J. Shu, “Structural Analysis of Existing RC Bridge Deck Slabs,” Chalmers University of Technology, Göteborg, Sweden, 2015.
[7]. B. Belletti, C. Damoni, M. Hendriks, and A. de Boer, “Analytical and numerical evaluation of the design shear resistance of reinforced concrete slabs,” Struct. Conrete, 2014.

57
Punching Capacity of a Reinforced Concrete Bridge Deck Slab Loaded to Failure
Niklas Bagge Ph.D. student Luleå University of Technology 971 87 Luleå, Sweden [email protected]
Jiangpeng Shu Ph.D. student Chalmers University of Technology 412 96 Göteborg, Sweden [email protected]
Mario Plos Associate Professor Chalmers University of Technology 412 96 Göteborg, Sweden [email protected]
Lennart Elfgren Emeritus Professor Luleå University of Technology 971 87 Luleå, Sweden [email protected]
ABSTRACT Full-scale failure tests of a 55 year old prestressed concrete girder bridge have been carried out to calibrate models for assessment of existing bridges. This paper summarise the outcome from the punching test and analytical analysis according to the model stated in the Eurocode. The experimental load was approximately 2.4 times the code value using measured material properties. Key words: Assessment, Bridge Deck Slab, Full-Scale Testing, Measurements, Punching, Reinforced Concrete 1. INTRODUCTION In models for assessment of existing structures the real behaviour should be reflected in order to achieve a reliable estimation of the residual capacity. Accordingly, understanding the behaviour is crucial to accomplish an optimised bridge stock management. Due to assessment models, mainly developed based on laboratory studies of elements with simplified conditions, it is necessary to perform supplementary large- or full-scale experiments to calibrate and if necessary improve the models. The aim of the project, partly presented in this paper, is to acquire relevant data from a full-scale bridge test for such calibration. A particular focus is on existing punching resistance models for bridge deck slabs (Sundquist, 2005, CEN, 2005). 2. EXPERIMENTAL INVESTIGATION The Kiruna Bridge, Sweden, constructed in 1959 has been subjected to an experimental investigation in 2014, including failure loading of both the main girders and the deck slab (Bagge et al., 2014). The road bridge was a 55 year old prestressed concrete girder bridge continuous in five spans with the total length of 121.5 m (tested span 20.5 m). The superstructure consisted of three longitudinal girders connected by the deck slab and cross beams (Figure 1). In the location of the punching test the slab was reinforced by steel bars

58
(diameter 16 and 10 mm) with the average yield strength of 584 MPa (CoV = 0.022) and 667 MPa (CoV = 0.050) in transverse and longitudinal direction, respectively. The average value of the tested in-situ concrete compressive strength was 62.2 MPa (CoV = 0.16).
N
1 hydraulic jack with wires anchored in bedrock
Load distribution beam 600 700 700 600 35
0
Brid
ge tr
ans-
vers
e di
rect
ion
dire
ctio
n
Figure 1: Arrangement for loading the bridge deck slab. The bridge deck slab was loaded to failure with the setup in Figure 1. A force controlled hydraulic jack located in the midspan was used to apply load, through a load distribution beams and two steel plates, to the upper surface of the concrete slab. The load plates were 350x600 mm2 spaced 2.0 m apart and located 470 and 330 mm in relation to the inner side of the northern main girder (880 mm to the outer side). Thus, the test setup corresponded to load model 2 in the Eurocode 1 (CEN, 2003). The girders and the slab were monitored during the test. Applied force was derived from the oil pressure in the hydraulic jack. Draw-wire sensors were instrumented in the midspan of the northern (D1) and central (D2) girder in order to measure deflections. Moreover, deflections of the slab were measured underneath each loading plate (D3 and D4) and at the corresponding position of the northern girder (D5 and D6), i.e. 1.0 m to the midspan. At 500 and 1000 mm south of the centre line through the loading points the curvature was measured along the longitudinal bridge direction. Each curvature rig was composed by simply supported steel beams (length 4.82 and 5.08 mm) and five linear displacement sensors with 800 mm spacing. The midpoints of the curvature rigs coincided with the midspan. The instrumentation is described more in detail in (Bagge et al., 2014). 3. ANALYTICAL ANALYSIS The load-carrying capacity of the bridge deck slab was analysed for the actual test setup, using the punching resistance design model stated in the Eurocode 2 (CEN, 2005). The capacity according to the model is represented by the shear force resistance for a specified control perimeter, proposed to be taken as the shortest length 2 times the cross-section effective depth (2d) from the loaded area. Permitted shear stress, vRd,c, is calculated according to the empirical expression given by Equation (1) The load-carrying capacity was calculated for two cases: (a) design punching resistance considering the concrete partial safety factor and the in-situ concrete characteristic strength and (b) punching resistance excluding partial safety factors and replacing the characteristic in-situ concrete strength by the corresponding average value.
min3
,, ,100max cklcRdcRd fkCv (1)

59
where CRd,c = 0.18/γC is a constant from experimental calibration including specified partial safety factor, γC = 1.5 is a concrete partial safety factor, k = 1.95 is a factor to account for size effects, ρl = 0.19 % is the reinforcement ratio, fck = 47.0 MPa is the characteristic value of concrete compressive strength and νmin = 0.65 MPa for case (a) and νmin = 0.75 MPa for case (b) is the minimum shear strength. The analytical punching resistance for one loading plate was for case (a) 680 kN and for case (b) 840 kN, with the control perimeter of 4.69 m. 4. RESULTS AND DISCUSSION The bridge deck slab was loaded with an approximate loading rate of 80 kN/min. A sudden punching failure, without prior notice, occurred at the total applied load of 3.32 MN (1.66 MN for each loading plate). Figure 2 shows a photograph after the test, illustrating the failure under the western loading plate. In Figure 2 also the load-deflection behaviour monitored by the draw-wire sensors is given. An abrupt drop of the load at failure resulted in decreased deflection for all sensors except for D3 underneath the western loading plate where failure occurred. At the punching test the girders were pre-cracked due to the previous loading. Nevertheless, the first part of the test (up to approximately 500 kN) indicated small deflections of the bridge, after which they considerably increased. This is due to the prestressing system in the girders. In the test, the differences in deflections between the slab and the northern girder are relatively small (maximum 6.3 mm). Also the central girder deflected significantly. Just before failure the midspan deflection of the central and northern girder was 12.6 and 29.4 mm, respectively. Thus, the longitudinal girders should be regarded as flexible supports to the deck slab. At the load level of 2.6 MN a new grip was required in order to accommodate deflections and loading cable extension exceeding the stroke length of the jack. Due to increased deformation of the structure at constant load this measure caused in a small shift in the load-deformation curve.
0
0,5
1
1,5
2
2,5
3
3,5
0 5 10 15 20 25 30 35 40 45
Load
[MN
]
Deflection [mm]
D1 D2 D3 D4 D5 D6
Location of loading plates N
Figure 2. Measured load-deformation curves and photograph of punching failure (2014-07-01).

60
The test demonstrated a load-carrying capacity which was about 2.0 and 2.4 times the outcome from the analytical analysis, based on the punching resistance from average and design values, respectively. It indicates that the code model not fully represents the behaviour of the tested slab. For instance, the influence of flexible supports and membrane action is disregarded in the model. 5. CONCLUDING REMARKS A full-scale punching test to failure has been carried out of a reinforced concrete bridge in order to acquire relevant data for calibration and development of assessment models. The experimental evaluation resulted in a punching capacity approximately 2.4 times the design resistance according to the Eurocode 2. Thus, the test indicated a load-carrying capacity upgrading possibility if using refined models. In the future research a further comparison between the experimental outcome and punching models is proposed. Moreover, refined evaluation is recommended in accordance to the multi-level assessment approach (Shu, 2015) in which 3D linear and nonlinear finite element analyses are proposed. ACKNOWLEDGEMENT The authors gratefully acknowledge financial support from Trafikverket/BBT, LKAB/HLRC, SBUF and Luleå University of Technology (LTU). They also thank their colleagues in the Swedish Universities of the Built Environment (Chalmers, KTH, LTH and LTU) for fruitful cooperation. REFERENCES Bagge, N., Nilimaa, J., Blanksvärd, T., Elfgren, N., “Instrumentation and full-scale test of a
post-tensioned concrete bridge,” Nordic Concrete Research, Vol. 5, December 2014, pp. 63-83.
CEN, “Eurocode 1: Actions on structures – Part 2: Traffic loads on bridges,” SS-EN 1991-2:2003, Brussels, Belgium, 2003, 164 pp.
CEN, “Eurocode 2: Design of concrete structures – Part 1:1: General rules and rules for buildings,” SS-EN 1992-1-1:2005, Brussels, Belgium, 2005, 225 pp.
Shu, J. “Structural Analysis of Existing RC Bridge Deck Slabs,” Chalmers University of Technology, Göteborg, Sweden, 2015.
Sundquist, H. “Punching Research at the Royal Institute of Technology (KTH) in Stockholm,“ American Concrete Institute, Special Publication 232, January 2005, pp. 229-255.

61
Severe ASR damaged concrete bridges Full-scale shear tests and material properties
Ricardo Antonio Barbosa M.Sc, Ph.D. student. Technical University of Denmark Brovej 118 DK-2800 Kgs. Lyngby E-mail: [email protected] Søren Gustenhoff Hansen M.Sc, Ph.D. student University of Southern Denmark Niels Bohrs allé 1 DK-5230 Odense M E-Mail: [email protected]
ABSTRACT Technical University of Denmark (DTU) and University of Southern Denmark (SDU) have conducted several full-scale experiments with severe ASR deteriorated bridges. This paper presents few and preliminary results from both the shear tests and the measuring of the material properties. The shear tests show that the shear capacity is almost unaffected of ASR despite significant reduction in compressive concrete strength. Furthermore, measurements show a significant tensile reinforcement strain developed due to ASR expansion. Key words: Full-scale shear test, ASR, crack orientation, material properties, tensile reinforcement strain 1. INTRODUCTION In Denmark, more than 600 bridges have the potential to develop ASR deterioration and some structures have already been demolished due to the uncertainty about the residual shear capacities. Therefore, Technical University of Denmark (DTU) and University of Southern Denmark (SDU) conducted 3 full-scale experiments with bridges suffering from ASR deterioration. The experiments were financial supported by the Danish Road Directorate [1]. This paper presents few and preliminary results from one of the tested bridges. 1.1 The bridge, slabs and beams The bridge is 312 m long and 10 m wide. The bridge deck is 300 mm thick, non-shear reinforced and pile supported. The bridge suffers from severe ASR deterioration and is known as one of the most ASR deteriorated structures in Denmark. To test the shear capacity and measure the material properties in laboratory, 6 trapezoidal slabs were cut from the bridge deck

62
and transported to DTU laboratory facilities. Each slab was cut into 7 beams – 3 large beams for testing the shear capacity and 4 small beams for measuring the material properties and the tensile reinforcement strain level developed due to the ASR expansion. 2. COMPRESSIVE CONCRETE STRENGTH AND VISUAL CONDITION All beams contained cracks orientated parallel to the surface of the deck. D99/H200 mm concrete cores were drilled out both horizontally and vertically, thus having cores with ASR cracks parallel and perpendicular to the drilling direction. The compressive strength tests were load controlled with a loading rate of 4.7 kN/s according to [2]. The measured compressive concrete strengths were converted to a concrete strength corresponding to D150/H300 mm concrete cylinders strength according to [3]. The converted compressive strengths are presented graphically as a “box and whisker” plot. Figure 1 (left) shows the compressive strength for the vertically drilled concrete cores and Figure 1 (right) shows the compressive strength for the horizontally drilled cores. Figure 1 shows clearly the influence of crack orientation on the compressive concrete strength. Vertically drilled cores have a significant lower compressive strength than horizontally drilled cores.
Figure 1: Compressive concrete strength for slab no. 1 and 2. Left: Compressive strength of vertically drilled concrete cores. Right: Compressive strength of horizontally drilled concrete cores. The compressive concrete strength corresponded to the visual condition of the slabs; slab no. 1 was more severely damaged by ASR than slab no. 2. The visual inspection showed that slab no. 2 contained fewer and finer ASR cracks than slab no. 1. 3. ASR EXPANSION AND TENSILE STRAIN In order to verify whether the ASR expansion have induced a tensile strain in the reinforcement, measurements were performed on the longitudinal reinforcement after cutting the slabs into beams. The tensile strain is measured by mounting strain gauges locally to the reinforcement and thereafter cutting the reinforcement. Surprisingly, the tensile strain measured were almost the same for both slabs, approximately 1.0 ‰. Apparently, these results indicate that no significant link between the ASR damage degree and the development of the tensile strain exists. The results also indicate that the tensile strain develops simultaneous with the formation of the first ASR cracks. Knowledge concerning the relationship between ASR deterioration degree and the corresponding tensile strain in the reinforcement is essential in order to predict

63
the development of the residual shear capacity of ASR deteriorated bridges. University of Southern Denmark and Technical University of Denmark will start a project regarding the relationship between the ASR deterioration degree and corresponding tensile strain in the reinforcement in fall 2015.
4. SHEAR TESTS AND EUROCODE 2 COMPARISON The shear tests are conducted with two types of experimental setups – an asymmetric 4 point bending and a symmetric 3 point bending. The tests are conducted with different shear spans. During the tests a Digital Image Correlation System (ARAMIS) was used to record the surface behaviour of the beams. ARAMIS provides important information about deformation and failure mode of the beams. This information is unique in the post analysis of the beams. Figure 2 and Figure 3 show the major strain plot from ARAMIS at failure. Figure 2 and Figure 3 show a clear difference between the failure modes for the two experimental setups; the 4 point bending setup has a characteristic diagonal shear crack where the plot for the 3 point bending setup additionally shows several coarse bending cracks.
Figure 2: Asymmetric 4 point bending and ARAMIS plot for a severe ASR damaged beam.
Figure 3: Symmetric 3 point bending and ARAMIS plot for a severe ASR damaged beam. The tested shear capacity results are compared to the shear model in Eurocode 2. The calculated shear capacities are based on the measured compressive concrete strength and the measured tensile reinforcement strain. Figure 4 shows the tested shear results compared with Eurocode 2 calculations. “Horizontal” and “vertical” refers to the drilling direction of the concrete cores and the corresponding average compressive concrete strength. “Optical” refers to the original undamaged concrete compressive strength without cracks determined by optical strength estimation. “σmin” and “σmax” refers to the pre-stress effect from tensile strain in the reinforcement based on the lowest and highest measured tensile strain and Young’s modulus, respectively. Figure 4 shows that the majority of the tested shear capacities are greater than the calculated shear capacities. However the test results have a large deviation. Some part of this
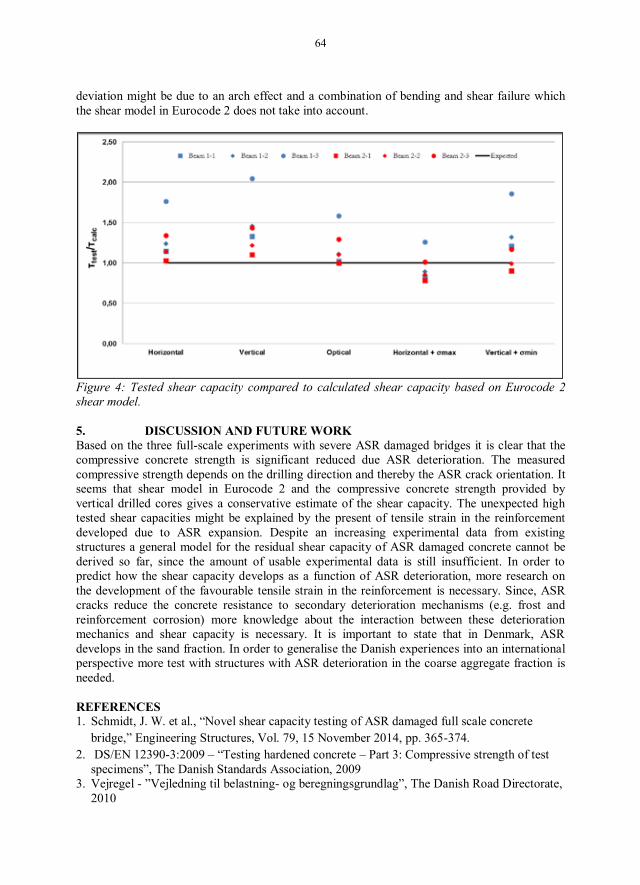
64
deviation might be due to an arch effect and a combination of bending and shear failure which the shear model in Eurocode 2 does not take into account.
Figure 4: Tested shear capacity compared to calculated shear capacity based on Eurocode 2 shear model. 5. DISCUSSION AND FUTURE WORK Based on the three full-scale experiments with severe ASR damaged bridges it is clear that the compressive concrete strength is significant reduced due ASR deterioration. The measured compressive strength depends on the drilling direction and thereby the ASR crack orientation. It seems that shear model in Eurocode 2 and the compressive concrete strength provided by vertical drilled cores gives a conservative estimate of the shear capacity. The unexpected high tested shear capacities might be explained by the present of tensile strain in the reinforcement developed due to ASR expansion. Despite an increasing experimental data from existing structures a general model for the residual shear capacity of ASR damaged concrete cannot be derived so far, since the amount of usable experimental data is still insufficient. In order to predict how the shear capacity develops as a function of ASR deterioration, more research on the development of the favourable tensile strain in the reinforcement is necessary. Since, ASR cracks reduce the concrete resistance to secondary deterioration mechanisms (e.g. frost and reinforcement corrosion) more knowledge about the interaction between these deterioration mechanics and shear capacity is necessary. It is important to state that in Denmark, ASR develops in the sand fraction. In order to generalise the Danish experiences into an international perspective more test with structures with ASR deterioration in the coarse aggregate fraction is needed. REFERENCES 1. Schmidt, J. W. et al., “Novel shear capacity testing of ASR damaged full scale concrete
bridge,” Engineering Structures, Vol. 79, 15 November 2014, pp. 365-374. 2. DS/EN 12390-3:2009 – “Testing hardened concrete – Part 3: Compressive strength of test
specimens”, The Danish Standards Association, 2009 3. Vejregel - ”Vejledning til belastning- og beregningsgrundlag”, The Danish Road Directorate,
2010

65
Measuring and modelling the deteriorating impact of Alkali-Silica Reaction in concrete on the mechanical characteristics
Rita Esposito Ph.D. student Delft University of Technology [email protected]
Max A.N. Hendriks Professor Norwegian University of Science and Technology & Delft university of technology [email protected]
ABSTRACT Unaffected and ASR-affected concrete, experimentally, appear as substantially different materials. Since the material characterization is one of the main points of attention within a structural assessment, the deteriorating impact of ASR on concrete in terms of both expansion and degradation of the mechanical properties is studied. Both experimental and modelling approaches are followed. Key words: Alkali-silica reaction, mechanical characteristics, micro-mechanical modelling 1. INTRODUCTION The assessment of concrete structures affected by alkali-silica reaction (ASR) is a complex problem due to the multiscale nature of this long-term phenomenon, Figure 1. The reaction starts within the concrete constituents with the formation of an expansive alkali-silicate gel at reaction products level. Being the expansive gel confined within the concrete micro-structure, an internal pressure is built up that induces damage at aggregate level. This micro-cracking affects the mechanical characteristics of the material at concrete level. At structural level, the performance of members and of structures itself can thus be compromised by the reaction. For any structural assessment of affected structures, the material characterization is a key item. An overview of the PhD work of the first author is given (Esposito, 2016). The emphasis is on the deteriorating impact of ASR on concrete in terms of both expansion and degradation of the mechanical properties, Figure 2. Both experimental and modelling approaches are followed. The perspective is structural assessments. 2. EXPERIMENTAL INVESTIGATIONS The experimental investigation, which includes laboratory tests supplemented with literature data, shows a statistically relevant relationship between the concrete expansion and the degradation of mechanical properties of ASR-affected concrete samples stored in free-expansion conditions. Figure 3 gives an overview of these results (Esposito, Anaç et al., 2016). In the left panel, the relation between normalised mechanical properties and concrete expansion is given. The elastic modulus was found to be the best indicator of ASR signs in concrete. The data show a relevant degradation, already at early expansion, which is characterized by the highest rate. In

66
Figure 1: The alkali-silica reaction in concrete structures: interaction of the various phenomena at the different scales (Esposito, 2016).
Figure 2: Scope of the present research (Esposito, 2016).
Figure 3: Summary of experimental results. Relation between normalised mechanical properties and concrete expansion and relation between normalised elastic modulus and normalised strengths (Esposito, Anaç et al., 2016).

67
the right panel of the Figure, the relation between normalised elastic modulus and normalised strengths is presented. In engineering, it is common practice to express the stiffness and tensile strength of unaffected concrete as a function of its compressive strength. This results makes clear that these relations definitely do not apply to ASR affected concrete. 3. MODELING APPROACHES Considering that unaffected and affected concrete experimentally appear as substantially different materials at concrete level, a multiscale modelling approach, ranging between aggregate and concrete level, is adopted to explore the deteriorating impact induced by ASR. An analytically solved micro-poro-fracture-mechanical model, which is based on a limited number of input parameters, is adopted. The approach considers the micro-cracking phenomenon as the common damage mechanism associated to the internal swelling and the external mechanical loading. Figure 4 shows typical results of this model. It is emphasized that this model generates softening curves of concrete in tension or hardening-softening curves in compression, whereas most nonlinear structural engineering software will use this as a point of departure. The purpose of the developed micro-poro-fracture-mechanical model is that it could also be used for more complicated stress situations, e.g. with confinement stresses, and that the effect of the swelling of the ASR-gel could be included and studied.
Figure 4: Simulation results of the micro-poro-fracture-mechanical model: resulting uniaxial tension softening and compression hardening-softening behaviour (Esposito and Hendriks, 2015). 4. CONCLUDING REMARKS Combined experimental and material modelling activities are seen essential to understand the mechanical behaviour of ASR-affected concrete. More systematic laboratory investigations focussed on the correlation between, microscopic damage, concrete expansion and degradation of mechanical properties for concrete under various stress states are recommended. Also the step from understanding the material behaviour towards understanding the structural behaviour requires both experiments and modelling components. Full-scale in-situ experiments on ASR-affected structures can be considered to develop an assessment strategy. The model can be implemented in a finite element framework. Redistribution effects, e.g. within a cross section of a structural element could then be evaluated.

68
ACKNOWLEDGEMENT The research described in the thesis was developed within the STW project “Performance Assessment Tool for Alkali-Silica Reaction” (PAT-ASR) (code No. 10977), which is part of the STW program “Integral Solutions for Sustainable Construction” (IS2C). The authors thank the Dutch Ministry of Infrastructure and the Environment for financially supporting IS2C. The cooperation with the Norwegian Public Road Administration (NPRA), for providing us with a case study of the Nautesund bridge, was highly appreciated. REFERENCES Esposito, R, “The Deteriorating Impact of Alkali-Silica Reaction on Concrete: Expansion and
Mechanical Properties” PhD thesis TU Delft, repository.tudelft.nl, January 2016, 208 pages.
Esposito, R., Anaç, C., Hendriks, M.A.N., Çopuroglu, O, “The Influence of Alkali-Silica Reaction on the Mechanical Degradation of Concrete”, Accepted for publication in ASCE Journal of Materials (2016).
Esposito, R., Hendriks, M.A.N., “Simulating the Deteriorating Effect of the Alkali-Silica Reaction in Concrete via a Micro-Poro Fracture Mechanical Model”, Proceeding of the International Conference on Mechanics and Physics of Creep, Shrinkage, and Durability of Concrete and Concrete Structures (CONCREEP 10), Vienna, Austria. Proceedings, 118-127 (2015).

69
Residual bearing capacity of the frost-damaged reinforced concrete beams
Manouchehr Hassanzadeh Ph.D. Adj. Professor Vattenfall AB SE-169 92 Stockholm, SWEDEN E-mail: [email protected] .
ABSTRACT Failure of a singly reinforced concrete beam caused by bending moment may be initiated by tension failure in reinforcement steel (ductile failure) by compression failure in concrete (brittle failure) or by both conditions occurring simultaneously. The frost-damage may change the failure mode from the ductile mode to the brittle. Key words: Frost-damage, reinforced concrete beams, brittle failure, bearing capacity 1. INTRODUCTION Failure of a singly reinforced concrete beam caused by bending moment may be initiated by tension failure in reinforcement steel, by compression failure in concrete, or by both conditions occurring simultaneously. The first failure mode occurs when the beam section is under-reinforced, the second mode occurs when the beam section is over-reinforced, and the third mode occurs when the beam is balanced. The final destruction of the beam in bending occurs with the rupture and crushing of the concrete at the compressed side of beam. Shear failure is another possible failure mode if the beam is not provided with shear reinforcement (stirrups). Balanced and over-reinforced beams are not economical and show brittle failure behaviour. Therefore, beams used in practice are under-reinforced. In order to ensure a sufficient level of ductility the amount of reinforcement is normally restricted. In practice the ratio of reinforcement () is kept lower than 75 % of the reinforcement ratio of the balanced section (b) [1] and [2] although, 40 to 50 % of b is a very common range [2]. The ratio of reinforcement is calculated by equation (1). The balanced ratio of reinforcement is also calculated by Equation (1) if by equating (mechanical reinforcement content) to b, which is calculated by Equation (2).
st
ccs
ff
dbA (1)
7351
8.0b
ykf
(2)
As is the area of steel, b is the width of the cross section of the beam and d is the effective depth of the cross section, i.e. the distance from the extreme compression fibre to the centroid of the steel area. fcc is the design compressive strength of concrete. fst and fyk are the design yield

70
strength and characteristic yield strength of the reinforcement respectively. fyk for the reinforcement used in this investigation was 590 MPa which corresponds to b = 0.44. The design compressive strength of the concrete was assumed to be 30 MPa which corresponds to b = 0.022 assuming that fst = fyk. The condition for ductile failure is as above < b. Compressive strength of concrete decreases due to the frost attack, which according to the Equation 1 leads to increased . Consequently a beam designed to behave ductile during failure may show brittle behaviour due to the frost attack. One aim of the investigation was to study this possible effect. Hence, several beams with varying were manufactured, frost-damaged and tested in bending, [3]. 2. SPECIMENS The types of beams studied are presented in Table 1. The table also shows the moisture conditioning of the beams. Numbers 1 – 6 in the first column indicate the type of beam with regard to the size and the reinforcement content. The lower case “s” indicates that the beam contains stirrups to prevent shear failure. l [m] is the distance between the supports when the beams were subjected to the bending test. The beam length is l + 0.2 [m]. h [m] and d [m] are the beam depth and effective beam depth respectively. The number and the diameter of the longitudinal reinforcement bars in each beam are given in the fifth column of the table. As it can be observed the diameter of all bars was 20 mm. The number and the diameter of the stirrups are given in the sixth column. The diameter of all stirrups was 8 mm. The 8 stirrups in beam types 5 and 6 were placed at the supports (4 stirrups at each support) to prevent the cracking of the beams due to the concentrated load at the supports. Figure 1a and 1b show the beam types 1s, 3s and 5. As it is shown in the figures the beams were subjected to a four-point-bending test. The distance between the supports was 4.4 m and the distance between the loads, in all tests, was 1 m. The stirrups of the type 1s and 3s beams were evenly distributed within the shear span, while the stirrups of the type 5 beam were concentrated at the supports. The cross section of the beam types 1s and 5 is shown in Figure 1c. The beam type 3s had similar cross section. However, the amount of reinforcement is different. Beam types 2s, 4s and 6 are principally similar to the beam types 1s, 3s and 5. The differences between the beam types are their size and reinforcement content. As it is shown in Table 1 six types of beams, with a total number of 14, were manufactured. Conditions L, S and V refer to the climatic treatment of the beams. Condition L refers to laboratory climate, condition S refers to submerging in water and condition V refers to vacuum treatment followed by submerging in water.

71
Table 1 – Type of beams and conditioning Climatic conditions
& Number of beams
Type l m
h m
d m
Reinfor cement
Stirrups %
b %
L S V
1s 4.4 0.5 0.43 420 288 1.5 64 1 L1s
0 1 V1s
2s 3.0 0.3 0.26 320 188 1.9 80 1 L2s
0 1 V2s
3s 4.4 0.5 0.43 620 328 2.2 95 1 L3s
1 S3s
1 V3s
4s 3.0 0.3 0.23 520 228 3.4 114 1 L4s
1 S4s
1 V4s
5 4.4 0.5 0.43 420 88 1.5 64 1 L5
0
1 V5
6 3.0 0.3 0.26 320 88 1.9 80 1 L6
0 1 V6
Total number of beams = 14 6 2 6
Figure 1 – Example of beam types and reinforcement arrangement.
Besides the beams cubes, cylinders and small beams were manufactured to determine the strength and the fracture energy of the concrete. The concrete contained 325 kg/m3 cement, 185 kg/m3 water, 1907 kg/m3 aggregate and no air-entrainment agent. The mean 28 days cylinder compressive strength and splitting tensile strength was 37.6 MPa and 4.1 MPa respectively, which decreased to 17.5 MPa and 1.0 MPa due to frost-damage. 3. FREEZE TESTS The V1s – V6 beams were dried before vacuum treatment. The vacuuming was performed in a closed steel cylinder (length 5 m, internal diameter 0.75 m and external diameter 0.76 m). Each beam was vacuum treated during one week and subsequently it was soaked, two weeks, in water by filling the cylinder with water without allowing any air to enter the cylinder. After completed vacuum treatment the beams were wrapped up in thick plastic foil and moved into the freeze room. The temperature in the freeze room was kept between -20 °C and -22 °C. The beams were kept at least three days in the freeze room. The beams were thawed in water outside the freeze rum in a basin. The corresponding strength measurement specimens were treated accordingly.

72
All beams showed signs of frost damage, cracks, already after the first freeze-thaw cycle. The beams S3s and S4s were submerged in water immediately after removal of the forms and kept in water more than 6 month before the freeze tests. 4. RESULTS Figure 2 shows the load – deflection curves of the L1s, V1s, L3s, S3s and V3s beams. The L3s, S3s and V3s beams had the same reinforcement content. They were almost balance reinforced, which can be noticed from the load – deflection curve of the L3s beam. S3s and V3s were frost damaged. The reduction of load capacity is 33 % in the case of V3s and 12 % in the case of S3s. The deflection capacity is not affected by frost-damage. The L1s and V1s were under-balanced reinforced. The L1s beam failed due to reinforcement yielding, while the V1s beam failed due to compressive failure of concrete. The reduction of the load capacity was 19 %. Although the V1s beam contains less reinforcement than the V3s beam it has almost the same load capacity as V3s. This indicates the decisive control that compressive failure behaviour of concrete has on the failure of the frost damaged beams.
Figure 2 – Load – deflection curves of beams with shear reinforcement and the height = 0.5 m. REFERENCES 1. Park, R., Paulay, R., “Reinforced Concrete Structures”, John Wiley & Sons, Canada,
1975. 2. Ferguson, P.M., Breen, J.E., Jirsa, J.O., “Reinforced Concrete Fundamentals”, 5th ed.,
John Wiley & Sons, 1988, Canada. 3. Hassanzadeh, M., Fagerlund, G., “Residual strength of the frost-damaged reinforced
concrete beams”, Proceedings of the III European Conference on Computational Mechanics Solids, Structures and Coupled Problems in Engineering C.A., 5–8 June 2006, Lisbon, Portugal, Mota Soares et.al. (eds.).

73
Research Council and Editorial Board for Nordic Concrete Research
Dr. Dirch H. Bager, Chairman of the Research Council & Editor of Nordic Concrete Research
Danish Concrete Association
Dr. Dirch H. Bager Lavendelparken 5 DK - 9310 Vodskov Tel: +45 9829 2412 Mobile: +45 2049 7324 E-mail: [email protected]
Mrs. Gitte Normann Munch-Petersen Teknologisk Institut Kongsvang Allé 29 DK - 8000 Aarhus Mobil +45 72 20 32 45 E-mail: [email protected]
Finnish Concrete Association
Dr. Tarja Merikallio Concrete Association of Finland Unioninkatu 14 PL 381 FI - 00131 Helsinki Mobile: +358 50 4348335 E-mail: [email protected]
Icelandic Concrete Association
Dr. Jón E. Wallevik Innovation Center Iceland IS - 112 Keldnaholti Tel: +354 522 9362 Mobile: +354 Fax: +354 522 9111 E-mail: [email protected]
Prof. Dr. Olafur H. Wallevik Innovation Center Iceland IS - 112 Keldnaholti Tel: +354 522 9000 Mobile: +354 E-mail: [email protected]
Norwegian Concrete Association
Dr. Terje F. Rønning Heidelberg Cement NE / Cement Product development & Implementation P.O.Box 38 N - 3991 Brevik Tel.: +47 3557 2347 Mobile: +47 9157 6046 E-mail: [email protected]
Prof. Dr. Mette R. Geiker Division of Concrete Structures Department of Civil Engineering N - 7034 Trondheim Tel: +47 7359 4529 Mobile: +47 E-mail: [email protected]
Swedish Concrete Association
Adjunct. Prof.,Tekn.Dr, Mikael Hallgren Tyréns AB Peter Myndes Backe 16 SE - 118 86 Stockholm Tel: +46 104 522 351 Mobile: +46 70 661 05 33 E-mail: [email protected]
Tekn. Dr. Peter Utgenannt CBI Swedish Cement and Concrete Research Institute P.O. Box 857 SE - 501 15 Borås Tel: +46 105 166 870 Mobile:+46 706 452 008 E-mail: [email protected]
2015-08-11

74

75
Active reviewers for Nordic Concrete Research as per December 2015 D
ENM
AR
K Dr. Dirch H. Bager
Dr. Mette Glavind Prof., Dr. Per Goltermann Mr. Oscar Klinghoffer Ms. Gitte Normann Munch-Petersen Prof., Dr. John Forbes Olesen Mr Claus Pade Prof., Dr. Eigil V. Sørensen Prof., Dr. Jens Peder Ulfkjær
FIN
LAN
D Mr. Fahim Al-Neshawy
Dr. Klaus Juvas Lic. Tech. Jukka Lahdensivu Dr. Matti V. Leskala Prof., Dr. Jussi Mattila Dr. Tarja Merikallio Dr. Jouni Punkki Dr. Jari Puttonen Dr. Esko Sistonen Mr. Juha Valjus
ICEL
AN
D Mr. Einar Einarsson
Mr. Haukur J. Eiriksson Dr. Gisli Gudmundsson Mr. Karsten Iversen Mr. Torfi G. Sigurdsson Mr. Sveinbjörn Sveinbjörnsson Dr. Jon E. Wallevik Prof., Dr. Òlafur H. Wallevik Prof., Dr. Børge J. Wigum
NO
RW
AY
Dr. Helge Brå Ms. Danielle Bosnjak Prof. Dr. Mette Rica Geiker Mr. Anton Gjørven Mr. Steinar Helland Dr. Bernt Jacobsen Prof., Dr. Terje Kanstad Dr. Terje F. Rønning Mr. Tor Kristian Sandaker Mr. Sverre Smeplass Mr. Hans Stemland
SWED
EN Prof., Dr. Anders Ansell
Dr. Thomas Blanksvärd Prof. Lennart Elfgren Prof., Dr. Mats Emborg Prof., Dr. Kent Gylltoft Prof., Dr. Mikael Hallgren Prof., Dr. Jan-Erik Jonasson Prof., Dr. Björn Lagerblad Prof., Dr. Karin Lundgren Prof., Dr. Tang Luping Prof., Dr. Per-Erik Petersson Prof., Dr. Johan Silfwerbrand Dr. Peter Utgenannt

76

77
N
CF
Wor
ksho
ps 1
975 –
2015
W
edne
sday
, 01
July
201
5
No.
D
ate
Plac
e an
d co
nven
or
Them
e D
ocum
enta
tion
77
21/4
20
15
Oslo
(M
ax H
endr
ix &
M
ikae
l Hal
lgre
n
Res
idua
l cap
acity
of d
eter
iora
ted
conc
rete
stru
ctur
es
Exte
nded
abs
tract
s in
NC
R, D
ecem
ber 2
015
76
21-2
2/11
20
13
Rig
a (B
ørge
J. W
igum
) A
lkal
i rea
ctio
ns in
con
cret
e W
orks
hop
Proc
eedi
ng N
o. 1
1,
Nor
dic
Con
cret
e Fe
dera
tion
2014
75
15-1
6/2
2012
Oslo
(B
ård
Pede
rsen
, C
laus
K. L
arse
n &
D
irch
H. B
ager
)
Dur
abili
ty a
spec
ts o
f fly
ash
and
sla
g in
co
ncre
te
Wor
ksho
p Pr
ocee
ding
No.
10,
N
ordi
c C
oncr
ete
Fede
ratio
n 20
12
74
13/1
0
2011
Cha
lmer
s / G
othe
nbur
g (K
arin
Lun
dgre
n &
M
ikae
l Hal
lgre
n)
Fini
te E
lem
ent A
naly
sis o
f Con
cret
e St
ruct
ures
Su
mm
ary
pape
r in
NC
R, D
ecem
ber 2
012
73
2-5/
3 20
10
Ved
bæk
(Dirc
h H
. Bag
er)
Free
ze-th
aw T
estin
g of
Con
cret
e -
Inpu
t to
revi
sion
of C
EN te
st m
etho
ds
Wor
ksho
p Pr
ocee
ding
No.
9,
Nor
dic
Con
cret
e Fe
dera
tion
2010
72
12-1
4/11
20
08
Hirt
shal
s (E
igil
V. S
øren
sen)
N
ordi
c Ex
posu
re S
ites -
Inpu
t to
revi
sion
of E
N 2
06-1
W
orks
hop
Proc
eedi
ng N
o.8,
N
ordi
c C
oncr
ete
Fede
ratio
n 20
08
71
15/1
1 20
07
NTN
U /
Tron
dhei
m
(Ter
je K
anst
ad)
Fibr
e R
einf
orce
d C
oncr
ete
Wor
ksho
p Pr
ocee
ding
No.
7,
Nor
dic
Con
cret
e Fe
dera
tion
2008
70
25-2
6/10
20
07
Hel
sink
i (S
tefa
n Ja
cobs
en/N
TNU
&
Ake
rArk
tic)
Ice
Abr
asio
n on
Con
cret
e St
ruct
ures
W
orks
hop
Proc
eedi
ng N
o.6,
N
ordi
c C
oncr
ete
Fede
ratio
n 20
08
69
31/3
+1/4
20
05
NTN
U /
Tron
dhei
m
(T. K
anst
ad, Ø
. Bjø
nteg
aard
&
E.J.
Selle
vold
)
Cra
ck R
isk A
sses
smen
t of H
arde
ning
C
oncr
ete
Stru
ctur
es
Wor
ksho
p Pr
ocee
ding
No.
5,
Nor
dic
Con
cret
e Fe
dera
tion
2005
77
NCF Workshops 1975 – 2015
Wednesday, 01 July 2015
No. Date Place and convenor Theme Documentation
77 21/4 2015
Oslo (Max Hendrix & Mikael Hallgren
Residual capacity of deteriorated concrete structures Extended abstracts in NCR, December 2015
76 21-22/11 2013
Riga (Børge J. Wigum) Alkali reactions in concrete Workshop Proceeding No. 11,
Nordic Concrete Federation 2014
75 15-16/2 2012
Oslo (Bård Pedersen, Claus K. Larsen & Dirch H. Bager)
Durability aspects of fly ash and slag in concrete
Workshop Proceeding No. 10, Nordic Concrete Federation 2012
74 13/10 2011
Chalmers / Gothenburg (Karin Lundgren & Mikael Hallgren)
Finite Element Analysis of Concrete Structures Summary paper in NCR, December 2012
73 2-5/3 2010
Vedbæk (Dirch H. Bager)
Freeze-thaw Testing of Concrete - Input to revision of CEN test methods
Workshop Proceeding No.9, Nordic Concrete Federation 2010
72 12-14/11 2008
Hirtshals (Eigil V. Sørensen)
Nordic Exposure Sites - Input to revision of EN 206-1
Workshop Proceeding No.8, Nordic Concrete Federation 2008
71 15/11 2007 NTNU / Trondheim (Terje Kanstad) Fibre Reinforced Concrete Workshop Proceeding No.7,
Nordic Concrete Federation 2008
70 25-26/10 2007
Helsinki (Stefan Jacobsen/NTNU & AkerArktic)
Ice Abrasion on Concrete Structures Workshop Proceeding No.6, Nordic Concrete Federation 2008
69 31/3+1/4 2005
NTNU / Trondheim (T. Kanstad, Ø. Bjøntegaard & E.J. Sellevold)
Crack Risk Assessment of Hardening Concrete Structures
Workshop Proceeding No.5, Nordic Concrete Federation 2005

78
68
3-4/
11
2003
Te
knol
ogisk
Inst
itut
(Lar
s Nyh
olm
Thr
ane)
Fo
rm F
illin
g A
bilit
y of
Sel
f-co
mpa
ctin
g C
oncr
ete
Sum
mar
y pa
per i
n N
CR
2:0
4
67
6/10
20
03
Vei
dekk
e A
SA/O
slo
(Ter
je K
anst
ad)
Des
ign
Rul
es fo
r Ste
el F
ibre
R
einf
orce
d C
oncr
ete
Stru
ctur
es
Wor
ksho
p Pr
ocee
ding
No.
4,
Nor
dic
Con
cret
e Fe
dera
tion
2003
66
22-2
3/5
2003
Te
knol
ogisk
Inst
itut
(Cla
us V
. Nie
lsen
) C
oncr
ete
and
Fire
Su
mm
ary
pape
r in
NC
R 2
:03
65
29/8
20
02
CB
I (J
ohan
Silf
wer
bran
d)
Dia
gnos
av
bära
nde
kons
trukt
ione
r C
BI r
appo
rt
64
14-1
5/6
2002
Lund
Uni
vers
ity
(Gör
an F
ager
lund
&
Ber
til P
erss
on)
Self
Des
icca
tion
of C
oncr
ete
Rep
ort T
VB
M-3
104
63
21-2
3/11
20
01
Hirt
shal
s (D
irch
H. B
ager
)
Dur
abili
ty o
f exp
osed
Con
cret
e co
ntai
ning
Sec
onda
ry C
emen
titio
us
Mat
eria
ls
Wor
ksho
p Pr
ocee
ding
No.
3,
Nor
dic
Con
cret
e Fe
dera
tion
2001
62
12-1
3/06
20
01
KTH
/ St
ockh
olm
(J
ohan
Silf
wer
bran
d)
Fibr
e-re
info
rced
Con
cret
e St
ruct
ures
W
orks
hop
Proc
eedi
ng N
o.2,
N
ordi
c C
oncr
ete
Fede
ratio
n 20
01
61
22-2
3/05
20
01
Cha
lmer
s (L
.O. N
ilsso
n)
Arm
erin
gsko
rros
ion
och
chlo
rider
i be
tong
60
26-2
7/4
2001
Tr
ondh
eim
(K
åre
Joha
nsen
) Se
lf C
ompa
ctin
g C
oncr
ete
SIN
TEF
Rep
ort S
TF22
A01
614
59
01/0
9 20
00
DTU
/ Ly
ngby
(M
ette
Gei
ker &
Hen
rik S
tang
) St
eel F
ibre
Rei
nfor
ced
Self-
Com
pact
ing
Con
cret
e
58
07-0
8/10
19
99
Skag
en
(Dirc
h H
. Bag
er)
Wat
er in
Cem
ent P
aste
& C
oncr
ete –
Hyd
ratio
n an
d Po
re S
truct
ure
Wor
ksho
p Pr
ocee
ding
No.
1,
Nor
dic
Con
cret
e Fe
dera
tion
1999
57
31/0
8+1/
0919
99
Lund
Uni
vers
ity
(Kat
ja F
ridh
&
Gör
an F
ager
lund
) Fr
ost R
esist
ance
of B
uild
ing
Mat
eria
ls
Rep
ort T
VB
M-3
087
56
18/0
6 19
99
Lund
Uni
vers
ity
(Gör
an F
ager
lund
&
Ber
til P
erss
on)
Self
Des
icca
tion
of C
oncr
ete
Rep
ort T
VB
M-3
085
78
68 3-4/11 2003
Teknologisk Institut (Lars Nyholm Thrane)
Form Filling Ability of Self-compacting Concrete Summary paper in NCR 2:04
67 6/10 2003
Veidekke ASA/Oslo (Terje Kanstad)
Design Rules for Steel Fibre Reinforced Concrete Structures
Workshop Proceeding No.4, Nordic Concrete Federation 2003
66 22-23/5 2003
Teknologisk Institut (Claus V. Nielsen) Concrete and Fire Summary paper in NCR 2:03
65 29/8 2002
CBI (Johan Silfwerbrand) Diagnos av bärande konstruktioner CBI rapport
64 14-15/6 2002
Lund University (Göran Fagerlund & Bertil Persson)
Self Desiccation of Concrete Report TVBM-3104
63 21-23/11 2001
Hirtshals (Dirch H. Bager)
Durability of exposed Concrete containing Secondary Cementitious Materials
Workshop Proceeding No.3, Nordic Concrete Federation 2001
62 12-13/06 2001
KTH / Stockholm (Johan Silfwerbrand) Fibre-reinforced Concrete Structures Workshop Proceeding No.2,
Nordic Concrete Federation 2001
61 22-23/05 2001
Chalmers (L.O. Nilsson)
Armeringskorrosion och chlorider i betong
60 26-27/4 2001
Trondheim (Kåre Johansen) Self Compacting Concrete SINTEF Report STF22 A01614
59 01/09 2000
DTU / Lyngby (Mette Geiker & Henrik Stang)
Steel Fibre Reinforced Self-Compacting Concrete
58 07-08/10 1999
Skagen (Dirch H. Bager)
Water in Cement Paste & Concrete – Hydration and Pore Structure
Workshop Proceeding No.1, Nordic Concrete Federation 1999
57 31/08+1/091999
Lund University (Katja Fridh & Göran Fagerlund)
Frost Resistance of Building Materials Report TVBM-3087
56 18/06 1999
Lund University (Göran Fagerlund & Bertil Persson)
Self Desiccation of Concrete Report TVBM-3085

79
55
22/0
8 19
97
VTT
, Esb
o Fu
ktm
ätni
ng o
ch fu
kttra
nspo
rt i
beto
ngko
ntst
rukt
ione
r uts
atta
för
tem
pera
tur-
och
fukt
varia
tione
r
VTT
Sym
posiu
m N
o 17
4 ”M
oist
ure
Mea
sure
men
ts”
54
10/0
7 19
97
Lund
Uni
vers
ity
(Gör
an F
ager
lund
&
Ber
til P
erss
on)
Self
Des
icca
tion
of C
oncr
ete
Rep
ort T
VB
M-3
075
53
10/1
2 19
96
CB
I Sto
ckho
lm
Livs
läng
dbed
ömni
ng in
klud
eran
de
korro
sione
ns p
ropa
gerin
gssk
ede
52
28/1
1 19
96
NTN
U/S
INTE
F, T
rond
heim
(E
. Sel
levo
ld &
T.A
. Ham
mer
) Ea
rly v
olum
e ch
ange
and
reac
tions
in
past
e –
mor
tar –
con
cret
e
51
08.1
1 19
96
Tekn
iska
Hög
skol
an i
Lule
å (H
ans H
edlu
nd, P
atric
k G
roth
) Li
cent
iats
emin
arie
r
50
16-1
7/04
19
96
Lund
Uni
vers
ity
(Stu
re L
indm
ark
&
Gör
an F
ager
lund
) Fr
ost R
esist
ance
of B
uild
ing
Mat
eria
ls
Rep
ort T
VB
M-3
072
49
Ju
ni
1995
A
albo
rg
Mod
ern
Des
ign
of C
oncr
ete
Stru
ctur
es
48
22-2
3/04
19
93
Lund
Uni
vers
ity
(Gör
an F
ager
lund
&
Erik
J. S
elle
vold
) N
ordi
sk M
inise
min
ar N
BS-
MK
Fro
st
Mød
eref
erat
47
13-1
4/01
19
93
CTH
, Göt
ebor
g
(L.O
. Nils
son)
K
lorid
trans
port
i bet
ong
Clo
ride
pene
tratio
n in
to c
oncr
ete
stru
ctur
es.
Inst
itutio
nen
för b
yggn
adsm
ater
ial,
Cha
lmer
s Te
knisk
a H
ögsk
ola,
Pub
licat
ion
93:1
, Göt
ebor
g,
Janu
ari 1
993
46
19/1
1 19
92
Aal
borg
Uni
vers
itets
cent
er
(L. P
ilega
ard
Han
sen)
U
tmat
ting
av b
eton
g
Fatig
ue o
f Con
cret
e St
ruct
ures
. Dep
t. of
Bui
ldin
g Te
chno
logy
and
Stru
ctur
al E
ngin
eerin
g, A
albo
rg
Uni
vers
tets
cent
er, A
UC
, Aal
bort
1992
, 126
pp,
IS
SN 0
902-
7513
-R93
07
79
55 22/08 1997 VTT, Esbo
Fuktmätning och fukttransport i betongkontstruktioner utsatta för temperatur- och fuktvariationer
VTT Symposium No 174 ”Moisture Measurements”
54 10/07 1997
Lund University (Göran Fagerlund & Bertil Persson)
Self Desiccation of Concrete Report TVBM-3075
53 10/12 1996 CBI Stockholm Livslängdbedömning inkluderande
korrosionens propageringsskede
52 28/11 1996
NTNU/SINTEF, Trondheim (E. Sellevold & T.A. Hammer)
Early volume change and reactions in paste – mortar – concrete
51 08.11 1996
Tekniska Högskolan i Luleå (Hans Hedlund, Patrick Groth) Licentiatseminarier
50 16-17/04 1996
Lund University (Sture Lindmark & Göran Fagerlund)
Frost Resistance of Building Materials Report TVBM-3072
49
Juni 1995 Aalborg Modern Design of Concrete Structures
48 22-23/04 1993
Lund University (Göran Fagerlund & Erik J. Sellevold)
Nordisk Miniseminar NBS-MK Frost Mødereferat
47 13-14/01 1993
CTH, Göteborg (L.O. Nilsson) Kloridtransport i betong
Cloride penetration into concrete structures. Institutionen för byggnadsmaterial, Chalmers Tekniska Högskola, Publication 93:1, Göteborg, Januari 1993
46 19/11 1992
Aalborg Universitetscenter (L. Pilegaard Hansen) Utmatting av betong
Fatigue of Concrete Structures. Dept. of Building Technology and Structural Engineering, Aalborg Universtetscenter, AUC, Aalbort 1992, 126 pp, ISSN 0902-7513-R9307

80
45
24/0
1 19
92
VTT
, Esb
o (J
uha
Saar
ima)
M
ikro
skop
i och
Mild
anal
ys
Mic
rosc
opy
and
imag
e an
alys
is of
bui
ldin
g m
ater
ials.
Esp
oo, F
inla
nd, 1
992.
VTT
Sy
mpo
sium
136
, Tec
hnic
al R
esea
rch
Cen
ter o
f Fi
nlan
d, E
spoo
199
3, 5
4 pp
ISB
N 9
51-3
8 40
87-5
44
05/1
2 19
91
HTH
, Oslo
(E
. Sel
levo
ld)
Bin
dem
idle
r i h
øyfa
st b
eton
g –
reak
tivite
t, st
rukt
ur o
g eg
ensk
aper
43
17/0
4 19
91
NTH
/SIN
TEF,
Tro
ndhe
im
( Ø. V
enne
slan
d)
Elek
trokj
emisk
e m
etod
er fo
r re
habi
liter
ing
av a
rmer
te
beto
ngko
nstru
ksjo
ner
42
20/1
1 19
90
KTH
Sto
ckho
lm
Ofo
rsto
rand
e pr
ovni
ng a
v be
tong
kons
truks
jone
r -
41
14/0
8 19
90
BM
L Tr
ondh
eim
Fe
rsk
beto
ngs r
eolo
gi
-
40
febr
. 19
90
Veg
dire
ktor
atet
, Oslo
H
øyfa
st b
eton
g i v
eier
-
39
23-2
4/11
19
89
CTH
Göt
ebor
g U
tmat
ting
av b
eton
gkon
stru
ksjo
ner
Fatig
ue o
f Con
cret
e St
ruct
ures
. C
TH p
ublik
asjo
n P-
90:8
, Göt
ebor
g m
ai 1
990
38
02/0
6 19
89
FCB
Tro
ndhe
im
Bet
ongk
onst
ruks
jone
rs b
rann
mot
stan
d Fi
re R
esta
nce
of C
oncr
ete.
Pap
ers p
rese
nted
at a
m
ini-s
emin
ar T
rond
heim
198
9
37
09/0
5 19
89
Dan
sk In
geni
ørfo
reni
ng,
korro
sions
cent
rale
n K
lorid
inite
rt ko
rros
jon
Inge
n pu
blis
erin
g på
det
te m
inise
min
aret
.
36
15/1
1 19
88
FCB
, Tro
ndhe
im
Kar
bona
tiser
ing
av b
eton
g K
arbo
natis
erin
g av
bet
ong.
SIN
TEF-
rapp
ort
5TF6
5 A
8806
5
35
05/0
4 19
88
DTH
, Køb
enha
vn
Kra
ftove
rfør
sel t
il ar
mer
ing
i rev
net
beto
ng
Not
its i
Nor
disk
Bet
ong
2:19
88
34
15/0
3 19
88
FCB
, Tro
ndhe
im
Flisk
ledt
bet
ong
i våt
rom
– sk
ader
og
utre
dnin
g Fl
iskle
dt b
eton
g i v
åtro
m –
skad
er o
g ut
bedr
ing.
SI
NTE
F-ra
ppor
t 5TF
65 A
8804
1, ju
ni 1
988
33
18/0
2 19
88
VTT
, Hel
sing
fors
B
esta
ndig
het,
livsl
engd
e D
urab
le c
oncr
ete
with
indu
stria
l by-
prod
ucts
. V
TT S
ympo
sium
89.
Esb
o 19
88
32
20/1
1 19
87
Dan
sk In
geni
ørfo
reni
ng,
Køb
enha
vn
Hyd
rasjo
n av
cem
ent
Sem
inar
om
Hyd
ratio
n of
Cem
ent,
Aal
borg
Por
tland
, Feb
ruar
198
8
80
45 24/01 1992
VTT, Esbo (Juha Saarima) Mikroskopi och Mildanalys
Microscopy and image analysis of building materials. Espoo, Finland, 1992. VTT Symposium 136, Technical Research Center of Finland, Espoo 1993, 54 pp ISBN 951-38 4087-5
44 05/12 1991
HTH, Oslo (E. Sellevold)
Bindemidler i høyfast betong – reaktivitet, struktur og egenskaper
43 17/04 1991
NTH/SINTEF, Trondheim ( Ø. Vennesland)
Elektrokjemiske metoder for rehabilitering av armerte betongkonstruksjoner
42 20/11 1990 KTH Stockholm Oforstorande provning av
betongkonstruksjoner -
41 14/08 1990 BML Trondheim Fersk betongs reologi -
40 febr. 1990 Vegdirektoratet, Oslo Høyfast betong i veier -
39 23-24/11 1989 CTH Göteborg Utmatting av betongkonstruksjoner Fatigue of Concrete Structures.
CTH publikasjon P-90:8, Göteborg mai 1990
38 02/06 1989 FCB Trondheim Betongkonstruksjoners brannmotstand Fire Restance of Concrete. Papers presented at a
mini-seminar Trondheim 1989
37 09/05 1989
Dansk Ingeniørforening, korrosionscentralen Kloridinitert korrosjon Ingen publisering på dette miniseminaret.
36 15/11 1988 FCB, Trondheim Karbonatisering av betong Karbonatisering av betong. SINTEF-rapport
5TF65 A88065
35 05/04 1988 DTH, København Kraftoverførsel til armering i revnet
betong Notits i Nordisk Betong 2:1988
34 15/03 1988 FCB, Trondheim Fliskledt betong i våtrom – skader og
utredning Fliskledt betong i våtrom – skader og utbedring. SINTEF-rapport 5TF65 A88041, juni 1988
33 18/02 1988 VTT, Helsingfors Bestandighet, livslengde Durable concrete with industrial by-products.
VTT Symposium 89. Esbo 1988
32 20/11 1987
Dansk Ingeniørforening, København Hydrasjon av cement Seminar om Hydration of Cement,
Aalborg Portland, Februar 1988

81
31
06/1
1 19
86
LTH
Lun
d B
rudd
mek
anik
Fr
actu
re M
echa
nics
of C
oncr
ete.
Div
isio
n of
B
uild
ing
Mat
eria
ls, L
TH, L
und
Nov
embe
r 6/8
6
30
21/1
0 19
86
VTT
Esb
o B
eton
gkon
stru
ksjo
ner u
nder
tv
angs
bela
stni
ng
Bet
ongk
onst
ruks
jone
r und
er tv
angs
bela
stni
ng.
VTT
-sym
posiu
m 7
6
29
23/0
5 19
86
FCB
/NTH
, Tro
ndhe
im
Utm
attin
g av
bet
ongk
onst
ruks
jone
r Fa
tigue
of C
oncr
ete.
Pap
ers p
rese
nted
at a
N
ordi
c m
ini-s
emin
ar T
rond
heim
, 198
5.SI
NTE
F-ra
ppor
t 5TF
65 A
8608
2
28
05-0
5/02
19
86
Forti
fikas
jonf
örva
ltnin
gen,
St
ockh
olm
D
ynam
isk
bela
sted
e be
tong
kons
trukt
ione
r
Dyn
amis
k be
last
ede
beto
ngko
nstru
ksjo
ner.
Forti
fikas
jons
forv
altn
inge
n Fo
rskn
ings
byra
an.
Rap
port
A4:
86 E
skils
tuna
198
4
27
23/1
0 19
85
CTH
Göt
ebor
g V
idhe
ftnin
g B
ond
and
anch
orag
e of
rein
forc
emen
t in
conc
rete
. CTH
, Div
. of
Cem
ent S
truct
ures
Pu
blic
atio
n 86
:1, G
öteb
org
26
15/0
5 19
85
VTT
Hel
sing
fors
R
epar
atio
n, ti
lstan
dsvu
rder
ing
”Rep
aras
jon
av b
eton
gkon
stru
ksjo
ner”
V
TT-s
ympo
sium
66
(198
6)
25
12/0
3 19
85
VTT
Hel
sing
fors
A
nslu
tnin
gar m
ella
n be
tong
elem
ent
“Con
nect
ions
bet
wee
n pr
ecas
t con
cret
e el
emen
ts”.
VTT
-sym
posiu
m 6
2 (1
985)
24
29-3
0/10
19
84
Køg
e
(Dirc
h H
. Bag
er)
Bet
on &
fros
t D
ansk
Bet
onfo
reni
ng. P
ublik
atio
n 22
:85
23
23/0
5 19
84
CB
I, St
ockh
olm
O
rgan
iske
fibre
i be
tong
O
rgan
iska
fiber
i be
tong
. Sam
men
fattn
inga
r. K
ompe
ndiu
m. C
BI,
Stoc
khol
m.
22
05/0
4 19
84
SBI,
Stoc
khol
m
Sam
verk
ansk
onst
rukt
ione
r stå
l-bet
ong
Stål
bygg
nads
inst
itute
t. Pu
blik
asjo
n nr
. 92,
apr
il 19
84
21
25/0
5 19
83
CB
I, St
ockh
olm
H
andt
erin
g av
bet
ong
på
bygg
arbe
tspl
atse
r
20
23/1
0 19
82
CB
I, St
ockh
olm
(G
. Fag
erlu
nd)
Bet
ongs
fros
tbes
tänd
ighe
t C
BI r
appo
rt 2:
83
19
10/1
2 19
81
FCB
, Tro
ndhe
im
(O.E
. Gjø
rv &
K.E
. Løl
and)
Si
lika
i bet
ong
Con
dens
ed s
ilica
fum
e in
con
cret
e. In
st. f
or
bygn
ings
mat
eria
llære
R
appo
rt B
ML,
826
10 fe
brua
r 198
2
81
31 06/11 1986 LTH Lund Bruddmekanik Fracture Mechanics of Concrete. Division of
Building Materials, LTH, Lund November 6/86
30 21/10 1986 VTT Esbo Betongkonstruksjoner under
tvangsbelastning Betongkonstruksjoner under tvangsbelastning. VTT-symposium 76
29 23/05 1986 FCB/NTH, Trondheim Utmatting av betongkonstruksjoner
Fatigue of Concrete. Papers presented at a Nordic mini-seminar Trondheim, 1985.SINTEF-rapport 5TF65 A86082
28 05-05/02 1986
Fortifikasjonförvaltningen, Stockholm
Dynamisk belastede betongkonstruktioner
Dynamisk belastede betongkonstruksjoner. Fortifikasjonsforvaltningen Forskningsbyraan. Rapport A4:86 Eskilstuna 1984
27 23/10 1985 CTH Göteborg Vidheftning
Bond and anchorage of reinforcement in concrete. CTH, Div. of Cement Structures Publication 86:1, Göteborg
26 15/05 1985 VTT Helsingfors Reparation, tilstandsvurdering ”Reparasjon av betongkonstruksjoner”
VTT-symposium 66 (1986)
25 12/03 1985 VTT Helsingfors Anslutningar mellan betongelement “Connections between precast concrete
elements”. VTT-symposium 62 (1985)
24 29-30/10 1984
Køge (Dirch H. Bager) Beton & frost Dansk Betonforening. Publikation 22:85
23 23/05 1984 CBI, Stockholm Organiske fibre i betong Organiska fiber i betong. Sammenfattningar.
Kompendium. CBI, Stockholm.
22 05/04 1984 SBI, Stockholm Samverkanskonstruktioner stål-betong Stålbyggnadsinstitutet.
Publikasjon nr. 92, april 1984
21 25/05 1983 CBI, Stockholm Handtering av betong på
byggarbetsplatser
20 23/10 1982
CBI, Stockholm (G. Fagerlund) Betongs frostbeständighet CBI rapport 2:83
19 10/12 1981
FCB, Trondheim (O.E. Gjørv & K.E. Løland) Silika i betong
Condensed silica fume in concrete. Inst. for bygningsmateriallære Rapport BML, 82610 februar 1982

82
18
15/0
5 19
81
NTH
, Tro
ndhe
im
Ikke
-line
ær a
naly
se a
v ar
mer
te
beto
ngko
nstru
ksjo
ner
Ikke
line
ær a
naly
se a
v ar
mer
te
beto
ngko
nstru
ksjo
ner.
Inst
itutt
for s
tatis
tikk,
N
TH T
rond
heim
Rap
port
nr. 8
1-2.
Okt
. 198
1
17
12/1
1 19
80
CB
I, St
ockh
olm
A
rmer
ing
och
arm
erin
gsar
bete
tn
ergo
nom
i C
BI-
rapp
ort
16
19/0
5 19
80
Aal
borg
Por
tland
, Aal
borg
(L
ars H
jorth
) C
emen
tsub
stitu
tions
mat
eria
ler
Aal
borg
Por
tland
, CB
L sæ
rtryk
nr.
7
15
21/0
4 19
80
SIN
TEF
FCB
, Tro
ndhe
im
Dyn
amis
k på
kjen
te k
onst
ruks
jone
r D
ynam
isk
påkj
ente
kon
stru
ksjo
ner.
FCB
rapp
ort
5TF6
5 A
8003
2, 1
980
14
16/0
4 19
80
Fins
ka B
eton
gfor
enin
gen
och
VTT
, Tam
mer
fors
A
rbet
smilj
ø vi
d be
tong
arbe
ten
Arb
etsm
iljøn
– ri
skfö
reby
ggan
de å
tgär
der v
id
beto
ngar
bete
n. V
TT-s
ympo
sium
14/
1981
13
21/0
3 19
80
DTH
, Køb
enha
vn
(K. M
adse
n)
Met
oder
och
dat
a fö
r pra
ktisk
be
räkn
ing
av s
vinn
och
kry
pnin
g
Dia
log
Nor
dic
Sem
inar
on
Def
orm
atio
ns in
C
oncr
ete
Stru
ctur
es. C
open
hage
n M
arch
198
0,
Nr 1
-80
12
26/1
1 19
79
CB
I, St
ockh
olm
(C
. Mol
in)
Hål
tagn
ing
och
rivni
ng a
v be
tong
C
BI-
rapp
ort f
inns
ej o
ch k
omm
er e
j hel
ler a
tt pu
blic
eras
.
11
16-1
7/10
19
79
Cem
ent o
ch B
eton
gins
titut
et,
Stoc
khol
m, (
J. B
yfor
s)
Bet
ong
och
beto
ngko
nstru
ktio
ner i
tid
lig å
lder
C
BI-
rapp
ort f
inns
. Kop
ia k
an re
kvire
ras
från
CB
I.
10
Okt
ober
19
79
Det
Nor
ske
Ver
itas
(N. E
lling
svåg
). U
tmat
tnin
g av
bet
ongk
onst
rukt
ione
r FC
B-r
appo
rt. S
TF65
A80
025,
dat
ert 8
0-06
-10.
9 24
/04
1979
Stat
ens T
ekni
ska
Fors
knin
gsce
ntra
l, B
eton
gtek
nisk
a la
bora
torie
t. O
tnäs
. (A
. Sar
ja)
Rep
arat
ion
av b
eton
gkon
stru
ktio
ner
VTT
Sym
posi
um 7
, Esb
o 19
80.
8 26
/01
1978
Stat
ens T
ekni
ska
Fors
knin
gsce
ntra
l, B
eton
gtek
nisk
a la
bora
torie
t. O
tnäs
. (H
. Poi
järv
i)
Upp
värm
ning
och
vär
meb
ehan
dlin
g av
fä
rsk
beto
ng u
nder
ar
bets
plat
sför
hålla
nden
Sem
inar
ium
för U
ppvä
rmni
ng o
ch
värm
ebeh
andl
ing
av fä
rsk
beto
ng u
nder
ar
bets
plat
sför
hålla
nden
. R
appo
rt frå
n V
TT E
sbo
1978
. 7
29/0
9 19
77
Aal
borg
Por
tland
, Aal
borg
(P
. Nep
per-
Chr
isten
sen)
B
rudd
mek
anik
k R
appo
rt N
o 6:
1977
. Dan
sk B
eton
fore
ning
.
82
18 15/05 1981 NTH, Trondheim Ikke-lineær analyse av armerte
betongkonstruksjoner
Ikke lineær analyse av armerte betongkonstruksjoner. Institutt for statistikk, NTH Trondheim Rapport nr. 81-2. Okt. 1981
17 12/11 1980 CBI, Stockholm Armering och armeringsarbetetn
ergonomi CBI-rapport
16 19/05 1980
Aalborg Portland, Aalborg (Lars Hjorth) Cementsubstitutionsmaterialer Aalborg Portland, CBL særtryk nr. 7
15 21/04 1980 SINTEF FCB, Trondheim Dynamisk påkjente konstruksjoner Dynamisk påkjente konstruksjoner. FCB rapport
5TF65 A80032, 1980
14 16/04 1980
Finska Betongforeningen och VTT, Tammerfors Arbetsmiljø vid betongarbeten Arbetsmiljøn – riskförebyggande åtgärder vid
betongarbeten. VTT-symposium 14/1981
13 21/03 1980
DTH, København (K. Madsen)
Metoder och data för praktisk beräkning av svinn och krypning
Dialog Nordic Seminar on Deformations in Concrete Structures. Copenhagen March 1980, Nr 1-80
12 26/11 1979
CBI, Stockholm (C. Molin) Håltagning och rivning av betong CBI-rapport finns ej och kommer ej heller att
publiceras.
11 16-17/10 1979
Cement och Betonginstitutet, Stockholm, (J. Byfors)
Betong och betongkonstruktioner i tidlig ålder
CBI-rapport finns. Kopia kan rekvireras från CBI.
10 Oktober 1979
Det Norske Veritas (N. Ellingsvåg). Utmattning av betongkonstruktioner FCB-rapport. STF65 A80025, datert 80-06-10.
9 24/04 1979
Statens Tekniska Forskningscentral, Betongtekniska laboratoriet. Otnäs. (A. Sarja)
Reparation av betongkonstruktioner VTT Symposium 7, Esbo 1980.
8 26/01 1978
Statens Tekniska Forskningscentral, Betongtekniska laboratoriet. Otnäs. (H. Poijärvi)
Uppvärmning och värmebehandling av färsk betong under arbetsplatsförhållanden
Seminarium för Uppvärmning och värmebehandling av färsk betong under arbetsplatsförhållanden. Rapport från VTT Esbo 1978.
7
29/09 1977
Aalborg Portland, Aalborg (P. Nepper-Christensen) Bruddmekanikk Rapport No 6:1977. Dansk Betonforening.

83
6 18/04 1977
Forskningsinstiuttet for Cement og Betong (FCB) Skjær (Skjuvning)
Nordisk Betongforskningsseminar "Skjær i Betongkonstruksjoner" FCB Rapport STF 65 A77033.
5 09/06 1977
Avd. för Byggnadsmateriallära Lunds Tekniska Høgskola. (L.O. Nilsson).
Fukt i betong Anmält i Nordisk Betong 6:1977 av L.O. Nilsson
4 23/03 1977
Avd. for Konstruksjonsteknikk, Høgskolan i Luleå. (L. Elfgren & K Gylltoft)
Utmattning av betongkonstruksjoner Teknisk rapport 1977:57 T fra Tekniska Høgskolan i Luleå.
3 19/06 1976
Cement- og Betonginstituttet, Stockholm (U. Bellander & G. Fagerlund)
Accelerade provningsmetoder Majoriteten av rapporter publisert i Nordisk Betong, 5:1976. Øvrige rapporter (forfattere og titler) listet i samme nr. av Nordisk Betong).
2 26/02 1976
Avd. Betongbyggnad, Chalmers Tekniska Högskola, Gøteborg (A. Losberg)
Lettballastbetong som konstruksjons-materiale
Rapport 77:3 fra Institusjonen for konstruksjons-teknikk CTH, 1977. (Ikke anmäldt i Nordisk Betong).
1 11/09 1975
Dansk Betongforening København (P. Nepper-Christensen & A. Nielsen)
Termiske problemer ved udførelse av massive betongkonstruksjoner
Kompendium utgitt av Dansk Betonforening, november 1975.
.
DK FIN IS NO SE 17 10 0 21 29
83
6 18
/04
1977
Fo
rskn
ings
inst
iutte
t for
Cem
ent
og B
eton
g (F
CB
) Sk
jær (
Skju
vnin
g)
Nor
disk
Bet
ongf
orsk
ning
ssem
inar
"Sk
jær i
B
eton
gkon
stru
ksjo
ner"
FC
B R
appo
rt ST
F 65
A77
033.
5 09
/06
1977
Avd
. för
Byg
gnad
smat
eria
llära
Lu
nds T
ekni
ska
Høg
skol
a.
(L.O
. Nils
son)
. Fu
kt i
beto
ng
Anm
ält i
Nor
disk
Bet
ong
6:19
77 a
v L.
O. N
ilsso
n
4 23
/03
1977
Avd
. for
Kon
stru
ksjo
nste
knik
k,
Høg
skol
an i
Lule
å.
(L. E
lfgre
n &
K G
yllto
ft)
Utm
attn
ing
av b
eton
gkon
stru
ksjo
ner
Tekn
isk ra
ppor
t 197
7:57
T fr
a Te
knisk
a H
øgsk
olan
i Lu
leå.
3 19
/06
1976
Cem
ent-
og B
eton
gins
titut
tet,
Stoc
khol
m (U
. Bel
land
er &
G
. Fag
erlu
nd)
Acc
eler
ade
prov
ning
smet
oder
M
ajor
itete
n av
rapp
orte
r pub
liser
t i N
ordi
sk
Bet
ong,
5:1
976.
Øvr
ige
rapp
orte
r (fo
rfatte
re o
g tit
ler)
list
et i
sam
me
nr. a
v N
ordi
sk B
eton
g).
2 26
/02
1976
Avd
. Bet
ongb
yggn
ad, C
halm
ers
Tekn
iska
Hög
skol
a, G
øteb
org
(A. L
osbe
rg)
Lettb
alla
stbe
tong
som
kon
stru
ksjo
ns-
mat
eria
le
Rap
port
77:3
fra
Inst
itusjo
nen
for k
onst
ruks
jons
-te
knik
k C
TH, 1
977.
(Ikk
e an
mäl
dt i
Nor
disk
B
eton
g).
1 11
/09
1975
Dan
sk B
eton
gfor
enin
g K
øben
havn
(P
. Nep
per-
Chr
isten
sen
&
A. N
iels
en)
Term
iske
pro
blem
er v
ed u
dfør
else
av
mas
sive
bet
ongk
onst
ruks
jone
r K
ompe
ndiu
m u
tgitt
av
Dan
sk B
eton
fore
ning
, no
vem
ber 1
975.
. D
K FI
N
IS
NO
SE
17
10
0
21
29

84

ISBN: 978-82-8208-048-4 ISSN: 0800-6377Printed by Helli - Visuell kommunikasjon, Oslo