nordic concrete research
TRANSCRIPT

PUBLICATION NO. 48 2/2013
NORDIC
CONCRETE
RESEARCH
EDITED BY
THE NORDIC CONCRETE FEDERATION
CONCRETE ASSOCIATIONS OF: DENMARK
FINLAND
ICELAND
NORWAY
SWEDEN
PUBLISHER: NORSK BETONGFORENING
POSTBOKS 2312, SOLLI
N - 0201 OSLO
NORWAY
VODSKOV, DECEMBER 2013


Preface
Nordic Concrete Research is since 1982 the leading scientific journal concerning concrete
research in the five Nordic countries, e.g., Denmark, Finland, Iceland, Norway and Sweden.
The content of Nordic Concrete Research reflects the major trends in the concrete research.
Nordic Concrete Research is published by the Nordic Concrete Federation which also
organizes the Nordic Concrete Research Symposia that have constituted a continuous series
since 1953 in Stockholm. The Symposium circulates between the five countries and takes
normally place every third year. The next symposium, no. XXII, will be held Reykjavik,
Iceland 13 - 15 August 2014, in parallel with the ECO-CRETE conference. More information
on the research symposium can be found on the webpage of the Nordic Concrete Federation;
www.nordicconcrete.net as well as on www.rheo.is. Deadline for submitting papers for the
Symposium is 1st of March 2014.
Since 1982, 401 papers have been published in the journal. Since 1994 the abstracts and from
1998 both the abstracts and the full papers can be found on the Nordic Concrete Federation’s
homepage: www.nordicconcrete.net. The journal thus contributes to dissemination of Nordic
concrete research, both within the Nordic countries and internationally. The abstracts and
papers can be downloaded for free.
The high quality of the papers in NCR are ensured by the group of reviewers presented on the
last page. All papers are reviewed by three of these, chosen according to their expert
knowledge.
Since 1975, 76 Nordic Miniseminars have been held – it is the experience of the Research
Council of the Nordic Concrete Federation, that these Miniseminars have a marked influence
on concrete research in the Nordic countries. In some cases, the information gathered during
such Miniseminars has been used as Nordic input to CEN activities. The latest Miniseminar
concerning Alkali Silica Reactions was held in Riga in an attempt to involve the Baltic
countries in our Nordic activities.
We look forward to welcome You to the XXII Nordic Concrete Research Symposium in
Reykjavik 13. - 15. August 2014.
Vodskov, December 2013 Reykjavik, December 2013
Dirch H. Bager Olafur H. Wallevik Editor, Nordic Concrete Research Chairman, Research Council of the Nordic Concrete Federation &
Chairman of the Organizing Committee for the XXII Research Symposium


PUBLICATION NO. 48 2/2013
CONTENTS
1 Martin Kaasgaard & Claus Pade 1
Influence of curing temperature and maturity on chloride permeability of con-
crete containing fly ash or slag
2 Cosmin Popescu, Cosmin Dăescu, Nagy-György Tamás & Gabriel Sas 13
Disturbed Regions in Dapped-End Beams –
Numerical Simulations of Strengthening Techniques
3 Rolands Cepurītis 27
Manufactured sand crushing process parameters: short review and evaluation for
sand performance in fresh concrete
4 Katalin Orosz, Thomas Blanksvärd, Björn Täljsten & Gregor Fischer 49
Crack development and deformation behavior of CFRP-reinforced mortars
Research Council and Editorial Board of NCR 71
Review Group for NCR 73


1
Influence of curing temperature and maturity on chloride permeability of
concrete containing fly ash or slag
Martin Kaasgaard
M.Sc., Consultant
Concrete Centre
Danish Technological Institute
Gregersensvej
DK-2630 Taastrup
Claus Pade
M.Sc., Team Leader
Concrete Centre
Danish Technological Institute
Gregersensvej
DK-2630 Taastrup
ABSTRACT
The resistance to chloride ingress of concrete with water to cement ratio equal
to 0.40 was investigated. Concretes containing fly ash or blast furnace slag
were compared to pure Portland cement concrete. The concretes were cured
immersed in water at different temperatures ranging from 10 to 60 °C.
Chloride migration and diffusion coefficients were determined at similar
maturities, ranging from 28 to 180 maturity days. It was found that the
resistance to chloride ingress of blast furnace slag cement concrete was
generally very good at all temperatures and maturities. For the ordinary
Portland cement concrete, the resistance to chloride ingress decreased as a
function of curing temperature for temperatures above 30 °C. For the fly ash
concrete, the resistance to chloride ingress increased as a function of curing
temperature throughout the temperature range investigated. The chloride
migration coefficient at 28 maturity days was a factor 10 lower for the fly ash
concrete cured at 60 °C compared to the fly ash concrete cured at 10 °C.
Keywords: concrete maturity, curing temperature, chloride permeability, fly
ash, slag
1. INTRODUCTION
Durability of concrete structures is an area of constant focus and the demands for service life,
and hence durability, of new concrete structures increases constantly. For reinforced concrete
structures exposed to marine environment or de-icing salts, resistance against chloride ingress is
a key property with regards to durability [1]. Chloride induced reinforcement corrosion is
fundamentally related to the reinforcement steel, but the effects on the concrete structure are
critical with resulting delamination and loss of mechanical properties. The governing factors

2
concerning chloride induced reinforcement corrosion are related to the concrete properties and
the exposure environment (chloride concentration, temperature, humidity, oxygen availability),
and furthermore the thickness of the concrete cover to reinforcement is an important factor.
The most common approach to prevent or rather delay the deterioration due to chloride induced
reinforcement corrosion is to prevent the chlorides from reaching the reinforcement. This is
achieved through specifying an appropriate cover to reinforcement and by using a relatively
impenetrable concrete [1]. The latter is related to the permeability of the concrete, which is
fundamentally governed by the porosity. However, permeability is not only determined by the
total porosity, but also pore size distribution and interconnectivity of pores. Furthermore,
permeability is not a property that is constant in time, but a dynamic property, that changes as
the concrete hydration proceeds and the hydration products fill the space originally occupied by
water. Hence, the permeability is governed by the powder combination used, i.e. Portland
cement and supplementary cementitious materials (SCM) such as fly ash, silica fume and blast
furnace slag, the water/cement ratio, the degree of hydration and the curing conditions of the
concrete. Finally, the capacity of the hydration products to bind chlorides can also affect the
resistance against chloride ingress, as only “free” chlorides in the pore solution can move [1].
In both [2] and [3] the influence of fly ash, silica fume and slag on chloride ingress in concrete
cured at room temperature and 37/38 °C respectively and at different humidity was investigated.
It was found that both moist curing and addition of SCM improved the resistance towards
chloride ingress. Furthermore it was found that curing at 38 °C and 65 % relative humidity
decreased the resistance towards chloride ingress compared to moist curing at room temperature.
In [4] the microstructure of ordinary Portland cement (OPC) paste hydrated at 5, 20 and 50 °C to
30 and 70 % degree of hydration was investigated. It was found that the elevated curing
temperature resulted in a coarser, more continuous pore structure. Tests on comparable concrete
indicated a decreased resistance towards chloride ingress at the elevated curing temperature in
line with the microstructure results [5]. Earlier it has been deduced that hydration at lower
temperature allows for the hydrates to diffuse and precipitate more uniformly throughout the
matrix, resulting in a less continuous pore system, while at elevated temperature, and
accelerated reaction rate, there is less time for such diffusion [6].
In [7] the microstructure of ordinary Portland cement paste and cement pastes with silica fume
and slag respectively cured at temperatures of 23 and 70 °C to 30 and 70 % hydration was
investigated. Also here it was found, that generally the elevated curing temperature resulted in a
coarser, more continuous pore structure for all pastes compared to curing at 23 °C. The use of
silica fume or slag resulted in a refined pore structure and a more homogenized distribution of
hydrates. The results were generally in agreement with the investigations of chloride diffusion
on comparable concretes [8].
In [9] the chloride permeability at 28 and 91 days of ordinary Portland cement concrete and
concrete with fly ash or slag cured at 23 and 71 °C was investigated. It was found that for the
OPC concrete, the chloride permeability was higher for the elevated curing temperature, while
the opposite was observed for the concretes containing fly ash and slag respectively.
In the referred earlier investigations, the testing of chloride permeability of concrete cured at
different temperature was carried out either at similar age or similar degree of hydration. In the
current study a different approach was used, where concrete cured at different temperatures was
tested for chloride permeability at similar maturity according to the maturity function. The

3
purpose was to verify if the maturity function applies to chloride permeability, i.e. will the
chloride permeability be the same for concrete cured at different temperatures when tested at
similar maturity. This was investigated for both OPC concrete and concrete containing
respectively fly ash and slag. The current study is part of a larger test program in connection
with the Danish Expert Centre for Infrastructure Constructions, where also strength of similar
concretes cured at different temperatures was tested at different maturities.
2. EXPERIMENTAL
Five types of concrete were selected for investigation of the influence of curing temperature on
resistance towards chloride ingress. The concretes were mixed using an industrial scale mixing
station and subsequently cylinders were cast and immersed in temperature controlled water
curing tanks at 10, 20, 30, 45 and 60 °C respectively until testing. The chloride migration
coefficient (NT Build 492) of the concrete was determined at 28, 56, 90 and 180 maturity days
and chloride diffusion coefficient (NT Build 443) of the concrete was determined at 28 and 180
maturity days.
The real time ages of testing for the different curing temperatures and maturities were calculated
using the maturity function:
H is the relative rate
θ is the temperature
E is the activation energy (θ ≥ 20 °C: E = 33500 J/mol, θ < 20 °C: E = 33500 + 1470 (20-θ))
R is the gas constant (R = 8.314 J/mol°C)
The maturity concept assumes that concrete samples of similar maturity will have similar
strength. In that way the strength of a concrete can be estimated based on its temperature history
and for a given temperature and age the maturity can be expressed in terms of an equivalent age
at 20 °C. It should be noted that the maturity concept is based on experiences with pure OPC
concrete and the applicability to cementitious systems containing fly ash or slag requires further
documentation. As mentioned, a parallel study was conducted to investigate the influence of
curing temperature on compressive strength for the same concretes. Some of these results will
also be presented in this article for comparison.
The calculated real time ages of testing for the different curing temperatures and the age factors
applied can be seen in Table 1.
Table 1 – Real time ages of testing.
Curing temp. 10 °C 20 °C 30 °C 45 °C 60 °C
Age factor 0.497 1.000 1.574 2.948 5.217
Maturity days Real time days
28 56.3 28 17.8 9.5 5.4
56 112.7 56 35.6 19.0 10.7
90 181.1 90 57.2 30.5 17.3
180 362.2 180 114.3 61.1 34.5

4
2.1. Materials and mix proportioning
Two types of Portland cement produced by Danish Aalborg Portland were used in pure Portland
cement concrete as well as in fly ash concrete; a belite rich sulphate resistant CEM I 42.5 N
(LAVALKALI) typically used for infrastructure projects as well as a more general purpose
CEM I 52.5 N (RAPID). The fly ash was Emineral B4, a silicious ASTM class F fly ash from
the Avedøre power plant near Copenhagen. The slag cement was a CEM III/B 42.5 N from
CEMEX produced at the Schwelgern plant in Germany.
Concretes were proportioned as pure Portland cement concrete based on both RAPID and
LAVALKALI cement, as fly ash concrete where each of the two cement types were combined
with fly ash (25 wt% of binder – calculated as fly ash content divided by fly ash plus cement
content) and a slag cement concrete. All concretes were proportioned with a water/cement ratio
of 0.40 (calculated using activity factors of 0.5 and 1 for fly ash and slag respectively), air
content of 4.5 % and a target slump of 160 mm. Air entraining agent (Amex SB 22) and
superplasticizer (Glenium SKY 532-SU) from BASF were used. The fine aggregate used was
sea dredged 0/2 mm sand from Rønne Banke in the Baltic Sea, and the coarse aggregate was
crushed granite from Rønne on the Danish island of Bornholm in the fractions 4/8 mm, 8/16 mm
and 16/22 mm. The mix proportions are shown in Table 2.
Table 2 – Concrete mix proportions in kg/m3 SSD.
A
LAVALKALI
B
LAVALKALI/FA
C
RAPID
D
RAPID/FA
E
Slag cement
Cement 365 300 365 300 360
Fly ash - 100 - 100 -
Sand 0/2 695 642 693 641 689
Rønne 4/8 377 367 376 366 373
Rønne 8/16 266 271 265 270 263
Rønne 16/22 529 541 528 540 525
Water total 146 140 146 140 144
Total 2378 2361 2373 2357 2354
w/c 0.40 0.40 0.40 0.40 0.40
Air content 4.5 % 4.5 % 4.5 % 4.5 % 4.5 %
2.2. Batching and mixing
The mixing of the concretes was performed in a 375 litre counter-current mixer with a capacity
of 250 litre ready mixed concrete and equipped with 5 aggregate silos and 4 powder silos. The
industrial mixing station ensures the applicability of the results to actual full scale concrete
production. In order for the concretes to be produced with precisely the desired water to cement
ratio, a special batching procedure was adopted, involving accurate determination of moisture
content of aggregates. Each aggregate was weighed separately onto the conveyor belt, and
samples were taken for determination of moisture content using microwave ovens, before the
aggregate was transferred to the mixer. After determination of moisture content, the precise
amount of water needed was calculated and batched to into a tank. The mixer, already
containing the aggregates, was started and the powder was added followed by the water, air
entraining agent and finally superplasticizer. The superplasticizer was added with a delay of 30
seconds from addition of the water. The final mixing time after dosage of all materials was 2
minutes. After mixing, the concrete was discharged to a crane bucket and samples were taken
for determination of slump, air content and density.

5
2.3. Casting, curing and testing
If the fresh concrete properties were acceptable, Ø100 mm cylinders were cast using a vibration
table. The cylinder moulds were immediately immersed in the temperature controlled water
curing tanks with typical time from mixing to immersion of around 1 hour. All samples were
demoulded the following day and immersed in the respective water curing tanks again until
testing.
When reaching the required respective maturities, the concrete cylinders were taken from the
water tanks and prepared for testing according to NT Build 492 and NT Build 443.
3. RESULTS AND DISCUSSION
An overview of the results from testing according to NT Build 492 and 443 of the 5 different
concretes are found in Table 3. Furthermore results from testing of density and compressive
strength at 28 maturity days are shown for completeness.
Table 3 – Overview of test results.
ID Temp.
°C
Density
kg/m3
Strength
MPa
CMC (*10-12
m2/s) CDC (*10
-12 m
2/s)
28 md 56 md 90 md 180 md 28 md 180 md
A 10 2434 58.9 18.2 14.0 10.8 8.7 23.7 6.7
A 20 2420 58.5 17.4 11.5 9.4 7.1 10.5 12.7
A 30 2396 55.7 18.2 11.7 12.4 9.6 15.2 10.8
A 45 2393 49.3 16.7 11.3 11.7 11.9 17.0 18.9
A 60 2370 41.8 24.9 17.8 18.0 21.7 24.8 37.8
B 10 2387 49.9 24.1 11.4 8.3 2.2 8.7 2.3
B 20 2375 48.4 19.7 10.4 4.5 3.6 7.8 2.7
B 30 2406 58.7 10.3 4.1 3.0 0.9 5.1 -
B 45 2370 53.9 3.4 1.0 0.5 0.4 2.3 1.3
B 60 2362 46.6 2.2 1.2 0.7 0.6 1.9 1.6
C 10 2377 72.1 8.7 6.6 6.2 4.7 9.2 4.7
C 20 2362 64.1 7.1 6.4 5.4 5.7 11.1 4.6
C 30 2375 62.8 7.9 6.3 6.2 6.4 6.4 6.3
C 45 2348 52.4 13.4 11.4 11.3 10.7 13.9 23.2
C 60 2346 45.3 20.2 19.7 >23.4 >24.4 16.4 62.3
D 10 2388 67.9 6.6 4.3 3.2 1.0 4.0 9.2
D 20 2389 68.5 6.1 2.7 1.6 0.6 3.4 0.6
D 30 2390 70.7 2.8 1.3 0.8 0.4 3.3 0.5
D 45 2379 65.4 1.2 0.7 0.5 0.5 1.9 1.0
D 60 2361 56.6 0.8 0.8 0.6 0.6 1.3 0.9
E 10 2386 61.6 2.2 1.3 1.2 0.6 1.6 1.1
E 20 2407 66.1 1.3 1.2 1.1 0.5 1.7 1.9
E 30 2397 64.4 0.8 0.6 0.9 0.4 2.0 1.8
E 45 2409 55.2 0.8 1.0 0.6 0.5 2.1 1.2
E 60 2383 47.0 0.5 0.6 0.6 0.3 2.6 1.1

6
3.1. Chloride migration coefficient as function of maturity
The results from testing of chloride migration coefficient as a function of maturity for curing at
20 °C are presented in Figure 1.
Figure 1 – Chloride migration coefficient as function of maturity for curing at 20 °C.
For the curing temperature of 20 °C the chloride migration coefficient becomes lower with
increased maturity. This can be attributed to the reduction in permeability as the hydration
process progresses and the hydration products fill the pores. The levels of chloride migration
coefficient at 28 maturity days are as expected, as the LAVALKALI based concretes (A and B)
has the highest chloride migration coefficients and the RAPID based concretes (C and D) has
intermediate chloride migration coefficients, probably due to the faster reaction rate of RAPID
compared to LAVALKALI. The slag cement concrete has very low chloride migration
coefficient at all maturities, which may be attributed to the slag reacting to refine the pore
structure and thereby reducing the permeability. The LAVALKALI/FA concrete has a higher
chloride migration coefficient compared to the LAVALKALI concrete at 28 maturity days.
However, at the higher maturities, and especially beyond 90 maturity days, the
LAVALKALI/FA concrete has a significantly lower chloride migration coefficient than the pure
Portland cement concrete, and also lower than the RAPID concrete (C). This can be explained
by the effect of the pozzolanic fly ash reaction, which occurs later compared to the cement
hydration reactions. For the RAPID based concretes, the addition of fly ash results in a lower
chloride migration coefficient at all maturities, i.e. the pozzolanic reaction of fly ash is better
“driven” by the RAPID cement than the LAVALKALI cement. Comparing concrete C and D
again shows an increased effect of the fly ash at higher maturities.
The results from testing of chloride migration coefficient as a function of maturity for curing at
45 °C are presented in Figure 2.
0
2
4
6
8
10
12
14
16
18
20
20 40 60 80 100 120 140 160 180 200
CM
C (
*10
-12 m
2/s
)
Maturity days
A B C D E

7
Figure 2 – Chloride migration coefficient as function of maturity for curing at 45 °C.
For the curing temperature of 45 °C, the reduction in chloride migration coefficient over time is
less pronounced and beyond 56 maturity days there is no change for any of the concretes. There
are clearly two levels of chloride migration coefficients with the pure Portland cement concretes
having significantly higher chloride migration coefficients than the fly ash and slag cement
concretes that have rather similar very low chloride migration coefficients. The more
pronounced difference between pure Portland cement concrete and the fly ash and slag concretes
could be the result either of a positive effect of temperature on the pozzolanic reaction or a
negative effect of temperature on the pure Portland cement concretes.
3.2. Chloride migration coefficient as function of curing temperature
The results from testing of chloride migration coefficient at 28 maturity days are presented in
Figure 3 as a function of curing temperature. The tendencies observed at the other maturities
(56, 90 and 180) of testing are similar, as it appears from Table 1.
0
2
4
6
8
10
12
14
16
18
20
20 40 60 80 100 120 140 160 180 200
CM
C (
*10
-12 m
2/s
)
Maturity days
A B C D E

8
Figure 3 – Chloride migration coefficient at 28 maturity days as function of curing temperature.
For the pure OPC concretes, the chloride migration coefficient is more or less unaffected by the
curing temperature up to 30 °C for the RAPID concrete and up to 45 °C for the LAVALKALI
concrete. At higher temperatures, the chloride migration coefficient increases. This correlates
well with the observations in [4] and [5], which report that elevated curing temperatures results
in a coarser, more continuous pore structure and a decreased resistance against chloride ingress.
Furthermore a decrease in strength at 28 maturity days as a function of temperature is observed
for the pure Portland cement concretes (see Table 1). This suggests not only a coarser pore
structure, but also a lower degree of hydration and hence higher porosity. Thus, the used
maturity function may be overestimating the effect of temperature on the hydration process, at
least when the concrete is cured at high temperatures for prolonged time as in this study.
For the fly ash concretes, the trend is the opposite of the pure Portland cement concretes. The
chloride migration coefficient decreases as a function of curing temperature throughout the
investigated temperature range (10 to 60 °C). The effect is most pronounced for the
LAVALKALI/FA concrete (B), with the chloride migration coefficient being more than a factor
10 lower at 60 °C compared to at 10 °C. It has been reported, that generally addition of
supplementary cementitious materials (silica fume and slag) will improve the resistance towards
chloride penetration, when comparing concretes cured at similar elevated temperature and to
similar degree of hydration [8]. This was attributed to the curing at elevated temperature
resulting in a coarser, more continuous pore structure and the supplementary cementitious
materials mitigating this effect by refining the pore structure. However, contrary to the current
study, it was also found that the chloride permeability still increased at elevated temperature for
the concretes containing supplementary cementitious materials. In another study, lower chloride
permeability was observed for concrete containing fly ash or slag cured at 71 °C compared to
the same concretes cured at 23 °C, while the opposite trend was observed for pure Portland
cement concrete [9]. These results therefore show the same trend as found in the current study,
0
5
10
15
20
25
30
0 10 20 30 40 50 60 70
CM
C (
*10
-12 m
2/s
)
Curing temperature (°C)
A B C D E

9
even though the chloride permeability was tested at similar real time age (28 days), whereas in
the current study the testing was carried out at similar maturity.
When comparing the strengths of the fly ash concretes cured at the different temperatures (see
Table 1), there is no clear indication of a lower strength as a function of increasing curing
temperature as was observed for the pure Portland cement concretes. This could indicate that the
fly ash concretes cured at the different temperatures reach a similar overall porosity and that the
effect of elevated curing temperature is a reduction in the continuity of the pore structure and/or
an increase in tortuosity of the pore system. Another potentially contributing factor could be that
the resulting hydration product phase assemblage is different when curing at elevated
temperature and that the chloride binding capacity may therefore be different/higher.
The slag cement concrete has a low chloride migration coefficient at all temperatures. A slight
reduction is observed as a function of temperature up to 30 °C, while at higher temperatures, the
chloride migration coefficient is unaffected by curing temperature. This correlates well with
previous observations [10], where slag cement concrete cured at respectively 23 and 50 °C had
similar low chloride permeability. However, at 70 °C an increase in chloride permeability was
reported. In the current study, the strength results at 28 maturity days might indicate a higher
porosity as a function of curing temperature, as the strength decreases with higher curing
temperature from 20 to 60 °C (see table 1). This does however not affect the chloride migration
coefficient.
3.3. Chloride diffusion coefficient as function of curing temperature
The results from testing of chloride diffusion coefficient (NT Build 443) at 28 maturity days are
presented in Figure 4 as a function of curing temperature.
Figure 4 – Chloride diffusion coefficient at 28 maturity days as function of curing temperature.
0
5
10
15
20
25
30
0 10 20 30 40 50 60 70
CD
C (
*1
0-12 m
2/s
)
Curing temperature (°C)
A B C D E

10
The general trends in diffusion coefficient are the same as observed for the chloride migration
coefficient. However, the relatively high value for the LAVALKALI concrete at 10 °C and low
value for the RAPID concrete at 30 °C does not correlate with the results from testing of
chloride migration coefficient. For the fly ash concretes, especially the LAVALKALI/FA
concrete, the chloride diffusion coefficient decreases as a function of curing temperature, even
though the effect is not quite as pronounced as for the chloride migration coefficient.
4. CONCLUSION
The pure Portland cement concretes and fly ash concretes investigated in this study show
opposite trends in resistance towards chloride ingress as a function of curing temperature. The
pure Portland cement concretes show a significantly reduced resistance towards chloride ingress
as measured by NT Build 492 and 443 testing when cured at higher temperatures, while the fly
ash concretes exhibit an increased resistance to chloride ingress as a function of curing
temperature. Slag cement concrete has a high resistance towards chloride ingress at all
temperatures investigated.
REFERENCES
1. Loser, Roman; Lothenbach, Barbara; Leeman, Andreas; Tuchschmid, Martin: “Cloride
resistance of concrete and its binding capacity – Comparison between experimental results and
thermodynamic modeling”, Cement & Concrete Composites, vol. 32, 2010, pp. 34-42
2. Ramezanianpour, A.A.; Malhotra, V.M.: “Effect of Curing on the Compressive Strength,
Resistance to Chloride-Ion Penetration and Porosity of Concretes Incorporating Slag, Fly Ash or
Silica Fume”, Cement and Concrete Composites, vol. 17, 1995, pp. 125-133
3. Khatib, J.M.; Mangat, P.S.: “Influence of high-temperature and low-humidity curing on
chloride penetration in blended cement concrete”, Cement and Concrete Research, vol. 32,
2002, pp. 1743-1753
4. Kjellsen, Knut O.; Detwiler, Rachel J.; Gjørv, Odd E.: ”Development of Microstructures in
Plain Cement Pastes Hydrated at Different Temperatures”, Cement and Concrete Research, vol.
21, 1991, pp. 179-189
5. Detwiler, Rachel J.; Kjellsen, Knut O.; Gjørv, Odd E.: ”Resistance to Chloride Intrusion of
Concrete Cured at Different Temperatures”, ACI Materials Journal, vol. 88, 1991, pp. 19-24
6. Verbeck, George J.; Helmuth, Richard H.: “Structures and Physical Properties of Cement
Paste”, Proceedings of the 5th International Symposium of the Chemistry of Cement, Tokyo,
1968, pp. 1-32
7. Cao, Yajuan; Detwiler, Rachel J.: ”Backscattered Electron Imaging of Cement Pastes Cured
at Elevated Temperatures”, Cement and Concrete Research, vol. 25, 1995, pp. 627-638

11
8. Detwiler, Rachel J.; Fapohunda, Chris J.; Natale, Jennifer: ”Use of Supplementary Cementing
Materials to Increase the Resistance to Chloride Ion Penetration of Concretes Cured at Elevated
Temperatures”, ACI Materials Journal, vol. 91, 1994, pp. 63-66
9. Acquaye, Lucy; Chini, Abdol; Danso-Amoako, Mark: “Green options for high temperature
cured concrete through the use of fly ash and blast furnace slag”, 33rd
Conference on Our World
in Concrete and Structures, Singapore, 2008
10. Fapohunda, Chris A.: “Effects of blast furnace slag on chloride permeability of concrete
cured at elevated temperatures”, Journal of Life and Physical Sciences, vol. 3, 2010, pp. 119-
123

12

13
Disturbed Regions in Dapped-End Beams – Numerical Simulations of
Strengthening Techniques
Cosmin Popescu
M.Sc., Ph.D. Student
NORUT Narvik, N-8504, P.O. Box 250, Norway
Department of Infrastructure Structures and Materials
E-mail: [email protected]
Cosmin Dăescu
Ph.D., Assistant Lecturer
Politehnica University of Timisoara
Department of Civil Engineering
2nd T. Lalescu, 300223 Timisoara, Romania
E-mail: [email protected]
Nagy-György Tamás
Ph.D., Lecturer
Politehnica University of Timisoara
Department of Civil Engineering
2nd T. Lalescu, 300223 Timisoara, Romania
E-mail: [email protected]
Gabriel Sas
Ph.D., Assistant Lecturer
Luleå University of Technology
Department of Structural Engineering
SE – 971 87 Luleå, Sweden
E-mail: [email protected]
ABSTRACT
This paper investigates the effectiveness of strengthening
reinforced concrete (RC) dapped-end beams using carbon fiber
reinforced polymers (CFRP). Parametric studies are performed by
means of numerical simulations in which several types of
composite materials as well as their orientation are combined. The
primary objectives of this research were the evaluation of the
strengthening systems in terms of ultimate capacities and the
failure modes involved. Results show that only some of them
provide significant load bearing capacity increase. The observed
failure modes ranged from a sudden failure up to the desired
progressive failure of the strengthening system.

14
Key words: Numerical analysis, dapped-end, strengthening,
precast concrete, FRP, EBR, NSMR, full-scale tests.
1. INTRODUCTION
The abrupt change of cross-section in a RC structural element results in a complex flow of
internal stresses. Such regions are disturbed regions (D-regions), so called dapped-ends for RC
beams, and represent areas where severe reductions of the cross-section are created so that the
beam is supported on other structural elements. The load carrying capacity (hereafter capacity,
for convenience) of dapped-end beams may be insufficient for reasons such as design errors,
code changes, increases in loads or structural damage. Fiber-reinforced polymers (FRP) applied
using the externally bonded reinforcement (EBR) or near surface mounted reinforcement
(NSMR) techniques have been proven to be reliable for strengthening RC structures. Several
guidelines for strengthening RC structures with FRPs have been published [1-3]. However,
these guidelines do not refer in detail to FRP strengthening of dapped-end beams due to
insufficient experimental and theoretical investigations on the variations in geometry, material
and loading conditions at their dapped-ends. To the authors’ knowledge, only four experimental
investigations on dapped-end beams strengthened with FRPs have been reported [4-7].
Gold et al. [4] strengthened with FRP several dapped-end beams of a three-story parking garage
that were deficient in shear capacity. Due to the lack of design provisions at that time, they
carried out a series of tests to verify the effectiveness of the FRP strengthening as well as the
predictive performance of their design approach. The FRP strengthening systems doubled the
capacity of the beams, confirming their effectiveness.
Taher [5] assessed the effectiveness of the following techniques for improving the capacity of
dapped-end beams: externally bonding steel angles; anchoring unbonded steel bolts in inclined,
pre-drilled holes; externally applying steel plate jackets; and wrapping carbon fiber around the
beam stem. Tests with 50 small-scale rectangular beams indicated that the FRPs were the most
viable solution for strengthening/retrofitting applications. Using the strut and tie analogy, Taher
[5] also derived a regression model to estimate the capacity of the FRP-strengthened dapped-end
beams, which reportedly provided “reasonable predictions” [5], but he did not consider any
possible scale effects of the beams tested for deriving the model.
Tan [6] experimentally investigated the efficiency of several FRP configurations for
strengthening dapped-end beams with deficient shear resistance, varying both fiber types and
mechanical anchorage systems for the FRPs. The results indicated that glass fiber reinforced
polymers (GFRP) provided greater improvements in terms of ultimate capacity than CFRP
plates and carbon fiber fabrics. He has also verified that the tested mechanical anchorage
devices provided higher exploitation of the FRP systems’ strengthening capacity by preventing
their debonding. The empirically based strut and tie model he derived was applied to predict the
shear capacity of the dapped-end beams and proved to be sufficiently accurate for the tested
beam types.
In another series of tests, Huang and Nanni [7] verified if the FRPs can increase the capacity of
dapped-end beams with “mild steel and no mild reinforcement” [7] and proposed a method for
strengthening dapped-end beams with FRPs, which was found to be “satisfactory and
conservative” [7].

15
The current study presents a parametric study of the FRP strengthening systems used for a real
case application, previously presented in [8]. The analysis is carried out by means of FEM-based
material nonlinear numerical simulations. In several dapped-end beams, diagonal cracks were
observed starting at the re-entrant corner, see [8]. These damaged dapped-ends were retrofitted
with CFRP plates. The aims of the strengthening solutions were to increase the capacity up to
the design load and to delay the yielding initiation of the steel reinforcement. Three full scale
laboratory tests and nonlinear numerical simulations of those tests were carried out to verify the
capacity of the retrofitted dapped-ends. The results indicated that FRPs can be used successfully
for rehabilitating dapped-ends. However, that study confirmed also that the capacity gain is
influenced by the application direction and type of FRP material used. The present investigation
aims to clarify the contributions of the individual components of the strengthening and identify
the most effective FRP-based strengthening system for the retrofit of large dapped beams ends.
The efficiency is discussed in terms of ultimate capacity and global failure mode of the
strengthened elements.
2. THE FIELD APPLICATION
The field work was carried out in 2003. In an industrial hall, 20 m span identical
precast/prestressed beams with dapped-ends were designed for a reaction force of 800 kN
positioned 400 mm from the re-entrant corner. Due to a construction error, in seven beams the
position of the reaction force was displaced by an additional 275 mm, thus diagonal crack
formed starting from the re-entrant corner. Considering the new lever arm (675 mm), a deficit in
capacity of 200 kN resulted. To increase the demanded capacity and prevent further cracking in
service, a strengthening solution using EBR CFRP plates was applied. Based on the initial
studies performed in 2003 using a linear FEM and strut-and-tie model, it resulted in the
necessity to strengthen the dapped-ends with the 0o/90
o layout (see Figure 1), since this layout
provided the longest anchorage length and debonding could have been avoided. In the design of
the retrofitting, the strains in FRP were limited to 4 ‰, according to fib Bulletin 14 [1].
However, in the real field application, in some cases, the dapped-ends were arranged head-to-
head and the purlins obstructed the application of this layout, hence for these situations the
45o/90
o layout was adopted (as shown in Figure 1).
3. EXPERIMENTAL PROGRAM
To verify the efficiency of the applied strengthening configurations, two beams were casted and
tested in laboratory environment, each with two dapped-ends. The arrangement, spacing,
diameter and strength class of the reinforcements were identical to those of the original beams.
The dapped-end specimens were subjected to a monotonic force in increments of 50 kN.
The first element (denoted C1 in [8]) was tested up to failure, serving as reference specimen.
The remaining three dapped-ends (denoted C2, C3 and C4 in [8]) were tested up to 800 kN,
which corresponded to the design load of the original dapped-ends. These pre-cracked elements
were strengthened in three different solutions. The test setup was identical for all the
unstrengthened (C) and retrofitted (RC) specimens (see Figures 1 & 2).
Two strengthening systems were composed of CFRP plates, applied in 45º/90º (RC2 in Figure
1) and 0º/90º (RC4 in Figure 1) directions, respectively. The overall behaviour of the elements
retrofitted with these two systems was similar. Both capacity and stiffness increased compared
with C1, and crack formation was delayed. At a load of 800 kN, the maximum strains measured

16
in the steel reinforcements in RC2 and RC4 were 31%, respectively 15% less than the
corresponding strains at this load in the reference specimen. The elements’ failure occurred by
successively deponding of the plates in both situations [8]. The load-displacement curves as
determined from the experimental tests and the corresponding predictions from the numerical
model are presented in Figure 3.
Figure 1 – Strengthening systems tested Figure 2 – Test set-up (mm)
a) C1 and RC2 b) C1 and RC4
Figure 3 – Load – displacement diagram. Experimental vs. numerical systems tested
4. NUMERICAL ANALYSIS
The modelling strategy is identical to the one presented in [8], where a very good agreement was
found between experimental and numerical results. The standard incremental and iterative
Newton-Raphson method for material nonlinear structural analysis was used in the numerical
simulations, based on the finite element method. The specimens were modelled with a mesh of
8-node serendipity plane stress finite elements. A Gauss integration scheme with 2x2 integration
points was used for all the concrete elements. The steel bars, NSMR, CFRP plates and CFRP
fabrics were modelled with 2-noded perfectly bonded embedded truss elements (one degree of
freedom per node) [9]. Details regarding the geometry and layout of the reinforcement are given
in [8]. Due to the fact that the whole element was modelled in 2D, the out-of-plane effects (such
as lateral debonding of the CFRP plates or NSMR) could not be recorded. Although in ATENA
software two models (Bigaj, 1999 and CEB-FIP 1990 Model Code) [10] of bond slip laws are
12 3 4
1
2
3
1
2
43
RC2 RC3 RC4
12 3 4
1
2
3
1
2
43
RC2 RC3 RC4

17
implemented to analyse interaction between discrete bars and concrete, full debonding
(separation between the FRP and the concrete surface) cannot be properly captured by a model
only considering axial slip. The above two bond models can be used for simulating uniaxial
state of stress. For our tests the state of stress is biaxial, therefore using these models could
produce to erroneous results. Moreover, in our tests, the debonding took the form of concrete
rip-off, where all the concrete cover was separated from the surface of the stirrups. To the
authors best knowledge there is only one model [11] that could capture such failure mode.
However that model [11] is derived on empirical basis from uniaxial lap joint tests, thus not
applicable to our case. For this reason, all the applied CFRP materials are considered to be
mechanically anchored and the debonding process is disregarded.
4.1 Modelling strategy
The numerical analysis presented in this paper is a continuation of the analysis presented in [8]
and aims to highlight the performance of the different FRP strengthening systems that have not
been tested nor applied. To model the optimum strengthening system, the numerical modelling
was carried out in two steps.
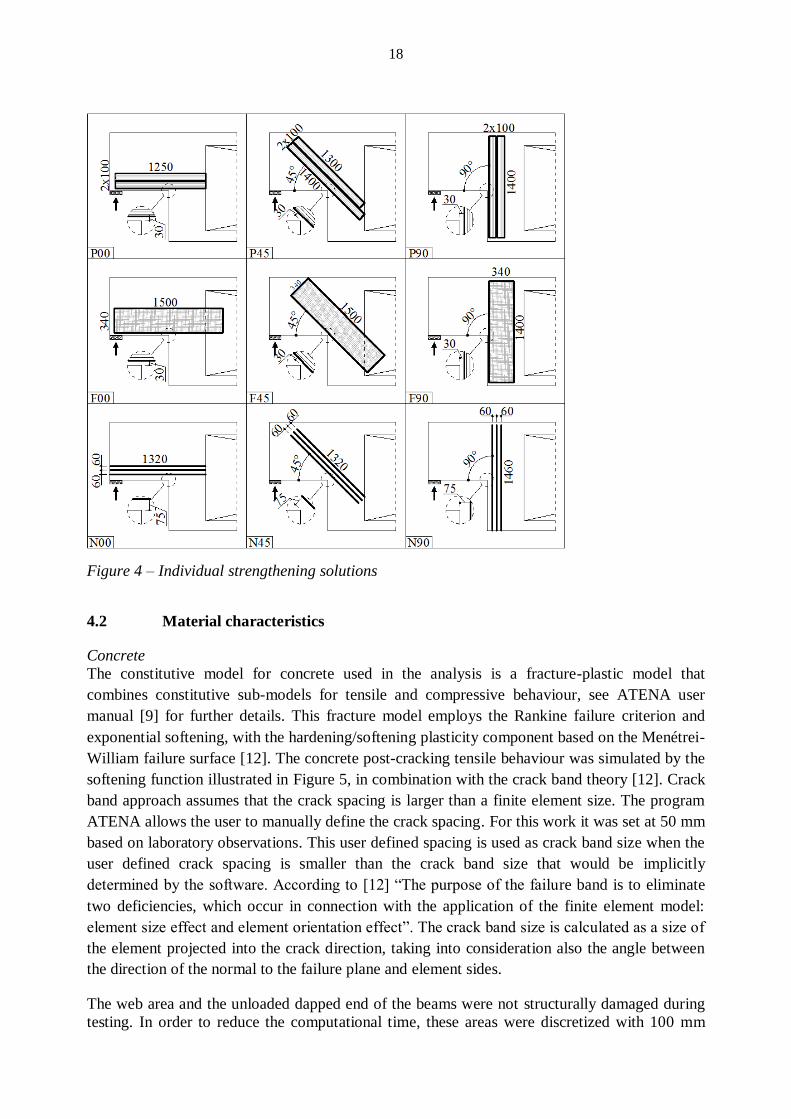
First, the individual components (P00, P45 and P90 in Figure 4) are modelled separately so that
their efficiency is determined. The denomination used reflects the angle that the specific
strengthening system makes with the longitudinal direction of the beam. For example: P00
means horizontally applied CFRP plates, F45 stands for 45o applied CFRP fabrics and N90
indicates a vertically applied NSMR bars. The scope is to identify how individual CFRPs
perform function of the: (1) applied inclination with respect to the horizontal axis and (2) type of
the composite used, i.e. fabrics (F), plates (P) or NSMR (N). The inclinations of 0o/45
o/90
o were
chosen in such a way that they correspond to the real case application and to the experimental
program carried out. Then, fabrics and NSMR components, designed to be equivalent in
nominal strength along each direction with the P00, P45 and P90 components were modelled
(see models F00, F45, F90, N00, N45 and N90 in Figure 4). The mechanical materials
properties of the fabrics and NSMR were chosen so that they are similar to the ones used in the
real application and experimental testing (see Table 1). Due to practical limitations, the resulted
values of the nominal strength are not identical, however the difference is marginal (±4%). The
results of the first step were evaluated and, in the second step, the individual components were
combined so that strengthening systems were formed.
Table 1 – Mechanical properties of CFRPs (specified by the producer)
System FRP Tensile Modulus
E [N/mm2]
Strain at failure
εu [‰]
Thickness
t [mm]
Width
b [mm]
No. of plates/ layers/
bars per side
Equivalent tensile
strength
[kN]
1 Plate (P) 165000 17 1.2 100 2 673
2 Fabric (F) 231000 17 0.17 340 3 680
3 NSMR (N) 165000 13 10 10 3 645
18
Figure 4 – Individual strengthening solutions
4.2 Material characteristics
Concrete
The constitutive model for concrete used in the analysis is a fracture-plastic model that
combines constitutive sub-models for tensile and compressive behaviour, see ATENA user
manual [9] for further details. This fracture model employs the Rankine failure criterion and
exponential softening, with the hardening/softening plasticity component based on the Menétrei-
William failure surface [12]. The concrete post-cracking tensile behaviour was simulated by the
softening function illustrated in Figure 5, in combination with the crack band theory [12]. Crack
band approach assumes that the crack spacing is larger than a finite element size. The program
ATENA allows the user to manually define the crack spacing. For this work it was set at 50 mm
based on laboratory observations. This user defined spacing is used as crack band size when the
user defined crack spacing is smaller than the crack band size that would be implicitly
determined by the software. According to [12] “The purpose of the failure band is to eliminate
two deficiencies, which occur in connection with the application of the finite element model:
element size effect and element orientation effect”. The crack band size is calculated as a size of
the element projected into the crack direction, taking into consideration also the angle between
the direction of the normal to the failure plane and element sides.
The web area and the unloaded dapped end of the beams were not structurally damaged during
testing. In order to reduce the computational time, these areas were discretized with 100 mm

19
element size mesh. For the loaded dapped end it was used a 50 mm mesh size. The material
properties were determined from laboratory tests, in conformity with [13] for concrete and [14]
for steel, respectively. In Figure 5, fct is the tensile strength of concrete, Gf is the mode I fracture
energy of concrete determined based on equation (1) developed by Vos, 1983 [9] and wc is the
crack opening at the complete release of stress, as described in [12]. The concrete had a
maximum aggregate size of 16 mm and the measured mean compressive cube strength was 56
N/mm2 corresponding to a C35/45 concrete strength class according to [13]. Tension and
compressive strength and elastic modulus of the concrete were determined as functions of the
cube strength (see Table 2). The formulas for these functions were taken from the CEB-FIP
Model Code 90 [15].
FRP and steel bars
Discrete bars were used to model the reinforcement; the characteristic material behaviour are
presented in Figure 6.
Table 2 – Properties of the concrete material used in FEM analysis Concrete class
Mean
compressive
strength
fcm [N/mm2]
Compressive
cylinder
strength
fc [N/mm2]
Tensile
strength
fct[N/mm2]
Elastic
modulus
Ec[N/mm2]
Crack spacing
cs [mm]
C35/45 56 47.6 3.513 38400 50
(1)
After the peak tensile strength (fu), the stress was reduced to 1% of fu so that internal stress
redistribution could be assured in the numerical computations. The values used for defining the
stress-strain relationships are given in Table 1 and Table 3.
Figure 5 – Tensile softening diagram Figure 6 – Steel reinforcement model
Figure 7 – CFRP tensile diagram Figure 8 – NSMR layout rule according to [3]

20
The behaviour of the CFRP was modelled as linear elastic up to failure. In order to avoid
numerical integration problems, the post-peak behaviour was modelled so that the residual stress
is 1% of the maximum tensile strength, see Figure 7. For the NSMR, the thickness, as referred
in Table 1, represents the depth embedded into the concrete cover, noted as “t” in Figure 8. The
FRP fabrics were introduced using several discrete lines (modelled as bars perfectly bonded to
the substrate), each equivalent to a 50 mm wide strip. The same procedure was used for the
plates, except that the strips were 25 mm wide. In the case of the NSMR, each line was
equivalent to the effective cross-section of each individual NSMR bar. The layout of the NSMR
reinforcement respects the prescriptions presented in [3]; these rules are schematically presented
in Figure 8. The predictive performance of the numerical simulations of the experimentally
tested elements (see [8]) showed that this approach is reliable since it reproduced the relevant
features recorded experimentally (i.e. maximum load, monitored displacements and monitored
strains in both reinforcement and FRP). A general view of the finite element model is shown in
Figure 9.
Figure 9 – FE model: material models and boundary conditions
Table 3 – Properties of the steel material determined from laboratory tests Diameter
Φ [mm]
Yield strength
fy [N/mm2]
Tensile
strength fu [N/mm
2]
Yield
strain εy [‰]
Ultimate strain
εu [‰]
Strain at failure
εult [‰]
10 780 922 3.6 14.9 15.5
12 522 600 2.5 23.1 24.0
16/18/20 460 600 2.2 19.9 21.0 25 440 625 2.2 18.9 20.0
4.3 Boundary conditions
Contact elements without tensile capacity were adopted for the contact of the specimen with the
supporting RC floor, thus allowing the eventual separation of the bottom surface. The elastic
deformation of the test setup was calibrated based on the experimental results obtained for the
reference specimen and then integrated in all numerical simulations (see [8]).

21
4.4 Utilization of the individual components
The notations in the Figure 10 are accompanied by the maximum force applied and their
percentage increase with respect to the reference specimen C1. Note, diagram C1 represents the
load displacement curve obtained from numerical analysis, also shown in Figure 3.
Figure 10 shows the load displacement response obtained from numerical analysis of the
individual components applied at 0° (Figure 10a), 45° (Figure 10b) and 90° (Figure 10c). From
here on, the “displacement” term in the load-displacement diagrams is defined as the difference
in values recorded at points M1 (bottom part of the extended end) and M3 (bottom part of the
beam in the undapped zone) (see Figure 1).
a) 0o angle b) 45
o angle
c) 90o angle
Figure 10 – Load displacement diagrams for individual components of the strengthening
systems
For individual FRP components applied at 0° and 45°, the increase in load was in range of 6.9-
23.3% compared to the reference specimen C1, which reached a maximum applied load of 1.59
MN (see [8]). However, the 90° strengthening systems does not provide significant
improvement in the bearing capacity (around 2.0%, see Figure 10c). In the C1 specimen the
yielding occurred at the same time in the horizontal and vertical reinforcement. Applying the

22
90° strengthening systems, yielding of the vertical steel reinforcement was delayed, while in the
horizontal steel bars yielding was reached to a similar applied force as in reference C1. Thus
only the strengthening systems made of individual components applied at 0° and 45° were
considered further in the study.
In terms of ultimate capacity increase, for the components P00, F00 and N00 (see Figure 10a),
the values varied between 8.2% up to 23.3%. At peak load, specimens P00 and F00 failed by
rupture of the fibres closest to the re-entrant corner followed by a progressive failure of the
adjacent fibres. Immediately after peak load, the fibres failed progressively for both systems P00
and F00, respectively. This less-brittle failure mode is attributed to the distribution of the fibres
over a larger area, hence stresses are better redistributed. Opposed to this behaviour, in the N00
model, the 3 NSM bars have failed in a brittle manner, all at the same load level. However, in
this case, it was obtained the highest capacity increase (23.3%) compared to the reference
specimen (C1).
For the components P45, F45 and N45 (see Figure 10b) it was recorded an increase in ultimate
capacity in the range of 6.9% up to 17%, compared to the reference specimen (C1). The P45 and
F45 components failed progressively after the peak load, while all three NSM bars of the N45
component failed in a brittle manner immediately after the peak load had been reached. The N45
had provided a significant increase in the stiffness response of the structure due to an effective
arrestment of critical crack propagation.
4.5 Assessment of the strengthening systems
Due to technological limitations imposed by the small concrete cover thickness, the NSM bars
can only be used in combination with either plates or fabrics. The components applied at 90° did
not provide any significant gain in capacity therefore those elements were not used in building
up the strengthening systems. Considering these limitations, all possible combinations of
strengthening are presented in Figure 11.
In Figure 12 are presented the numerical results of the systems components. The notations are
accompanied by the maximum force applied and its percentage increase with respect to the
reference unstrengthened specimen C1.
In Figure 12a-c are shown the load displacement responses for strengthening systems using:
a) Plates applied horizontally, in combination with 45° plates, fabrics or NSMRs;
b) Fabrics applied horizontally, in combination with 45° plates, fabrics or NSMRs;
c) NSMR applied horizontally, in combination with 45° plates or fabrics.

23
Figure 11 – Combined strengthening solutions
The increase of ultimate capacities of the P00-P45, P00-F45 and P00-N45 systems (Figure 12a)
are in the range of 16.3% up to 32.7%. P00-P45 and P00-F45 have a progressive failure of the
45o components, followed by the failure in the first strip of the horizontal CFRP; for P00-F45, at
the failure of all the strengthening systems, it was recorded also the failure of the first stirrup in
the main part of the element, next to the re-entrant corner. All the NSMR bars in P00-N45 fail
suddenly at the same maximum load.
All models using 00o fabrics (F00-P45, F00-F45 and F00-N45, in Figure 12b) reach maximum
loads corresponding to an increase of 10.7% up to 37.7%. For F00-P45 and F00-F45, the failure
modes are characterized by the progressive failure of the inclined components, followed by the
initiation of the failure in the horizontal strengthening systems. For F00-N45 model, all the 45o
NSMR failed suddenly together with 3 out of 8 horizontal CFRP strips.
N00-F45 and N00-P45 systems have similar maximum load capacities. The failure in the both
models is brittle; at maximum load, all the NSMR bars fail simultaneously.
In all the strengthening systems including NSMR bars, the response up to peak load was higher
than in the other strengthening configurations.
a) P00 as common component b) F00 as common component

24
c) N00 as common component d) Optimum vs. tested systems
Figure 12 – Load displacement diagrams for strengthening systems
5. CONCLUSIONS
The research presented in this paper was prompted from a real case study. Several strengthening
solutions could have been applied for that field application. However, the initial assessment of
the capacity and the choice of the FRP materials available on the market at that time (2003)
imposed the use of two different systems for strengthening the dapped-ends on site. To verify
the efficiency of the applied systems, a series of tests and numerical simulations were carried
out. Since only two strengthening systems were applied, the authors have decided to investigate
if these two systems used were the best choice in terms of retrofitting efficiency. Therefore in
this paper more practical strengthening configurations that could have been applied were
investigated by means of numerical simulations. The modelling approach was first to obtain the
individual influence for each component of the strengthening systems used and then to combine
these components so that the most efficient strengthening system is determined. Individual
models were studied using ATENA software [9], each one having only a part of the
strengthening system applied. Then, based on the performance of the individual components, all
feasible strengthening systems were built.
The results have showed that all the strengthening systems analysed provide an increase in the
load bearing capacity. While some strengthening systems provided marginal increase with
respect to the reference C1 specimen (about 2% for the systems with vertical fibres), many
others have provided increased capacities ranging from 6.9 to 37.7% . The optimum solution for
strengthening, which would have been chosen, is F00-F45 (fabrics with fibres at horizontal and
at 45 degrees) that increased the capacity to about 37.7%. A similar increase was provided by
P00-F45 (horizontal plate and fabrics with fibres at 45 degrees). However, the necessity for
mechanical anchorages at the end-plates should be explored. The strengthening system F00-F45
outperforms the two systems used in the field application (Figure 11d). The test results for RC2
and RC4, presented in [8] (Figure 1), showed an increase of 20.7% and 16.1% respectively
(Figure 3a and Figure 3b). In general a progressive failure mode is preferred to a brittle one
(RC2 and RC4 in the laboratory tests). This aspect was not captured during the analyses,
because the modelling was carried out in 2D. In a 3D analysis debonding could be modelled
using a bond slip law or a cohesion-friction model. Nevertheless, the authors did not test these
hypotheses due to lack of test information.

25
All the results presented above consider a perfect connection and anchorages between the
strengthening systems and the concrete element. This limitation is aimed to be further studied
and correlated with test results by means of strain distribution in the FRPs with regard to end-
plates debonding and intermediate crack debonding.
The numerical analyses presented here indicate that the applied strengthening systems based on
CFRP are viable solutions for improving the capacity of the dapped-end beams by concentrating
a sufficiently strong material as close to the re-entrant corner as possible, which is good
agreement with the results presented in [8].
The authors intend to improve their conclusions considering different material properties (i.e.
high modulus vs. high strength) or various cross section dimensions for the NSMR, thus
generating a future study subject.
REFERENCES
[1] fib Bulletin 14, Externally bonded FRP reinforcement for RC structures, International
Federation for Structural Concrete, 2001.
[2] CNR 200-2004, Guide for the Design and Construction of Externally Bonded FRP Systems
for Strengthening Existing Structures, Italian National Research Council, 2004.
[3] ACI 440.2R-08, Guide for the design and construction of externally bonded FRP systems for
strengthening concrete structures, American Concrete Institute, 2008.
[4] Gold, W.J., Blaszak, G.J., Mettemeyer, M., Nanni, A., Wuerthele, M.D., "Strengthening
Dapped Ends of Precast Double Tees with Externally Bonded FRP Reinforcement", ASCE
Structures Congress, 9, CD version #40492-045-003, 2000.
[5] Taher, S., "Strengthening of reentrant corner zone in recessed RC beams", Eleventh
International Colloquium on Structural and Geotechnical Engineering, 2005.
[6] Tan, K.H., "Shear Strengthening of Dapped Beams Using FRP Systems", FRPRCS-5, 2001,
pp. 249-258.
[7] Huang, P.C. and Nanni, A., "Dapped-end strengthening of full-scale prestressed double tee
beams with FRP composites", Advances in Structural Engineering, No. 9, 2006, pp. 293-308.
[8] Nagy-Gyorgy, T., Sas, G., Daescu, A.C., Barros, J.A.O., and Stoian, V., "Experimental and
numerical assessment of the effectiveness of FRP-based strengthening configurations for
dapped-end RC beams", Engineering Structures, Vol. 44, 2012, pp. 291-303.
[9] Cervenka, V., Jendele, L., Cervenka, J., ATENA Program Documentation. Part 1: Theory,
Cervenka Consulting Ltd., 2012.
[10] Jendele, L., Cervenka, J., "Finite element modelling of reinforcement with bond",
Computers & Structures, Vol. 84, No. 28, 2006, pp. 1780-1791.
[11] Aprile, A., Feo, L., "Concrete cover rip-off of R/C beams strengthened with FRP
composites", Composites Part B-Engineering, Vol. 38, No. 5, 2007, pp. 759-771.
[12] Cervenka, J. and Papanikolaou, V.K., "Three dimensional combined fracture-plastic
material model for concrete", International Journal of Plasticity, Vol. 24, No. 12, 2008, pp.
2192-2220.
[13] SR EN 12390-1-4:2002. Testing hardened concrete – Parts 1–4; 2002.
[14] SR EN 10002-1:2002. Metallic materials – Tensile testing – Part 1: Method of test at
ambient temperature; 2002.
[15] Comité Euro-International Du Béton (CEB), "CEB-FIP model code for concrete
structures", Lausanne, Switzerland; 1990.

26

27
Manufactured sand crushing process parameters: short review and
evaluation for sand performance in fresh concrete
Rolands Cepurītis
B.Sc. Eng., M.Sc. Eng, PhD Candidate
Norcem AS, R&D Department
c/o NTNU, Department of Structural Engineering
Richard Birkelands vei 1A,
NO-7491 Trondheim, Norway
E-mail: [email protected]
ABSTRACT
Effect of manufactured sand crushing process parameters on
performance of crushed fine aggregates in fresh concrete has been
evaluated. Results indicate that the two most important parameters
are the number of crushing stages used, reflecting the reduction
ratio of the cone crushers, and the crusher type (cone or VSI) used
for the last stage. VSI tip speed itself seems to be of a second order
of importance; however, changes in fresh concrete rheology were
observed when materials processed at high (45 m/s) and low (60
m/s) tip speeds were tested in concrete.
Key words: Crushed sand, manufactured sand, crusher, crushing
process, fresh concrete, rheology, slump, plastic viscosity, yield
stress.
1. INTRODUCTION AND BACKGROUND
For aggregate producers concrete aggregates are end products, while, for the concrete
manufacturers, aggregates are raw material to be used for mix design and concrete production.
Because of this, there is often lack of an “aggregate-concrete chain” in the research done so far.
It is mostly either aggregate producers or researchers investigating the effect of crushing process
variables on the properties of aggregate or experiments following the principle that is common
for a lot of concrete producers – “give us what you have, just make sure it is always the same”.
However, such an approach is not driving the overall development in the right direction. It is
therefore recommended to implement the full “aggregate-concrete chain” in order to see the
issues connected to the production and use of crushed fine aggregate from a wider angle and
thus gain maximum benefit for the society. Such an approach is attempted in the given study.
1.1 Effects of crushing process parameters on fine aggregate characteristics
Close to two decades ago one of today’s recognised aggregate crushing process engineers Jarmo
Eloranta has written in his Ph.D thesis [1]: “In many instances rock crushing can be considered
to be more art than science. One reason for that is that this industry on a global basis is such a

28
small niche that the companies involved have not had the resources nor felt a real need to study
what is happening inside their crushers.”
After Eloranta’s [1] statement the situation has been somewhat improved, both due to his own
research efforts and following a global trend, when with the development of concrete
technology the demand for high quality aggregates is steadily increasing. Already a little later
after Eloranta [1], Mahonen [2] considers the crushing process variables important for coarse
aggregate quality quite clear. However, he also emphasizes that factors affecting on the quality
of crushed fine aggregate are not so distinct, the main reason being that there is hardly any
research made for the sand size particles. He proposes a chart (Figure 1) based on the experience
from the coarse aggregate particles that presents the parameters affecting the quality of crushed
sand.
Figure 1 – Factors affecting the quality of crushed sand (reproduced and modified from [2])
It can be seen from Figure 1, that, in general, it is a complicated task to control the production
process of crushed sand due to many variables involved. It is also obvious that investigation of
all the many parameters is a very wide topic. Thus, the previous published research with respect
to the influence of the processing techniques has mainly been narrowed down to the parameters
under the group III, i.e. “CRUSHERS”. In particular, the two studied parameters have been
crusher type for the last crushing stage, i.e. cone crusher (Figure 2) or Vertical Shaft Impact
crusher (VSI) (Figure 3), and influence of the VSI tip speed (Figure 3). This is natural, since
these parameters are known to considerably affect the shape of coarse aggregates. Some of the
general knowledge regarding this is illustrated in Figure 4, as proposed by Schouenborg et al.
[3] during the ECO-Serve Seminar "Challenges for Sustainable Construction: the "concrete"
approach" in 2006.
Figure 4 suggests that the crushers used for aggregate production today are generally designed
to give the maximum quality for coarse aggregate [3]. On the other hand, those are also used for
fine aggregate production with two key pieces of equipment being the same, i.e. cone crushers
and VSI crushers. Impact crushers like VSI break the rock by hitting the material, thereby giving
rock a sudden blow of high energy (Figure 3). While the cone crushers break the rock by
compression (Figure 2) [2]. As the advantage of the cone crushers usually the ability of limiting
CRUSHED
SAND
IV CRUSHING
PROCESS
Process type Process equipment
Feeders Screens Conveyors
I FEED
MATERIAL Material type
Material parameters
III CRUSHERS
Crushing stages
Crusher parameters
Crusher type
II CLASSIFICATION
Dry process Wet process

29
the amount of fine waste material produced is given, while the disadvantage is the poor shape in
most fraction sizes [4-5]. The performance of VSI crushers is considerably different from cone
crushers. They are capable of producing equidimensional particles in all size range, while the
disadvantage is the large amount of fines generated [4-5]. However, as already mentioned,
Figure 4 also indicates that it is still not clear how the particle shape of finer (≤ 2 mm) and
especially the filler (≤ 125 µm) particles is affected as a result of different crushing techniques.
Figure 2 – Cross section of a cone crusher and the closed side setting (CSS) concept; CSS is the
minimum distance between head liner and bowl (concave) liner at the discharged end of the
cone crusher’s crushing cavity [source: modified from Metso minerals; provided by T. Onnela]
Closed side setting or CSS, as indicated in Figure 2, is the minimum distance between liner and
concave at the discharged end of the cone crusher’s crushing cavity [1]. Particles with size near
to CSS tend to be the most equidimensional of the crusher discharge product. In practice, 0.7 x
CSS – 1.3 x CSS sizes have a good cubical shape (Figure 4) [2]. It is assumed, that greater CSS
(20 mm) in the final stage leads to more equidimensional shape of fines, because material
coarser than sand is crushed several times (particles not passing the sieve are re-crushed) and
because more interparticle crushing occurs [2].
Recently two studies by Bengtsson and Evertsson [4, 6] have been carried out. They
investigated the effect of crusher type and VSI tip speed also on particles smaller than 2 mm.
Two types of crushers were used for the experiments: a cone crusher of type Hydrocone
(Sandvik) with a medium chamber and a VSI crusher with rock box and no cascade flow, which
was run at three different rotor speeds. The used tip speeds and the model of the VSI have not
been specified. Both of the crushers operated in open circuit and the feed to the cone crusher
was of a size 32-64 mm, while the VSI was fed with 11-16 mm and 11-12 mm fractions. The
feed material used in the study was tonalite (igneous intrusive rock of a felsic composition). In
addition, a reference natural fine aggregate was included in the study. After crushing, the 0.063-
2 mm fractions and corresponding natural aggregate particles were analysed by determining the
F-shape. As described by Bengtsson and Evertsson [6], F-shape is the aspect ratio Fmin/Fmax that
is calculated by dividing the minimum Feret diameter (Fmin) of the cross section of the particles

30
by their maximum Feret diameter (Fmax). The results revealed that in the whole analysed range
(0.063-2 mm) the F-shape of the natural gravel was considerably better than that of the crushed
materials. Analysis of the crushed material results indicated that if the tip speed of a VSI is low,
the fine aggregate will have poorer F-shape than the cone crusher’s products; while the high VSI
tip speed products will have a better shape than the products from the cone crusher. The given
relationship was valid in all the range from 0.063-2 mm, what indicates that the crushing process
can not only be crucial to the shape of the coarser sand fractions but can also determine shape of
the filler (≤ 125 µm) fractions. However, it must also be noted that for the particle sizes below
250 µm, shape difference between natural gravel and crushed materials became greater.
Bengtsson and Evertsson [6] have also studied the flow time and void content (loose packing) of
the same fine natural gravel, cone crusher and VSI product particles with a New-Zealand’s flow
cone according to NZS 3111. When the mass flow (g/s) was plotted against different particle
sizes, the high VSI tip speed material is then placed between natural gravel and cone crushed
material. It can also be noted, that when the particles size is decreasing the VSI product material
appears more similar to natural gravel than cone product fine aggregate. In general, the trend of
void content results for the 0.063-2 mm fractions were similar as described for the mass flow.
Figure 3 – Cross section of a vertical-shaft impactor (VSI) in operation and the VSI tip speed
concept; VSI tip speed is to be understood as tangential velocity of the rotor in m/s [source:
Metso minerals; provided by T. Onnela]
Analysis of 0/8 mm fine aggregate (granulite = medium to coarse grained metamorphic rock,
composed mainly of feldspars) samples after different crushing processes have also been done
by Gonçalvet et al. [7]. The rock was crushed by Hydrocones H4000 and H3000 (both Sandvik)
and a BARMAC 3000 VSI (Metso Minerals). Some of the material was subjected to
classification in order to partially remove the fines (≤ 75 µm). Gonçalvet et al. concluded that
particles produced by impact crushing produced intermediate values of sphericity ( ) and F-aspect-ratio (inverted value of F-shape)
when compared to natural fine aggregate and cone-crushed material, with the latter found to

31
approx. 2 mm Size
Bad Shape
?
? Good Shape
Pieces difficult to crush in
interparticle mode
VSI
Cone
Has to be flaky by
definition to pass through CSS (parallel
zone)
CSS
0.7 x CSS – 1.3 x CSS
UNKNOWN AREA
Figure 4 – Effect of cone crusher and VSI crusher on shape
of different aggregate particle sizes (reproduced and
modified from [3])
produce the flakiest material. Particle shape was found to be varying depending on the particle
size (size range between 0.1-2 mm was analysed). Flakiness increased as size decreased for the
cone-crushed material, to lesser degree also the VSI crushed material, while being almost
independent of size for a reference natural glaciofluvial aggregate. The unclassified impact
crusher product presented the highest compacted packing density, while classified product from
cone crusher had the lowest
compacted packing density. It
must also be noted here that
the same trend with the
increase in crushed particle
flakiness in the filler fractions
was observed in the study by
Bengtsson and Evertsson [6].
Gonçalves et al. [7] have also
investigated the effect of fine
natural and crushed (crushed
by different crushers as
described above) aggregate on
workability of mortars. They
concluded that for a w/c ratio
of 0.50 all mortars present
nearly the same workability
(measured using a flow-table),
regardless of the particle
shape, grading or fines
content. For a lower w/c of 0.40, mortars prepared with natural aggregate presented better
workability than those prepared with manufactured fine aggregate. The most significant
difference was found to be between mixture prepared with natural fine aggregate and mixture
prepared with unclassified cone crusher product, the difference in flow being 14%. For the
mortar with unclassified VSI product the consistency, when compared to natural sand, was only
reduced by 6%.
Gram et al. [8] have presented results where the improvement of sand particle (0.063-4 mm)
shape after VSI crushing has been investigated with the New Zealand’s flow cone according to
NZS 3111. They found that both the flow speed (g/s) and the void content (loose packing)
improved considerably after the VSI crushing for all the particles sizes tested. However, the
same as reported by Gonçalves et al. [7] and Bengtsson and Evertsson [6], the improvement was
more pronounced in the coarser fractions, i.e. 0.5-4 mm in this case. Gram et al. [8] also
investigated the effect of VSI crushing on the flow of mortars at w/c ratio of 0.6. The grading of
the two 0/4 mm materials (before and after the VSI) was adjusted to be similar. Then a mini-
cone (100 mm bottom diameter) test gave the following results: 118 mm for the material
acquired before the VSI and 135 mm after the VSI crushing.
1.2. Effect of fine aggregate characteristics on concrete rheology
The effect of aggregates on the rheological properties of concrete have been studied rather
extensively in the past decades, since they normally consume at least 75% of the total volume
and thus it is natural to assume that aggregate characteristics will have a rather pronounced

32
effect on the flow of the mix. However, most of the research has been done with emphasis on
the coarse aggregates and not the sand and filler fractions. This is probably since historically
concrete has mostly been produced with natural glaciofluvial, fluvial and moraine fine
aggregates, what means that the total amount of fines was low and the shape properties of
different sands were fairly similar. Then the particle size distribution (PSD) of the natural sand
and the presence of deleterious microfine particles, such as clay, silt or shale, were generally
thought to be the main performance criterion. When the interest on using the co-generated
leftovers from quarrying as crushed sand for concrete aroused, due to the lack of natural sand
resources or simply due to economic and environmental issues, it was soon realised that the
influence on the rheology of concrete of crushed sand is much more complicated than only the
two mentioned parameters. This is because the shape of the crushed sand particles varies to a
much greater extent, the amount of fines and their characteristics are different and so is the sand
grading.
To some extent the knowledge from crushed coarse aggregates can be directly translated to
crushed sand, however, one must remember that in practice the two particle size groups are quite
different, i.e. while the coarse aggregate particle sizes range is in the order of 10, it is in the
order of 103 for the sand size particles. This also suggests that most of the specific surface in the
aggregate is concentrated in the sand and especially the filler fractions, since it is known that
ratio of surface area to volume increases exponentially with decreasing particle size [9]. The
assumption of the different effects from fine and coarse aggregates was confirmed already in
1967 by Wills [10] who studied nine different fine and coarse aggregates. He found that an
equal change in shape characteristics caused fine aggregates to increase the water demand of the
mix two to three times more than the coarse aggregates. This suggest that, when discussing the
effects of any aggregates in concrete, one must also remember the fundamental findings by
Krieger and Dougherty [11], who proved that the effect of solid particles on the flow in a
concentrated suspension (such as concrete, mortar and cement paste) will firstly and mostly
depend on their normalised solid concentration, i.e. the maximum packing fraction ɸ/ ɸm and
only then on shape and other characteristics. In terms of concrete, this means that the found
phenomena of the effect on the fine particle characteristics will depend on the concrete mix
design parameters, such as w/c ratio, concrete type (conventional, SCC, high performance etc.)
and the volume fractions of aggregates and cement paste.
A thorough study on the effect of different crushed and natural fine aggregate (0-4 mm)
characteristics on the slump-flow value of concrete has been carried out by Järvenpää [12]. His
studies followed the Particle-Matrix concrete workability model as introduced by Mørtsell [13],
meaning that he treated the characteristics of 0.125-4 mm and 0-0.125 mm sand fractions
separately. The Particle-Matrix concrete workability model for proportioning regards all
particles > 0.125 mm as particle phase dispersed in lubricating matrix made up of all fluids
(water, admixtures etc.) and particles (binder, filler etc.) ≤ 0.125 mm [13]. Concrete flow would
then depend only on properties of the two phases and the volumetric relation between them. The
method has been used in Scandinavian countries (especially Norway) by many practitioners for
more than a decade and has proven to be very useful. Järvenpää [12] characterised both sand
fractions (0.125-4 mm and 0-0.125 mm) with different methods and then used a statistical
modelling approach to derive a model that related the characteristic properties of sand to the
measured slump-flow values of two concrete qualities at w/c ratios of 0.65 and 0.58. Those had
two different cement contents representing mixes with high (350 kg/m3) and low (300 kg/m
3)
paste volume, accordingly. Slump-flow measurements were preferred over slump values
because Järvenpää [12] found the first to have a higher repeatability. The aggregate composition
and grading of all the sands was normalised to be equal for all the concrete mixes. The acquired
33
flow model of Järvenpää [12] indicated that, when the aggregate grading was kept constant, the
shape (flakiness, angularity and elongation) parameters and particle porosity of the 0.125-4 mm
fraction were the two most important parameters affecting the fresh concrete flow. Even though
the amount of paste was the decisive parameter in determining the general level of flow value,
the fine aggregate characteristics could exceed the effect of paste difference in some extreme
cases. The results also indicated that the influence of shape characteristics prevailed when the
amount of paste was low, however, the differences could mostly be overcome when enough of
paste was available. The presence of superplasticizer of a sulphonated naphthalene
formaldehyde type enhanced the differences in the fine aggregate quality. Järvenpää [12] also
assumed that the 0.125-4 mm fraction porosity was important because higher particle porosity
will lead to higher water absorption and decreased amount of water available for concrete flow.
However, porosity will only be an important parameter if concrete mix design is based on bone-
dry fine aggregates, which is considered to be rather rare by the author of this paper.
Westerholm et al. [14] have also studied the effect of 14 (1 natural and 13 originating from
crushed granitoid rocks) 0/2 mm fine aggregate characteristics on the rheological properties
(yield stress τ0 and plastic viscosity µ) of mortars at w/c ratio of 0.5. 635 kg/m3 of cement and a
polycarboxylate based superplasticiser were used for the mixes. The grading and thus also the
fines content of the mixes was not normalised as in the study by Järvenpää [12]. In one of the
experimental series Westerholm et al. [14] also worked with mortars containing an inert
artificial paste. The paste volume of these mixes was successively increased in three steps from
a paste volume of 57% to 68%, by adding more of the artificial matrix. Thus, the mixes can be
considered to represent mortars which contain different amounts of cement at a given w/c-ratio.
Their results [14] indicated that the higher yield stress of the crushed aggregate mixes (as
compared to the natural sand) mainly originated due to the relatively high amounts of fines often
found in crushed fine aggregate. They also report that the high amount of fines also contributed
to the plastic viscosity by increasing the interparticle friction. However, the results also showed
that the higher viscosity of the mortars with crushed fine aggregates is a particle shape effect. A
change in the average F-aspect-ratio value of fraction 0.075-1 mm from 0.59 to 0.41 resulted in
almost a three folded increase of the plastic viscosity. Their results also indicated that the effects
of poorly graded and shaped fine aggregates could be eliminated or reduced by increasing the
paste volume of the mortars.
In addition to the total fines content and shape of the crushed sand particles, the quality of the
fines has also been reported to be a decisive parameter affecting on the fresh concrete
workability. In particular, content of free mica particles in the fines has been demonstrated to be
an important factor. This is since mica is flaky and laminated mineral which can considerably
increase the water requirement of the mixes [15]. Apart from the presence of the free mica, PSD,
as expressed through the specific surface, is considered to be strongly affecting the flow of filler
modified cement pastes [13]. Finer filler (higher specific surface) is believed to result in reduced
flow properties when compared to coarser reference filler having a lower specific surface area.
Smeplass [16] has explained this by the adsorption of the free water on a larger total surface
area.
1.3 Scope of the paper
The preliminary investigations on the effect from different crushing process variables have
indicated that they have a detrimental influence on one of the most important properties of the
sand particles, i.e. the shape, with a good chance to improve it in the whole range of sand size

34
particles, if the quarrying machinery is used to the best possible extent. However, a perfect
model that can relate those improvements directly to concrete properties does not exist. Thus, it
is not possible to judge if the improvements can be thought to be remarkable or not, or justify an
investment into quarrying equipment, since the quarrying industry does not have a clear criteria.
Or put it another way, as said by Baron William Thomson Kelvin [17]: “I often say that when
you can measure what you are speaking about, and express it in numbers, you know something
about it; but when you cannot measure it, when you cannot express it in numbers, your
knowledge is of a meagre and unsatisfactory kind …”
The path from blasting the bedrock in a hard rock quarry, which in fact starts the aggregate
crushing process, to mixing concrete in a batch plant and evaluating its performance at the
building site is complicated and a huge amount of parameters are involved. Thus it is clear that
in order to gain a substantial progress, on understanding which fine aggregate crushing
processing process parameters are the most essential with respect to fresh concrete properties, a
holistic approach is necessary. This paper is then an attempt of implementing such a holistic
approach by investigating the given topic from a wider angle. Thus, developing a sophisticated
concrete workability model is out of the scope and the given study has been mainly aimed at
understanding the order of magnitude to which different crushed sand crushing processes can
affect the fresh state properties (rheology) of concrete.
2. MATERIALS AND METHODS
2.1. Aggregate production plants and sand materials used for the study
Partly natural and crushed sand materials from five different plants have been included in the
study. Four of the plants are hard rock quarries and one is a sandpit where the reference partly
natural sand material was obtained from. The list of the plants along with the most essential
information on the production process and the deposit type are summarised in Table 1. Layouts
for some of the aggregate production plants can be found in the corresponding references as
indicated in the last column of Table 1.
Table 1 – Description of the plants and the deposit types used for aggregate production
Pla
nt
No
Quarry
name Type
No
of
cru
shin
g
stag
es
Crusher
type used
for the
final
stage
Settings for the
final stage crushing Rock type in the deposit
Cru
shab
ilit
y,
%
Ref
eren
ce t
o
pla
nt
layo
ut
1 Årdal Sandpit - - -
Granite/ gneiss
glaciofluvial and moraine
deposit
- -
2 Tau Hard rock
quarry 4
80%
VSI/
20%
Cone
47 m/s (tip speed)
12-19 mm (CSS)
22-25 mm (stroke)
Mylonittic quartz diorite
rock 23 [18]
3 Jelsa Hard rock
quarry 4 Cone
19-22 mm (CSS)
32 mm (stroke) Granodiorite rock 34 [18]
4 Hokksund Hard rock
quarry 3 Cone
22 mm (CSS) 15 mm (stroke)
Gneiss diorite rock 41 [18-19]
5 Nord-
Fosen
Hard rock
quarry 3 Cone
20 mm (CSS)
20 mm (stroke) Granite/ gneiss rock 61 -

35
As mentioned above and illustrated in Figure 1, the quality of crushed sand is thought to be
affected by 4 groups of parameters, namely: I Feed material properties, II Classification, III
Crushers and IV Crushing process. The present study aims at studying the effect of the
parameters under the group III, i.e. Crushers. Thus, parameters from other three groups have
been kept as constant as practically possible. With respect to group I, similar volcanic and
metamorphic rock types have been chosen for the study. Even though, hardness of those is still
quite variable (see Table 1), what will inevitably have some effect on the crusher performance
and quality of the products. However, since hardness in terms of the crushability value is
known, it can be accounted for when evaluating the results. Group II parameters are kept
constant by normalising the filler (≤ 125 µm) content in the tested fine aggregates (see below).
No particular means have been done to exclude the effect from group IV parameters; however,
those are believed to some extent overlap with the group III and also to be of a much lower
importance for the case than the first three groups.
In total, 21 different sand materials, obtained from the production processes in Table 1, have
been used for the study. These are summarised in Table 2. As it can be seen from Table 2, all
sand materials are divided into four groups:
Group I (No 1-2) consists of partly natural sands (includes approx. 30% of crushed
particles from crushing down oversize rock from the same deposit) obtained from the
Årdal quarry. The crushed sand share particles are equidimensional [20]. The Årdal fine
aggregate is a reference aggregate in most Norwegian concrete laboratories [21] and is
usually denoted as NSBR sand. Concrete mixed with this type of sand normally has
better workability, when compared to 100% crushed [21] and also most of 100% natural
aggregates.
Group II (No 3-8) consists of sands that are the commercial fine aggregate products in
the quarries from Table 1. For some of those (see Table 2 for details) the Dmax has been
adjusted to 2 mm and the fines (≤125 µm) content normalised to 10%.
Group III (No 9-14) consists of sands that have been produced by further re-crushing
the final products from Tau, Jelsa and Hokksund quarries. This means that a 0/11 mm
(for Tau) or 0/22 mm (for Jelsa and Hokksund) feed, as obtained after the final crushing
stage, has been taken to a test plant and fed to a Metso minerals Barmac B5100SE VSI
crusher, run at different tip speeds; followed by sieving to produce fraction with a Dmax
of 2 mm and normalisation of the crushed fines (≤ 125 µm) content to 10%. In this way
the sands in this group have all been subjected to an additional impact crushing stage as
compared to the corresponding materials in group II.
Group IV (No 15-21) consists of sands obtained in the same way as in group III, the
only difference being that in this case most of the crushed filler is removed, leaving only
1% passing the 125 µm sieve. An exception in this group is sand from Nord-Fosen
quarry (N-CC-COM-0/2-1). It has not been subjected to the additional VSI crushing and
is the commercial fine aggregate with Dmax reduced to 2 mm and the initial crushed filler
content reduced to the same 1% passing the 125 µm sieve.
PSD of sands No 1 to 14 are given in Figures 5 and 6. Sands No 15-21 are not included in order
to make the chart easier to view, since these PSDs will be the same as for the corresponding
materials from 1 to 14; with the only difference being the fines (≤ 125 µm) content. Results
from flakiness index measurements of the fractions 2/2.5, 1.6/2.0 and 1.25/1.6 mm by using a

36
custom bar sieve set, flow time and loose packing (void content) results (obtained by the New
Zealand’s flow cone according to NZS 3111) are presented in Table 3.
Table 2 – Description and designations of the sands used for the study
Gro
up o
f
sands
San
d N
o
Type Quarry
Fra
ctio
n
size
, m
m
Las
t st
ep
crush
er t
ype
VS
I ti
p
spee
d, m
/s
Fin
es (
≤ 1
25
µm
) co
nte
nt,
%
Designation Description
I
1 Partly
natural Årdal 0/2 – – 6.4 NSBR-0/2
Commercial product
after washing with
adjusted Dmax
2 Partly
natural Årdal 0/8 – – 5.1 NSBR-0/8
Commercial product
after washing
II
3 Crushed Tau 0/2 20% cone/
80% VSI 47 9.3 T-CC/IC-COM
Commercial product
after the last crushing
stage and washing
4 Crushed Tau 0/2 20% cone/
80% VSI 47 10 T-CC/IC-RAW
The same as No 3
prior to washing and
with adjusted filler
content
5 Crushed Jelsa 0/2 Cone – 10 J-CC-COM
Commercial product
after the last crushing
stage and washing
with adjusted filler content
6 Crushed Hokksund 0/2 Cone – 10 H-CC-COM
Commercial product
after the last crushing
stage with adjusted
filler content and
Dmax
7 Crushed Nord-Fosen 0/2 Cone – 10 N-CC-COM-0/2
Commercial product
after the last crushing
stage with adjusted
filler content and
Dmax
8 Crushed Nord-Fosen 0/8 Cone – 9 N-CC-COM-0/8
Commercial product
after the last crushing
stage
III
9 Crushed Tau 0/2 VSI 45 10 T-IC-45-10
Crushed/ sieved in
the test plant
10 Crushed Tau 0/2 VSI 60 10 T-IC-60-10
11 Crushed Jelsa 0/2 VSI 50 10 J-IC-50-10
12 Crushed Jelsa 0/2 VSI 60 10 J-IC-60-10
13 Crushed Hokksund 0/2 VSI 45 10 H-IC-45-10
14 Crushed Hokksund 0/2 VSI 60 10 H-IC-60-10
IV
15 Crushed Tau 0/2 VSI 45 1 T-IC-45-1
16 Crushed Tau 0/2 VSI 60 1 T-IC-60-1
17 Crushed Jelsa 0/2 VSI 50 1 J-IC-50-1
18 Crushed Jelsa 0/2 VSI 60 1 J-IC-60-1
19 Crushed Hokksund 0/2 VSI 45 1 H-IC-45-1
20 Crushed Hokksund 0/2 VSI 60 1 H-IC-60-1
21 Crushed Nord-Fosen 0/2 Cone – 1 N-CC-COM-0/2-1
Commercial product
after the last crushing
stage with adjusted
filler content and
Dmax

37
Table 3 – Results of sand characterisation
Group of sands
Sand No Designation Fineness modulus
Average flakiness index of 1.25-2.5
mm, %
Flow
time in NZ flow
cone, s
Loose packing
I
1 NSBR-0/2 2.98 2.9 23.1 0.575
2 NSBR-0/8 3.76 - - -
II
3 T-CC/IC-COM 3.09 24.1 31.2 0.561
4 T-CC/IC-RAW 3.44 20.2 28.69 0.556
5 J-CC-COM 2.11 20.2 29.96 0.544
6 H-CC-COM 2.70 32.0 28.12 0.539
7 N-CC-COM-0/2 1.37 22.0 28.97 0.517
8 N-CC-COM-0/8 4.47 - - -
III
9 T-IC-45-10 3.10 16.6 30.8 0.563
10 T-IC-60-10 3.11 13.0 29.59 0.565
11 J-IC-50-10 2.92 13.9 27.76 0.571
12 J-IC-60-10 3.05 12.1 26.36 0.573
13 H-IC-45-10 2.63 18.8 27.63 0.545
14 H-IC-60-10 2.57 12.1 27.17 0.547
IV
15 T-IC-45-1 3.10 16.6 30.15 0.566
16 T-IC-60-1 3.11 13.0 29.28 0.572
17 J-IC-50-1 2.92 13.9 28.3 0.566
18 J-IC-60-1 3.05 12.1 28.56 0.564
19 H-IC-45-1 2.63 18.8 30.18 0.541
20 H-IC-60-1 2.57 12.1 30.27 0.544
21 N-CC-COM-0/2-1 1.37 22.0 36.67 0.526
Figure 5 – PSD of 0/2 mm sands in groups I
to III from Table 2
Figure 6 – PSD of 0/8 mm sands in groups I to III
from Table 2 and coarse aggregates used for the
study

38
Figure 7 – PSD of fines (≤ 125 µm) from all the
sands determined by a SediGraph used for the study
Since the effect of different crushed fines (≤ 125 µm) has also been investigated, PSD of the
fines from all of the sands has been determined by a SediGraph (Figure 7).
2.2. Coarse aggregates and other concrete part materials
Crushed 2/8 mm and 8/16 mm coarse aggregates of a good shape from crushing down oversize
rock in the Årdal sandpit (see Table 1) have been used for the concrete mix design. The grading
curves of the coarse aggregate are provided in Figure 6.
The rest of the used materials include Norcem standard fly-ash cement (CEM II/ A-V 42.5 R)
and a co-polymeric superplasticizer Dynamon SP-130 (long side-chains and dry solids content
of 30%) from Rescon Mapei. Typical composition of the clinker for the cement is- C3S: 60%,
C2S: 15%, C3A: 8%, C4AF: 10%; the cement normally includes approx. 4% of gypsum and 20%
of fly ash, < 1.4% of Na2O-eqv. and has a Blaine value of 450 m2/kg (none of these values have
been tested for the particular batch used).
2.3 Concrete composition, mixing and
testing
It is known from practical experience [21]
(and also as indicated in the theoretical
studies reviewed in Section 1.2), that the
relative effect of aggregates in fresh
concrete is dependent on the mix
proportions, mainly including the paste
(matrix) volume and w/c ratio. Since the
amount of experimental work was limited, it
was chosen to use a constant w/c ratio of 0.5
throughout the study. The value of 0.5 was
suggested by a ready-mix concrete supplier
(NorBetong AS, Norway) as being the most
representative of the day-to-day production.
In total, 22 concrete mixes were prepared.
This means one mix with each of the 21
sand materials (see Table 2) and a 22nd
mix
where sands No 2 (NSBR-0/8) and No 8
(N-CC-COM-0/8) were mixed together in a
50%/50% proportion on mass basis (densities of the materials are almost the same). For all the
concrete mix designs 0/2 mm sand share was 45% of the total aggregate composition, while the
semi-coarse and coarse fraction were divided 17% of 2/8 mm and 38% of 8/16 mm. In cases
where the tested sand had a fraction size of 0/8 mm, the fine aggregate volume was increased to
45+17=62%, thus by the share of the 2/8 mm semi-coarse fraction (which was then omitted).
For mixes with sands that had the intentionally reduced amount of initial crushed filler (sands
No 15-21 in group IV), an additional amount of reference limestone filler was introduced in the
mixes. PSD of the limestone filler is provided in Figure 7. The amount of the limestone filler
used was such that the total filler content of the sands No 15-21 reached 10%, which is the same

39
as for the corresponding “parent” sands from groups II and III. This approach allowed studying
the effect from different crushed fillers separately.
Particle-Matrix model proportioning approach (see Section 1.2) was utilised and matrix volume
of 320 l/m3 was chosen as suitable for the given aggregate combinations. The cement content of
all the mixes was set constant at 342 kg/m3; however, if the Particle-Matrix model is strictly
applied then the content of the fines (≤ 125 µm) in the sand fraction will affect the total matrix
volume. Mixes with 10% of filler in the 0/2 mm fraction, i.e. mixes 4-7 and 9-21 were chosen as
the reference for the given 320 l/m3 of matrix at 342 kg/m
3 of cement. For the rest of the mixes
(1-3, 8 and 22) it was chosen not to adjust the matrix content equal to the reference mixes in
order to keep the cement content invariable. Thus, the total content of matrix for all of the mixes
(see above) is as follows: (1) 310 l/m3; (2) 311 l/m
3; (3) 318 l/m
3; (4-7) = 320 l/m
3; (8) 328 l/m
3;
(9-21) 320 l/m3; (22) 319 l/m
3.
With respect to the findings by Järvenpää [12], as discussed in Section 1.2, it must be noted that
the water absorption of all the aggregates was measured and the mix composition was calculated
on the saturated surface dry (SSD) basis, meaning that the given w/c ratio included only the
effective water amount, i.e. water that is believed not to be absorbed by the aggregates. The
water content of the mixes was then adjusted based on the aggregate water absorption values
and moisture. Prior to mixing, the moisture content of all sands was normalized to 3% by
rotating approximately 30 kg of sand and necessary amount of added water in a 50 litre plastic
drum until a homogeneous moisture distribution was achieved. Then the sample was left still for
at least 24 hours to be sure that the water absorption level of the aggregate has reached the
saturation point. Before concrete mixing, moisture content of all the aggregates was measured
once again. The concrete was mixed in a 60-litre Eirich laboratory paddle-pan mixer. The batch
size was 33 litres. Mixing sequence according to Table 4 was utilised.
Table 4 – Concrete mixing sequence Mixing step No. Time line, min Action
1 0.0-1.0 Dry mixing
2 1.0-1.2 Addition of water and admixture
3 1.2-3.0 Wet mixing
4 3.0-5.0 Rest*
5 5.0-6.0 Wet mixing
*During the rest it was assured that nothing was stuck at the bottom of the mixing pan.
The following fresh concrete properties were determined right away after the mixing: slump
according to EN 12350-2, air void content according to EN 12350-7, density according to EN
12350-6 and Bingham parameters – 0 and . On average 15 minutes after mixing were used for
measurement of fresh concrete slump, air void content and density before it was transferred to
the viscometer. Concrete rheological measurements have been performed with a BML-
Viscometer 3 by ConTec. BML-Viscometer 3 is a coaxial cylinders viscometer having a
stationary inner cylinder and rotating outer cylinder with the following geometry: inner radius =
100 mm, outer radius = 145 mm and height = 199 mm. Standard rheological measurement set-
up was used consisting of down flow-curve measurement (7 points from 0.49 to 0.09 rps). After
the measurement, it was verified if the steady-state flow has been reached for all of the
measurement points to assure correct determination of the Bingham parameters.
Repeatability of the measuring procedure was examined by repeated mixing and testing of a
concrete mix (Table 5). The same procedure, materials and a similar mix design as for the given

40
study were used by the same operator; however, the mix is not part of the testing program
presented here. Determined variation of the most relevant parameters is provided in Table 5.
Table 5 – Repeatability of the fresh concrete characterisation tests
Test No Slump,
mm
Air void
content,
volume-%
Density,
kg/m3 τ0, Pa
μ,
Pa·s
1 170 4.1 2321 168.3 9.3
2 180 4.1 2304 173.4 11.8
3 175 4.0 2305 168.3 9.9
Mean value 175 4.1 2310 170.0 10.3
Standard deviation 5 0.1 10 2.9 1.3
Variation coefficient, % 2.9 1.4 0.4 1.7 12.3
3. RESULTS AND DISCUSSION
Not all of the measured fresh concrete properties are reported. Density and air-content
measurements were mainly made in order to assure that those values lie in the borders of
acceptable variation. The density allows controlling if the weighting and mixing of the mix
constituents have been performed correctly, while determining the air-content is important
because an excessive amount of air is known to have an effect on concrete rheology. The air
content of all the mixes varied between 1.3 to 3.2% with an average value of 2.7% which is by
only 0.7% higher than the designed value of 2.0%. Also the variation between the measured and
designed density was very low. Corrected concrete compositions of all the mixes were
calculated according to the measured air void content and density. The results revealed that the
average variation of the matrix volume of all the mixes has been only 0.5%. Based on this, it
was estimated that the effect of density and air-void content variations on measured concrete
rheology is negligible. In addition, all of the mixes can be classified as very stable based on
visual observations.
Three different parameters describing fresh concrete rheology have been determined, namely
slump and two Bingham parameters, as measured with the BML-Viscometer, i.e. yield stress
(τ0) and plastic viscosity (µ). However, only the slump and the plastic viscosity results are
reported here. This is because a strong relationship between the yield stress and the slump value
is anticipated; due to the nearly invariable matrix content (320 l/m3) of the mixes. Such a
relationship and its dependency on the matrix content is reported in [18; 22-23] and is not
surprising assuming that the concrete flow after lifting the slump cone continues until the stress
induced by the gravity is higher than the yield stress (τ0). This is confirmed also for the given
study, since the squared linear correlation coefficient between yield stress and slump values was
calculated to be R2=0.9075. Thus, for the current work, reporting both of these values would
basically provide the same information. The most important difference is, however, that yield
stress gives a result in fundamental physical quantities that can then be further used in, for
example, fluid dynamics calculations [24]. However, since the purpose of the study was to
investigate relative differences between the effects of various parameters, the slump value was
preferred over the yield stress due to its greater practical relevance.
The results have been presented in three different sets: Figures 8-11 for the first, 12 and 13 for
the second and 14 and 15 for the third set. The first set of results includes mixes No 1, 3-7 and
9-14 with 0/2 mm party natural reference sand (NSBR-0/2) and 0/2 mm crushed sands with
normalised amount (10%) of the original crushed filler. It can be seen from the results, that the

41
Figure 8 – Slump values for the first set of results
reference partly natural sand has shown the most favourable rheological results, i.e. the highest
slump value and the lowest plastic viscosity. When the comparison of the natural and crushed
sands is based only on the slump test, the differences between the natural and the best of the
crushed sands seem rather limited, i.e. in the range of only 20-50 mm of slump. In practice this
difference could be overcome by adding a small additional amount of water reducing admixture.
However, the plastic viscosity measurements, as presented on Figure 9, reveal that, while the
difference in the slump (Figure 8) between the partly natural sand and the crushed sands in some
cases is rather negligible, at the same time the discrepancy in the plastic viscosity values can be
much larger. For example, mixes with crushed sands T-CC/IC-RAW and J-CC-COM have
slump values of 180 mm as compared to the reference value of 235 mm determined for the mix
having the partly natural sand NSBR-0/2. However, when the plastic viscosity of the same sands
are compared, the plastic viscosities of the crushed sands are found to be 140 [Pa·s] / 40 [Pa·s] =
3.5 times higher. This is a quite considerable difference. In practice, if such a concrete would be
delivered to a construction site with a desired slump value determined based on the experience
with natural sand concrete, the workers would most likely describe the mix as “harsh” and hard
to work with. This is since due to the higher plastic viscosity, the same muscle force has to be
applied for a longer period of time, in order to move the fresh mix for the same distance, as
compared to concrete with a lower plastic viscosity. The same will apply to the required
compaction energy, i.e. time for working with a poker vibrator at a given spot. The described
reveals the importance of using the rheological two parameter (yield stress/ slump/ slump-flow
or other “stoppage test” and plastic viscosity) approach when the performance of crushed sand
in fresh concrete is to be evaluated.
When it comes to the
effect of different
crushing process
parameters on the
performance of the
mixes from the first
data set (Figures 8 and
9), a couple of
interesting trends can
be observed. The
results indicate that
materials subjected to
4 and 5 stages of
crushing performed
better than materials
crushed only in 3 steps.
While the 5th step,
where applicable, can
be attributed to the
improvements believed to arise from the VSI shaping, the better performance of the materials
subjected to 4 stages of only gyratory and cone crushing it at least partly a result of lower
reduction ratio of the cone crushers. In the coarse aggregate production technology reduction
ratio is a well-known criterion that allows improving shape of the cone crusher products [1, 25].
Reduction ratio (also crushing ratio) is the ratio between the size of feed and outcoming product
[1]. When more crushing stages are present, the maximum feed size to the cone crushers can be
reduced resulting in a better shape, since reduced reduction ratio will allow for more interpaticle
crushing in the crushing chamber.

42
Figure 9 – Plastic viscosity values for the first set of results; *mix was
too stiff for measurements in the BML-vicometer
The results
presented in Figues
8 and 9 also indicate
that differences in
the 0/2 mm material
properties, as a
result of crusher
type for the last
crushing stage (cone
or VSI) or the VSI
tip speed used, can
cause measureable
changes to the fresh
concrete rheological
properties. Slump
increase due to
additional step of
VSI crushing (20-45
mm of slump)
seems to be
somewhat higher than changes due to VSI tip speed increase (5-30 mm of slump). However, the
influence of the additional VSI crushing and the utilised VSI tip speed seem much more
pronounced in the case of plastic viscosity measurements. It also seems that the VSI tip speed
increase from 45 m/s to 60 m/s gives a bigger benefit that increase from 50 m/s to 60 m/s. This
means that for crushed sand production running VSI at a very low rotor speed in order to
increase the capacity or reduce the filler content/ wear costs is generally not recommended, if
the material is intended for use in concrete. In this case a cone crusher that generates fewer fines
is probably preferable.
The results also indicate that some of the effects cannot be observed in terms of change in the
slump value, but are rather noticeable in the plastic viscosity measurements. For example, 80%
of the T-IC-D-45-10 sand has first been crushed with a Rotopactor BM 300 (Kemco) at tip
speed of 47 m/s and then re-crushed at the test plant with a Barmac 5100SE VSI at tip speed of
45 m/s; while 80% of the T-CC/IC-RAW fine aggregate is processed only with a Kemco
Rotopactor BM 300 at tip speed of 47 m/s. The results indicate that even though the shape of T-
IC-D-45-10 particles is slightly better than the shape of the T-CC/IC-RAW material, there is no
measurable difference between them in terms of the slump value, while the decreased plastic
viscosity due to additional VSI crushing can be observed on Figure 9.
Modelling crushed sand characteristics-concrete rheology relationship was not the main goal of
this paper, though some efforts were put into trying to relate the determined sand characteristics
(Table 3 = fineness modulus, average flakiness index of 1.25-2.5 mm fraction, flow time and
loose packing) to the observed rheological behaviour for the first set of result. The determined
squared linear correlation coefficients are summarised in Table 6. Two of the relations are also
presented as plots on Figures 10 and 11. The results in Table 6 indicate that for the given sands
and the used mix design, the fineness modulus (FM) has a limited influence on both slump value
and plastic viscosity, flakiness of the 1.25-2.5 mm fraction can only to some extent be attributed
to the effect on the slump value, while the flow time does not seem to be able to predict any of
the two rheological properties. On the other hand, loose packing or the loose state voids content

43
Figure 12 – Slump values for the second set of results
of the sand fractions has a much better correlation to the rheological properties of concrete. This
is, however, not surprising since the volume of sand in the total aggregate composition was
considerable and thus could have dominated also the packing values or void content of the total
0/16 mm aggregate composition. The latter parameter has been reported to have a remarkable
influence on the rheology of fresh concrete [26].
Table 6 – Squared linear correlation coefficients of 0/2 mm sand fraction characteristics-
concrete rheology relations for the first set of results
Concrete rheological parameter and
0/2 mm sand characteristic
Fineness
modulus (FM)
Flakiness index of
1.25-2.5 mm
fraction
Flow time in NZ
flow cone
Loose
packing
Slump 0.4228 0.6418 0.0826 0.8874
Plastic viscosity 0.4600 0.1224 0.1613 0.8285
The second set of
results includes
concrete mixes with
crushed sands that had
reduced (from 10% to
1%) crushed filler
content, i.e. mixes No
15-21. The missing
9% of crushed filler
were replaced by
industrially produced
limestone reference
filler on volume basis.
This allows
investigating if the
effect from different
crushing process
variables (VSI tip
speed in this case) can
affect the properties of the filler (≤125 µm) fraction to the extent measurable in concrete
rheology experiments. Results of these investigations are presented in Figures 12 and 13. It must
Figure 10 – Slump vs. loose packing of 0/2
mm sand fraction for the first set of results
Figure 11 – Plastic viscosity vs. loose packing of
0/2 mm sand fraction for the first set of results

44
Figure 13 – Plastic viscosity values for the second set of results; *mix
was too stiff for measurements in the BML-vicometer
also be noted that previously reported investigations [6] have indicated that VSI tip speed can
have an effect on particle shape also in the filler particle size range. The results from the given
study reveal (Figures 12 and 13) that in general changes in the filler type did not have a great
effect on the rheological parameters, with an exception of the N-CC-COM-0/2 sand. The results
also show that when the reference filler is used, the difference due to varying VSI tip speeds is
eliminated in the case of the slump value measurements. The effect on the plastic viscosity is
similar since for 2 out of 3 materials the difference due to VSI tip speed variations is reduced.
So in general, the results support the observations by Bengtsson and Evertsson [6], that also the
filler fraction properties can be affected by the crushing process. The most relevant effect is
believed to arise from the changes in shape of the filler particles as reported by Bengtsson and
Evertsson [6], since the grading of the fines is not affected considerably due to different VSI tip
speeds (Figure 7).
The third set of results
aims at investigating
the reasons why the
sand N-CC-COM-0/2
from the Nord-Fosen
quarry showed by far
the worst rheological
parameters (Figures 8
and 9), i.e. the lowest
slump value and was
in fact too stiff to
measure the plastic
viscosity (which is
therefore assumed to
be much higher than
for the rest of the
tested mixes). For this
reason, three
additional mixes apart
from those presented
on Figures 8-13 were prepared. Those are mixes No 2, 8 and 22. Mixes No 2 and No 8 were
mimes of the mixes with 0/2 mm NSBR-0/2 partly natural sand and N-CC/COM-0/2 crushed
sand from the Nord-Fossen quarry. The difference was that the 0/2 mm sand fractions were
replaced with 0/8 mm sands from the same quarries, i.e. NSBR-0/8 and N-CC/COM-0/8
accordingly, which then caused a change in the total grading of the 0/8 mm part of the aggregate
composition (see Figure 6) and to the total matrix content of the mixes (see Section 2.3). In mix
No 22 the sands from mixes No 2 and No 8 were mixed together in 50%/50% proportions on
mass basis (densities of the materials are almost the same). Results from the third set of results
are presented on Figures 14 and 15. The results indicate that the bad performance of the N-CC-
COM-0/2 sand was mainly due to combination of two things. One is unfavourable properties of
the filler fraction, since replacing the original crushed fines with the reference limestone filler
allowed considerably increase the slump value and reduce the plastic viscosity. From the
presented results it is hard to assess why the specific fines from the N-CC-COM-0/2 seem to be
unfavourable. It is generally known that finer filler will increase the flow resistance of the
matrix phase due to higher specific surface that has to be covered with water [16]. However, it
does not seem to be the case, since from the filler grading measurement results it appears to be
one of the coarsest. Then the reason most likely lies in the shape of the very fine particles or

45
perhaps due to presence of high free mica content [15]. N-CC-COM-0/2 sand was also by far the
finest of all the 0/2 mm sands tested, having a fineness modulus of only 1.37 in contrast to 2.8-
3.0 for most of the other crushed sands (see Table 3). As it can be seen in Figure 6, the fine 0/2
mm part in combination with the rather low amount of 2/8 mm crushed Årdal semi-coarse
fraction (73% (7) N-CC-COM-0/2 + 27% Årdal crushed 2/8 mm) results in an unfavourable
“open” grading with a small gap between 2-4 mm. If the grading is changed to a more equally
distributed and “dense” such as in the N-CC-COM-0/8 sand, this gives a considerably improved
slump value. Though, the plastic viscosity is still very high when compared to the reference
mixes with the partly natural sands (NSBR-0/2 mm and NSBR-0/8 mm). Finally, when further
half of the 0/8 mm crushed sand from Nord-Fosen (N-CC-COM-0/8) is replaced by the
reference party natural sand from the Årdal quarry (NSBR-0/8), the difference between the
reference sand and the crushed sand seem to be almost eliminated, both in terms of slump value
and plastic viscosity.
4. CONCLUSIONS
Results of the study demonstrate that, within the limitations of the current study, the crushing
process parameters that are important for the coarse aggregate quality (with respect to their
performance in fresh concrete) seem to be important also for the fine aggregate (0/2 mm)
characteristics. The two most important parameters are the number of crushing stages used
(reflecting the reduction ratio of the cone crushers) and crusher type (cone or VSI) used for the
last stage. The VSI tip speed itself seems to be of a second order of importance. However,
measurable changes in fresh mix properties were observed when materials processed at different
tip speeds were tested in concrete. Both the coarser particles 0.125-2 mm and the filler fractions
0-0.125 mm seem to be affected by adjusting the tip speed. It was also observed that increase
Figure 14 – Slump values for the third set
of results Figure 15 – Plastic viscosity values for the third set
of results; *mix was too stiff for measurements in
the BML-vicometer

46
from 45 m/s to 60 m/s had a greater influence on fresh concrete rheology than an increase from
50 m/s to 60 m/s.
Grading (as described by the fineness modulus) and flakiness index of the 1.25-2.5 mm fractions
seem to be parameters that can indicate the performance of 0/2 mm crushed sands in concrete to
some extent. Though, loose packing or loose state void content showed a much better relation to
fresh concrete rheology. This is, however, not surprising since the packing of particles will be
affected by both: their size distribution and shape (includes not only the flakiness index, but also
parameters like angularity, elongation and surface texture as suggested by Järvenpää [12]).
Thus, the loose packing or loose void content test can be recommended as a simple, fast and
cheap test for crushed sand quality control at a hard rock quarry. For the concrete composition
used in the given study, void content reduction by 1% in the 0/2 mm fraction resulted in a
roughly 3 cm increase in the slump value and a 28.7 Pa·s reduction of plastic viscosity.
The study revealed that the reason for the worst performance in concrete by one of 0/2 mm
crushed sands seems to be a combination of an unfavourable grading and the fine fraction
properties. Fine fraction properties affected more on the plastic viscosity, while grading affected
more on the slump value. The most effective way of improving the crushed sand concrete
properties was a partial (50%) replacement of the given crushed sand by high quality partly
natural sand, which is known to perform very well in fresh concrete. The replacement approach
allowed for fully eliminating any difference in the slump value and the plastic viscosity. This
means that if such a concrete would be delivered to a construction site, it would be hard to easily
distinguish the mix from a 100% natural sand based concrete. So in practice this seems to be one
of the easiest and most effective solutions of utilising the fine leftovers from quarrying as they
are, though the solution is by no means sustainable.
The final conclusion is that a good and optimised coarse aggregate production process is more
likely to generate a better quality co-generated fine sand fractions than a simple 3 three stage
crushing layout. However, some other crushed sand properties, which are important for
performance in fresh concrete, such as for example the mineralogical composition, will always
remain rock dependant. New and novel techniques, above those discussed in this paper, must be
developed in order to overcome problems arising from the unfavourable mineralogical
composition resulting in intrinsically unfavourable PSD or enrichments of free mica or other
flaky mineral content in the filler fractions.
ACKNOWLEDGEMENTS
The results presented here are based on work performed in COIN – Concrete Innovation Centre
(www.coinweb.no) – which is a Centre for Research based Innovation, initiated by the Research
Council of Norway (RCN) in 2006. The author would also like to especially acknowledge the
in-kind contributions by Metso Minerals to the COIN project and to this work, what made it
possible. The supervision contribution to major parts of this work by Stefan Jacobsen, Bård
Pedersen and Tero Onnela is also greatly appreciated.
REFERENCES
1. Eloranta, J., 1995. Influence of crushing process variables on the product quality of
crushed rock. Ph.D. Tampere University of Technology.

47
2. Mahonen, J., 1999. SAND: Applications, Manufacturing, Classification, Requirements –
Nordberg Way of Sand Making. Nordberg-Lokomo: Tampere.
3. Schouenborg, B. et al., 2006. Resources for Concrete Production. In: Proceedings of
ECO-SERVE SEMINAR “Challenges for Sustainable Construction: the “concrete”
approach”, Warsaw, Poland, May 18th
and 19th
2006.
4. Bengtsson, M. and Evertsson, C., 2006. An empirical model for predicting flakiness in
cone crushing. International Journal of Mineral Processing, 79(1), pp. 49-60.
5. Morrow, D., 2011. Why manufactured sand? Metsos’s customer magazine for the mining
and construction industries – results: minerals&aggregates, 1, pp. 26-27.
6. Bengtsson, M. and Evertsson, C., 2006. Measuring characteristics of aggregate material
from vertical shaft impact crushers. Minerals Engineering, 19(15), pp. 1479-1486.
7. Gonçalves, J.P. et al., 2007. Comparison of natural and manufactured fine aggregate in
cement mortars. Cement and Concrete Research, 37, pp. 924-932.
8. Gram, H-E., et al., 2008. Characterisation of crushed rock sands in Sweden. In:
Proceedings of manufactured sand workshop, Stavanger, Norway, October 30th and 31
st
2008.
9. Esping, O., 2008. Effect of limestone filler BET(H2O)-area on the fresh and hardened
properties of self-compacting concrete. Cement and Concrete Research, V. 38, Issue 7,
pp. 938-944.
10. Wills, M. H. Jr, 1967. How aggregate particle shape influences concrete mixing water
requirement and strength. Journal of Materials, V. 2, 4, pp. 843-865.
11. Barnes, H.A, Hutton, J.F. and Walters, K., 1989. An Introduction to Rheology.
Amsterdam: Elsevier Science.
12. Järvenpää, H., 2001. Quality characteristics of fine aggregate and controlling their
effects on concrete. Ph.D. Helsinki University of Technology.
13. Mørtsell, E., 1996. Modelling the effect of concrete part materials on concrete
consistency. Ph. D. Norwegian University of Science and Technology (In Norwegian).
14. Westerholm, M. et al., 2006. Influence of fine aggregate characteristics on the
rheological properties of mortars. Cement & Concrete Composites, 30, pp. 274-282.
15. Danielsen, S.W. and Rueslåtten, H.G., 1984. Feldspar and mica. Key minerals for fine
aggregate quality. Bulletin of the International Association of engineering geology, Vol.
30, Issue 1, pp. 215-219.
16. Smeplass, S., 2004. Fresh concrete – proportioning. In: Jacobsen S., ed. et al, 2012. TKT
4215 Concrete Technology 1. Course compendium. Norwegian University of Science
and Technology. Ch. 4.
17. Thomson, W., 1889. Popular lectures and addresses. Vol. I. Constitution of matter.
London: Macmillan and Co.
18. Cepuritis, R., 2011. Effects of Concrete Aggregate Crushing on Rheological Properties
of Concrete and Matrix. Master thesis. Norwegian University of Science and
Technology.
19. Wigum, B. J., 2011. Hokksund Quarry – Review of the aggregate production. COIN
Project report 33 – 2011. Trondheim: SINTEF.
20. Wigum, B. J, 2010. Classification and particle properties of fine aggregates.
Trondheim: NTNU.
21. Pedersen, B., 2011. Manufactured sand in concrete – effect of particle shape on
workability. COIN Project report 34 – 2011. Trondheim: SINTEF.
22. Wallevik, J.E., 2006. Relationship between the Bingham parameters and slump. Cement
and Concrete Research. V. 41, pp. 1214-1221.

48
23. Ferraris, C.F., de Larrard, F. and Martys, N., 2001. Fresh concrete rheology: recent
developments. In: American Ceramics Society, Mindes, S. and Skalny, J., eds., Material
science of concrete VI, pp. 215-241.
24. Roussel, N. et al., 2007. Computational modelling of concrete flow: General overview.
Cement and Concrete Research, 37, pp. 1298-1307.
25. Eloranta, J., ed., 2008. Crushing and Screening Handbook. 4th
edition. Metso Minerals:
Tampere.
26. Ferraris, C.F. and de Larrard, F., 1998. Modified Slump Test to Measure Rheological
Parameters of Fresh Concrete. Cement, Concrete and Aggregates, 20 (2), pp. 241-247.

49
Crack development and deformation behaviour of CFRP-reinforced mortars
Katalin Orosz
M.Sc., Ph.D. student
Luleå University of Technology
971 87 Luleå, Sweden
Thomas Blanksvärd
Ph.D., Senior Assistant Lecturer
Luleå University of Technology
971 87 Luleå, Sweden
thomas.blanksvä[email protected]
Björn Täljsten
Ph.D., Professor
Luleå University of Technology
971 87 Luleå, Sweden
Gregor Fischer
Ph.D., Associate Professor
Technical University of Denmark
2800 Kgs. Lyngby
ABSTRACT
This paper reports on a research study investigating CFRP-
reinforced mortars in uniaxial tension, as a strengthening material
for concrete structures. The bare strengthening material was
tested on dogbone specimens. Crack formation, crack
development and the interaction between the grid and the mortar
phase with varying geometrical parameters and mortar
compositions have been investigated and evaluated. The use of
engineered cementitious composites, exhibiting multiple cracking
and enhanced pseudo-ductility in uniaxial tension, was found to
result in an improved overall performance.
Keywords: concrete, strengthening, carbon fibre reinforced
polymers (CFRP), mortar, mineral based composites (MBC),
strain-hardening cementitious composites (SHCC), tensile tests,
strain hardening, cracking, pseudo-ductility

50
1. INTRODUCTION
Fibre-reinforced polymers (FRP) have become a popular material for strengthening and/or
retrofitting of existing concrete structures. Externally epoxy-bonded FRP systems have been
proven to be an effective strengthening method in repairing or strengthening structures and there
has been a large amount of literature published on the topic; see for example [1-4].
Despite their advantages over traditional strengthening methods, the use of epoxy-bonded
systems is not entirely problem-free [2]. The epoxy resin creates sealed surfaces. Furthermore, it
has poor thermal compatibility with the concrete substrate, it is sensitive to moisture at the time
of application, and it creates a hazardous working environment. In cold climates, the use of
epoxy is limited because of the minimum temperature of application (typically, 10C or 50F)
[2]. Therefore, it is of interest to develop alternative strengthening systems where the epoxy
bonding agent can be replaced with cementitious materials, for example a polymer-modified or
purely cementitious mortar with similar properties to those of the concrete substrate and
applicable in a more environmentally friendly and possibly also cost-effective way.
Mortars can be combined with FRP textiles or 2D grids to form an effective strengthening
system. This kind of strengthening system has already been tested by [5, 6] on flexural and shear
beams.
In the research presented, conventional, quasi-brittle, and “ductile” binders have been combined
with CFRP grids. The quasi-brittle binders used are commercially available, pre-mixed,
polymer-modified mortars. The ductile binder is strain-hardening cementitious composite
(SHCC), namely, a polyvinyl alcohol-reinforced engineered cementitious composite (PVA-
ECC), that exhibits strain hardening along with enhanced tensile ductility. The uniaxial tensile
tests aimed at obtaining better understanding of the tensional behaviour of the FRP grid-
reinforced cementitious composite material.
Only the bare strengthening material is tested here, not considering the interaction with the
concrete structure to be strengthened. The main reasons for replacing the conventional mortar
with strain-hardening mortars, in a few specimens, were to 1) enhance the loading capacity, 2)
enhance the deformation capacity, and 3) prevent brittle failure in the FRP.
2. RESEARCH SIGNIFICANCE
By substituting the traditionally quasi-brittle mortar with a strain-hardening cementitious mortar
in an externally bonded strengthening system, the interaction between the cementitious mortar
and the FRP reinforcement can be significantly altered and improved, (potentially) leading to a
more effective use of the FRP reinforcement. Such cement-based systems may in certain
conditions, replace the conventional epoxy-based systems. It is also shown how the behaviour of
a strain-hardening cementitious mortar can improve the mechanical properties of a mineral-
based strengthening system.
3. RESEARCH QUESTIONS
The study aimed to answer the following questions:

51
1. Which is the best material combination/orientation leading to the optimal utilization of
the FRP?
2. How do the failure modes and the load- and deformation capacity compare, depending
on the mortar type? Can a strain-hardening effect be shown in specimens cast with
tensile strain-hardening mortars?
3. Can the brittle and/or premature failure of the FRP grid be prevented by applying a
ductile matrix?
4. Prove whether the dogbone test setup is a suitable test method for testing MBC in
tension.
4. STRENGTHENING WITH CEMENTITIOUS COMPOSITES
The mechanics and design of different FRP reinforcements together with cementitious bonding
agents have been extensively researched. The short overview here is selective to applications,
which have led to strengthening with grid-reinforced mortars. A more detailed “state-of-the-art”
can be found in [7].
Embedded continuous (dry) fibres, fibre reinforced cementitious mortars, textile-reinforced
mortar (TRM) or textile-reinforced concrete (TRC) make use of the tensile strength of the FRP
reinforcement which is significantly higher than that of the mortar phase. The FRP component
in these applications is intentionally aligned accordingly to the principal stresses expected
during the lifespan of the structure. In TRC, the load capacity is heavily dependent on the proper
penetration of the textile by the mortar, as emphasized by e.g. [8]. If instead of a textile, the FRP
is a grid, it offers the advantage of an improved mechanical anchorage due to the rigid joints of
FRP in fine-grain mortars and it ensures that all fibre filaments will work together. The pre-cut
grid, available with different grid spacing and thickness, can be embedded between two layers
of polymer-modified mortar, resulting in a strengthening layer of about 5-10 mm of total
thickness [5].
In a cementitious strengthening system, the bond between base concrete (structure to be
strengthened) and first layer of polymeric mortar is enhanced by a primer. Several tests have
been carried out with grid-reinforced mortars, mainly focusing on flexural [5, 9], and shear
strengthening [5, 10]. These tests have shown that that it is possible to achieve a near-perfect
bond between the grid and the cementitious matrix so that the composite material will fail with
FRP rupture. However, failure of the grid is often premature because of local stress
concentrations.
In the mortar phase, mix designs that introduce fly ash and/or silica fume partly replacing the
cement in order to densify the microstructure result in higher bond strength between FRP
(textiles) and matrix [11]. Mortars can also contain chopped or milled fibres of different kinds.
If such a mortar is used together with an embedded reinforcement, improved bond is expected
because of the fibre interlock mechanism.
In recent years, micromechanically designed strain-hardening materials have been developed, in
which a tensile stress-strain behaviour analogous to that of metals has been achieved. Strain-
hardening cementitious composites (SHCC) are defined by an ultimate strength higher than their
first cracking strength and the formation of multiple cracking during the inelastic deformation
process [12]. However, the inelastic deformation behaviour of SHCC is based on the sequential
development of matrix multiple cracking while undergoing strain-hardening [13]. It is more

52
accurate to refer to the mechanism as pseudo strain hardening in order to differentiate it from the
“real” strain hardening observed in metals, that is based on dislocation micromechanics in the
plastic deformation regime.
The most typically used SHCC, the engineered composite (ECC) utilizes short, randomly
oriented polymeric fibres (e.g. polyethylene, polyvinyl alcohol) at moderate volume fractions -
typically less than 2% [13, 14]. ECC has been used in standalone and strengthening applications
where ductility is an important criterion. The pseudo strain-hardening behaviour of ECC has
been utilized as a mechanism to redistribute concentrated loading and thus prevent sudden
failure at critical structural connections where steel and concrete come into contact, i.e., shear
studs, fasteners or joints, where a steel beam meets an RC column in a hybrid structure [15]. The
high damage tolerance of ECC is valuable to the performance of a structure in terms of collapse
resistance, extension of service life, and minimization of repair after an extreme event [15] or
strengthening purposes. When used in combination with (steel) reinforcement, the tensile
ductility of the ECC matrix can on a macro scale, eliminate the strain difference between
reinforcement and matrix material [13].
5. LOAD-DEFORMATION RESPONSE OF CEMENTITIOUS COMPOSITES
5.1. Tensile response of cementitious materials
Cement-based composites can be conveniently classified according to their tensile response
[12]. The authors have compared the tensile behaviour of steel fibre reinforced concrete, textile
reinforced concrete (TRC), engineered cementitious composites (ECC), and steel-reinforced
ECC more in detail, based on the existing literature. Only a comparative figure is being
presented here (Figure 1) with brief explanations. The different stages are named in a way that
they mean the same for the different materials, so not all stages exist for all materials.
Quasi-brittle and ECC mortars used in the tests behave identical to the mortar components
shown in Figures 1a and 1c, respectively. During the formation of multiple, evenly distributed,
closely spaced, small cracks (Figure 1c), the ECC matrix shows an overall strain-hardening
behaviour, without definitely distinctive parts in the curve from cc to pc. After localization,
there is a gradually decreasing, softening range due to the fibre pullout mechanism.
ECC works well with regular steel reinforcement [16]. The hardening part of the load-
deformation curve of the steel reinforced ECC (R/ECC) is not as uniform as in plain ECC but
has a steeper and a gradually raising part, in accordance with the elastic stage/yielding of the
steel. In the inelastic deformation regime, where both components are yielding, cracking of the
ECC and yielding of the reinforcement are uniformly distributed over the length of the
specimen, until rupture of the steel. The hatched area in Figure 1d represents the contribution of
the ductile matrix compared to steel.
Finally, in TRC [17] where the FRP is linear elastic up to failure and the mortar (typically) is
quasi-brittle, the hardening part can be divided in two distinct parts as shown in Figure 1e. After
first crack formation, the load-deformation curve shows a small increase in loading capacity due
to the formation of additional transverse cracking. The member is softened by the formation of
additional crack(s) and the load increase per deformation increment is decreasing with each
crack until the stabilized crack pattern (II/b) is reached which is nearly linear.
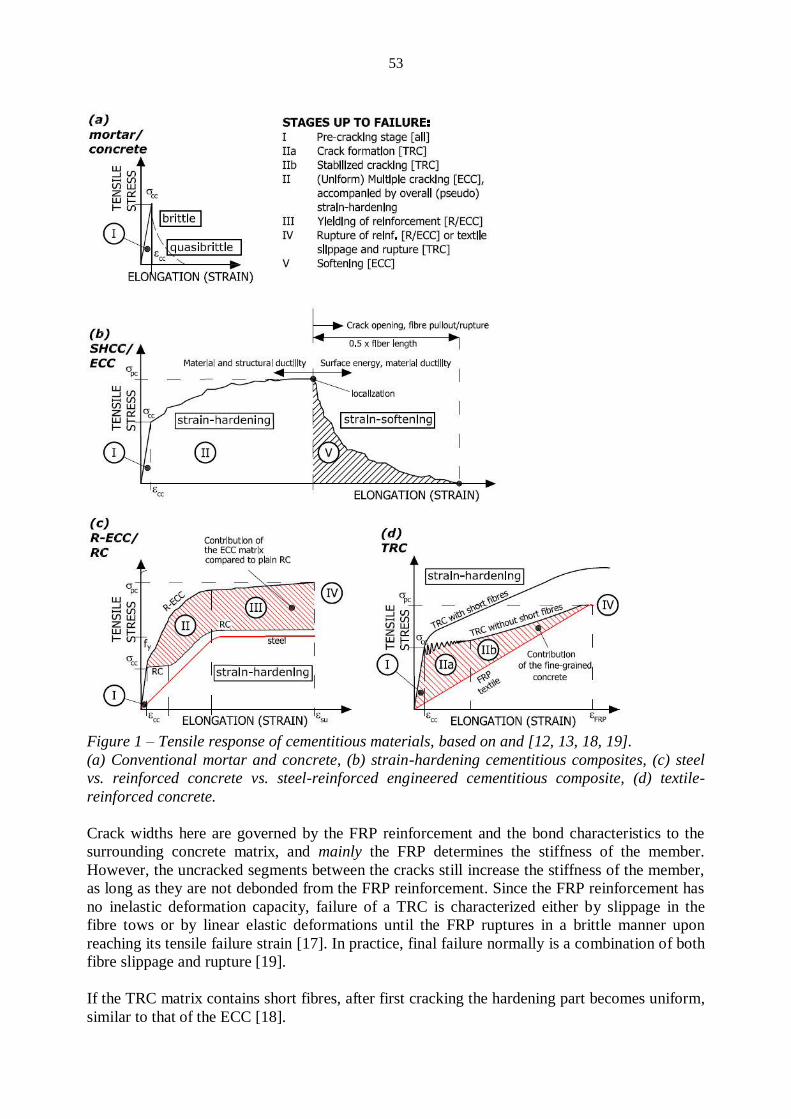
53
Figure 1 – Tensile response of cementitious materials, based on and [12, 13, 18, 19].
(a) Conventional mortar and concrete, (b) strain-hardening cementitious composites, (c) steel
vs. reinforced concrete vs. steel-reinforced engineered cementitious composite, (d) textile-
reinforced concrete.
Crack widths here are governed by the FRP reinforcement and the bond characteristics to the
surrounding concrete matrix, and mainly the FRP determines the stiffness of the member.
However, the uncracked segments between the cracks still increase the stiffness of the member,
as long as they are not debonded from the FRP reinforcement. Since the FRP reinforcement has
no inelastic deformation capacity, failure of a TRC is characterized either by slippage in the
fibre tows or by linear elastic deformations until the FRP ruptures in a brittle manner upon
reaching its tensile failure strain [17]. In practice, final failure normally is a combination of both
fibre slippage and rupture [19].
If the TRC matrix contains short fibres, after first cracking the hardening part becomes uniform,
similar to that of the ECC [18].

54
5.2. Tension stiffening effect
The contribution of a cementitious matrix to the load–deformation response in uniaxial tension
is generally described as tension-stiffening effect [20]. The response of the reinforced
cementitious composite is compared to that of the bare strengthening material (steel or FRP) and
the difference in load capacity is attributed to the tensile load carried by the cementitious matrix
between transverse cracks. The matrix contribution is most emphasized in steel reinforced ECC
(Figure1d), but also significant in textile reinforced concretes (Figure 1e).
6. EXPERIMENTAL PROGRAM
6.1. Materials
In the experimental program, two different CFRP grids and three types of mortars were used.
Material properties are listed in Table 1 (grids) and Table 2 (mortars).
Table 1 – Material properties of the grids used FRP
tested values
Spacing
L x T [mm]
ELt
[GPa]
ETt
[GPa]
fLt
[GPa]
fTt
[MPa]
εLt
[‰]
εTt
[‰]
small 24 x 25 79 51 988 740 12.5 14.0
medium 42 x 43 85.4 45 944 500 11.1 11.1
FRP supplier
data
Spacing
L x T [mm]
ELm
[GPa]
ETm
[GPa]
fLm
[GPa]
fTm
[MPa]
εLt
[‰]
εTt
[‰] small 24 x 25 262 289 4300 3950 15.0 14.9
medium 42 x 43 284 253 3800 3800 13.4 15.0
Table 2 – Material properties of the mortars used Material Ec [GPa] fcc [MPa] fct [MPa] w/c notes
M1 (from supplier) 26.5 53.2 9 0.16 -
M2 (from supplier) 35 77 2.8 -
ECC
(from earlier tests) 19 60 3 0.88
Fly ash 45 mass %;
PVA 0.01 mass %
The utilized grids are the C3000 A X1 grid (referred to as “medium grid”) and the C5500 A X1
grid (“small grid”) from Chomarat, U.S. Both grids are epoxy-coated with a fibre volume
percentage of 20-25%. We used two pre-mixed, commercially available mortars; StoCrete GM1
(M1) and StoCrete TS100 (M2), from Sto Scandinavia AB. These mortars are one-component,
high-strength, polymer-modified, quasi-brittle mortars with tensile strengths of 53.2 MPa (M1)
and 77.0 MPa (M2). M1 also has low fibre reinforcement content. The exact mortar
compositions or information on the fibrous component is not provided by the manufacturer.
The used primer (Table 3) is a one-component, cement-based and polymer-reinforced powder
mixed with water. It is used as a silt-up product on the roughened (sandblasted) concrete
surface. Its function is to enhance the bond in the transition zone.
Table 3 – Material properties and mixing ratio for the primer Density [kg/m3] dmax [mm] Mixing ratio, primer:water
Primer 2020 2 1:0.22

55
The third mortar tested is an ECC mix (“DTU ECO-3 M9 Melflux”) containing PVA fibres (1%
by weight, or 2% by volume) and a large portion (44% by weight) fly ash. Its tensile strength is
60 MPa. The exact mix composition is given in Table 4.
Table 4 – Mix composition of the ECC used
Material Fraction [mass %]
Cement (basic Portland) 22
Fly ash 44
Sand (<0.15mm) 8
Quartz powder 100/22 8
Water 18
Superplasticizer (Melflux) 0.02
PVA fibre (oiled) 1
6.2. Test matrix
With the three different mortars (M1, M2, ECC), two different grids (medium and small) and
three chosen grid configurations (0°, 90°, and 15° with respect to the applied tensile force), the
final test matrix consists of 13 different combinations, 3 specimens per each series, in total 44
specimens. The first five are dummies (2 x M1 without reinforcement, 2 x M1 with medium grid
longitudinal direction, and 1 x ECC medium grid longitudinal direction), followed by the 3x13
reinforced specimens. The tested combinations are summarized in Table 5.

56
Table 5 – Test matrix
Series
nr. Mortar
Grid
spacing
Grid
config.
Test specimen
No. of
specimens
1 M1 --- --- Dummy 2
2 M1 medium 0° Dummy
2
3 ECC medium 0° Dummy 1
4 M1 --- --- M1 reference 3
5 M2 --- --- M2 reference 3
6 M1 medium 0° M1-0-M 3
7 M1 small 0° M1-0-S 3
8 ECC medium 0° ECC-0-M 3
9 ECC small 0° ECC-0-S 3
10 M2 medium 0° M2-0-M 3
11 M1 medium 15° M1-15-M 3
12 M2 medium 15° M2-15-M 3
13 M2 small 15° M2-15-S 3
14 M1 medium 90° M1-90-M 3
15 M1 small 90° M1-90-S 3
16 M2 small 90° M2-90-S 3
6.3. Specimens
Earlier “dogbone” tests with textile reinforced concrete and a large-scale experiment were
described by [21], on 900 x 100 x 60 mm specimens with a 10mm thick web. Based on those
sizes, but considering that a typical MBC strengthening layer consists of two 10 mm thick layers
and a grid, new specimens were designed, as illustrated in Figure 2.
Figure 2 – Test specimen and reinforcement configuration

57
For brittle or quasi-brittle materials, the uniaxial tests are very sensitive, as an uncontrolled
deformation at cracking occurs despite the displacement control. In addition to that, the dogbone
geometry is very sensitive to cracks initiating towards the ends of the test field, where the thin
web meets the bulk end of the specimen. To prevent cracking in these areas, the optimal solution
would be a concave slant surface (a) or a specimen with 2-step slant surface (b) to minimize this
risk. Due to resources, simpler dogbone geometry was decided upon (c and d), with a total
length of 980 mm, and a web thickness of 20 mm.
The length of the test field was set to the longest possible so that it has a high crack potential;
yet short enough to be able to de-mould and handle the specimens without breaking them apart.
The final dimensions were set to 160 x 160 x 980 mm in order to meet the geometry of the
existing moulds, with a representative test section of 400 x 160 x 20 mm. The CFRP grid was
placed in the mid-plane of the specimen (Figure 2b) into the slits at the ends. Figure2e through
Figure 2h shows the different reinforcement orientations. The 30 x 30 mm wedged slits at the
end of each bulk can be used to glue some additional CFRP material to the reinforcement with
epoxy as extra anchorage in the case that bond slippage occurs prematurely. The end slits were
wedged, to ease the de-molding process. All specimens were de-molded after 24 hours except
for the unreinforced reference specimens and the ECC specimens, which were de-molded after
48 hours. All specimens were water cured for at least 28 days prior to testing.
6.4. Anchor clamp
The uniaxial test requires special devices for loading. The anchor clamp is the fixating
mechanism between the test machine and the test specimen. Its main purpose is to hold the
specimen fixed and centred, and to transfer the tensile force form the test machine evenly into
the specimen. It has joints in both planes parallel to the tensile force, to avoid any shear forces in
the specimens.
The clamps were designed based on combining multiple clamp designs detailed in [22], shown
in Figure 3. A combination of (b) and (d) has been chosen and custom-welded for this
experiment. From (b), the concept of two crossbars, transferring the force through a slant
surface, and from (d), the double joints were taken, in order to nullify any shear forces in the
web. However, in order to save space, the custom device had both joints working in the same
plane.
Figure 3 – Various tensile clamps for direct tensile testing [22]
Between the crossbars and the specimen, neoprene was used to distribute the forces evenly. The
main bulk of the specimen is in compression at all times during testing, which means that the

58
connection between the clamp and the specimen is less vulnerable to fracture. The clamp is self-
centring, since the crossbars are rotate-able and automatically wedge the specimen into the right
position. The side plates are also able to rotate, to help the easy mounting and demounting of the
specimens. The anchor clamps are shown in Figure 4.
Figure 4 – Custom-welded self-centring anchor clamps
6.5. Measurements and monitoring
The dogbone tests were run under displacement control at a rate of 0.6 mm/s. The load-
deformation behaviour was monitored within the representative test section, and recorded by a
data logger connected to the test machine. A digital image correlation system (ARAMIS from
GOM Optical Measuring Techniques, Germany) was also used to monitor deformations in the
test field. ARAMIS is a non-contact and material independent 3D optical measuring system,
which analyzes, calculates, and documents material deformations by means of recording and
calculating relative displacements of discrete points on a patterned surface. The ARAMIS
measurements were conducted primarily to monitor and analyze crack development and crack
widths. In addition, strain overlay photos were taken for illustrating crack development within
the test field.
7. EXPERIMENTAL RESULTS
7.1. Evaluation and presentation of test data
The specimens were compared by their load-deformation behaviour, first cracking strength,
failure load, mean number of cracks developed within the test field and average crack width.
The ARAMIS documentation consists of plots illustrating crack development (crack widths,
crack density) and elongations within the test field.
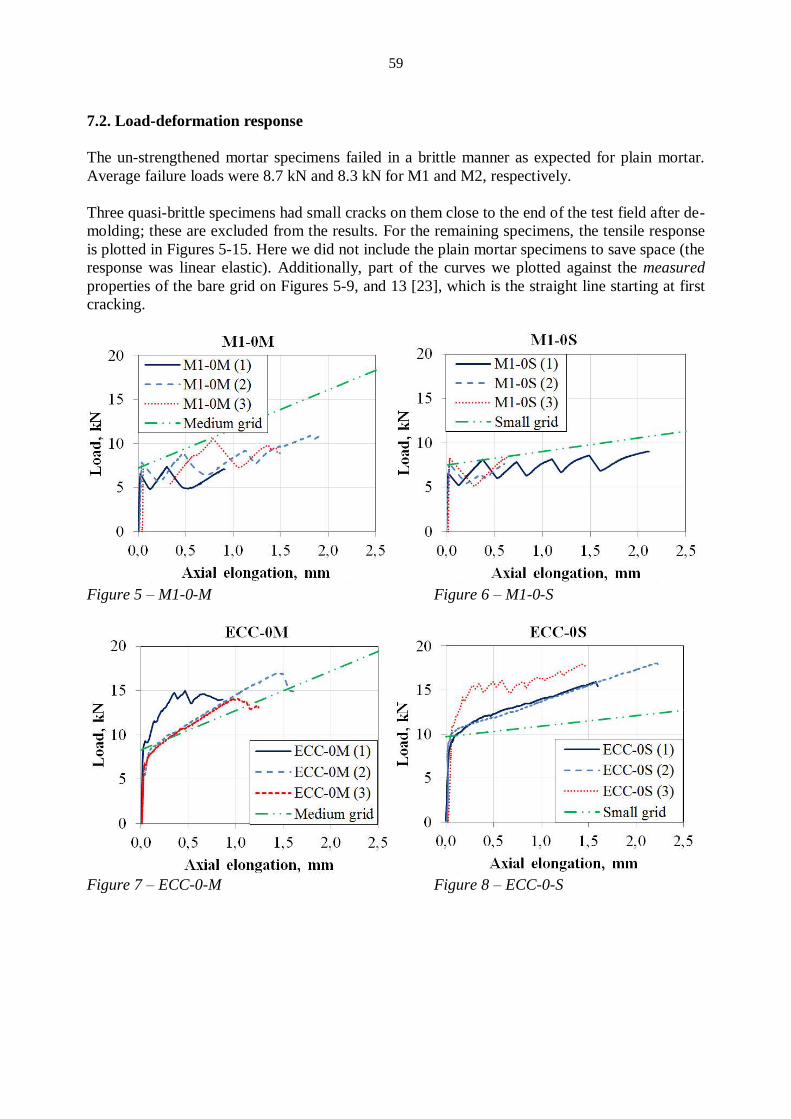
59
7.2. Load-deformation response
The un-strengthened mortar specimens failed in a brittle manner as expected for plain mortar.
Average failure loads were 8.7 kN and 8.3 kN for M1 and M2, respectively.
Three quasi-brittle specimens had small cracks on them close to the end of the test field after de-
molding; these are excluded from the results. For the remaining specimens, the tensile response
is plotted in Figures 5-15. Here we did not include the plain mortar specimens to save space (the
response was linear elastic). Additionally, part of the curves we plotted against the measured
properties of the bare grid on Figures 5-9, and 13 [23], which is the straight line starting at first
cracking.
Figure 5 – M1-0-M Figure 6 – M1-0-S
Figure 7 – ECC-0-M Figure 8 – ECC-0-S

60
Figure 9 – M2-0-M Figure 10 – M1-15-M
Figure 11 – M2-15-M Figure 12 – M2-15-S
Figure 13 – M1-90-M Figure 14 – M1-90-S

61
Figure 15 – M2-90-S
Parallel to the plots, Table 6 summarizes first cracking and failure loads, also including the plain
mortar specimens.
Table 6 – Results
Test specimen
Failure load
[kN]
First cracking
load
[kN]
Mean nr.
of cracks
Average crack
width [mm]
Min. expected load capacity
(grid only) [kN]
theoretical/measured
M1 reference 8.7 8.7 1 N/A N/A
M2 reference 8.3 8.3 1 N/A N/A
M1-0-M 9.2 7.2 2.3 N/A 14/22
M1-0-S 8.3 7.5 2.7 0.7 7/8.8
ECC-0-M 15.0 8.3 6.7 0.3 14/22
ECC-0-S 17.3 9.7 7.0 0.2 7/8.8
M2-0-M 11.9 6.8 2.3 0.7 14/22
M1-15-M 7.7 5.7 1.3 N/A N/A
M2-15-M 8.5 7.1 1.7 N/A N/A
M2-15-S 6.6 N/A N/A N/A N/A
M1-90-M 15.9 6.6 4.0 N/A 14/22
M1-90-S 8.9 7.4 4.3 0.6 9.8/8.1
M2-90-S 9.0 5.9 6.0 N/A 9.8/8.1
As a general remark, we can conclude that the there is a significant difference in the behaviour
of the quasi-brittle and “ductile” specimens after first cracking. Curves of quasi-brittle mortars
M1 and M2 are jagged and have a significant drop in load carrying capacity right after the first
crack (and after every further crack developing). Contrary to the quasi-brittle ones, the ECC
specimens after the first crack show a further load increase until the peak load. These curves are
smooth due to the fibre-bridging characteristics of the ECC. However, it has to be noted that
only a total number of six ECC specimens were tested, so our results are not conclusive.

62
First cracking strengths are slightly higher in the ECC specimens (8.3-9.7 kN) compared to the
quasi-brittle specimens (5.7-7.5 kN). In case of the ECC, it was difficult to determine, even from
the test data, when exactly the actual cracks form, because of the smooth transition between the
un-cracked and the cracked stage. Studying the load-deformation graphs of the ECC specimens
and applying tendency lines between the pre- and post-cracking stages, we approximated the
first cracking loads. It revealed that the initial cracking of the ECC does in fact occur at a later
stage than for the M1 and M2 specimens.
The most consistent behaviour we could observe in the M1-90-medium and M1-90-small
specimens. Interestingly, in both of the ECC series, we had one specimen behaving very
differently both in terms of first cracking load and stiffness (see discussion).
7.3. Comparative load-deformation plots
Specimens with similar grid size, and/or orientation have been paired and plotted in Figures. 16-
19. Figure 16 shows all medium grids when placed longitudinally, in different mortars. Figure
17 compares all transversally placed grids. Figure 18 shows the small grid placed longitudinally.
Finally, Figure 19 illustrates the effects of the (medium) grid orientation from 0° to 90° for one
quasi-brittle mortar (M1).
Figure 16 – Medium grid 0° Figure 17 – All 90° grids

63
Figure 18 – Small grid 0° Figure 19 – Medium grid 0°-15°-90°
From Figures 16-19 along with the individual plots against the bare grid (Figures 5-9) it can be
concluded that a significant and consistent tension-stiffening effect can only be shown for the
ECC, while there is only a slight to moderate increase in load capacity with the quasi-brittle
mortars. First cracking in ECC happens slightly later than in M1 and M2. In case of the small
grid (Figure 18), after first cracking, the load capacity does not increase significantly if we use
quasi-brittle mortars, while it does in the ECC-based specimens.
All 90 grids are plotted in Figure 17. The M1 mortar gave the most concise results, highest
failure loads, and largest deformations, while the most brittle mortar, M2 yielded the most
jagged and least concise results allowing very little deformations compared to any other
combinations.
Finally, Figure 19 illustrates the changes in stiffness and load capacity with the grid orientation
for the medium grid with the M1 mortar. Unexpectedly (and against the material data given in
Table 1), the transversally rotated grid showed to be the strongest, while the 15 grid the
weakest. In addition, the 90 medium grid combinations accommodated the largest elongations.
7.4. Crack widths, crack patterns
Figures 20-21 show two ARAMIS plots for the specimens M1-90-small and ECC-0-small. The
crack widths of the ECC specimens are very small, ranging from 0.20 mm to 0.40 mm of the
medium grid, and 0.08 mm to 0.50 mm for the small grid and they are not fully developed. In
addition to that, the cracks are more evenly distributed in the ECC. In contrast, the crack widths
determined by ARAMIS are ranging from 0.20 mm to 0.80 mm of the M1-90-small and
between 0.75mm and 1 mm for the M2-0-medium. “Average crack widths”, defined as the sum
of crack widths divided by the number of the cracks within the test field, are also given in Table
6, where available.

64
Figure 20 – Crack widths recorded by ARAMIS, M1-90-small
Figure 21 – Crack widths recorded by ARAMIS, ECC-0-small
7.5. ARAMIS “strain images”
The crack development was monitored by ARAMIS. The strain overlay images taken at the
moment of failure confirm the characteristic ductile behaviour of the ECC as it shows more
numerous, finer and more evenly distributed crack patterns compared to the quasi-brittle (M1
and M2) mortars. Where no strain images were available (Figure 22a, f, g and h), failure photos
are given. The cracks in all specimens developed in line with the grid tows.

65
Figure 22 – Crack development as documented by ARAMIS.
8. DISCUSSION
We can compare the behaviour of the composite with the tensile properties of the bare grid. The
specimens with the medium or small grid have 4 or 7 tows in the test section, respectively. The
load capacity of the bare grid can be calculated based on manufacturer data. For the medium
grid, it is 3.5 kN/tow in both directions, while for the small grid it is 1.4 kN/tow and 1.0 kN/tow
in longitudinal and transversal direction, respectively. Test data from Blanksvärd gave much
higher values [23]. Compared to these, the failure loads of the composite should be higher.
Examining the failure loads, however, we can conclude that with quasi-brittle mortars we get
significantly lower values (we do not even reach the nominal capacity of the grid) in all cases
except for the transversally placed medium grid. The ECC specimens exceed the manufacturer-
given grid failure loads, but still fall behind the tested values, suggesting premature failure of the
grid.
The most concise, and homogenous test series were M1-90-medium and M1-90-small, with
quasi-brittle, but fibre-reinforced mortars while the most scattered ones are the M2-series. The
significant differences within the same test series (in particular, M2-15-small and M2-90-small)

66
are attributed to micro-cracks developing during the de-molding process, due to the very fragile
geometry.
In case of the ECC, there is one specimen in both series showing a very different behaviour. One
possible explanation to this could be the way we mixed the mortars. We could only mix a very
small quantity in one batch because we used a dedicated mortar mixer with a limited capacity. It
is possible that there were some very slight changes in the fibre content (2 vol. %) and/or water-
to-cement ratios in the two separate mixes. Based on the known behaviour of the bare ECC
(Figure 1), we believe that ECC-0-medium (3) and ECC-0-small (3) should be cancelled out of
the results. The remaining specimens show a similar behaviour in terms of first cracking
strength and stiffness.
It was observed that the medium grid performs very differently depending on its orientation.
Two possible reasons for the “over-performance” of the medium grid when transversally placed
are (1) that the joints can deform more without fibre breakage in that direction. The grid joints
look and behave differently depending on the grid orientation; this is due to the “woven” nature
of the grid. (2) Another possible explanation is the additional anchorage provided by the epoxy
surplus, which for some reason is only present on the transversal fibre tows. In earlier tests by
[5] however, it was shown that sanding the grid (giving increased bond) creates stress
concentrations and premature rupture, therefore it cannot be stated that the additional anchorage
equals to increased load capacity. Further research is needed in this regard.
The 15° orientated specimens, compared to the longitudinally placed reinforcement, do not
develop as many cracks, and have a slightly reduced tensile strength. Cracks developing here
tend to follow the grid tows. Finally, the behaviour of the small is less direction-dependent than
that of the medium grid.
Some specimens initiated cracks near the ends of the test field. We attributed this to the fact that
the dogbone geometry is prone to initiating cracks near sharp changes in cross section because
of possible local stress concentrations. Using improved (curved) dogbone geometry, however,
would have made the testing procedure far more time consuming and expensive. The test setup
showed to be particularly sensitive to de-moulding, handling, and testing because of the very
thin test field.
In addition to the possibly too low curing time before de-molding, there is an initial curvature in
the grid strips because of the factory shape (roll). The grids were tensioned in the slits at both
ends before casting in order to reduce the curvature. Yet in such a thin cross-section, the effect
of the slightest curvature may be significant, and it might result in reduced performance. This
effect has not been investigated more in detail.
9. CONCLUSIONS
The goals of the experimental program have been fulfilled in great part. A wide scale of material
combinations has been tested, yet not all possible combinations. Adaptation of the dogbone
geometry to testing large MBC-specimens has been successful with some limitations. Most of
the specimens have been able to initiate cracks within the pre-defined test field, but an improved
geometry would yield results that are more concise.
Multiple cracking and a significant tension stiffening behaviour were observed when applying a
ductile, PVA-reinforced ECC as bonding agent, which, based on the two only test series, has

67
proven to be superior to quasi-brittle mortars. ECC has given significantly higher failure loads
and prevented pronounced drops in load capacity by its increased ductility. Recorded peak
values in the load-displacement curves show a more balanced behaviour for the ECC specimens.
The same plots for the quasi-brittle mortars are jagged indicating a more uneven stress
distribution and possible local failures in the grid joints. Typical brittle failure and
corresponding crack patterns were recorded in case of the quasi-brittle M1 and M2 mortars.
10. FURTHER RESEARCH
Quasi-brittle mortars rely on high bond strength between CFRP reinforcement and the mortar, to
accommodate the high internal stresses. Therefore, bond slip or local high stress concentrations
may result in failure of the grid joints. Using a mortar with improved ductile deformation
capabilities, where the CFRP reinforcement and the cementitious matrix deform close to
identically, results in a composite material where apparently high mechanical bond stresses in
local areas, as the grid intersections between the longitudinal and transversal tows are
significantly reduced, thereby preventing bond slip damage to the CFRP-reinforcement.
The high fly ash content of ECC results in a refined and densified grain structure. This may
improve the bond strength between the grid and the mortar, as confirmed by [11] for
yarns/textiles embedded in cementitious matrices. The apparently better bond characteristics of
ECC are also partly due to the compatible deformation behaviour between FRP reinforcement
and ECC, which makes ECC very attractive for further investigation in combination with FRP
grids.
Due to its pseudo strain hardening and fibre bridging properties, and for the additional
mechanical anchorage it provides for the FRP grid, ECC will be tested further as a bonding
agent for mineral-based strengthening. The different geometry (and associated rigidity, and
deformation capacity) of the grid joints in the two perpendicular directions could also be further
investigated, as this may have caused the significant “over-performance” of the medium grid in
transversal direction.
Finite element modelling of the interaction between grid and mortar would give a better
understanding of structural applications where mineral-based strengthening systems are subject
to tensional/splitting forces, or axial forces combined with bending.
ACKNOWLEDGEMENTS
The research work presented in this paper was performed at the Technical University of
Denmark and financed by the Norwegian Research Council through the strategic institute
program RECON at Norut Narvik Ltd. The ARAMIS equipment was acquired with support
from the Villum Kann Rasmussen Foundation. Sto Scandinavia should also be acknowledged
for supplying most of the strengthening material.
REFERENCES
1. Carolin, A., Carbon Fibre Reinforced Polymers for Strengthening of Structural
Elements, in Department of Civil and Mining Engineering2003, Luleå University of
Technology: Luleå, Sweden.

68
2. Täljsten, B., FRP Strengthening of Existing Concrete Structures. Design Guideline, 4th
Edition. 3rd Edition ed. 2006, Luleå, Sweden.
3. Triantafillou, T.C., Shear strengthening of reinforced concrete beams using epoxy-
bonded FRP composites. ACI Structural Journal, 1998. 95(2): p. 107-115.
4. Ohuchi, H., et al., Seismic strengthening design technique for existing bridge columns
with CFRP, in Proceedings of the Second International Workshop on Seismic Design
and Retrofitting of Reinforced Concrete Bridges1994: Queenstown, Nerw Zealand. p.
495-514.
5. Blanksvärd, T., Strengthening of concrete structures by the use of mineral based
composites, in Department of Civil and Environmental Engineering2007, Luleå
University of Technology: Luleå, Sweden.
6. Blanksvärd, T., B. Täljsten, and A. Carolin, Shear Strengthening of Concrete Structures
with the Use of Mineral-Based Composites. Journal of Composites for Construction,
2009. 13(1): p. 25-34.
7. Orosz, K., et al., From material level to structural use of mineral based composites – An
overview. Advances in Civil Engineering, 2010. 2010.
8. Hegger, J., et al., Load–bearing behaviour and simulation of textile reinforced concrete.
Materials and Structures, 2006. 39(8): p. 765-776.
9. Becker, D., Betongplattor förstärkta med kolfibrekomposit (in Swedish), in Division of
Structural Engineering2003, Luleå University of Technology: Luleå, Sweden.
10. Blanksvärd, T. and B. Täljsten, Strengthening of concrete structures with cement based
bonded composites. Journal of Nordic Concrete Research, 2008. 38: p. 133-153.
11. Soranakom, C. and B. Mobasher, Geometrical and mechanical aspects of fabric bonding
and pullout in cement composites. Materials and Structures, 2008. 42(6): p. 765-777.
12. Naaman, A.E. and H.W. Reinhardt, Characterization of high performance fiber
reinforced cement composites-HPFRCC, in Proceedings of High Performance Fiber
Reinforced Cement Composites 2 [HPFRCC 2]1995. p. 1-23.
13. Li, V.C. and G. Fischer. Reinforced ECC - An Evolution from Materials to Structures. in
Proceedings of the 1st FIB Congress. 2002. Osaka, Japan.
14. Kim, Y.Y., B.Y. Lee, and J.K. Kim, Evaluation of fiber dispersion of PVA-ECC, 2008,
ICCES. p. 167-172.
15. Stang, H. and V.C. Li, Classification of fibre reinforced cementitious materials for
structural applications, in 6th RILEM Symposium on Fibre-Reinforced Concretes (FRC)
- BEFIB 20042004: Varenna, Italy. p. 197-218.
16. Fischer, G. and V.C. Li, Influence of matrix ductility on tension-stiffening behavior of
steel reinforced engineered cementitious composites (ECC). ACI Structural Journal,
2002. 99(1): p. 104-111.
17. Brameshuber, W., Textile Reinforced Concrete: State-of-the-art report of RILEM
technical committee 201-TC, 2006, RILEM Publications.
18. Hinzen, M. and W. Brameshuber, Improvement of Serviceability and Strength of Textile
Reinforced Concrete by using Short Fibres, in 4th Colloquium on Textile Reinforced
Structures (CTRS4)2009: Dresden, Germany. p. 261-272.
19. Hegger, J. and S. Voss, Textile reinforced concrete under biaxial loading, in 6th Rilem
Symposium on Fibre Reinforced Concrete (FRC), BEFIB 20042004: Varenna, Italy. p.
1463-1472.
20. ACI 224.2R-92, 1992, American Concrete Institute.
21. Hegger, J., et al., Decentralized Wastewater Treatment Plants Made of Textile
Reinforced Concrete, in 12th International Techtextil Symposium for Technical Textiles,
Nonwovens and Textile Reinforced Materials 2003: Frankfurt, Germany. p. CD-ROM
nr. 4.28, 38pp.

69
22. Kanakubo, T., Tensile Characteristics Evaluation Method for Ductile Fibre-Reinforced
Cementitious Composites. Journal of Advanced Concrete Technology, 2006. 4(1): p. 3-
17.
23. Blanksvärd, T., Mechanical properties of different geometries of CFRP grid: tensile
evaluation of material properties, 2006, Luleå University of Technology: Luleå, Sweden.

70

71
Research Council and Editorial Board for Nordic Concrete Research
Prof. Dr. Olafur H. Wallevik, Chairman for the Research Council
Dr. Dirch H. Bager, Editor of Nordic Concrete Research
Danish
Concrete
Association
Dr. Dirch H. Bager
Lavendelparken 5
DK - 9310 Vodskov
Tel: +45 9829 2412
Mobile: +45 2049 7324 E-mail: [email protected]
Mr. Claus Pade
Concrete Centre,
Danish Technological Institute
Gregersensvej
DK - 2630 Taastrup Tel: + 45 7220 2183
E-mail: [email protected]
Finnish
Concrete
Association
Mr. Juha Valjus
Concrete Association of Finland
Unioninkatu 14 PL 381
FI - 00131 Helsinki
Tel: +358 41 533 6020 Mobile: +358
E-mail: [email protected]
Lic.Sc.Tech. Klaus Juvas
Consolis Technology
Box 72
FI – 21291 Rusko
Mobile: +358 40 5160 316 E-mail: [email protected]
Icelandic
Concrete
Association
Dr. Jón E. Wallevik Innovation Center Iceland
IS - 112 Keldnaholti
Tel: +354 522 9362
Mobile: +354
Fax: +354 522 9111
E-mail: [email protected]
Prof. Dr. Olafur H. Wallevik Innovation Center Iceland
IS - 112 Keldnaholti
Tel: +354 522 9000
Mobile: +354
E-mail: [email protected]
Norwegian
Concrete
Association
Dr. Terje F. Rønning
Heidelberg Cement NE / Cement
Product development & Implementation
P.O.Box 38
N - 3991 Brevik
Tel.: +47 3557 2347 Mobile: +47 9157 6046
E-mail: [email protected]
Prof. Dr. Mette R. Geiker
Division of Concrete Structures
Department of Civil Engineering
N - 7034 Trondheim
Tel: +47 7359 4529
Mobile: +47
E-mail: [email protected]
Swedish
Concrete
Association
Adjunct. Prof.,Tekn.Dr, Mikael Hallgren
Tyréns AB
Peter Myndes Backe 16
SE - 118 86 Stockholm
Tel: +46 104 522 351 Mobile: +46 70 661 05 33
E-mail: [email protected]
Tekn. Dr. Peter Utgenannt CBI Swedish Cement and Concrete Research
Institute
P.O. Box 857
SE - 501 15 Borås
Tel: +46 105 166 870
Mobile:+46 706 452 008
E-mail: [email protected]
18 November 2013

72

73
Active reviewers for Nordic Concrete Research as per December 2013
DENMARK
Dr. Dirch H. Bager
Dr. Mette Glavind
Prof., Dr. Per Goltermann
Mr. Oscar Klinghoffer
Prof., Dr. John Forbes Olesen
Mr Claus Pade
Prof., Dr. Eigil V. Sørensen
Prof., Dr. Jens Peder Ulfkjær
FINLAND
Dr. Klaus Juvas
Dr. Matti V. Leskala
Prof., Dr. Jussi Mattila
Dr. Jouni Punkki
Mr Juha Valjus
ICELAND
Mr. Einar Einarsson
Mr. Haukur J. Eiriksson
Dr. Gisli Gudmundsson
Mr. Karsten Iversen
Mr. Torfi G. Sigurdsson
Mr. Sveinbjörn Sveinbjörnsson
Dr. Jon E. Wallevik
Prof., Dr. Òlafur H. Wallevik
Prof., Dr. Børge J. Wigum
NORWAY
Dr. Helge Brå
Ms. Danielle Bosnjak
Mr. Anton Gjørven
Mr. Steinar Helland
Dr. Bernt Jacobsen
Prof., Dr. Terje Kanstad
Dr. Terje F. Rønning
Mr. Tor Kristian Sandaker
Mr. Sverre Smeplass
Mr. Hans Stemland
SWEDEN
Prof., Dr. Anders Ansell
Dr. Thomas Blanksvärd
Prof. Lennart Elfgren
Prof., Dr. Mats Emborg
Prof., Dr. Kent Gylltoft
Prof., Dr. Mikael Hallgren
Prof., Dr. Jan-Erik Jonasson
Prof., Dr. Björn Lagerblad
Prof., Dr. Karin Lundgren
Prof., Dr. Tang Luping
Prof., Dr. Per-Erik Petersson
Prof., Dr. Johan Silfwerbrand
Dr. Peter Utgenannt

74