north america’s leading transit bus and motor coach ... · offer the industry’s widest range of...
TRANSCRIPT

0
Forward Looking Statements and Non-GAAP Measures are defined in APPENDIX B.
NFI Investor Update Q2 -2016North America’s leading Transit Bus and Motor Coach Manufacturer and Parts Distributor
August 11, 2016

1
NFI Investment Thesis
Leading Share in Diversified
Markets
� North Americas’ #1 heavy duty transit bus brand, #1 motor coach brand and #1 aftermarket parts and service supplier
� >70,000 vehicles (transit buses and motor coaches) currently in service with~50% share of Canadian and US installed base
Deep Relationships
with High Quality Customer Base
� Founded in the 1930’s, NFI and MCI have established relationships with well nearly all domestic transit authorities and specifically 24 out of 25 of the largest agencies operate New Flyer, NABI, Orion or MCI buses or motor coaches
� Strong reputation and long standing relationship with hundreds of motor coach operators in Canada and US operating MCI or SETRA motor coaches
BroadProduct Offering with Technology
Leadership
� Leading in-house engineering and new product development capability� Integrated aftermarket parts and services operation� Compliant with Buy-America and policies regarding Canadian content� Offer the industry’s widest range of green propulsion options: diesel, natural
gas, electric trolley, diesel-electric hybrid, and now battery-electric
Experienced Team poised for
Growth & Diversification
� Successful track record of positioning the business for growth and increased profitability
� Extensive LEAN transformation and OpEx experience with proven ability to complete accretive acquisitions and achieve synergies
Strong Financial metrics
� Proven financial performance and low leverage. � Strong/Predictable cash flow to support rapid deleveraging and dividends
+

2
Company Overview
• North America’s #1 Transit Bus & Motor Coach manufacturer and parts supplier with the leading installed base of ~50% of transit buses and motor coaches currently in service (~70,000 buses)
• Public company with combined growth and yield focus. Significant Shareholders: Marcopolo S.A. =18.6%, Management/Board =1.9%).
• Fully Diluted Market Cap: ~$C 2.6B. ~ 5,000 employees in Can/US
Q2-16 LTM Highlights:
Revenue: US $1.92 B
Adj EBITDA: US $229.3 M
Return on Sales: 11.9%
Net Debt: $573 M
Leverage: 2.21 (Converts treated as Equity)
ROIC: 14.0%
FCF: US $156.3 M
Payout Ratio: 22.0%
Bus Backlog:
Firm : 3,035 EUs, $1.6 B
Options : 6,975 EUs, $3.6 B
LTM Book to-Build Ratio: 159%
Common Share (TSX:NFI)
Shares Outstanding: 59.9M
60-day average Daily Volume: ~ 305K
Dividend = C$0.95/share (1), Yield: ~2.3%(3)
TSR(2): 2016 YTD = 48% 2015 =115%
(1) Effective May 12, 2016 the Dividend increased from C$0.70 to C$0.95 per share annually.(2) Total Shareholder’s Return (“TSR”) is calculated by the growth in capital assuming the dividends are reinvested each time they are paid.(3) Calculated using closing TSX market price as at August 5, 2016
Convertible Debt (TSX:NFI.DB.U)
Principal Outstanding: US $25.8 M
60-day average Daily Volume: ~US $280K
Coupon: 6.25%, Yield: ~ 2.0%(3)
Dec 18-15: NFI added to S&P/TSX Composite Index Mar 14-16: NFI added to S&P/TSX Equal Weight Industrials Index Mar 11-16: NFI Equity Options commenced trading on Montreal Exchange
3
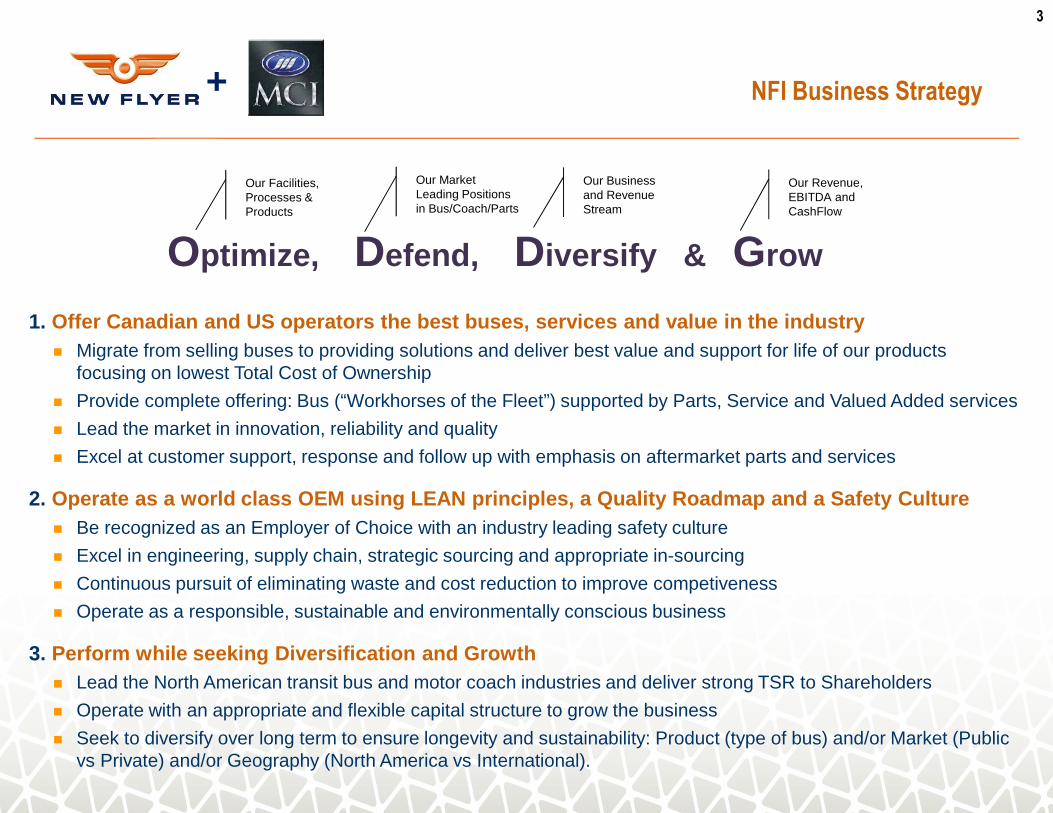
NFI Business Strategy
1. Offer Canadian and US operators the best buses, ser vices and value in the industry� Migrate from selling buses to providing solutions and deliver best value and support for life of our products
focusing on lowest Total Cost of Ownership
� Provide complete offering: Bus (“Workhorses of the Fleet”) supported by Parts, Service and Valued Added services
� Lead the market in innovation, reliability and quality
� Excel at customer support, response and follow up with emphasis on aftermarket parts and services
2. Operate as a world class OEM using LEAN principles, a Quality Roadmap and a Safety Culture� Be recognized as an Employer of Choice with an industry leading safety culture
� Excel in engineering, supply chain, strategic sourcing and appropriate in-sourcing
� Continuous pursuit of eliminating waste and cost reduction to improve competiveness
� Operate as a responsible, sustainable and environmentally conscious business
3. Perform while seeking Diversification and Growth� Lead the North American transit bus and motor coach industries and deliver strong TSR to Shareholders
� Operate with an appropriate and flexible capital structure to grow the business
� Seek to diversify over long term to ensure longevity and sustainability: Product (type of bus) and/or Market (Public vs Private) and/or Geography (North America vs International).
+
Our Facilities, Processes & Products
Our Market Leading Positions in Bus/Coach/Parts
Our Business and Revenue Stream
Our Revenue, EBITDA and CashFlow
Optimize, Defend, Diversify & Grow

4
663.6
136.9
--
100.0
200.0
300.0
400.0
500.0
600.0
700.0
Aug-12 Aug-13 Aug-14 Aug-15 Aug-16
Tot
al R
etur
n
NFI Strategic Plan and Execution has delivered solid TSR
Total Shareholder Return (1)
S&P/TSX Composite
Investment
Source: FactSet, Company filings
1. Total shareholder return includes capital appreciation and dividends paid.2. Calculated using closing TSX market price as at August 7, 2016
� NFI's first acquisition enhanced part fabrication capability and capacity
� 19.9% equity investment in NFI by a leading global bus and coach bodymanufacturer
� NFI acquired Orion’s parts business from Daimler
� NFI acquired US manufacturer of heavy-duty transit buses and parts distributor
� NFI acquired North America’s leading manufacturer of motor coach and parts/service support
� Adopted Stakeholder Model.
� Commitment to Culture, People & LEAN operations
� Migrated Capital Structure from Income Deposit Security (yield only focus) Common Share (Growth and Yield)
Cultural & Structural Change
Strategic Acquisition's

5
#1 Market Share in Transit Bus
HD Transit Bus Share (2015 market is ~5,300 units)
Heavy-Duty: Xcelsior ® Medium-Duty: MiDi ®
� Launch in 2009 based on >20 years experience with low floor transit buses
� Offered in 35’, 40’, and 60’ lengths� Primary targets is metropolitan & urban fleets� Typical sale price of approx US $450K for 35’/40’ and
US $700K for 60’ articulated
� JV with Alexander Dennis (UK) to introduce MiDi® to North America in 2014
� 30’ and 35’ low-floor medium duty bus, tested to HD standards. Primary target is municipal/ & commercial shuttles
� Typical sale price of approx US $300K
Active Canada/US HD Transit Bus Coach Fleet ~85,000
19%
33%
45%
3%
Source: New Flyer Database & Management Estimates
Average Age of the HD Transit Fleet: US = 7.8 years, Canada = 7.3 yearsSource: APTA Public Transportation Factbook 2016
Orion Parts and NABI acquired by NFI in 2013

6
MetropolitanFleets
17 operators39% of installed fleet
Urban Fleets
200 operators45% of installed fleet
MunicipalFleets
900+ Operators16% of installed
fleet
Transit Bus Market Segments in Canada and US
Source: New Flyer Database & Management Estimates
Transit Market Segments and primary targets
24 of the 25 largest Transit Agencies operate NF supported transit buses
New market entrants focusing only on battery-electric buses:

7
#1 Market Share in Motor Coaches
Motor Coach Share: 2015 market is ~2,265 units
38%
29%
24%
9%
50% 1% 26% 23%
New Coach – Private New Coach – Public Pre-Owned Coac h
� Targets the mid-range to luxury segments
� J Model is the #1 selling coach in the N.A. private market
� NA Distributor of Daimler’s SETRA coaches
� Tour and charter operators
� Hotels and casinos
� Inter-city line-haul operators
� Contract carriers
� Targets the mid-range segment
� “Buy America” compliant
� D Model is the #1 selling coach of all time in N.A.
� Transit authorities
� Universities
� U.S. Federal Government
� Correctional facilities
� Trade-in option to support new coach sales
� Coaches are refurbished at MCI’s service centers and various 3rd parties
� Value customers in the private market
� Small private fleets
� MCIU sells approx 350 pre-owned units annually
Active Canada/US Motor Coach Fleet ~55,500 units
Netherlands & Macedonia
Canada & US
Turkey
Source: MCI Database & Management Estimates
Average Age of the Motor Coach Fleet: US and Canada = 9 yearsSource: ABA Motorcoach Census March 2015

8
Motor Coach Market in Canada and US
Market Segments and primary targets
Transit
12% of installed fleet
Fixed Route/Line Haul
34% of installed fleet
Tour & Charter
52% of installed fleet
Conversion
2% of installed fleet
Public Private Private Private
Source: MCI Database & Management Estimates
Private Market Segment Definitions

9
Annual Deliveries and Market Demand
Transit Bus EUs delivered in Can/US Motor Coaches delivered in Can/US
+
Public Bid Universe & Active Opportunities (EUs) 2 009-2016
NFI forecasted EU buys in next 5 years
Bids submittedby NFI and EUs awaiting selection
Operator RFPs Issued. EUs for Proposals in development
Source: MCI Database & Management Estimates
US Federal Funding for Transportation
935
1,05
0
1,50
0
1,86
4
2,05
1
1,27
2
1,73
1
1,93
8
1,58
3
1,44
2 2,00
3
2,16
4
2,25
7
2,02
3
1,81
1
1,65
6 2,19
1
2,43
7
2,45
1
4,79
7 5,34
7
5,81
6
6,23
6
5,38
8
5,00
9
4,72
3 5,21
2
4,33
3
4,04
7
5,06
5
5,28
4 6,03
2
5,93
3
5,15
4
5,10
9
5,01
0
5,12
8
5,37
3
0
1000
2000
3000
4000
5000
6000
7000
1,49
2
1,86
2
1,76
7
1,19
0
1,47
9
1,51
4
1,02
2
753
1,05
0
1,29
2
1,05
6
1,01
2
811
633
592
686
821
802
856
2,48
5 2,99
0
2,82
4
2,38
1
2,33
0
2,04
8
1,47
5
1,34
3
1,75
2
2,09
9
1,85
2
1,82
0
1,58
4
1,20
8
1,54
3
1,56
6
1,77
3
1,92
6
2,31
1
0
1000
2000
3000
4000
5000
6000
7000
TotalIndustry
Total Industry

10
Public Customers Book-to-Bill and Backlog
Book-to-Bill >100% for 13 of last 14 Quarters
Total Backlog (Firm and Options)
Note: US Customer deferred Order was removed from backlog IN 2013 following 5 years of inaction.
+
Includes MCI backlog

11
Most comprehensive Parts & Support Services in the industry
Aftermarket Parts Product Support Services
� Widest transit bus and motor coach product assortment and industry leading distribution network with shortest delivery times.
� Added value through Unique offerings (Kits, Mid-life upgrade programs, Vendor Managed Inventory, KanBan, etc).
� Publications: Wide range of customized parts, maintenance and operational documentation. New Flyer publications are the industry standard.
� Field Support: Product acceptance, field support, field engineering and warranty management.
� Training: Operator and maintenance training provided in connection with new bus sales or aftermarket support (On-the-job, Classroom, eLearning, etc.).
� New Flyer Connec t: On-board system that permits real-time monitoring of the bus driver and vehicle performance to help improve driver safety, driving efficiency, and reduce fuel use and maintenance costs
� MCI Service Centers: Nationwide footprint with service centers, distribution facilities and over 3,000 emergency response partners
+

12
Manufacturing, Parts & Service Footprint
`
FL
AL
TX
CA
NDMN
IL IN OH
KY
WV
PA
NY
NJ
SK MB
ONQC
ABRenton, WA
NFI Service Center
Fresno, CANFI Parts Distribution
Ontario, CANFI Completion & Service Center
Crookston, MNNFI Bus Completion
St Cloud, MNNFI Bus Manufacture
Anniston, ALNFI Bus Manufacture
Elkhart, INTCB Part Fabrication
Hebron, KYNFI Parts Distribution
Delaware, OHNABI Parts Distribution
Brampton, ONNFI Parts Distribution
Arnprior, ONNFI Service Center
NFI - Winnipeg, MBParts Fabrication and Bus Shell Assembly
New Product DevelopmentParts Distribution
MCI - Winnipeg, MBParts Fabrication, MCI D Model Shell Assembly
Complete J Model manufactureNew Product Development
Montreal, PQMCI Service Center
Blackwood, NJMCI Service Center
East Brunswick, NJMCI Parts Distribution
Winter Garden, FLMCI Service Center
Dallas, TXMCI Service Center
Los Alamitos, CAMCI Service Center
Louisville, KYMCI Parts DistributionPembina, ND
MCI D Shell Completion
Des Plaines, ILMCI Service Center
Winnipeg, MBFrank Fair Fiberglass
Fabrication
+

13
Environmental Commitment: Green Propulsion Options
Natural GasClean Diesel Hybrid-Electric Battery-ElectricElectric-Trolley
+
Clean Diesel
Natural Gas
Electric Trolley
Hybrid Electric
All Electric
Xcelsior
MiDi
D Model
J Model
Additional propulsion options currently being evaluated for NFI MiDi and MCI J Model

14
Financial Performance
Sales ($M US)
Adj EBITDA ($M US)
Return on Invested Capital
ROIC = Net operating profit after taxAverage invested capital for the period
+
4164 57
90
159
20
31 50
61
70
0
50
100
150
200
250
2012 2013 2014 2015 2016 Q2 LTM
Bus Aftermarket
61
95107
151
229
746984
1,132 1,217
1,561119
215
319322
363
0
500
100 0
150 0
200 0
250 0
201 2 201 3 201 4 201 5 201 6 Q2 LTM
Bus Aftermarket
865
1,199
1,451 1,539
1,924
547.6 641.5 706.6 712.0957.9
6.2%
8.6%
8.5%
12.2%
14.0%
0.0%
2.0%
4.0%
6.0%
8.0%
10.0%
12.0%
14.0%
0
200
400
600
800
1000
1200
2012 2013 2014 2015 2016 Q2 LTM
Millio
ns
Average Invested Capital for the period Return on Invested Capital
17 16 14 14 15 1824
37
2027 26
35 3139 36
45
68
80
75 7163 62 60 62
72
95 99108 109 107
119
131142
151
188
229
$0
$20
$40
$60
$80
$100
$120
$140
$160
$180
$200
$220
$240
2012 2013 2014 2015 2016
Adjusted EBITDA USD
Adjusted EBITDA LTM Adjusted EBITDA
Mil
lio
ns
Quarterly Adj EBITDA ($M US)

15
Cash Flow Performance
Free Cash Flow and Dividends ($M C)
2016 Q2 LTM Adjusted EBITDA to Free Cash Flow ($M)
229.3
20.3
39.2 11.1 2.5
156.3
35.6 191.9
-
50
100
150
200
250M
illio
ns
+
27.145.1
65.5
108.3
191.9
33.1 30.7 32.5 33.8 42.20.0
50.0
100.0
150.0
200.0
250.0
2012 2013 2014 2015 2016 Q2 LTM
Free Cash Flow Dividends
NFI Annual Dividend
Increased 35.7% from $.70/share to $.95/share
on May 12, 2016 (now paid quarterly)

16
Debt and Total Leverage
0
0.5
1
1.5
2
2.5
3
3.5
$0
$100
$200
$300
$400
$500
$600
$700
$800
$900
$1,000
2010 2011 2012 2013 2014 2015 2016
Q2
IDS Debt Bachelor Bonds Senior Term Loan
Revolver Convertible Debenture Total leverage ratio
$26M Convertible Debenture issued in Jun-12 @ 6.25%. Convert price $US10/share
$343M Revolver facility used to manage working capital fluctuations ($91M outstanding)
$482M Senior secured term loan
Total Leverage Ratio does not include Convertible Debenture as debt.
Under NFI Senior Credit Agreement Total Leverage must be maintained
below 4X Adj EBITDA Total Debt ($US M) Total Leverage Ratio
+
17
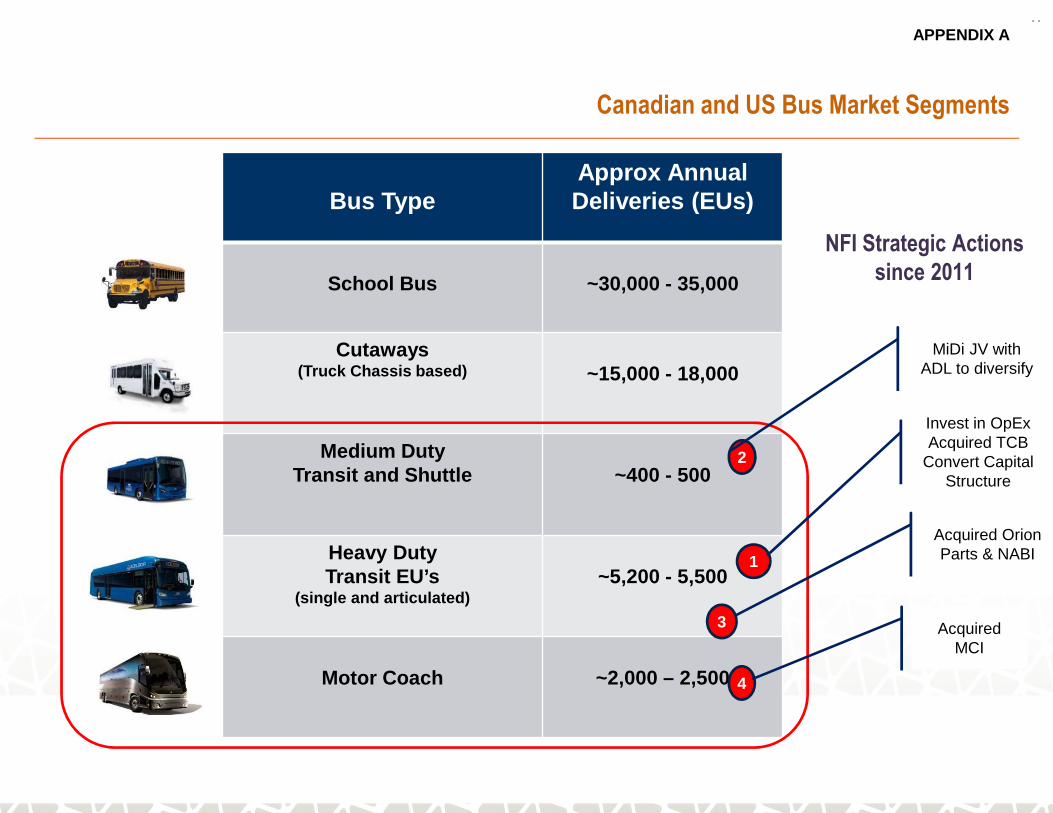
NFI Strategic Actionssince 2011
Bus TypeApprox Annual Deliveries (EUs)
School Bus ~30,000 - 35,000
Cutaways(Truck Chassis based) ~15,000 - 18,000
Medium DutyTransit and Shuttle ~400 - 500
Heavy DutyTransit EU’s
(single and articulated)~5,200 - 5,500
Motor Coach ~2,000 – 2,500
2
MiDi JV with ADL to diversify
1
Invest in OpEx Acquired TCB
Convert Capital Structure
3
Acquired Orion Parts & NABI
4
Acquired MCI
Canadian and US Bus Market Segments
APPENDIX A

18
FORWARD LOOKING STATEMENTS
This investor presentation contains forward-looking statements relating to expected future events, including the integration of the acquired business into New Flyer’s existing business and expected synergies, the
diversification and growth of the combined bus and aftermarket parts businesses. Although the forward-looking statements contained in this investor presentation are based upon what management believes to be
reasonable assumptions, investors cannot be assured that actual results will be consistent with these forward-looking statements, and the differences may be material. Actual results may differ materially from
management expectations as reflected in such forward-looking statements for a variety of reasons, including risks related the ability to implement the operational changes necessary to achieve the intended
synergies, acquisitions, joint ventures and other strategic relationships with third parties (including liabilities relating thereto), the covenants contained in the Company’s new senior credit facilities could impact the
ability of the Company to fund dividends, market and general economic conditions and economic conditions of and funding availability for customers to purchase buses and to purchase parts or services, customers
may not exercise options to purchase additional buses, the ability of customers to suspend or terminate contracts for convenience and the other risks and uncertainties discussed in the materials filed with the
Canadian securities regulatory authorities and available on SEDAR at www.sedar.com. Due to the potential impact of these factors, the Company disclaims any intention or obligation to update or revise any forward-
looking statements, whether as a result of new information, future events or otherwise, unless required by applicable law.
FINANCIAL TERMS, DEFINITIONS AND CONDITIONS
References to “EBITDA” are to earnings before interest, income taxes, depreciation and amortization, fair value adjustment for total return swap and unrealized foreign exchange losses or gains on non-current
monetary items. References to “Adjusted EBITDA” are to EBITDA after adjusting for: the effects of certain non-recurring and/or non-operations related items that have impacted the business and are not expected to
recur, including non-recurring transitional costs relating to business acquisitions, product rationalization costs, impairment loss on equipment and intangible assets, realized investment tax credits (“ITCs”), equity
settled stock-based compensation, past service costs, fair value adjustment to MCI’s inventory and deferred revenue, proportion of the total return swap realized, loss on derecognition of long-term debt and costs
associated with assessing strategic and corporate initiatives. Return on Invested Capital “ROIC” is calculated by dividing Net Operating Profit After Tax by Average Invested Capital for the period. References to “Net
Operating Profit After Tax” are to Adjusted EBITDA less depreciation of plant and equipment and income taxes. References to “Invested Capital” are to shareholders’ equity plus long-term debt, obligations under
finance leases, other long-term liabilities, convertible debentures and derivative financial instrument liabilities less cash.
Management believes EBITDA, Adjusted EBITDA, ROIC and Free Cash Flow (as defined below) are useful measures in evaluating the performance of the Company. “Free Cash Flow” means net cash generated by
operating activities adjusted for changes in non-cash working capital items, interest paid, interest expense, income taxes paid, current income tax expense, effect of foreign currency rate on cash, past service costs,
defined benefit funding, non-recurring transitional costs relating to business acquisitions, costs associated with assessing strategic and corporate initiatives, product rationalization costs, defined benefit expense,
cash capital expenditures, realized ITCs, fair value adjustment to MCI’s inventory and deferred revenue, proportion of the total return swap realized and principal payments on capital leases. However, EBITDA,
Adjusted EBITDA, ROIC and Free Cash Flow are not recognized earnings measures and do not have standardized meanings prescribed by IFRS. Readers of this presentation are cautioned that EBITDA, and
Adjusted EBITDA should not be construed as an alternative to net earnings or loss determined in accordance with IFRS as an indicator of New Flyer's performance, and Free Cash Flow should not be construed as
an alternative to cash flows from operating, investing and financing activities determined in accordance with IFRS as a measure of liquidity and cash flows. A reconciliation of net earnings and cash flow to EBITDA
and Adjusted EBITDA, based on the Financial Statements, has been presented In Management’s Discussion and Analysis of Financial Condition under the heading “Reconciliation of Net Earnings to EBITDA and
Adjusted EBITDA” and “Reconciliation of Cash Flow to EBITDA and Adjusted EBITDA”, respectively. A reconciliation of Free Cash Flow to cash flows from operations is provided under the heading “Summary of
Free Cash Flow”.
New Flyer’s method of calculating EBITDA, Adjusted EBITDA, ROIC and Free Cash Flow may differ materially from the methods used by other issuers and, accordingly, may not be comparable to similarly titled
measures used by other issuers. Dividends paid from Free Cash Flow are not assured, and the actual amount of dividends received by holders of Shares will depend on, among other things, the Company's financial
performance, debt covenants and obligations, working capital requirements and future capital requirements, all of which are susceptible to a number of risks, as described in New Flyer’s public filings available on
SEDAR at www.sedar.com.
All figures are in U.S. dollars unless otherwise noted.
FORWARD LOOKING STATEMENTS, FINANCIAL TERMS, DEFINITIONS AND CONDITIONS
APPENDIX B
+