north dakota department of mineral resourceshotels 2013-2015 - apartments 2016-2017 - single family...
TRANSCRIPT

600 East Boulevard Ave. - Dept 405 Bismarck, ND 58505-0840
(701) 328-8020 (701) 328-8000
North Dakota Department of Mineral Resources
http://www.state.nd.us/ndgs http://www.oilgas.nd.gov

Wells 12,864 active 2,751 conventional 10,113 Bakken/Three Forks 848 waiting on completion 1,999 permitted 10,068 increased density approved 25,779 total

Vern Whitten Photography 6 wells producing - drilling 7-12 - and 13-18 coming soon
Phase 3 “Harvest” 6 – 32 wells per spacing unit


Well density and timing are the big questions

Well density and timing are the big questions
Source: Continental Resources

0
500
1000
1500
2000
2500
3000
1945 1950 1955 1960 1965 1970 1975 1980 1985 1990 1995 2000 2005 2010 2015 2020
North Dakota Industrial Commission Cases Heard
2009/2010 level
10,049 increased density wells approved

0
500
1000
1500
2000
2500
3000
3500
1950 1955 1960 1965 1970 1975 1980 1985 1990 1995 2000 2005 2010 2015 2020
North Dakota New Well Permits Issued
2011/2012 level
1,999 permits approved

0.5
0.8
1.1
1.4
1.7
2
0
50
100
150
200
250
1975 1980 1985 1990 1995 2000 2005 2010 2015 2020
Rig
sNorth Dakota Average Monthly Rig Count
Rig Count ND Sweet Oil Price Spuds / Month / Rig
2009 level
In 2009 each rig drilled 8-10 wells per year In 2015/2016 each rig can drill 20-24 wells per year

1400
511
17912598 79 66 60 54 51 49 46 44 42 40 38 36 34 32 31 29 28 26 25 24 22 21 20 19 18 17 17 16 15 14 13 13 12 12 11 10
0
200
400
600
800
1000
1200
1400
1600
0 5 10 15 20 25 30 35 40 45
Bar
rels
of O
il pe
r Day
Year
Typical Bakken Well Production
Initial Production & Estimated Ultimate Recovery up 20% Well cost down 11% Operating costs down 15% Total reduction so far 26% Oil Price down 51%
July 2015

$0$15$30$45$60$75$90$105$120$135$150$165$180$195
0100,000200,000300,000400,000500,000600,000700,000800,000900,000
1,000,0001,100,0001,200,0001,300,000
1970
1975
1980
1985
1990
1995
2000
2005
2010
2015
2020
ND
Sw
eet $
/BO
BO
PDNorth Dakota Daily Oil Produced and Price
BOPD $/BO

0
250,000
500,000
750,000
1,000,000
1,250,000
1,500,000
1,750,000
2,000,000
2,250,000
2,500,00019
70
1975
1980
1985
1990
1995
2000
2005
2010
2015
2020
2025
2030
2035
2040
2045
2050
2055
2060
2065
2070
2075
2080
2085
2090
2095
2100
Bar
rels
per
Day
North Dakota Oil Production
History Peak Production Estimate Current ND Revenue Estimate Current Production Limited-No Drilling
G1 G3 G2 G4 G5 Reclaim
EOR? +++

Brent Q3 2014 $97.00>today $47.60

Storage East Coast 16 of 20=80% Cushing 57 of 70=81% Permian 83 of 120=69% Gulf Coast 225 of 395=57% Rockies 22 of 40=55% West Coast 52 of 100=52% Total US 455 of 735=62% Normal 360 of 735=49%
Brent $47.60 - WTI $44.25 = (-)$3.35

-$8=(-)18%
WTI $44.25 – ND Sweet $29.75 = (-)$14.50

165 Rigs out of 183 In the core area November 2014

Bottineau (2) Burke (1)
Divide (2)
Williams (13)
Mountrail (14)
McKenzie (27)
Dunn (11)
Stark (1)
Bowman (1)
65 Rigs out of 73 September 2015

0
10000
20000
30000
40000
50000
60000
70000
0
50
100
150
200
250
2005 2010 2015 2020 2025 2030 2035 2040 2045 2050
Year
North Dakota Rigs and Wells
Rigs Wells

0
20,000
40,000
60,000
80,000
100,000
120,000
140,000
160,000
2005 2010 2015 2020 2025 2030 2035 2040 2045 2050
Jobs
Year
North Dakota Oil Industry Jobs
Prod jobs Gathering jobs Fracing jobs Drilling jobs

0 10 20 30 40 50 60 70 80 90 100 110 120 130 140 150 160 170 180 190 358 540 2191 Day
Truc
kloa
ds
0
10
20
30
40
Drilling Preparation = 25 loads (3 days total)
Fracturing Phase – (800 loads) 600 loads water + 200 loads sand per well = (15 day average) Some are 0 with fresh and salt water pipelines
Wait for Frack (90-120 days)
Production Equipment (14 loads over 150 days)
Pit Reclamation (25 total truckloads)
Location & Production Prep Completed with first well. No additional Trucks
Bakken Wells – Truckload Timeline
Production Phase
50
60
70
Drilling Phase = 165 loads total (16 day average)
200 loads per well 1st Year Drops to 0 if pipelined
Rig down = 6 loads for 4-8 wells (2 days for 6 wells)
Total: 1,230 = (-)38% 250 with pipelines

Construction will expand housing stock by 15 – 25 percent from 2010 to 2025. This number is higher than the projected increase in demand for housing. When do we expect to catch up: Hotels 2013-2015 - Apartments 2016-2017 - Single family 2017-2019
Western North Dakota Housing District Field Office Housing Survey
Dickinson 2006 2012 2013 2014 April 2015Housing Cost (existing) $75,000 $150,000 $150,000-300,000 $175,000-450,000 $175,000-450,000New Construction $170,000 $177,000 $225,000 on up $245,000 + $225,000 on upApt Rental/month $600.00 $3,000.00 $2,600 $2,700.00 $1800 to $3000Hotel rates/night $69.00 $189.00 $160.00 $160.00 $110-$170
An employee in Dickinson experienced a 90% in increase in rent this past fall (from $950 to $1800/month). A search for more affordable housingfound nothing available. Because of housing assistance, we retained the employee as they did not have to move out of state. One employee left$1,600 1 bedroom and moved into downtown 2bdr 1940s complex for $1200. (Housing available but not yet affordable).One employee lives in a camper, and the last new hire from Dickinson owns a home. Apt. rates are for 3br apartments unless otherwise noted.
Williston 2006 2012 2013 2014 2015Housing Cost $78,000 $155,000 $225,000 - $275,000 $275,000 $225,000 - $275,000New Construction $150,000 $256,000 $300,000 $300,000 $305,000Apt Rental (old existing) $450 $1,100 $1,500 $1,500 $1,600Apt Rental (new) $600 $2,450 $3,000 $3,000 $2,850-$3,500Hotel rates $65 $165 Govt rate to $200 $65-$269
Anecdotal: One recent hire was able to obtain housing that was typically reserved for hospital employees for $1200 per month plus utilities.Estimates for new housing amount to approximately $200 per square foot. The Williston Economic Development Commission stopped estimatingrents due to the volatility of the market. Another recent hire pays $1000 for a bedroom and bath in the basement of a home in Wiliston. Twoemployees in Williston that are receiving housing assistance are living in the lowest cost best rate they could find. Both are in a one bedroom, onebath apartment and paying heat and electricity. Without the housing allowance they could not afford the $1200-$1800/month rates.
Minot 2006 2012 2013 2014 2015Housing Cost $127,000 $176,000 $185,000 $185,000 $200,000New Construction $149,860 $207,680 $220,000 $220,000 $350,000Apt Rental $670 $965 $1,100 $1,100.00 $2,150Hotel Rates $70 $118 $106 Govt rate to $91 Govt rate to $60-$114
An employee in Minot was living in a $700/month basement sleeping room with a shared bathroom and no cooking facilities. He was evicted dueto the sale of the property. Because of the housing assistance he was able move into the lowest cost one bedroom apartment he could find - $1200/month in an older existing 49 unit complex

Solving the Flaring Challenge
23 JJ Kringstad - North Dakota Pipeline Authority

Endangered Species 6 endangered 4 threatened 1 proposed 2 candidate Federal Regulation 3 BLM 3 EPA

Oil & Gas Pipeline Jurisdiction:
House Bill 1333(2013): Requires GIS shape files to be submitted. (Aug. 1, 2011 or newer) Requires confidential installation dataset to be submitted. Allows owner or tenant to request pipeline locations within bounds of real property. Allows Tax Dept. access to information.
House Bill 1358 (2015): Requires engineering construction design drawings, list of independent inspectors, plan for leak detection (after August 1, 2015). Requires independent inspectors certificate of testing after 60 days. Commission may now require a bond. Surface owner may now share GIS information. Appropriates money for reclamation program & pipeline technology study. Requires rule making for feasible, cost-effective and necessary improvements to pipeline safety and integrity.

43-02-03-29. WELL AND LEASE EQUIPMENT. Wellhead and lease equipment with a working pressure at least equivalent to the calculated or known pressure to which the equipment may be subjected shall be installed and maintained. Equipment on producing wells shall be installed to facilitate gas-oil ratio tests, and static bottom hole or other pressure tests. Valves shall be installed and maintained in good working order to permit pressure readings to be obtained on both casing and tubing. All newly constructed underground gathering pipelines must be devoid of leaks and constructed of materials resistant to external corrosion and to the effects of transported fluids. All such pipelines installed in a trench must be installed in a manner that minimizes interference with agriculture, road and utility construction, the introduction of secondary stresses, the possibility of damage to the pipe, and tracer wire shall be buried with any nonconductive pipe installed. When a trench for an oil and gas underground gathering pipeline is backfilled, it must be backfilled in a manner that provides firm support under the pipe and prevents damage to the pipe and pipe coating from equipment or from the backfill material.

5 requests for location
Zero incidents reported


Inspection & Enforcement
Each District Office Receives: +1 ET Field Inspection & +1 ET Pipelines Field Inspection
Bismarck Office: Pipeline Program Implementation: +5 FTE’s
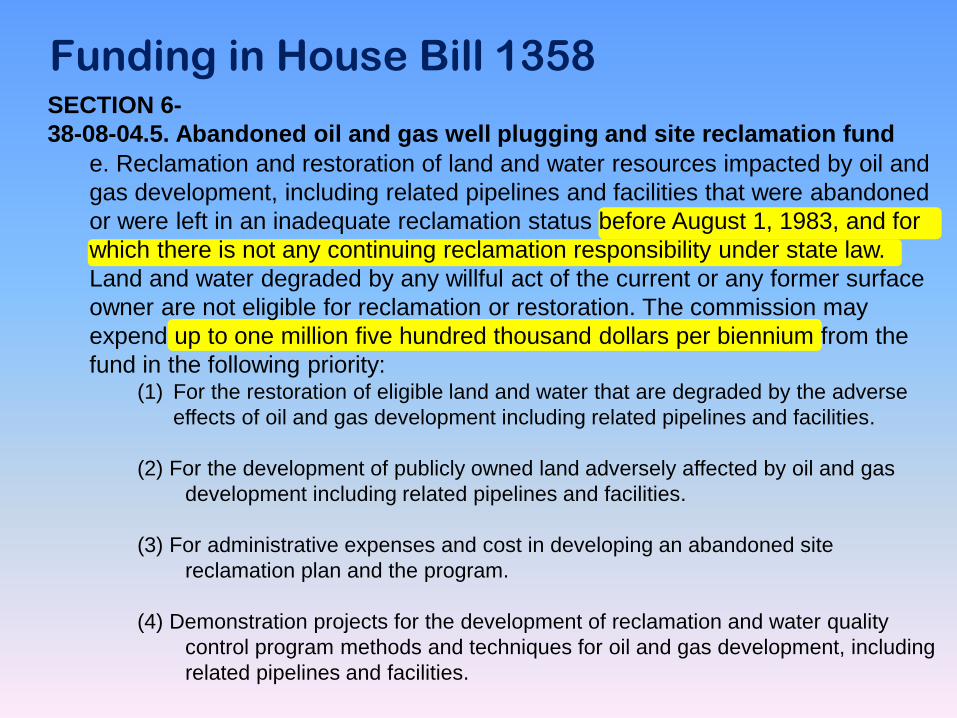
e. Reclamation and restoration of land and water resources impacted by oil and gas development, including related pipelines and facilities that were abandoned or were left in an inadequate reclamation status before August 1, 1983, and for which there is not any continuing reclamation responsibility under state law. Land and water degraded by any willful act of the current or any former surface owner are not eligible for reclamation or restoration. The commission may expend up to one million five hundred thousand dollars per biennium from the fund in the following priority:
(1) For the restoration of eligible land and water that are degraded by the adverse effects of oil and gas development including related pipelines and facilities.
(2) For the development of publicly owned land adversely affected by oil and gas development including related pipelines and facilities. (3) For administrative expenses and cost in developing an abandoned site reclamation plan and the program. (4) Demonstration projects for the development of reclamation and water quality control program methods and techniques for oil and gas development, including related pipelines and facilities.
Funding in House Bill 1358 SECTION 6- 38-08-04.5. Abandoned oil and gas well plugging and site reclamation fund

SECTION 8- $1,500,000 for the purpose of funding a special project through the energy and environmental research center (EERC) at the university of North Dakota during the biennium beginning July 1, 2015, and ending June 30, 2017. The special project must focus on conducting an analysis of crude oil and produced water pipelines including the construction standards, depths, pressures, monitoring systems, maintenance, types of materials used in the pipeline including backfill, and an analysis of the ratio of spills and leaks occurring in this state in comparison to other large oil and gas-producing states with substantial volumes of produced water. The NDIC shall contract with the EERC to compile the information and the center shall work with the department of mineral resources to analyze the existing regulations on construction and monitoring of crude oil and produced water pipelines, determine the feasibility and cost effectiveness of requiring leak detection and monitoring technology on new and existing pipeline systems, and provide a report with recommendations to the industrial commission and the energy development and transmission committee by December 1, 2015. The industrial commission shall adopt the necessary administrative rules necessary to improve produced water and crude oil pipeline safety and integrity. In addition, the industrial commission shall contract for a pilot project to evaluate a pipeline leak detection and monitoring system.
Funding in House Bill 1358

Funding in House Bill 1358
SECTION 9- $500,000, or so much of the sum as may be necessary, for the purpose of conducting a pilot program involving the oil and gas research council in conjunction with research facilities in this state to determine the best techniques for remediating salt and any other contamination from the soil surrounding waste pits reclaimed by trenching between 1951 and 1984 in the north central portion of this state, for the biennium beginning July 1, 2015, and ending June 30, 2017.

The Final Pieces SECTION 4. A surface owner may request a review of the temporarily abandoned status of a well that has been on temporarily abandoned status for at least seven years. The commission shall require notice and hearing to review the temporarily abandoned status. After notice and hearing, the surface owner may request a review of the temporarily abandoned status every two years.
SECTION 5. To provide for the confidentiality of well data reported to the commission if requested in writing by those reporting the data for a period not to exceed six months. However, the commission may release: a. Volumes injected into a saltwater injection well. b. Information from the spill report on a well on a site at which more than ten barrels of fluid, not contained on the well site, was released for which an oilfield environmental incident report is required by law.

Gas Capture Wells waiting on completion has helped drive the success of Gas Capture. Order signed July 1, 2014 and implemented October 1, 2014.
Statewide 82% Statewide Bakken 83% Non-FBIR Bakken 83% FBIR Bakken 84% Trust FBIR Bakken 84% Fee FBIR 85%
Next Target: January 2016, 85% capture. October 2020: 90-95% capture.

Oil Conditioning
• Signed December 9th, 2014; effective April 1, 2015.
• Goal: to produce a consistent product that does not exceed a vapor pressure of 13.7 pounds per square inch (psi).
• Achievable: IC prescribed temperatures and pressures, or through quarterly field testing.
• Result: a safer, stable, crude oil.
• Oil Conditioning FAQ
County by County Outlook

6/30/20159/9/2015 Breakeven 9/9/2015 Wells
$42 / barrel ND$/barrel Rigs June 2015 NC P90 P50Billings $28 0 643 5 1,300 2,000Bot-Ren $85 1 1,028 6 3,000 4,000Bow-Slp $85 1 606 2 900 1,200Burke $82 1 633 4 1,300 3,000Divide $81 4 770 43 1,500 3,000Dunn $24 13 1,797 91 2,000 9,000Golden Valley $64 0 104 0 200 300McKenzie $27 25 3,682 326 6,000 15,000McLean $25 0 59 2 300 800Mountrail $43 14 2,502 183 3,000 9,000Stark $41 1 320 2 1,500 2,700Williams $38 15 2,256 182 4,000 10,000Statewide $34 75 14,384 846 25,000 60,000

2016Semi Wells Frac Wells MMGal
Rigs Loads Active Crews NC Water BOPDBillings 1 2,125 532 1 1 113.6 13,905Bot-Ren 1 2,125 797 1 1 29.6 7,270Bow-Slp 1 2,125 580 0 1 10.0 18,167Burke 1 2,125 555 1 1 109.0 12,764Divide 1 2,125 756 1 25 178.8 35,111Dunn 10 21,250 1,907 7 75 1,024.4 185,790Golden Valley 0 0 93 0 0 0.0 1,904McKenzie 22 46,750 3,898 20 125 3,025.8 433,125McLean 0 0 42 0 2 0.0 2,292Mountrail 11 23,375 2,667 10 100 1,431.4 232,354Stark 0 0 235 0 2 0.0 13,432Williams 12 25,500 2,395 10 100 1,521.7 193,548Statewide 60 127,500 14,459 50 433 7,444 1,149,662
2017Semi Wells Frac Wells MMGal
Rigs Loads Active Crews NC Water BOPDBillings 1 2,125 555 1 2 133.9 11,967Bot-Ren 1 2,125 820 1 2 33.5 6,170Bow-Slp 1 2,125 604 0 1 14.0 15,607Burke 1 2,125 579 1 1 139.7 10,986Divide 1 2,125 795 1 10 227.0 30,460Dunn 15 31,875 2,302 12 40 2,299.1 185,025Golden Valley 0 0 93 0 0 0.0 1,571McKenzie 25 53,125 4,583 21 40 3,987.1 420,125McLean 1 2,125 68 1 0 151.3 3,061Mountrail 14 29,750 3,033 11 70 2,130.3 217,995Stark 1 2,125 261 1 0 151.3 12,308Williams 14 29,750 2,771 12 60 2,188.5 184,747Statewide 75 159,375 16,466 62 226 11,456 1,100,023
2015ND Revenue Forecast Breakeven Wells Frac Wells
$40-$50 / barrel ND$/barrel Rigs Active Crews NC BOPDBillings $28 0 508 0 5 16,082Bot-Ren $85 1 772 0 6 8,531Bow-Slp $85 1 559 0 2 21,208Burke $82 1 532 0 4 14,820Divide $81 4 718 1 43 40,398Dunn $24 13 1,687 9 91 199,220Golden Valley $64 0 93 0 0 2,308McKenzie $27 25 3,248 19 326 437,478McLean $25 0 42 0 2 2,778Mountrail $43 14 2,360 7 183 249,184Stark $41 1 235 0 2 16,282Williams $38 15 2,068 14 182 202,589Statewide $34 75 12,864 51 846 1,210,878

2015Breakeven Wells Frac Wells
$50-$60 / barrel ND$/barrel Rigs Active Crews NC BOPDBillings $28 0 508 0 5 16,082Bot-Ren $85 1 772 0 6 8,531Bow-Slp $85 1 559 0 2 21,208Burke $82 1 532 0 4 14,820Divide $81 4 718 1 43 40,398Dunn $24 13 1,687 9 91 199,220Golden Valley $64 0 93 0 0 2,308McKenzie $27 25 3,248 19 326 437,478McLean $25 0 42 0 2 2,778Mountrail $43 14 2,360 7 183 249,184Stark $41 1 235 0 2 16,282Williams $38 15 2,068 14 182 202,589Statewide $34 75 12,864 51 846 1,210,878
2016Semi Wells Frac Wells MMGal
Rigs Loads Active Crews NC Water BOPDBillings 1 2,125 528 1 5 95.0 13,801Bot-Ren 1 2,125 795 1 3 27.2 7,251Bow-Slp 1 2,125 580 0 1 10.0 18,167Burke 1 2,125 554 1 2 104.3 12,741Divide 2 4,250 762 1 40 204.0 35,362Dunn 12 25,500 1,933 8 90 1,144.6 188,303Golden Valley 0 0 93 0 0 0.0 1,904McKenzie 25 53,125 3,784 17 300 2,495.9 420,480McLean 2 4,250 83 1 2 190.0 4,518Mountrail 15 31,875 2,674 10 175 1,462.1 232,929Stark 0 0 235 0 2 0.0 13,432Williams 15 31,875 2,381 10 175 1,457.5 192,432Statewide 75 159,375 14,403 49 795 7,190 1,141,321
2017Semi Wells Frac Wells MMGal
Rigs Loads Active Crews NC Water BOPDBillings 2 4,250 577 2 2 282.9 12,433Bot-Ren 1 2,125 819 1 2 34.6 6,161Bow-Slp 1 2,125 603 0 1 13.3 15,576Burke 1 2,125 578 1 1 138.5 10,963Divide 2 4,250 837 2 10 440.0 32,069Dunn 15 31,875 2,325 12 40 2,281.7 186,857Golden Valley 0 0 93 0 0 0.0 1,571McKenzie 25 53,125 4,614 26 40 4,831.1 422,985McLean 1 2,125 108 1 0 144.3 4,843Mountrail 15 31,875 3,121 14 70 2,601.8 224,290Stark 2 4,250 283 1 0 277.1 13,326Williams 15 31,875 2,848 15 50 2,718.2 189,895Statewide 80 170,000 16,806 74 216 13,763 1,120,970

2015Breakeven Wells Frac Wells
$30-$40 / barrel ND$/barrel Rigs Active Crews NC BOPDBillings $28 0 508 0 5 16,082Bot-Ren $85 1 772 0 6 8,531Bow-Slp $85 1 559 0 2 21,208Burke $82 1 532 0 4 14,820Divide $81 4 718 1 43 40,398Dunn $24 13 1,687 9 91 199,220Golden Valley $64 0 93 0 0 2,308McKenzie $27 25 3,248 19 326 437,478McLean $25 0 42 0 2 2,778Mountrail $43 14 2,360 7 183 249,184Stark $41 1 235 0 2 16,282Williams $38 15 2,068 14 182 202,589Statewide $34 75 12,864 51 846 1,210,878
2016Semi Wells Frac Wells MMGal
Rigs Loads Active Crews NC Water BOPDBillings 1 2,125 528 1 5 95.0 13,801Bot-Ren 1 1,063 782 0 6 11.9 7,131Bow-Slp 1 1,063 569 0 2 4.7 17,816Burke 1 1,063 542 0 4 47.5 12,461Divide 1 2,125 741 1 40 109.0 34,415Dunn 10 21,250 1,892 6 90 954.6 184,328Golden Valley 0 0 93 0 0 0.0 1,904McKenzie 20 42,500 3,657 13 325 1,904.5 406,367McLean 1 2,125 62 1 2 95.0 3,405Mountrail 10 21,250 2,567 6 180 963.9 223,609Stark 0 0 235 0 2 0.0 13,432Williams 10 21,250 2,274 6 180 959.2 183,785Statewide 55 115,813 13,944 35 836 5,145 1,102,454
2017Semi Wells Frac Wells MMGal
Rigs Loads Active Crews NC Water BOPDBillings 1 2,125 552 1 5 139.7 11,903Bot-Ren 0 0 782 0 6 0.0 5,883Bow-Slp 0 0 569 0 2 0.0 14,698Burke 0 0 542 0 4 0.0 10,280Divide 0 0 741 0 40 0.0 28,392Dunn 10 21,250 2,132 8 90 1,396.9 171,361Golden Valley 0 0 93 0 0 0.0 1,571McKenzie 20 42,500 4,137 15 325 2,793.9 379,257McLean 1 2,125 86 1 2 139.7 3,889Mountrail 10 21,250 2,807 8 180 1,396.9 201,725Stark 0 0 235 0 2 0.0 11,082Williams 8 17,000 2,466 6 180 1,117.5 164,424Statewide 50 106,250 15,144 38 836 6,985 1,004,465

2015Breakeven Wells Frac Wells
$60-$70 / barrel ND$/barrel Rigs Active Crews NC BOPDBillings $28 0 508 0 5 16,082Bot-Ren $85 1 772 0 6 8,531Bow-Slp $85 1 559 0 2 21,208Burke $82 1 532 0 4 14,820Divide $81 4 718 1 43 40,398Dunn $24 13 1,687 9 91 199,220Golden Valley $64 0 93 0 0 2,308McKenzie $27 25 3,248 19 326 437,478McLean $25 0 42 0 2 2,778Mountrail $43 14 2,360 7 183 249,184Stark $41 1 235 0 2 16,282Williams $38 15 2,068 14 182 202,589Statewide $34 75 12,864 51 846 1,210,878
2016Semi Wells Frac Wells MMGal
Rigs Loads Active Crews NC Water BOPDBillings 1 2,125 531 1 2 109.0 13,879Bot-Ren 1 2,125 796 1 2 28.4 7,260Bow-Slp 1 2,125 580 0 1 10.0 18,167Burke 1 2,125 555 1 1 109.0 12,764Divide 2 4,250 782 2 20 297.1 36,290Dunn 12 25,500 1,983 9 40 1,377.4 193,174Golden Valley 0 0 93 0 0 0.0 1,904McKenzie 25 53,125 4,034 25 50 3,660.0 448,260McLean 2 4,250 85 1 0 199.3 4,627Mountrail 15 31,875 2,799 14 50 2,044.2 243,818Stark 0 0 237 0 0 9.3 13,547Williams 15 31,875 2,506 14 50 2,039.5 202,535Statewide 75 159,375 14,982 67 216 9,883 1,196,225
2017Semi Wells Frac Wells MMGal
Rigs Loads Active Crews NC Water BOPDBillings 2 4,250 577 1 2 265.4 12,433Bot-Ren 1 2,125 819 1 2 33.2 6,161Bow-Slp 1 2,125 603 0 1 13.3 15,576Burke 1 2,125 578 1 1 132.7 10,963Divide 2 4,250 837 2 10 323.6 32,069Dunn 15 31,875 2,325 11 40 1,990.6 186,857Golden Valley 0 0 93 0 0 0.0 1,571McKenzie 25 53,125 4,614 18 40 3,375.9 422,985McLean 1 2,125 108 1 0 132.7 4,843Mountrail 15 31,875 3,141 11 50 1,990.6 225,727Stark 2 4,250 283 1 0 265.4 13,326Williams 20 42,500 2,962 14 50 2,654.2 197,496Statewide 85 180,625 16,940 60 196 11,178 1,130,009

2015Breakeven Wells Frac Wells
$70-$80 / barrel ND$/barrel Rigs Active Crews NC BOPDBillings $28 0 508 0 5 16,082Bot-Ren $85 1 772 0 6 8,531Bow-Slp $85 1 559 0 2 21,208Burke $82 1 532 0 4 14,820Divide $81 4 718 1 43 40,398Dunn $24 13 1,687 9 91 199,220Golden Valley $64 0 93 0 0 2,308McKenzie $27 25 3,248 19 326 437,478McLean $25 0 42 0 2 2,778Mountrail $43 14 2,360 7 183 249,184Stark $41 1 235 0 2 16,282Williams $38 15 2,068 14 182 202,589Statewide $34 75 12,864 51 846 1,210,878
2016Semi Wells Frac Wells MMGal
Rigs Loads Active Crews NC Water BOPDBillings 2 4,250 552 1 2 204.0 14,412Bot-Ren 1 2,125 796 1 2 28.4 7,260Bow-Slp 1 2,125 580 0 1 10.0 18,167Burke 1 2,125 555 1 1 109.0 12,764Divide 4 8,500 823 3 20 487.1 38,184Dunn 12 25,500 1,983 9 40 1,377.4 193,174Golden Valley 0 0 93 0 0 0.0 1,904McKenzie 25 53,125 4,034 25 50 3,660.0 448,260McLean 2 4,250 85 1 0 199.3 4,627Mountrail 20 42,500 2,901 17 50 2,519.1 252,703Stark 2 4,250 278 1 0 199.3 15,879Williams 20 42,500 2,608 17 50 2,514.5 210,779Statewide 90 191,250 15,288 76 216 11,308 1,218,113
2017Semi Wells Frac Wells MMGal
Rigs Loads Active Crews NC Water BOPDBillings 5 10,625 666 4 2 663.5 14,346Bot-Ren 1 2,125 819 1 2 33.2 6,161Bow-Slp 1 2,125 603 0 1 13.3 15,576Burke 1 2,125 578 1 1 132.7 10,963Divide 4 8,500 924 3 10 589.0 35,377Dunn 25 53,125 2,553 18 40 3,317.7 205,183Golden Valley 1 2,125 116 1 0 132.7 1,956McKenzie 35 74,375 4,842 25 40 4,703.0 443,887McLean 2 4,250 130 1 0 265.4 5,870Mountrail 25 53,125 3,471 18 50 3,317.7 249,443Stark 5 10,625 392 4 0 663.5 18,476Williams 25 53,125 3,178 18 50 3,317.7 211,898Statewide 130 276,250 18,272 93 196 17,150 1,219,137

2015Breakeven Wells Frac Wells
$20-$30 / barrel ND$/barrel Rigs Active Crews NC BOPDBillings $28 0 508 0 5 16,082Bot-Ren $85 1 772 12 6 8,531Bow-Slp $85 1 559 0 2 21,208Burke $82 1 532 0 4 14,820Divide $81 4 718 1 43 40,398Dunn $24 13 1,687 9 91 199,220Golden Valley $64 0 93 0 0 2,308McKenzie $27 25 3,248 19 326 437,478McLean $25 0 42 0 2 2,778Mountrail $43 14 2,360 7 183 249,184Stark $41 1 235 0 2 16,282Williams $38 15 2,068 14 182 202,589Statewide $34 75 12,864 63 846 1,210,878
2016Semi Wells Frac Wells MMGal
Rigs Loads Active Crews NC Water BOPDBillings 0 0 508 0 5 0.0 13,268Bot-Ren 1 1,063 782 0 6 11.9 7,131Bow-Slp 1 1,063 569 0 2 4.7 17,816Burke 1 1,063 542 0 4 47.5 12,461Divide 1 2,125 741 1 40 109.0 34,415Dunn 10 21,250 1,892 6 90 954.6 184,328Golden Valley 0 0 93 0 0 0.0 1,904McKenzie 16 34,000 3,575 10 325 1,524.5 397,300McLean 1 2,125 62 1 2 95.0 3,405Mountrail 0 0 2,363 0 180 14.0 205,838Stark 0 0 235 0 2 0.0 13,432Williams 0 0 2,070 0 180 9.3 167,297Statewide 30 62,688 13,434 19 836 2,770 1,058,596
2017Semi Wells Frac Wells MMGal
Rigs Loads Active Crews NC Water BOPDBillings 0 0 508 0 5 0.0 10,946Bot-Ren 0 0 782 0 6 0.0 5,883Bow-Slp 0 0 569 0 2 0.0 14,698Burke 0 0 542 0 4 0.0 10,280Divide 0 0 741 0 40 0.0 28,392Dunn 10 21,250 2,132 8 90 1,396.9 171,361Golden Valley 0 0 93 0 0 0.0 1,571McKenzie 19 40,375 4,031 14 325 2,654.2 369,576McLean 1 2,125 86 1 2 139.7 3,889Mountrail 0 0 2,363 0 180 0.0 169,817Stark 0 0 235 0 2 0.0 11,082Williams 0 0 2,070 0 180 0.0 138,020Statewide 30 63,750 14,154 23 836 4,191 935,516

2015Breakeven Wells Frac Wells
$80+ / barrel ND$/barrel Rigs Active Crews NC BOPDBillings $28 0 508 0 5 16,082Bot-Ren $85 1 772 0 6 8,531Bow-Slp $85 1 559 0 2 21,208Burke $82 1 532 0 4 14,820Divide $81 4 718 1 43 40,398Dunn $24 13 1,687 9 91 199,220Golden Valley $64 0 93 0 0 2,308McKenzie $27 25 3,248 19 326 437,478McLean $25 0 42 0 2 2,778Mountrail $43 14 2,360 7 183 249,184Stark $41 1 235 0 2 16,282Williams $38 15 2,068 14 182 202,589Statewide $34 75 12,864 51 846 1,210,878
2016Semi Wells Frac Wells MMGal
Rigs Loads Active Crews NC Water BOPDBillings 5 10,625 613 3 2 488.9 16,010Bot-Ren 2 4,250 817 1 2 52.2 7,446Bow-Slp 1 2,125 580 0 1 10.0 18,167Burke 2 4,250 576 1 1 204.0 13,233Divide 4 8,500 823 3 20 487.1 38,184Dunn 12 25,500 1,983 9 40 1,377.4 193,174Golden Valley 0 0 93 0 0 0.0 1,904McKenzie 30 63,750 4,136 28 50 4,134.9 459,594McLean 2 4,250 85 1 0 199.3 4,627Mountrail 20 42,500 2,901 17 50 2,519.1 252,703Stark 2 4,250 278 1 0 199.3 15,879Williams 20 42,500 2,608 17 50 2,514.5 210,779Statewide 100 212,500 15,492 83 216 12,187 1,231,701
2017Semi Wells Frac Wells MMGal
Rigs Loads Active Crews NC Water BOPDBillings 5 10,625 721 3 2 628.6 15,536Bot-Ren 2 4,250 860 1 2 62.9 6,468Bow-Slp 2 4,250 624 0 1 25.1 16,103Burke 2 4,250 619 1 1 251.4 11,736Divide 5 10,625 941 4 10 686.8 36,021Dunn 30 63,750 2,631 20 40 3,771.7 211,452Golden Valley 1 2,125 115 1 0 125.7 1,936McKenzie 40 85,000 5,010 27 40 5,087.2 459,288McLean 4 8,500 171 3 0 502.9 7,706Mountrail 25 53,125 3,441 17 50 3,143.1 247,287Stark 4 8,500 364 3 0 502.9 17,174Williams 30 63,750 3,256 20 50 3,771.7 217,099Statewide 150 318,750 18,752 101 196 18,560 1,247,807