not all (brand) changes are made equal: stephanie y. …
TRANSCRIPT

Not All (Brand) Changes Are Made Equal:
Understanding Which Changes Impact Brand Loyalty
STEPHANIE Y. CHEN
OLEG URMINSKY
Working Paper
AUTHOR NOTE: Stephanie Y. Chen ([email protected]) is a postdoctoral fellow, and
Oleg Urminsky ([email protected]) is a professor of marketing at the
University of Chicago Booth School of Business, 5807 South Woodlawn Avenue,
Chicago, IL 60637.

2
CONTRIBUTION STATEMENT
Although a wide range of changes to a brand can impact brand loyalty, most of
the literature focuses on how direct consumer experiences and satisfaction influence
loyalty. We propose a broad framework for understanding how to maintain brand loyalty
that can explain how changes will influence brand loyalty, beyond those involving direct
interactions with a brand. Our framework uses consumers’ beliefs about the causal
relationships that exist between a brand’s features—any aspect of a brand that consumers
perceive as notable—to predict which changes will influence their loyalty. We find that
changes to causally central features—those that consumers perceived as causally related
to many other features of the brand—more negatively impact brand loyalty than changes
to causally peripheral features, which consumers perceived as having fewer causal
relationships to other features. Further, we find that changes to causally central features
are more harmful to brand loyalty because they disrupt the identity of the brand more
than changes to causally peripheral features. Thus, our framework suggests that
maintaining loyalty involves not only providing consumers with positive experiences, but
also maintaining brand identity.
Our framework also explains the puzzle of why seemingly similar changes are
harmful to one brand but not to another. We show that manipulating the exact same
feature to appear more causally central or peripheral influences how harmful a change to
that feature is on loyalty. Thus, changing the same feature can be more harmful to one
brand than another because consumers’ beliefs about the causal structure of the two
brands differ—i.e., a feature may be perceived as causally central for one brand and
causally peripheral for another. The questions that our framework addresses are

3
particularly important for brand and marketing managers as loyal consumers provide a
variety of benefits to a firm.

4
Some changes that brands make seem to impact brand loyalty, while other seem to have
little influence. We propose that when a consumer is loyal to a brand, the consumer’s
beliefs about the cause-effect relationships that exist among that brand’s features
influence which changes will negatively impact brand loyalty. Specifically, brand loyalty
is more harmed by changes to features that are perceived as more causally connected to
other important features of a brand (i.e., more causally central), compared to changes in
more causally peripheral features. Across six studies, we demonstrate that changes to
features impact brand loyalty to the extent that the feature is seen as causally central. We
show that manipulations that make a feature more causally peripheral decrease the impact
of a change to that feature on brand loyalty. Further, we demonstrate that the impact of
causal centrality on the brand loyalty response to change is mediated by perceived
disruption to brand identity. Our results provide a new perspective on consumer loyalty,
suggesting that maintaining brand identity is key to maintaining brand loyalty.
Keywords: brand loyalty, causal reasoning, customer loyalty, identity

5
Maintaining consumer loyalty is crucial to the success of firms. Loyal consumers
provide steady demand for the brand’s offerings and help promote the brand to other
consumers (D. Aaker 1991, Dick and Basu 1994). As a result, even small increases in
consumer loyalty can lead to large increases in profits (Reichheld, Markey, and Hopton
2000). Furthermore, maintaining good relationships with consumers who are loyal to the
brand is important because consumers who had a positive relationship with a brand have
the potential to become the company’s harshest critics when disappointed (Gregoire and
Fisher 2008).
As brands must change in response to the evolving market, a major challenge for
managers is predicting which changes will negatively impact brand loyalty. This is
particularly difficult because seemingly similar rebranding efforts and changes to product
lines have had very different impacts for different brands. For example, why was adding
a low calorie alternative a success for Coke (i.e., Diet Coke) but not for Miller (i.e.,
Miller Lite) (D. Aaker 1991)? Additionally, negative unintentional changes (e.g.,
negative experiences with products or news about the company) can vary in how
damaging they are to different brands (J. Aaker, Fournier, and Brasel 2004). Despite the
importance of maintaining loyal customers in the face of change, the literature does not
provide a broad account to explain which changes are more or less likely to damage
brand loyalty.
We take a novel approach to this question, building on insights about causal
reasoning to provide a broad framework that explains which changes are most likely to
negatively impact brand loyalty among which consumers. While previous research on the
determinants of brand loyalty has mainly focused on consumers’ direct experiences with

6
the brand and the outcomes of these interactions—i.e., customer satisfaction and trust
(Agustin and Singh 2005; Chandrashekran et al. 2007; Anderson and Sullivan 1993;Yim,
Tse, and Chan 2008)—we instead focus on consumers’ beliefs about the causal
relationships that exist between a brand’s feature. We propose that changes to causally
central features—those that consumers perceived as causally related to many other
features of the brand—more negatively impact brand loyalty than changes to causally
peripheral features, which have fewer causal relationships to other features. We propose
that this difference occurs because causally central features are perceived by consumers
as being the most defining to the identity of a brand and necessary for maintaining the
identity of the brand. As a result, changes in these features lead consumers to perceive the
brand as having a different identity. That is, when a causally central feature is changed,
the brand no longer seems to be the same brand that consumers felt loyal to.
We next review the prior research on how brand changes influence loyalty. We
then incorporate theories of causal reasoning to develop our proposed framework and
hypotheses. Finally, we test our hypotheses in a series of six studies and discuss the
implications.
THEORETICAL BACKGROUND AND PROPOSED FRAMEWORK
Changing Brands and Changing Loyalties
Previous research has extensively explored how events influence the consumer-
brand relationship. Perhaps the most attention has been paid to the effects of firm

7
transgressions, i.e., violations of the rules and norms that govern a relationship (Aaker et
al. 2004). Most research on transgressions in the consumer-brand relationship literature
has focused on service/product failures and violations of social codes. Not surprisingly,
this line of research has found that transgressions can have serious implications for the
consumer-brand relationship as well as significant financial consequences (J. Aaker et al.
2004; Gregorie and Fischer 2006; Folkes 1984; Folkes, Koletsky, and Graham 1987; Lin
and Sung 2014; Maxham and Netemeyer 2002; Umashankar, Srinivasan, and Parker
2016). However, while transgressions might be expected to consistently decrease brand
loyalty, the effects of transgressions vary. For example, Aaker et al. (2004) found that a
service failure was more damaging to a brand’s relationship with its consumers when the
brand had an exciting personality than when it had a sincere personality. In the latter
case, the transgression (a service failure) actually improved the consumer-firm
relationship, compared to no transgression occurring.
Brands undergo many other types of changes, often made intentionally, that also
have the potential to impact brand loyalty. Brands must change in response to the
evolving competitive landscape, new consumer preferences, and technological advances.
For example, in order to generate growth, brands often attempt to expand their consumer
base which can harm loyalty among their original customer base, particularly among
exclusive brands (Belezza and Keinan 2014; Kirmani, Sood, and Bridges 1999). Serial
brands, which introduce new offerings that change between iterations (e.g., fashion
collections, movie series, sports teams), are expected to change. However, even for serial
brands, changes (e.g., introducing or removing characters or players) can negatively
impact consumers’ feelings towards the brand (Paramentier and Fischer 2014).
8
It can be difficult to predict what impact a change will have on brand loyalty.
Seemingly similar changes can induce very different reactions from consumers. For
example, as in the case of Diet Coke and Miller Lite, consumers of different brands can
react quite differently to the introduction of similar offerings. Additionally, brand efforts
to modernize their image or to participate in corporate social responsibility initiatives
have led to mixed results for different firms (D. Aaker 1991; Chernev and Blair 2015;
Torelli, Monga, and Kaikati 2012). In particular, corporate social responsibility efforts
have been well-received by some consumers but not others depending on consumer
beliefs about how these efforts interact with the firm’s ability to produce their products
(Sen and Bhattarya 2001).
While some of the differential reactions to individual brand changes can be
explained by consumer preferences or knowledge relevant to the specific outcome of that
change, the broader question of when consumers will be more or less open to general
change in a brand’s feature remains unanswered. We propose a framework that aims to
explain what changes are more likely to disrupt brand loyalty. Drawing on research from
cognitive psychology, we propose that understanding how consumers think about the
identity of brands that they have a relationship with provides insight into which aspects of
the brand will disrupt brand loyalty when changed. More specifically, we propose that
how much a change to a feature impacts brand identity and brand loyalty depends on
consumers’ perceptions of how causally connected to other features the changing feature
is.
Causal Centrality
9
Causal reasoning is a fundamental process that underlies much of cognition.
People’s knowledge is typically represented as theories about the world that include
beliefs about cause-effect relationships (Gopnik and Wellman 1994; Keil 2006; Murphy
and Medin 1985) and decision-makers sometimes perceive their own decisions as causal
interventions (Sloman and Hagmayer 2009). Research in consumer behavior has
examined how attributing causal responsibility to different agents (e.g., whether the firm
or consumer caused a product failure) impacts downstream actions and judgments (Botti
and McGill 2011; Folkes 1984; Folkes, Koletsky, and Graham 1987; He and Bond 2015;
Mizerski 1978). We focus on consumers’ beliefs about the network of cause-effect
relationships that exist among the features of a brand. For example, consumers may
believe that Apple’s stylish designs, hip personality, and engaging advertisements are all
caused by Apple’s focus on innovation.
These kinds of beliefs about causal relationships among features influence
categorization decisions (e.g., Ahn 2000; Sloman, Love, and Ahn 1998; Rehder 2003;
Rehder and Hastie 2001) and category learning (Rehder and Murphy 2003; Waldmann et
al. 1995). In particular, this research has found that features of a concept are perceived as
more defining of that concept to the extent that they are perceived as causally central,
i.e., involved in more cause-effect relationships with other features of the concept
(Rehder and Hastie 2001). Thus, people are less likely to continue to judge an item as
belonging to a category when it is missing a causally central feature than when it is
missing a causally peripheral feature. For example, if the firm that makes soap changes
the products packaging, consumers will likely still think that the product is soap. If

10
instead it changes the soap so that it does not lather anymore, consumers may be less
likely to categorize the product as soap. This is because lather is—in the minds of many
consumers—causally connected to many of the other features of soap, particularly its
function and the experience of using it. Further, as the perceived category of a product
guides our expectations of it (Moreau, Markman, and Lehmann 2001; Murphy 2002),
changing a causally central feature of a product can also change how we interact with
it—e.g., if I am not sure this is soap, does it really clean, and do I want to keep using it?
Research in consumer behavior has found that causal beliefs about how a
product’s features relate to each other influence consumers’ inferences about the product.
Consumers make stronger inferences from causally central product features to the
product as a whole than from causally peripheral products. For example, if an
environmental benefit is connected to a more causally central feature of a product (e.g., a
component of the product is made of environmentally-friendly materials), consumers
evaluate that product to be more environmentally-friendly than when the same benefit is
attached to a more causally peripheral feature of the product (Gershoff and Frels 2015).
Causally Central Changes and Brand Loyalty
Given that brands facilitate inferences and guide our interactions with their
products, changing causally central features of a brand may similarly inhibit consumer
inferences. Consumers use brands to infer unobserved product characteristics, such as
quality, and these inferences drive product use (Erdem 2004; Wernerfelt 1988).
Consumers also use brand characteristics to make inferences about the brand as a

11
relationship partner, and these inferences are crucial for maintaining strong consumer
loyalty (J. Aaker et al. 2004). We propose that when a causally central feature of a brand
is changed, the consumer’s basis of loyalty is also called into question.
H1: Changing features of a brand that a consumer perceives as causally central
(vs. causally peripheral) will have greater negative effects on that consumer’s
brand loyalty.
For example, consider Halley, who is loyal to two local restaurants, Johnny’s and
Tommy’s, that are both known for the same set of characteristics: supporting a charity
which promotes healthy eating, using sustainable ingredients, serving high-quality food,
and being very popular. Although the two restaurants have the same features, Halley
believes that the causal relationships among these features differ across the two
restaurants. She believes that Johnny’s relationship with the charity is what caused it to
use sustainable foods, to serve high-quality food, and to be popular. In contrast, she
believes that Tommy’s use of sustainable foods caused it to serve high-quality food, to be
popular, and to develop its relationship with the charity. Imagine now that both
restaurants have a falling out with the charity. Our framework predicts that Halley’s
loyalty to Johnny’s will be decreased more than her loyalty to Tommy’s because the
relationship was causally linked to more of Johnny’s other features—i.e., the charitable
relationship was more causally central.
This prediction is based on the idea that changing causally central features
changes the perceived identity of a brand. Recent research suggests that causal beliefs can

12
play a role in determining what people perceive as defining for individual concepts—
specifically, people’s self-concepts and concepts of other people. Chen, Urminsky, and
Bartels (2016) found that changes in those features that are seen as causally central to a
person’s identity led to greater perceived disruption of that person’s identity than changes
to causally peripheral features, both for the self as well as for others. We propose that
changes in causally central features of a brand have a similar effect on how consumers
think about the brand’s identity.
H2: Changing features of a brand that a consumer believes are causally central
(vs. causally peripheral) will lead to the consumer perceiving greater disruption to
brand identity.
Research from a variety of areas suggests that perceived disruption to the identity
of a person or an object has important consequences on our relationships with and
judgments of them. Perceived disruption to one’s own identity has been shown to
influence choices people make for themselves and for others (Bartels and Rips 2010;
Bartels and Urminsky 2011, 2015) in ways that suggest a weaker affinity or relationship.
Greater perceived disruption to identity is also associated with greater relationship
deterioration between people over time (Strohminger and Nichols 2015). Finally,
disruption to identity has also been found to negatively impact judgments not only of
people, but also of one-of-a-kind objects, such as the value of works of art (Newman and
Bloom 2012; Newman, Bartels, and Smith 2016). Thus, we propose that when changing a
causally central feature of a brand disrupts the brand’s perceived identity, this disruption
13
will reduce brand loyalty. For example, Halley’s loyalty to Johnny’s decreases because
she just does not feel like Johnny’s is the same restaurant after it lost its causally central
relationship with the charitable organization.
H3: The impact of changing causally central features on brand loyalty will be
mediated by perceived disruption to identity—the greater the disruption to
identity, the more negative the effects on brand loyalty.
Our approach to identifying which changes will negatively impact brand loyalty
provides a general framework that explains differences in the effects of change, both
across brands and across consumers. As causal structure varies from brand to brand, our
framework can explain why a given feature is important to the identity of one brand but
not another—e.g., why did losing the charity relationship impact Halley’s loyalty to
Johnny’s but not to Tommy’s? Additionally, as each individual has their own
representation of the casual structure of a brand, our framework can also explain why
changing a given feature may impact brand loyalty for some consumers but not others.
We test the hypotheses in six studies. In studies 1A-1C, using real brands that
participants are loyal to, we establish a relationship between the causal centrality of a
feature and the impact of changing that feature on loyalty. Next, in study 2, we utilize
scenarios about hypothetical brands to manipulate causal centrality. In study 3, we
generalize our findings to serial brands, whose offerings regularly change. Finally, in
study 4, we examine whether another aspect of consumers’ causal beliefs, the strength of

14
the causal relationships between a brand’s features, influences which changes harm brand
loyalty.
STUDY 1A: CHANGES TO CAUSALLY CENTRAL FEATURES DECREASE
BRAND LOYALTY MORE THAN CHANGES TO CAUSALLY PERIPHERAL
FEATURES
As an initial test of hypothesis 1, we examine the relationship between a feature’s
causal centrality and the degree to which a change in that feature impacts brand loyalty.
We test this relationship using real brands that consumers reported being loyal to.
We operationalized causal centrality as the number of causal links that a feature
participates in with other features of the brand. The more central the feature is (the more
causal links it has) in a consumer’s representation of the brand, the larger the predicted
negative impact on brand loyalty from a change in that feature. Although there are
alternative theoretical accounts of causal centrality (see Rehder 2003), in this article we
use the number of cause-effect relationships (Rehder and Hastie 2001) as prior studies
have found that this model of causal centrality better fit identity judgments (Chen et al.
2016) than another prominent model of causal centrality which gives higher weight to
causes than effects (Ahn et al. 2000; Sloman et al. 1998).
Method

15
Three hundred one U.S. Amazon Mechanical Turk participants completed the
study. Data were dropped for thirty-four participants who either failed the attention check
(11), or gave all the same answers for the number of links or change in loyalty questions
(23), yielding 267 cases. Data were dropped from participants who gave all the same
answers because in our analysis we calculated the correlation between the number of
links and change in loyalty and we were unable to do so for participants who gave all the
same answers. Results were similar when we ran a different analysis designed to include
all participants (see Appendix C). Full data from all studies will be made available online.
All stimuli and measures, and results from all relevant studies are provided in the
appendix.
Participants specified a brand that they are loyal to and briefly described what
products that brand makes. We asked participants to list a brand that they buy instead of
any other brands that make the same product(s), when possible. Participants then reported
how much they agreed with two statements from Carroll and Ahuvia’s (2006) brand
loyalty scale on a 7-point Likert scale (1 = Strongly disagree, 7 = Strongly agree): 1) If
this brand is sold out, I will postpone buying, and 2) This is the only brand of this product
that I will buy.
Participants then generated eight features that they believed were important to
their brand’s identity and completed a version of the “listing causal relationships” task
(Chen et al. 2016) adapted to be about brands. In each trial of the task, participants were
asked which of the other seven features were caused by a target feature. Participants saw
the target feature at the top of the screen (along with the question text) and the seven
other features were listed under it along with the answer “none of these are caused by

16
[target feature]” (see figure 1). Participants clicked the check-box next to a feature to
report that the target feature caused that feature. After a practice task with feedback,
participants completed eight randomized trials of the listing causal relationships task—
one for each of the features of the brand that they had previously generated.
FIGURE 1
EXAMPLE TRIAL IN LISTING CAUSAL RELATIONSHIPS TASKS
From this series of questions, we calculated the causal centrality of the target
feature, the total number of causal relationships that the feature participated in as either a
cause of another feature or as an effect of another feature, across the eight trials. Thus, a

17
feature could have high causal centrality because when it was the target feature it was
selected as the cause of many other features, because it was selected as an outcome in
many of the trials when other features were the target, or both.
To measure how much each change would impact brand loyalty, we had
participants imagine that each of these eight features had changed, one at a time. For each
change, participants then rated their agreement with the two brand loyalty statements
used earlier in the study based on that feature having changed. For each of the eight
changes, we calculated a post-change brand loyalty score for each participant, by
averaging the agreement with the two brand loyalty statements. We then calculated the
change in loyalty that resulted from a change to each feature by subtracting participants’
original loyalty score (for the unchanged brand) from the post-change loyalty score
corresponding to each feature. As higher loyalty scores indicated greater brand loyalty,
negative change in loyalty scores indicated decreased brand loyalty. Features were
presented in random order.
Results
The most common brands that participants reported being loyalty to were Nike
(10% of participants), Apple (8%), Samsung (5%), Coke (4%), and Sony (3%).
Commonly reported features were price, quality, personality traits (e.g., fun, outgoing,
friendly), specific attributes of the products (e.g., taste, colors), and personal experiences
with the brand or its products (e.g., great service, product fits specific need). As an
example, causally central features of Nike (i.e., the features with a high number of links)

18
included quality, price, stylish design, and popularity. Causally peripheral features (i.e.,
those with a low number of links) included the Nike logo, their labor practices, and their
community service efforts. That is, consumers loyal to Nike often perceived the brand’s
popularity as being caused by its quality and stylish design but did not perceive Nike’s
logo as being causally connected to these other aspects of the brand. (see figure 2 for an
example of the links reported by a participant.) On average, participants reported 13.49
causal links between the eight features of the brand.

19
FIGURE 2
ILLUSTRATION OF THE FEATURES AND CAUSAL LINKS FOR NIKE
REPORTED BY A PARTICIPANT
Notes: Each box contains a feature of Nike reported by the participant. The arrows
represent causal relationships between features. The box at the arrow’s origin is the cause
and the box that the arrow points to is the effect. For example, based on this participant’s
responses, the feature Unique style causes the feature Globally known. The features
Quality, Trust, and Dependable are causally central because they participate in many
cause-effect relationships. The feature Logo is causally peripheral because it participates
in relatively few cause-effect relationships (only one, with Globally known).

20
To test hypothesis 1, for each participant, we calculated the Spearman correlation
between the number of causal links a feature had and the change in loyalty that resulted
from a change in that feature (results were similar using a Pearson correlation, see
Appendix 3). We then averaged the correlation coefficients (with a Fisher
transformation). Consistent with hypothesis 1, we found a negative correlation between
number of links and change in brand loyalty (Mcorr = -.18, t(266) = 5.73, p < .001, 95%
CI = [-.25 -.12]), on average. Changes to more causally central features were evaluated as
more negatively impacting brand loyalty than changes to more peripheral features. The
majority of participants (64%) had a negative individual-level correlation between the
number of connections a feature had and their rated change in brand loyalty.
We also compared the average change in loyalty caused by changes to more
causally central features vs. changes to more causally peripheral features. For each
participant, the four features with the most links were classified as more causally central
and the four features with the fewest links were classified as more causally peripheral. A
paired t-test revealed that, consistent with the results of the correlational analysis,
changes to more causally central features were significantly more harmful to brand
loyalty than changes to more causally peripheral features (Mcentral = -1.99, Mperipheral= -
1.76, t(266) = 3.60, 95% CI = [.11 .37], p < .01, see figure 3).

21
FIGURE 3
AVERAGE CHANGE IN LOYALTY RESULTING FROM CHANGES TO
CAUSALLY CENTRAL AND CAUSALLY PERIPHERAL FEATURES IN STUDY
1A
The results of study 1A demonstrate that consumers report greater decreases in
brand loyalty when brand features that they perceive as causally central are changed.
These results support our causal centrality approach to understanding brand loyalty and
suggest that maintaining causally central features is important for maintaining brand
loyalty.
STUDY 1B: CHANGES TO CAUSALLY CENTRAL FEATURES DISRUPT
BRAND IDENTITY MORE THAN CHANGES TO CAUSALLY PERIPHERAL
FEATURES
-2.5
-2
-1.5
-1
-0.5
0Central Peripheral
Aver
age
Cha
nge
in L
oyal
ty
22
As discussed earlier, casually central features are perceived to be more defining of
a concept and of people’s identities than causally peripheral features. As such, changes to
causally central features disrupt people’s identities more than changes to causally
peripheral features (Chen et al. 2016). In study 1B, we test hypothesis 2, examining
whether changes to more causally central features of a brand disrupt brand identity more
than changes to more causally peripheral features.
Method
Ninety-nine U.S. Amazon Mechanical Turk participants completed the study.
Data were dropped for six participants who either failed the attention check (2), gave all
the same answers for the number of links, disruption to identity, or change in loyalty
questions (4), yielding 93 cases. Results were similar when we included all participants
(see Appendix C).
The procedure was identical to that of study 1A except that when considering a
change to each of the brand’s features, participants did not rate their agreement with the
brand loyalty statements. They instead rated how much each change would disrupt the
identity of the brand on a scale of 0 (exact same brand) to 100 (completely different
brand). Features were presented in random order.
Results

23
We hypothesized that changes to features with more causal connections would
disrupt brand identity (hypothesis 2) more than changes to features with fewer causal
connections. Similar to study 1A, for each participant, we calculated the Spearman
correlation between the number of causal links a feature had and how much a change to
that feature would disrupt brand identity (results were similar using a Pearson correlation,
see Appendix 3). We then calculated the average correlation coefficient (with a Fisher
transformation).
The results of the correlational analysis were consistent with hypothesis 2. The
average correlation coefficient between number of links and disruption to identity, across
participants, was positive (Mcorr = 0.14, t(92) = 2.78, 95% CI = [.04 .24], p < .01). The
majority of participants (63%) had a positive individual-level correlation between the
number of connections a feature had and rated disruptiveness of change.
We also compared the average disruption to identity caused by changes to more
causally central features vs. changes to more causally peripheral features. As in study 1A,
relative causal centrality was calculated at the participant level. A paired t-test revealed
that, consistent with the results of the correlational analysis, changes to causally central
features were significantly more disruptive to brand identity than changes to causally
peripheral features (Mcentral = 62.85, Mperipheral= 58.85, t(92) = 2.37, 95% CI = [.65 7.35],
p = .02, see figure 4).

24
FIGURE 4
AVERAGE DISRUPTION TO IDENTITY RESULTING FROM CHANGES TO
CAUSALLY CENTRAL AND CAUSALLY PERIPHERAL FEATURES IN STUDY
1B
The results of study 1B suggest that the features consumers believe are causally
central are perceived as most defining of a brand’s identity. Changes to causally central
features were evaluated as more disruptive of brand identity than changes to causally
peripheral features. In the next study, we integrate the results of study 1A and study 1B to
examine how disruption to identity relates to the relationship between causal centrality of
change and brand loyalty.
0
25
50
75
100
Central Peripheral
Aver
age
Dis
rupt
ion
to Id
entit
y

25
STUDY 1C: CHANGES TO CAUSALLY CENTRAL FEATURES DECREASE
BRAND LOYALTY BY DISRUPTING BRAND IDENTITY
The previous studies separately demonstrated that changes to features that
consumers perceive as causally central more negatively impact brand loyalty (study 1A)
and disrupt brand identity (study 1B), compared to changes to causally peripheral
features. In study 1C, we provide a replication of studies 1A and 1B, and test our
proposal that perceived disruption to identity mediates the effect of causal centrality on
brand loyalty (hypothesis 3). To do so, we have the participants provide measures of the
causal centrality of brand features and report the effects of a change to each feature on
both brand identity and brand loyalty.
Method
One hundred U.S. Amazon Mechanical Turk participants completed the study.
Data were dropped for eleven participants who either failed the attention check (1), or
gave all the same answers for the number of links, disruption to identity, or change in
loyalty questions (10), yielding 89 cases.
The procedure was identical to that of studies 1A and 1B except that after
completing the “listing causal relationships” task, participants reported how much a
change to each feature would change their loyalty to the brand and how much each
change would disrupt the identity of the brand.
26
Results
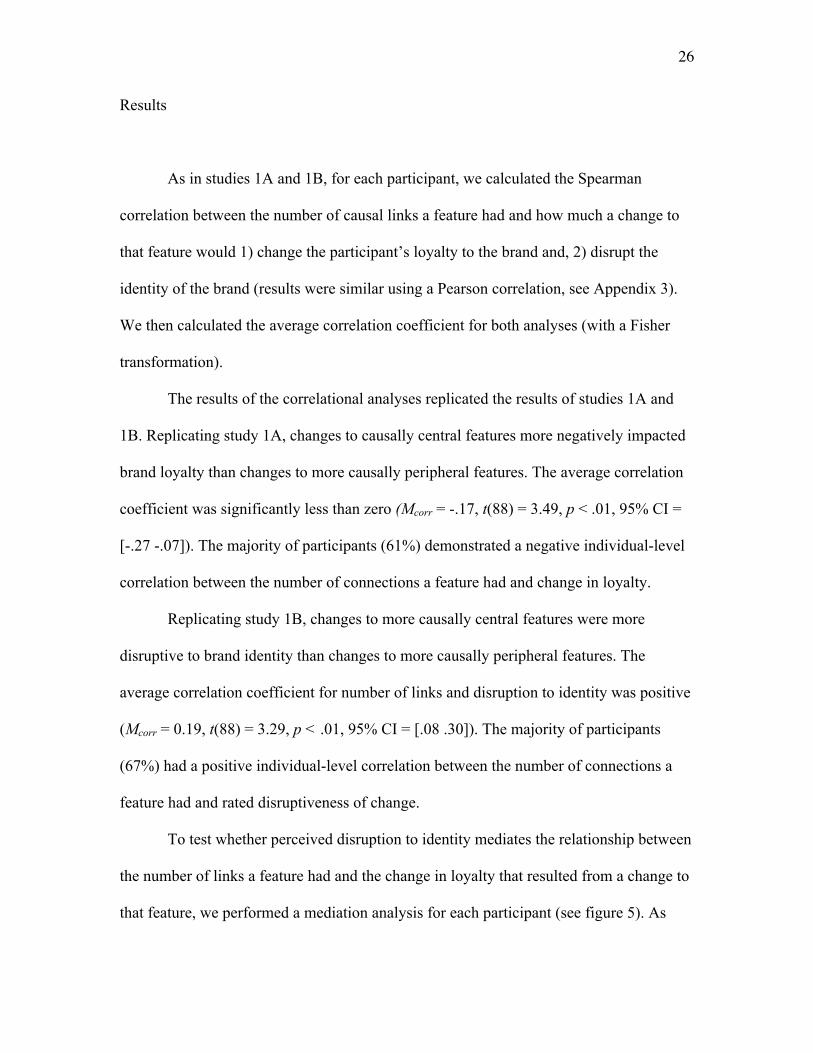
As in studies 1A and 1B, for each participant, we calculated the Spearman
correlation between the number of causal links a feature had and how much a change to
that feature would 1) change the participant’s loyalty to the brand and, 2) disrupt the
identity of the brand (results were similar using a Pearson correlation, see Appendix 3).
We then calculated the average correlation coefficient for both analyses (with a Fisher
transformation).
The results of the correlational analyses replicated the results of studies 1A and
1B. Replicating study 1A, changes to causally central features more negatively impacted
brand loyalty than changes to more causally peripheral features. The average correlation
coefficient was significantly less than zero (Mcorr = -.17, t(88) = 3.49, p < .01, 95% CI =
[-.27 -.07]). The majority of participants (61%) demonstrated a negative individual-level
correlation between the number of connections a feature had and change in loyalty.
Replicating study 1B, changes to more causally central features were more
disruptive to brand identity than changes to more causally peripheral features. The
average correlation coefficient for number of links and disruption to identity was positive
(Mcorr = 0.19, t(88) = 3.29, p < .01, 95% CI = [.08 .30]). The majority of participants
(67%) had a positive individual-level correlation between the number of connections a
feature had and rated disruptiveness of change.
To test whether perceived disruption to identity mediates the relationship between
the number of links a feature had and the change in loyalty that resulted from a change to
that feature, we performed a mediation analysis for each participant (see figure 5). As
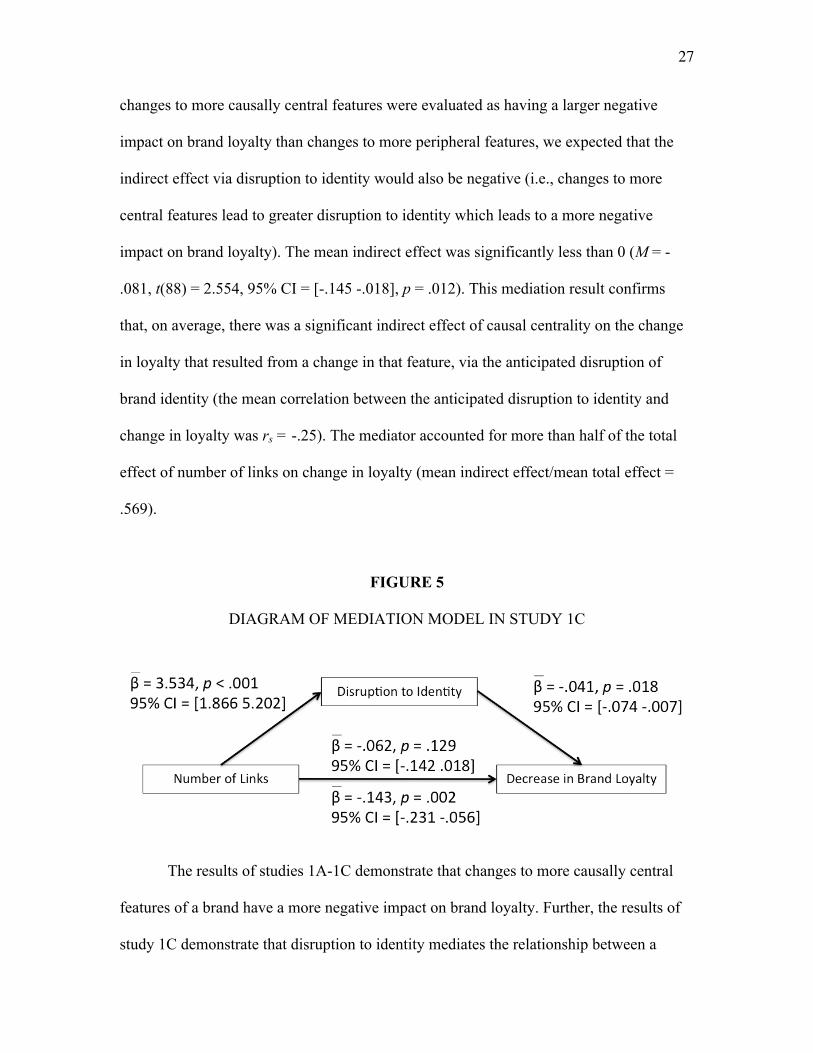
27
changes to more causally central features were evaluated as having a larger negative
impact on brand loyalty than changes to more peripheral features, we expected that the
indirect effect via disruption to identity would also be negative (i.e., changes to more
central features lead to greater disruption to identity which leads to a more negative
impact on brand loyalty). The mean indirect effect was significantly less than 0 (M = -
.081, t(88) = 2.554, 95% CI = [-.145 -.018], p = .012). This mediation result confirms
that, on average, there was a significant indirect effect of causal centrality on the change
in loyalty that resulted from a change in that feature, via the anticipated disruption of
brand identity (the mean correlation between the anticipated disruption to identity and
change in loyalty was rs = -.25). The mediator accounted for more than half of the total
effect of number of links on change in loyalty (mean indirect effect/mean total effect =
.569).
FIGURE 5
DIAGRAM OF MEDIATION MODEL IN STUDY 1C
The results of studies 1A-1C demonstrate that changes to more causally central
features of a brand have a more negative impact on brand loyalty. Further, the results of
study 1C demonstrate that disruption to identity mediates the relationship between a

28
feature’s causal centrality and the impact on brand loyalty that results from changing that
feature. These studies highlight the benefit of understanding loyal consumers’
perceptions of the structure of brand identities and demonstrate that maintaining brand
identity by minimizing changes to causally central features can help preserve brand
loyalty.
STUDY 2: MANIPULATING THE CAUSAL CENTRALITY OF A FEATURE
INFLUENCES HOW DAMAGING A CHANGE TO THAT FEATURE IS TO
BRAND LOYALTY
Studies 1A-1C demonstrated a relationship between the measured causal
centrality of a feature and the impact of changing that feature on brand loyalty, using real
brands and the features that participants specified as important to the brand. In study 2,
we manipulate causal centrality, rather than measure it, using scenarios about
hypothetical brands. We also use a more indirect measure of brand loyalty that does not
involve directly asking participants about their brand loyalty.
Method
Materials. Participants read two short hypothetical scenarios, one describing the
participants’ favorite causal dining restaurant chain, and the other about their favorite
automobile company. The scenarios described the structure of the brands as having one
feature that was causally linked to either three other features in the restaurant scenario or
two other features in the auto scenario. In addition to the story text, subjects also saw
29
visual diagrams of how the features of identity were connected with arrows. The arrows
pointed to the effect feature and the cause feature was at the origin of the arrow (see
figure 6).
For example, the restaurant scenario described a restaurant chain that had strong
relationships with charities and health organizations. This restaurant had three other
salient features that were caused by the relationships: being very popular, serving healthy,
high quality food, and using sustainably-sourced foods. The scenario stated that because
of its relationships with charities and health organizations the restaurant became very
popular and started serving healthy, high-quality foods. Additionally, the relationships
shaped the restaurant’s values and it became committed to using sustainably-sourced
foods. In this scenario, the restaurant’s relationships with charities and health
organizations was a causally central feature since it was linked to the three other features.
Serving sustainably-sourced food was relatively more peripheral since it was linked to
only one other feature (the relationships).

30
FIGURE 6
EXAMPLE DIAGRAM PRESENTED WITH SCENARIOS USED IN STUDY 2
(VERSION A AND B OF EXAMPLE SCENARIO)
In order to manipulate which feature was causally central, we made two versions
of each scenario (versions A and B). The only difference between the two scenarios was
that the positions of two features were flipped, such that in one scenario a given feature
was the causally central cause feature and in the other version it was the causally
peripheral effect feature.
For example, the scenario described above was version A, while version B
described the fact that the restaurant served sustainably-sourced food (which was
peripheral in version A) as causally central—i.e., as causally linked to the three other
features. Specifically, in version B the restaurant’s commitment to serving sustainably-
sourced food was what caused it to become popular and to serve healthy, high quality
food. Additionally, since the restaurant valued sustainably-sourced food, it was able to
create strong relationships with charities and health organizations.

31
For generality, we used a second pair of scenarios in which an automobile
company was described as having three key features: a strong CEO, extremely high
quality products, and an excellent design team. In version A, the CEO was described as
causally central while the design team was peripheral. In version B, the design team was
described as causally central while the CEO was peripheral.
This design allows the exact same features to be counterbalanced as either
causally central or causally peripheral, to control for any idiosyncratic beliefs about the
features. Our prediction was that people would remain more loyal when a causally
peripheral feature was changed than when a causally central feature was changed. That is,
if the restaurant no longer had relationships with charitable organizations, loyalty would
be decreased more among participants who read version A (in which the relationships
were causally central) than those who read version B (in which the relationships were
causally peripheral).
Procedure. Sixty U.S. Amazon Mechanical Turk participants read two scenarios
that described the causal structure of a hypothetical brand. We presented the two
scenarios in random order and randomly assigned participants to read either version A or
version B of each scenario. After reading each scenario, on a separate screen, participants
selected which of two statements they thought correctly described how the features of the
brand related to one another. No feedback was provided.
On the next screen, we described (in random order) two different versions of the
brand after a change and asked which changed brand the participant would rather
purchase a product from. The scenario was again presented on this screen so the
participants could reference it. Each of the two changed brands was now missing one of

32
the features described in the scenario—one brand was missing the causally central feature
and the other was missing the causally peripheral feature. For example, after reading the
restaurant scenario, participants chose between purchasing from the restaurant that no
longer served sustainably-sourced food (missing the peripheral feature in version A and
the central feature in version B) or from the restaurant that no longer had strong
relationships with charities (missing the central feature in version A and the peripheral
feature in version B). The scenario explicitly stated that each brand did possess the other
features of the original brand. All participants chose between the same two changed
restaurants, regardless of which version of the scenario they read (A or B).
Participants then rated how much each of the two changes disrupted the identity
of the brand, on a scale of 0 (exact same brand) to 100 (completely different brand).
Finally, participants reported how plausible they felt the scenario was, on a scale of 0 (not
at all plausible) to 100 (extremely plausible).
Results
According to hypothesis 1, changes to causally central features should have a
larger negative impact on brand loyalty. Thus, we predicted that subjects should be more
likely to choose to purchase from the brand missing the causally peripheral feature than
the causally central feature. This is indeed what we found. For example, fewer
participants chose to purchase from the restaurant that no longer had relationships with
charitable organizations when this feature was causally central (52%, 16 out of 31
participants) than when these relationships were described as peripheral (86%, 25 out of

33
29 participants). Across all scenarios, participants chose to purchase from the brand
missing the causally peripheral feature (65% of selections) over the brand missing the
causally central feature (35% of selections, binomial sign test, p < .01). Detailed results
for each scenario are provided in Table 1.
TABLE 1
PROPORTION (NUMBER) OF CHOICES OF BRAND MISSING CENTRAL VS.
PERIPHERAL FEATURES, BY SCENARIO VERSION IN STUDY 2
Scenario Features Version A Version B
Scenario 1 Charitable .52 (16) (central) .86 (25) (peripheral) Sustainability .48 (15) (peripheral) .14 (4) (central)
Scenario 2 CEO .57 (17) (central) .83 (25) (peripheral) Design Team .43 (13) (peripheral) .17 (5) (central)
Hypothesis 2 predicts that changes to causally central features will disrupt brand
identity more than changes to causally peripheral features. Consistent with this
hypothesis, participants rated changes to causally central features of a brand as more
disruptive to brand identity than changes to causally peripheral features, (Mcentral = 62.07
Mperipheral = 45.77, 95% CI = [6.27 26.33], t(59) = 3.251, p = .002).
To examine whether disruption to identity predicted choice of the brand that was
missing the peripheral feature (hypothesis 3), we regressed participants’ choices on the
difference in disruption scores (disruption rating for change in central feature – disruption
rating for change in peripheral feature). Using logistic regression analysis with standard
errors clustered by participant, we find that the difference in disruption scores strongly
predicted participants’ choices (Wald = 20.82, Odds Ratio = .98, z = -4.56, p < .001).
Participants were more likely to choose the brand that was missing the causally

34
peripheral feature to the extent that they perceived that a change to the causally central
feature disrupted brand identity more than a change to a causally peripheral one.
The plausibility of the scenarios was high (M = 75.63). A logistic regression with
standard errors clustered by participant revealed that participants were marginally more
likely to choose the brand that was missing the causally peripheral feature to the extent
that they felt that the scenario was plausible (Wald = 3.63, Odds Ratio = .98, z = 1.90, p =
.057), suggesting that participants’ use of the causal information in the scenarios was
moderated by their own beliefs about what causal relationships were likely to occur.
However, the difference in disruption to identity scores continued to moderate the effect
of causal centrality of change on loyalty (Wald = 24.19, Odds Ratio = .98, z = 4.39, p <
.001) even controlling for plausibility, and plausibility did not moderate the results (Wald
= .35, Odds Ratio = .96, z = .59, p > .05).
Discussion
The results of study 2 replicate the results of study 1, using a manipulation of
causal centrality. When a feature was manipulated to be causally central, a change to that
feature had a more negative impact on brand loyalty than when the exact same feature
was manipulated to be causally peripheral. The manipulation also influenced perceived
disruption to identity—a change to a feature was more disruptive to the brand’s identity
when the feature was presented as causally central than when it was presented as causally
peripheral. Further, we found that perceived disruption to identity scores predicted the

35
preference for brands retaining causally central features, providing evidence for our
proposed mechanism.
STUDY 3: MANIPULATION OF CAUSAL CENTRALITY IN SERIAL BRANDS
Study 2 investigated brands that typically maintain a stable brand image over time
(restaurants and automobiles), and for whom changes may be seen as violating
expectations or generally undesirable. However, some brands operate in categories in
which consumers expect ongoing changes. Study 3 expands our investigation into one
type of serial brand, sports teams. Since sports teams constantly undergo changes to
various features (e.g., lineup, ownership, strategy, win-loss record), understanding which
changes will impact brand loyalty is particularly useful for these types of brands.
As in study 2, participants read two scenarios, each about hypothetical sports
teams that were described as being their favorite team. The scenarios described the
structure of the team as having one feature that was causally connected to three other
features. For example, one scenario described a sports team, the Great Bay Foxes, that
had four key features: a popular star player, a winning record, die-hard fans, and one of
the nicest stadiums in the league. In version A, the star player was causally central, as his
presence on the team was causally connected to the other three features. His talent was
what allowed the team to gain its fans and accomplish their winning record, and his
popularity led the owners to build a nice, new stadium for the team—a point of pride for
fans. In version B, the winning record, which had been peripheral in version A, was
instead described as being causally central, causally connected to all the other features. In

36
version B, the winning record attracted the team’s die-hard fans and allowed the team to
recruit their talented star player (who was causally peripheral in this version). It was also
the team’s success (winning record) that led the owners to build the team their nice, new
stadium.
A second scenario described a team with four key features: location (city),
owners, star player, and mascot. In version A, the location was described as causally
central and the owners were described as peripheral. In version B, the owners were
described as central and the location was described as peripheral.
Procedure. Sixty U.S. Amazon Mechanical Turk participants read two scenarios
that described the causal structure of a hypothetical brand. Similar to study 2, participants
chose which of two teams they would rather purchase a ticket to see play. Each of the two
changed teams was missing one of the features described in the scenario—e.g., would
they rather purchase a ticket to see the Great Bay Foxes who no longer had their star
player or the Great Bay Foxes who no longer had a winning record? Participants then
rated how much each of the two changes disrupted the identity of the team, on a scale of
0 (exact same brand) to 100 (completely different brand). Finally, participants reported
how plausible they felt the scenario was, on a scale of 0 (not at all plausible) to 100
(extremely plausible).
Results
The results replicated study 2 in the context of serial brands. Consistent with
hypothesis 1, changing a feature of the team was more damaging to loyalty when that

37
feature was described as causally central than when it was described as causally
peripheral. For example, fewer participants chose to purchase a ticket to see the team that
no longer had the star player when this feature was causally central (48%, 14 out of 29
participants) than when the departing star player was described as peripheral (68%, 21
out of 31 participants). Across all scenarios, participants preferred to purchase tickets to
see the team missing the causally peripheral feature (61.5%) than to see the team missing
the causally central feature (38.5%, binomial sign test, p < .05). Detailed results for each
scenario are presented in Table 2.
TABLE 2
PROPORTION (NUMBER) OF CHOICES OF THE TEAM MISSING THE CENTRAL
VS. PERIPHERAL FEATURE BY SCENARIO VERSION IN STUDY 3
Scenario Features Version A Version B
Scenario 1 Star Player .48 (14) (central) .68 (21) (peripheral) Winning Record .52 (15) (peripheral) .32 (10) (central)
Scenario 2 Location .03 (1) (central) .29 (9) (peripheral) Ownership .97 (28) (peripheral) .71 (22) (central)
The results of the disruption to identity analyses also replicated those of study 2.
Consistent with hypothesis 2, participants rated changes to causally central features of a
team to be more disruptive to brand identity than changes to causally peripheral features,
(Mcentral = 52.15 Mperipheral = 38.79, 95% CI = [4.08 22.64], t(59) = 2.88, p < .01). A
logistic regression analysis with standard errors clustered by participant revealed that the
difference in disruption scores predicted participants’ choices (Wald = 5.63, Odds Ratio

38
= .99, z = -2.37, p = .02). Participants were more likely to choose the team that was
missing the causally peripheral feature to the extent that they perceived that a change to a
causally central feature disrupted team identity more than a change to a causally
peripheral one.
The mean plausibility of the scenarios was high (M = 77.63). A logistic regression
with standard errors clustered by participant revealed that plausibility scores did not
predict participants’ choices (Wald = 2.38, Odds Ratio = 1.99, z = 1.54, p > .05).
Study 3 expands our findings to a type of serial brand, sports teams. Participants
preferred to remain loyal to a team that was missing a causally peripheral feature but
retained a causally central one than to a team that was missing a causally central feature
but retained a causally peripheral one. These results provide further evidence for our
framework and suggest that the effect of causal centrality on sensitivity to change extends
to serial brands, which are expected to change over time.
STUDY 4: MANIPULATING THE STRENGTH OF CAUSAL RELATIONSHIPS
ALSO INFLUENCES BRAND LOYALTY
Our approach to brand loyalty, thus far, has focused on beliefs about the number
of causal relationships that exist between features of a brand. Some models of
categorization as causal reasoning (e.g., Sloman et al. 1998) suggest that the strength of a
feature’s causal links also determine how defining it is to a concept. That is, if a feature
has a strong influence on a set of other features, it will be more defining of a concept than
a feature that only has a weak influence on the same set of other features. In study 4, we

39
examine whether beliefs about causal relationship strength influence how much a change
to a feature harms brand loyalty.
To manipulate the causal strength of the links that a feature is attached to, holding
constant the number of links, we leveraged two well-established phenomena in causal
reasoning, causal discounting and causal augmentation. Causal discounting occurs when
people know that a given cause is present, leading them to discount the presence of
another alternative cause (Morris and Larrick 1995; Nisbett and Ross 1980; see Pearl
2000 for a normative account of causal discounting). For example, if a person observes
an effect (e.g., someone squinting), knowing that one cause is present (e.g., it’s sunny)
will lead her to discount the presence of alternative causes (e.g., the person has bad
eyesight) even when the causes are not mutually exclusive. Causal augmentation occurs
when people know that a factor inhibits an observed effect, leading them to believe that a
cause is stronger or more likely to be present (Olson 1992, note that this phenomenon is
not the same Pearl’s causal augmentation). For example, if a person observes an effect
(e.g., someone has a fever), knowing that another factor is inhibiting that effect (e.g., that
person took a fever reducer) will lead her to increase her estimate of the presence of the
cause (e.g., the flu) or the strength of the causal relationship between the cause and effect.
Method
Materials. In study 4, we presented participants with two scenarios that described
one feature as the cause of two other features. For example, in one of the scenarios, the
team’s star play was responsible for their winning record, die-hard fans, and brand new
40
stadium. We manipulated the causal strength of the relationships that the cause feature
participated in by introducing a new feature (the star’s teammates) and relating it to the
effect features either via causal discounting or causal augmentation. In the discounting
version, we told participants that the feature also caused (or facilitated) the effect
features. For example, the teammates were also good athletes who were popular with
fans, and they contributed to causing the team’s winning record, die-hard fans, and brand
new stadium.
In the augmentation version, the feature inhibited the effect features. For example,
the star’s teammates were not very good athletes and were unpopular. So, the team had
its winning record, die-hard fans, and new stadium despite the teammates. The
introduction of the new feature decreases the strength of the original cause feature’s
relationship to the effects in the discounting version but increases the strength of the
original cause feature’s relationship to the effects in the augmentation version. Unlike
studies 2 and 3, the two versions present the exact same relationships among the focal
features. The only difference in the stimuli between versions is the description of the
relationship of an alternative feature as either inhibiting (augmentation version) or
facilitating (discounting version) the effects.
Procedure. Sixty-one U.S. Amazon Mechanical Turk participants read two short
scenarios about teams similar to those used in study 3 in which one feature (the cause
feature) was described as the cause of three other features (the effect features). As in
studies 2 and 3 the scenarios were accompanied by a diagram of the causal structure.
After reading the scenario, participants read about a new feature that either facilitated the
effect features (discounting version) or inhibited the effect features (augmentation

41
version). Participants read the discounting version for one team and the augmentation
version for the other team, with the identity of the teams counterbalanced and order
randomized.
After reading each scenario, participants answered a question about what the
causal relations were in that scenario, to test their comprehension. Then they evaluated
how much a change to the cause feature would 1) disrupt their loyalty to the team, and 2)
change the identity of the team. Participants reported change in loyalty on a scale of 1
(would decrease loyalty) to 7 (would increase loyalty).
Results
We performed paired t-tests to compare the changes in loyalty and perceived
disruption to identity between the discounting and augmentation versions. Consistent
with hypothesis 1, changing the feature had a larger negative impact on loyalty (smaller
numbers indicate less favorable outcomes) in the augmentation version (M = 2.66) than in
the discounting version (M = 3.33, t(60) = 3.49, p < .001, 95% CI = [.29 1.06]).
Consistent with hypothesis 2, the average perceived change in the team’s identity after
the change was significantly greater in the augmentation version (M = 75.30) than in the
discounting version (M = 64.28, t(60) = 3.57, p < .001, 95% CI = [4.85 17.19]).
We conducted a within-participant mediation analysis using the MEMORE macro
in SPSS (Montoya and Hayes 2017) to test whether the effect of version (discounting vs.
augmentation) on post-change loyalty was mediated by perceived disruption to identity.
This analysis revealed a marginal indirect effect of the manipulation on loyalty through

42
perceived disruption to identity (standardized indirect effect = .209, Bootstrapped 95% CI
= [.00 .57]). The indirect effect accounted for about one-third of the total effect (indirect
effect/total effect = .312).
The results of study 4 suggest that the perceived strength of a feature’s
relationships with other features of a brand influence how harmful changing that feature
will be on brand loyalty. We found that when the strength of a feature’s causal links are
manipulated to appear strong, changing that feature leads to more damage to brand
loyalty and more disruption to brand identity than when the strength of that feature is
manipulated to appear weak, holding constant the number of links to other features. This
suggests that the causal centrality of a brand’s feature is determined by both the number
of relationships to other features and the strength of those relationships. This broader
understanding of causal perceptions can provide insight into what consumers believe
defines brand identity and see as the basis of their loyalty.
GENERAL DISCUSSION
Why is consumers’ loyalty to a brand unaffected by some changes but disrupted
by other changes? Our findings suggest that the answer lies in consumers’ beliefs about
causal centrality, which underlie much of cognition. Prior research has neglected to
account for the role of causal beliefs about brand features in studying consumer loyalty
and responses to brand changes.
Across six studies, we found that changes to features that consumers perceive as
causally central have a more negative impact on brand loyalty than changes to features
perceived as more causally peripheral. These findings were replicated with both real and

43
hypothetical brands that spanned many product categories, using both measured and
manipulated causal centrality. Further, we identified perceived disruption to the identity
of the brand as the underlying mechanism for the effect. Studies 1B and 1C demonstrated
that changes to causally central features were perceived as more disruptive to brand
identity and that the greater the perceived disruption, the more negative the impact on
brand loyalty. These findings were confirmed in studies 2 and 3 when we manipulated
causal centrality and examined the impact of causal centrality on choice. In an internal
meta-analysis incorporating all data that we have collected (including pilot studies
reported in Appendix B), the effect of causal centrality on choice was highly significant
(62% of selections of option missing causally peripheral feature vs. 38% of selections of
option missing causally central feature, binomial sign test, p < .001), as was the effect of
causal centrality on disruption to identity (Mcentral = 55.12, Mperipheral = 43.44, t(479) =
5.18, p < .001).
In study 4, we demonstrated that another aspect of consumers’ causal beliefs,
beliefs about the strength of a feature’s causal relationships, influences how harmful a
change to that feature was to brand loyalty. Manipulations that strengthened a feature’s
causal links made changes to that feature more damaging than when the causal links were
manipulated to appear weaker, holding the number of links constant.
Incorporating causal centrality into prior theories of brand loyalty
The proposed causal reasoning approach to brand identity provides a new
perspective on prior findings about brand change. Prior research on consumer-brand

44
relationships has examined the impact of transgressions on these relationships. Our
framework may provide a new perspective on some of these previous results. For
example, Aaker et al. (2004) found that while a sincere brand’s relationship with its
customers is damaged by a service failure, an exciting brand’s relationship may be
strengthened after such a transgression. The transgression can be thought of as a change
in the brand’s perceived reliability. We suspect that, for a sincere brand, the brand’s
personality is causally connected to its reliability. On the other hand, for an exciting
brand, brand personality would be less likely to be perceived as causally connected to its
reliability, and could even be causally connected to variety and unpredictability, or other
factors suggesting unreliability. As a result, reliability would be more causally peripheral
for the exciting brand than the sincere brand. Thus, our framework would predict that a
change in reliability would disrupt the identity of the sincere brand more than the exciting
brand.
Research on audience dissipation of a serial brand (a television show) has
proposed that removing and adding components in a way that diminishes the perceived
coherence of the show is a key factor that leads fans to abandon the brand (Parmentier
and Fischer 2014). In their study of America’s Next Top Model, they suggest that the
addition of components to the show that increase heterogeneity among the brand’s
components—e.g., inclusion of contestants who are not eligible according to the rules of
the show—diminishes perceived coherence. According to our framework, coherence
would be lost when new features are added that are not causally connected to existing
features. Conversely, increasing heterogeneity would not reduce coherence when
consumers are able to make causal connections between the new features and the existing

45
features of the brand. For example, if the ineligible contestant was introduced in a way
that was explained by the show’s mission to find America’s Next Top Model, perceived
coherence would be maintained and the brand identity could be preserved. In general, our
account suggests that preserving identity or keeping a brand coherent involves
maintaining central cause-effect relationships.
Implications for future research
We provide a broad framework for identifying which changes are more likely to
disrupt brand loyalty. Our findings suggest that two brands can undergo the same change
to the same feature but experience very different results on brand loyalty because
consumers’ causal beliefs about features of the brands are different. This implies that
some of the value of an aspect of a brand lies in its causal connections to other important
features of a brand. How much consumers value a brand’s relationships with charities
does not only depend on the relationships themselves. The full value also depends on
whether consumers see the relationships as resulting from or causing other features that
make the company what it is as a brand.
While much of the brand loyalty literature has focused on direct consumer
experiences and the resulting consumer satisfaction as the drivers of brand loyalty
(Agustin and Singh 2005; Anderson and Sullivan 1993; Chandrashekran et al. 2007; Yim,
Tse, and Chan 2008), we instead focus on consumers’ beliefs about the cause-effect
relationships that make up a brand’s identity. This approach allowed us to identify novel
factors that impact brand loyalty which are independent of consumers’ direct experience

46
with the brand or its products and their evaluations of these experiences. Prior research
has attempted to quantify brand value and identify the benefits to the firm of having
higher brand value (e.g., Reichheld et al. 2000; Sullivan 1992). Our approach to brand
loyalty suggests that maintaining the perceived identity of the brand, by preserving
causally central features, may be crucial for maintaining brand value over time.
That said, we suspect that there may be several important boundary conditions. In
product categories where brands are seen as purely commodities or among consumers
who do not incorporate brand into their decisions, changes in even causally central
features may have little impact. Furthermore, in some circumstances, even changes to
causally central features of the brand could maintain or even enhance brand loyalty. If the
change to the feature provides a sufficiently large benefit to the consumer, then it may
outweigh the disruptive effects on brand identity. If the brand is seen negatively or as on
the wrong track and facing a bleak future, then changes to more causally central features
may be welcomed. Similar to people’s openness to personal change when pessimistic
about future outcomes (Yang and Urminsky 2015), even purely symbolic but causally
central brand changes may signal that a declining brand is breaking with its past and
therefore more likely to improve.
Our results also have implications for understanding to build brand identity. In
contrast to approaches to brand identity that focus on associations to the brand as a whole
(D. Aaker 1991; Keller 2001), our results suggest that consumers’ perceptions of brand
identity include beliefs about feature-feature relationships. In studies 2, 3, and 4,
changing the exact same feature had different impacts on the brand’s identity depending
on consumers’ beliefs about the feature’s causal relationships with other brand features.

47
Investigating how marketing managers can use these (beliefs about) feature-feature
relationships as a tool to build brand identity is an interesting avenue for future research.
Conclusions
The current research provides a framework for understanding how to maintain
brand loyalty. Our findings suggest that consumers’ causal beliefs 1) have a systematic
impact on which features they perceive as being most important to a brand’s identity and,
2) can inform managers about what changes are most likely to negatively impact brand
loyalty. Maintaining brand loyalty requires understanding the causal connections that
make up the brand’s identity in the minds of the consumers and preserving the causally
central features that define the brand.

48
REFERENCES Aaker, David A. Managing brand equity. Simon and Schuster, 1991. Aaker, Jennifer L. (1997), "Dimensions of Brand Personality," Journal of Marketing
Research, 34(3), 347-56.
Aaker, Jennifer L., Susan Fournier, and S. Adam Brasel (2004), “When Good Brands do
Bad,” Journal of Consumer Research, 31, 1–16.
Agustin, Clara, and Jagdip Singh (2005), "Curvilinear effects of consumer loyalty
determinants in relational exchanges." Journal of Marketing Research, 42, 96-108.
Ahn, Woo-Kyoung (1999), “Effect of Causal Structure on Category Construction,”
Memory & Cognition, 27(6), 1008-23.
Ahn, Woo-Kyoung, Nancy S. Kim, Mary E. Lassaline, and Martin J. Dennis (2000),
“Causal Status as a Determinant of Feature Centrality,” Cognitive Psychology, 41
(December), 361-416.
Anderson, Eugene W., and Mary W. Sullivan. (1993). "The Antecedents and
Consequences of Customer Satisfaction for Firms." Marketing Science, 12, 125-143.
Bellezza, Silvia, and Anat Keinan (2014), "Brand Tourists: How Non–Core Users
Enhance the Brand Image by Eliciting Pride." Journal of Consumer Research, 41,
397-417.
Botti, Simona, and Ann L. McGill (2011), “Locus of Choice: Personal Causality and
Satisfaction with Hedonic and Utilitarian Decisions,” Journal of Consumer
Research, 37 (April), 1065-78.
Carroll, Barbara A., and Aaron C. Ahuvia (2006), “Some Antecedents and Outcomes of
Brand Love,” Marketing Letters, 17, 79-89.

49
Chandrashekaran, Murali, Kristin Rotte, Stephen S. Tax and Rajdeep Grewal (2007),
“Satisfaction Strength and Customer Loyalty,” Journal of Marketing Research, 44
(February), 153-63.
Chen, Stephanie Y., Oleg Urminsky, and Daniel M. Bartels (2016), “Beliefs About the
Causal Structure of the Self-Concept Determine Which Changes Disrupt Personal
Identity,” Psychological Science, 27(10), 1398-1406.
Chernev, A. and S. Blair (2015), “Doing Well By Doing Good: The Benevolent Halo of
Corporate Social Responsibility,” Journal of Consumer Research, 41(6), 1412-25.
De Wulf, K., G. Oderkerken-Schroder, and D. Iacobucci (2001), “Investment in
Consumer Relationships: A Cross-Country and Cross-Industry Exploration,” Journal
of Marketing, 65, 33-50.
Dick, Alan S., and Kunal Basu, (1994), "Customer Loyalty: Toward an Integrated
Conceptual Framework," Journal of the Academy of Marketing Science 22, 99-113.
Erdem, Tulin and Joffre Swait (1998), “Brand Equity as a Signaling Phenomenon,”
Journal of Consumer Psychology, 7 (April), 131–57.
Frederick, Shane, Nathan Novemsky, Jing Wang, Ravi Dhar, and Stephen Nowlis (2009),
“Opportunity Cost Neglect,” Journal of Consumer Research, 36 (December), 553–61.
Folkes, Valerie S. (1984), “Consumer Reactions to Product Failure: An Attributional
Approach,” Journal of Consumer Research, 10(4), 398–410.
Folkes, Valerie S., Susan Koletsky, and John L. Graham (1987), “A Field Study of
Causal Inferences and Consumer Reaction: The View from the Airport,” Journal of
Consumer Research, 13(4), 534–39.
Fournier, Susan (1998), “Consumers and Their Brands: Developing Relationship Theory

50
in Consumer Research,” Journal of Consumer Research, 25(2), 123–44.
Gershoff, Andrew D. and Judy K. Frels (2015), “Just What Makes It Green? The Role of
Centrality of Green Product Attributes in Evaluations of Greenness,” Journal of
Marketing, 79, 97-110.
Gopnik, Alison, and Henry M. Wellman (1994), “The ‘Theory Theory,’” in Mapping the
Mind: Domain Specificity in Culture and Cognition, ed. Lawrence Hirschfeld and
Susan Gelman, New York, NY: Cambridge University Press, 257–93.
Gregoire, Yany and Robert J. Fisher (2006), “The Effects of Relationship Quality on
Customer Retaliation,” Marketing Letters, 17(1), 31–46.
______(2008), “Customer Betrayal and Retaliation: When Your Best Customers Become
Your Worst Enemies,” Journal of the Academy of Marketing Science, 36(2), 247–61.
Hagmayer, York and Steven A. Sloman (2009), “Decision Makers Conceive of
Themselves as Interveners, not Observers,” Journal of Experimental Psychology:
General, 138(1), 22-38.
He, Stephen X., and Samuel D. Bond (2015), “Why Is the Crowd Divided? Attribution
for Dispersion in Online Word of Mouth,” Journal of Consumer Research, 41
(February), 1509-27.
Keil, Frank (2006), “Explanation and Understanding,” Annual Review of Psychology, 57,
227–54.
Keller, Kevin L. (2001), “Building customer-based brand loyalty: A blueprint for creating
strong brands,” Marketing Management (July-Aug), 15-19.
Kirmani, Amna, Sanjay Sood, and Sheri Bridges (1999), “The Ownership Effect
Responses to Brand in Line Consumer Stretches,” Journal of Marketing, 63, 88–101.

51
Lin, Jhih-Syuan and Yongjun Sung (2014), “Nothing Can Tear Us Apart: The Effect of
Brand Identity Fusion in Consumer–Brand Relationships Psychology and
Marketing,” 31(1), (January), 54–69.
Maxham, James G. and Richard G. Netemeyer (2002), “A Longitudinal Study of
Complaining Customers' Evaluations of Multiple Service Failures and Recovery
Efforts,” Journal of Marketing, 66(4) (October), 57-71.
Murphy, Gregory. L., and D. L. Medin (1985), “The Role of Theories in Conceptual
Coherence,” Psychological Review, 92, 289–316.
Murphy, G. L. (2002), The Big Book of Concepts. Cambridge, MA: MIT Press.
Newman, George E., Daniel M. Bartels, and Rosanna K. Smith (2014), "Are Artworks
More Like People than Artifacts? Individual Concepts and Their Extensions." Topics
in Cognitive Science, 6, 647-662.
Newman, G. E., & Bloom, P (2012), “Art and Authenticity: The Importance of Originals
in Judgments of Value.” Journal of Experimental Psychology: General, 141, 558.
Parmentier, Marie-Agnes and Eileen Fischer (2014), “Things Fall Apart: The Dynamics
of Brand Audience Dissipation,” Journal of Consumer Research, 41, 1228-51.
Rehder, Bob, and Reid Hastie (2001), “Causal Knowledge and Categories: The Effects of
Causal Beliefs on Categorization, Induction, and Similarity,” Journal of Experimental
Psychology: General, 130(3), 323-60.
Reichheld, Frederick F., Robert G. Markey Jr, and Christopher Hopton (1996), "The
loyalty effect-the relationship between loyalty and profits." European business
journal 12, 134-39.
52
Rust, Roland T. and Richard L. Oliver (2000), “Should We Delight the Customer?,”
Journal of the Academy of Marketing Science, (December), 28-86.
Strohminger, N., and S. Nichols (2015), “Neurodegeneration and Identity,”
Psychological Science, 26, 1468–79.
Suh, Jung-Chae and Youjae Yi (2006), “When Brand Attitudes Affect the Customer
Satisfaction-Loyalty Relation: The Moderating Role of Product Involvement,”
Journal of Consumer Psychology, 16 (2), 145–55.
Sullivan, Mary W. (1998), “How Brand Names Affect the Demand for Twin
Automobiles,” Journal of Marketing Research 35 (May), 154-65.
Torelli, Carlos J., Alokparna B. Monga, and Andrew M. Kaikati (2012), “Doing Poorly
by Doing Good: Corporate Social Responsibility and Brand Concepts,” Journal of
Consumer Research, 38 (February), 948-63.
Umashankar, Nita, Raji Srinivasan, and Jeffrey R. Parker (2016), "Cross-Buying After
Product Failure Recovery? Depends on How You Feel About It." Journal of
Marketing Theory and Practice, 24, 1-22.
Waldmann, Michael R., Keith J. Holyoak, and Angela Fratianne (1995), “Causal Models
and the Acquisition of Category Structure,” Journal of Experimental Psychology,
General, 124(2), 181-206.
Yang, Adelle and Oleg Urminsky (2015) "The Foresight Effect: Local Optimism
Motivates Consistency and Local Pessimism Motivates Variety,”
Journal of Consumer Research 42(3) 361-77.

53
Appendix A: Study Stimuli
Studies 1A-1C Disruption to brand identity scale (Studies 1A and 1C) We would now like to understand how a change in each of the aspects you previously listed would change the identity of the brand. That is, for each of the aspects below, imagine that [brand] is completely different on that dimension. Do you think that [brand] would be the same brand that it is now, or would it seem like a different brand? Please indicate your answer with each of the sliders below where 0 means, "Exact same brand," and 100 means, "Completely different brand."

54
Brand loyalty scale (Studies 1B and 1C) Original brand loyalty question (beginning of survey) We will now ask you some questions to get a better understanding of your level of loyalty to [brand]. Thinking of [brand], please tell us how much you agree or disagree with the following statements on a scale of 1 to 7 where 1 means, "strongly disagree," and 7 means, "strongly disagree." Brand loyalty question for each change (end of survey) We would now like to understand how a change in each of the aspects you previously listed would change your use of the brand. That is, for each of the aspects below, imagine that [brand] is completely different on that dimension and answer the two questions about your use of the brand given the change to that aspect only. Think about this aspect of [brand]: [aspect] Imagine that [brand] is no longer [aspect]. Please answer the following questions for this new version of the brand.

55
Study 2 Scenarios
Version A Version B Imagine that Farm Basics if your favorite chain for casual dining. Farm Basics is a casual dining restaurant chain that is well-known for being committed to giving back to the community and working closely with charities and organizations. It has built a lot of strong relationships with local charities as well as organizations that are committed to protecting the environment and to improving the health of individuals. Because of its relationships with these charities and organizations, Farm Basics serves very high-quality, healthy food and has become very popular. In addition, the various charities and organizations that Farm Basics works closely with have shaped Farm Basics' values and the brand has become committed to serving sustainable, locally-sourced food.
Imagine that Farm Basics if your favorite chain for casual dining. Farm Basics is a causal dining restaurant chain that is committed to serving sustainable, locally-sourced food. Because of its use of sustainable and locally-sourced food, the chain serves very high-quality, healthy food and has become very popular. In addition, because of its use of sustainable, locally-sourced foods it has built a lot of strong relationships with local charities as well as organizations that are committed to protecting the environment and to improving the health of individuals. Farm Basics is well-known for being committed to giving back to the community and working closely with these charities and organizations.
Imagine that Arch Automotive is your favorite car company. You are extremely loyal to this brand of car. Arch Automotive's CEO is Jill Pane. Pane is a very visible and popular public figure. When she took over the company, she instilled on the company an emphasis on making only the highest quality products--Arch Automotive's products are known to be extremely reliable and to have extremely long lives. The company is also known for its very powerful design team whose members are widely regarded as being the best in the business. This team was largely recruited and put together by the CEO; many team members have expressed how lucky they feel to work with Pane.
Imagine that Arch Automotive is your favorite car company. You are extremely loyal to this brand of car. The company is known for its very powerful design team whose members are widely regarded as being the best in the business. This team was largely responsible for recruiting the company's current CEO, Jill Pane. Pane is a very visible and popular public figure who has expressed how lucky she feels to work with the team. The design team is also responsible for the company's high quality products. The team has instilled on the company an emphasis on making only the highest quality products--Arch Automotive's products are known to be extremely reliable and to have extremely long lives.

56
Choice of brand to purchase from (Version A top scenario from above table)

57
Study 3 Scenarios
Version A Version B Imagine that the Great Bay Foxes is your favorite sports team. The team’s enormously popular star player, Jake Donnelly, is largely credited with attracting the team’s die-hard fans and as the cause of the team's tremendous success—they have had a winning record for almost as long as anyone can remember. A few years ago, the owners built a new stadium because of Jake’s popularity. This stadium has become a point of pride for fans of the Foxes—it’s largely regarded as the nicest stadium in the league.
Imagine that the Great Bay Foxes is your favorite sports team. The team’s tremendous success—they have had a winning record for almost as long as anyone can remember—is largely credited with attracting the team’s die-hard fan base and ability to attract great players like the team’s enormously popular star player, Jake Donnelly. A few years ago, because of the team's success, the owners built a new stadium. This stadium has become a point of pride for fans of the Foxes—it’s largely regarded as the nicest stadium in the league.
Imagine that the New City Canaries are your favorite sports team. The team’s mascot is a canary because, as a former mining town, the canary has historical significance to the city. The owners of the Canaries always say that they bought the team because they love the New City. The Canary’s beloved star player also started playing for the team because he loved the city.
Imagine that the New City Canaries are your favorite sports team. The team’s mascot is a canary because one of the owner’s favorite birds is a canary. The owners of the Canaries selected New City as the home of the Canaries because they loved the city. The Canary’s beloved star player started playing for the team because he formerly had a great relationship with a few of the owners and wanted to work with them.

58
Choice of team to purchase ticket to watch (Version A top scenario from above table)

59
Study 4 Scenarios
Scenario Discounting and Augmentation Manipulation
Imagine that the Great Bay Foxes is your favorite sports team.
The team’s very popular star player, Jake Donnelly, is an important part of who the team is. He is largely credited with attracting the team’s die-hard fans and as the cause of the team's tremendous success—they
have had a winning record for almost as long as anyone can remember. A few years ago, the owners
built a new stadium because of Jake’s popularity. This stadium has become a point of pride for fans of
the Foxes—it’s largely regarded as the nicest stadium in the league.
Discounting As you read on the previous screen, the Great Bay Foxes' star player is responsible for the team's stadium, die-hard fans, and success (winning record). The team also has its fans, stadium, and success because a number of Jake's teammates are quite good athletes--often heavily supporting Jake's efforts in the team's victories--and are very popular with the fans. Augmentation As you read on the previous screen, the Great Bay Foxes' star player is responsible for the team's stadium, die-hard fans, and success (winning record). The team has its fans, stadium, and success despite the fact that a number of Jake's teammates are quite poor athletes--often making Jake carry the team to victory himself--and are very unpopular with the fans.
Imagine that the New City Hurricanes are your favorite sports team.
The beloved coach of the New City Hurricanes is an important part of who the team is. The Hurricanes
are known for their creative and unusual game strategy which their coach is known for. The
Hurricanes are known to be an especially tight-knit team. This is largely attributed to the coach who has always had a philosophy of treating the members of
the New City Hurricanes community as family. Hurricanes games are known to be very fun and lively. This is also attributed to the coach’s great enthusiasm for the sport and his team which is
always obvious to anyone who sees him at a game.
Discounting As you read on the previous screen, the New City Hurricane’s coach is responsible for their creative game strategy, the tight-knit nature of the team, and the lively atmosphere of their games. The owners of the New City Hurricanes share a similar perspective on the sport and encouraged the coach to be creative and take risks with strategy. The owners are very passionate about the Hurricanes and also contribute to the tight-knit nature of the team and the lively atmosphere of the games. Augmentation As you read on the previous screen, the New City Hurricane’s coach is responsible for their creative game strategy, the tight-knit nature of the team, and the lively atmosphere of their games. The team has its creative strategy, tight-knit nature, and lively atmosphere despite the fact that the owners of the team are largely detached from and unenthusiastic about the team, seeing their ownership as purely a business venture and not cultivating real relationships with anyone on the team. They also discouraged the coach’s creativity, pushing for less risky strategies.

60
Change in loyalty and disruption to team identity questions (top scenario in above table, these questions are identical for the discounting and augmentation versions) Now please tell us how much you think the departure of Jake Donnelly would affect the Great Bay Foxes' identity as a team. Please answer on a scale of 0 to 100 where 0 means that the team would remain "exactly the same team" after the move, and 100 means that the team would be a "completely different team" after the move.
Imagine now that the Great Bay Foxes' star player, Jake Donnelly, is moving to play for another team. How much do you think that this change would affect your loyalty to the team? Please answer on a scale of 1 to 7 where 1 means that the change "would decrease your loyalty" and 7 means that the change would "increase your loyalty."

61
Appendix B: Additional Studies
Causal Centrality of Brand Features and Change in Loyalty (Study 1A) Pilot Study
As an initial test of our hypothesis that changes to features perceived as more
causally central would be more harmful to brand loyalty than changes to features
perceived as more causally peripheral, we ran a study identical to study 1A (N = 100).
Data from 14 participants were dropped for failing an attention check (6) and giving all
the same answer for the change in loyalty question (8), yielding 86 cases. As in study 1A,
participants reported the eight features of a brand that they are loyal to and the causal
centrality of each of these features. They then considered a change to each feature
separately and indicated how much a change to that feature would change their loyalty to
the brand. We calculated the Spearman correlation between the causal centrality of a
feature and how much a change to that feature would change brand loyalty for each
participant. Since greater disruption to identity was indicated by larger numbers and more
harm to brand loyalty was indicated by smaller numbers, we expected an average
correlation coefficient that was significantly less than zero. The average correlation
coefficient was directionally but not significantly less than zero (M = -.06, t(85) = -1.24,
95% CI = [-.15 .03], p = .22). Based on this pre-test, we determined that a sample size of
100 provided insufficient statistical power, and ran study 1A, with a larger sample size
(N=300). When the pre-test data are merged with the data from study 1A, the relationship
between the causal centrality of a feature and the impact a change to that feature had on
brand loyalty is highly significant. The average correlation coefficient was significantly
less than zero (M = -.13, t(352) = -5.65, 95% CI = [-.17 -.08], p < .001).

62
Manipulating the Causal Centrality of Brand and Team Features (Studies 2 and 3) Pilot
Study
Sixty U.S. Amazon Mechanical Turk participants completed the pilot study. The
procedure of the pilot study was identical to that of studies 2 and 3 except that
participants read four scenarios, two about brands and two about teams. The scenarios
about teams were identical to those used in study 3 (see Appendix A). The scenarios
about brands were different than those used in study 2 (see below table).
Brand Scenarios Used in Pilot Study
Version A Version B Imagine that Cooper Soles is your favorite brand of shoes. Cooper Soles’ CEO is Jill Pane. Jill is a very visible and popular public figure. When she took over the company, she instilled on the company an emphasis of giving back, particularly to educational foundations—a cause that Jill is passionate about. The company is known for generously donating to a wide variety of charities and supporting the creation of a new school in an under-served area for every new store that they build. The company known for its trendy personality which is largely considered a reflection of Jill’s own personality.
Imagine that Cooper Soles is your favorite brand of shoes. Cooper Soles’ CEO is Jill Pane. Jill is a very visible and popular public figure. When she took over the company as CEO, she said she took the job because of the company’s dedication to giving back, particularly to educational foundations—a cause that Jill is passionate about. The company is known for generously donating to a wide variety of charities and supporting the creation of a new school in an under-served area for every new store that they build. The company has a trendy personality which is largely attributed as a reflection of the current trendiness of companies that are partnered with charities.
Imagine that SonicWear is your favorite athletic clothing company. SonicWear is known for producing very high quality athletic clothing. Because of the high quality of all the materials (which are highly durable) the clothing always looks great for a long time. Because SonicWear is known for being such a high quality brand, it has been able to attract some of the best designers in the business into its design team as well as some of your favorite athletes as spokespeople for the company.
Imagine that SonicWear is your favorite athletic clothing company. SonicWear is known for producing very high quality athletic clothing. The high quality is attributed to their design team who believes high quality materials (which are highly durable) are a must. Because SonicWear’s designers are some of the best designers in the business, the brand is known for making clothing that looks great for a long time and has been able to attract some of your favorite athletes to be spokespeople for the company.

63
Overall Analysis. Overall, participants were more likely to purchase from the team or
brand that was missing the causally peripheral feature (but retained the causally central
feature, 61.67% of selections) than the team or brand that was missing the causally
central feature (but retained the causally peripheral feature, 38.33% of selections,
binomial sign test, p < .01). A change in a causally central feature was perceived to cause
more disruption to a brand or team’s identity (M = 53.29) than a change in a peripheral
feature (M = 44.73, t(60) = 2.56, p = .012, 95% CI = [1.97 15.16]).
Brand Analysis. Analysis of data from the brand scenarios revealed that participants were
directionally but not significantly more likely to purchase from the brand that was
missing a causally peripheral feature (but retained the causally central feature, 55.00% of
selections) than the brand that was missing a causally central feature (but retained the
causally peripheral feature, 45.00% of selections, binomial sign test, p = .16). Changes in
causally central features were perceived as marginally more disruptive to a brand’s
identity (M = 55.17) than changes in peripheral features (M = 47.12, t(60) = 1.76, p =
.083, 95% CI = [-1.08 17.18]).
Given that these data were inconclusive and underpowered, in designing the
materials for study 2, we created different scenarios that had different pairs of target
features. The results from the scenario about SonicWear (in the above table) revealed that
participants reacted more strongly to changes to the quality of the brand, regardless of
that feature’s centrality—i.e., participants almost always chose to purchase from the
brand that retained high quality (and had a different CEO) whether or not quality was
causally central or peripheral (approximately 90% of selections in both versions). This

64
indicated to us that the effect of our causal centrality manipulation may have been limited
because consumers’ perceived the cost of a change in quality as large relative to the cost
of changing the CEO (see General Discussion for discussion of a similar boundary
condition). So, when designing scenarios for study 2, we tried to match the target features
more evenly.
When these pilot data were merged with those from study 2, the influence of
causal centrality on both choice and disruption to identity was highly significant.
Participants were significantly more likely to purchase from the brand that was missing a
causally peripheral feature (but retained the causally central feature, 60.00% of
selections) than the brand that was missing a causally central feature (but retained the
causally peripheral feature, 40.00% of selections, binomial sign test, p < .001). The
proportion of choices of the brand that was missing the causally peripheral feature vs. the
brand that was missing the causally central feature did not differ significantly across
studies (pilot vs. study 2, χ2(1) = 2.50, p > .05). Additionally, changes in causally central
features were perceived as significantly more disruptive to a brand’s identity (M = 58.13)
than changes in causally peripheral features (M = 46.06, t(119) = 3.58, p = < .001, 95%
CI = [5.40 18.75]). A repeated-measures ANOVA revealed that this effect did not differ
by study (pilot vs. study 2), the study by centrality interaction was not significant
(F(1,118) = 1.48, p > .05).
Team Analysis. Analysis of data from only the team scenarios revealed that participants
were significantly more likely to purchase from the team that was missing the causally
peripheral feature (but retained the causally central feature, 68.33% of selections) than
the brand that was missing the causally central feature (but retained the causally
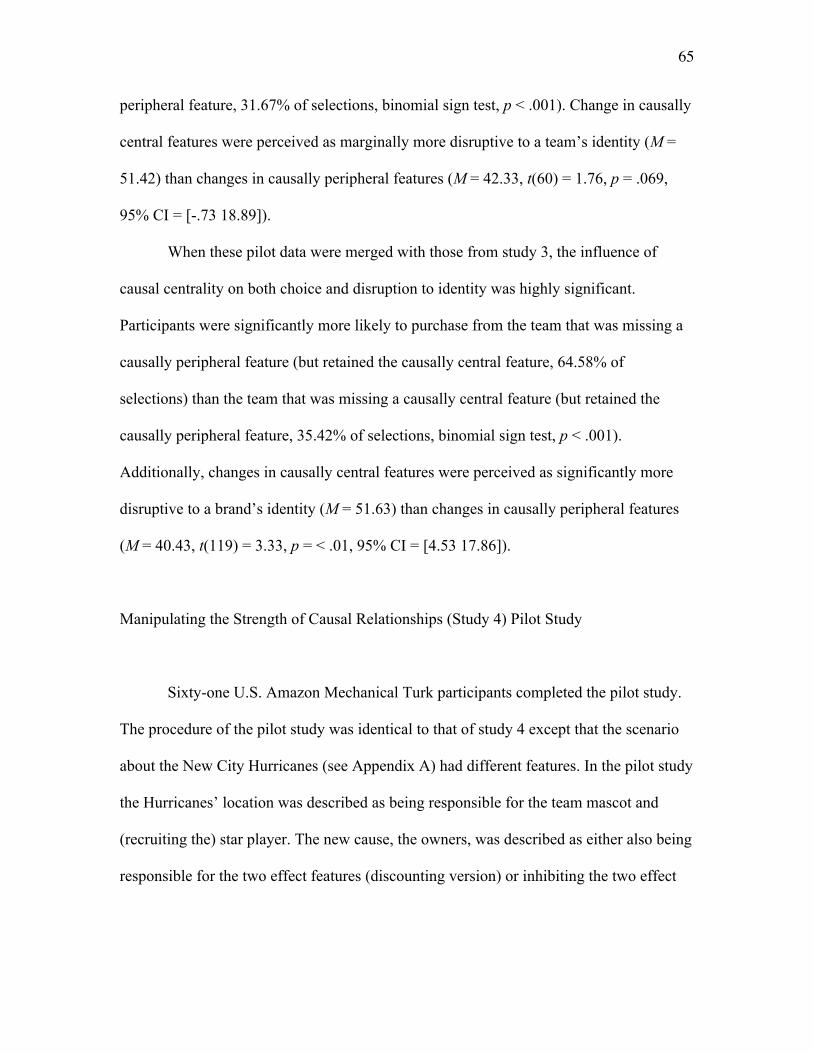
65
peripheral feature, 31.67% of selections, binomial sign test, p < .001). Change in causally
central features were perceived as marginally more disruptive to a team’s identity (M =
51.42) than changes in causally peripheral features (M = 42.33, t(60) = 1.76, p = .069,
95% CI = [-.73 18.89]).
When these pilot data were merged with those from study 3, the influence of
causal centrality on both choice and disruption to identity was highly significant.
Participants were significantly more likely to purchase from the team that was missing a
causally peripheral feature (but retained the causally central feature, 64.58% of
selections) than the team that was missing a causally central feature (but retained the
causally peripheral feature, 35.42% of selections, binomial sign test, p < .001).
Additionally, changes in causally central features were perceived as significantly more
disruptive to a brand’s identity (M = 51.63) than changes in causally peripheral features
(M = 40.43, t(119) = 3.33, p = < .01, 95% CI = [4.53 17.86]).
Manipulating the Strength of Causal Relationships (Study 4) Pilot Study
Sixty-one U.S. Amazon Mechanical Turk participants completed the pilot study.
The procedure of the pilot study was identical to that of study 4 except that the scenario
about the New City Hurricanes (see Appendix A) had different features. In the pilot study
the Hurricanes’ location was described as being responsible for the team mascot and
(recruiting the) star player. The new cause, the owners, was described as either also being
responsible for the two effect features (discounting version) or inhibiting the two effect
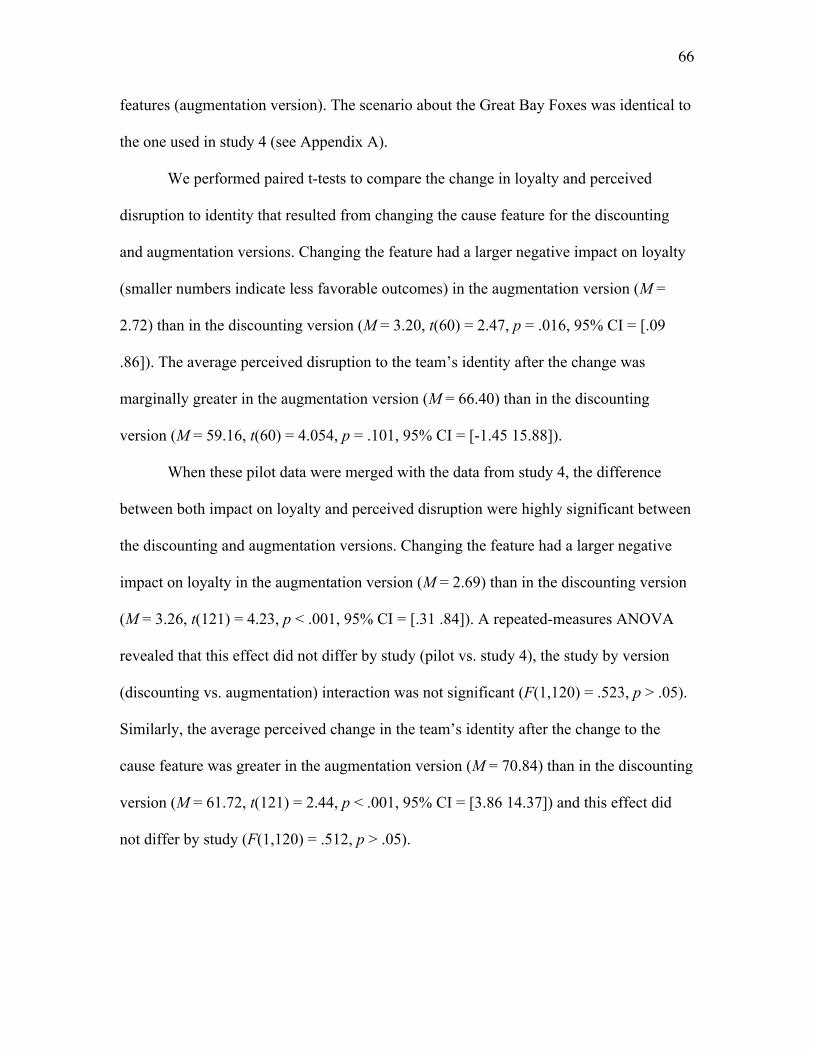
66
features (augmentation version). The scenario about the Great Bay Foxes was identical to
the one used in study 4 (see Appendix A).
We performed paired t-tests to compare the change in loyalty and perceived
disruption to identity that resulted from changing the cause feature for the discounting
and augmentation versions. Changing the feature had a larger negative impact on loyalty
(smaller numbers indicate less favorable outcomes) in the augmentation version (M =
2.72) than in the discounting version (M = 3.20, t(60) = 2.47, p = .016, 95% CI = [.09
.86]). The average perceived disruption to the team’s identity after the change was
marginally greater in the augmentation version (M = 66.40) than in the discounting
version (M = 59.16, t(60) = 4.054, p = .101, 95% CI = [-1.45 15.88]).
When these pilot data were merged with the data from study 4, the difference
between both impact on loyalty and perceived disruption were highly significant between
the discounting and augmentation versions. Changing the feature had a larger negative
impact on loyalty in the augmentation version (M = 2.69) than in the discounting version
(M = 3.26, t(121) = 4.23, p < .001, 95% CI = [.31 .84]). A repeated-measures ANOVA
revealed that this effect did not differ by study (pilot vs. study 4), the study by version
(discounting vs. augmentation) interaction was not significant (F(1,120) = .523, p > .05).
Similarly, the average perceived change in the team’s identity after the change to the
cause feature was greater in the augmentation version (M = 70.84) than in the discounting
version (M = 61.72, t(121) = 2.44, p < .001, 95% CI = [3.86 14.37]) and this effect did
not differ by study (F(1,120) = .512, p > .05).

67
Appendix C: Additional Analyses
Study 1A
Pearson correlation
We performed the correlational analysis from study 1A with a Pearson correlation
instead of a Spearman correlation. The results are similar to those presented in the main
manuscript. We found a negative correlation between number of links and change in
brand loyalty (Mcorr = -.18, t(266) = 5.89 p < .001, 95% CI = [-.24 -.12]), on average.
Analysis with all participants
We performed the correlational analysis from study 1A with all participants—i.e.,
we included participants who failed the attention checks and gave all the same answers to
the change loyalty questions or the number of causal links question. As the correlations
cannot be calculated for participants who gave all the same answers, we assigned these
participants a correlation of 0 (as would be expected if there were no relationship
between causal centrality and disruption to identity). The results are similar to those
presented in the main manuscript. We found a negative correlation between number of
links and change in brand loyalty (Mcorr = -.18, t(300) = 5.88 p < .001, 95% CI = [-.24 -
.12]), on average. Changes to more causally central features were evaluated as more
negatively impacting brand loyalty than changes to more peripheral features. The
majority of participants (58%) had a negative individual-level correlation between the
number of connections a feature had and their rated change in brand loyalty.
Study 1B

68
Pearson correlation
We performed the correlational analysis from study 1B with a Pearson correlation
instead of a Spearman correlation. The results are similar to those presented in the main
manuscript. We found a positive correlation between number of links and disruption to
brand identity (Mcorr = .13, t(92) = 2.28 p < .05, 95% CI = [.02 .24]), on average.
Analysis with all participants
We performed the correlational analysis from study 1B with all participants—i.e.,
we included participants who failed the attention checks and gave all the same answers to
the disruption to identity questions or the number of causal links question (as described
above, participants who gave all the same answers were assigned a correlation coefficient
of 0). The results are similar to those presented in the main manuscript. We found a
positive correlation between number of links and disruption to brand identity (Mcorr = .13,
t(98) = 2.45, p < .01, 95% CI = [.02 .23]), on average. Changes to more causally central
features were evaluated as more disruptive to brand identity than changes to more
peripheral features. The majority of participants (62%) had a positive individual-level
correlation between the number of connections a feature had and how disruptive a change
to that feature would be to the brand’s identity.
Study 1C
Pearson correlation
We performed the correlational analysis from study 1C with a Pearson correlation
instead of a Spearman correlation. The results are similar to those presented in the main

69
manuscript. We found a negative correlation between number of links and change in
brand loyalty (Mcorr = -.18, t(88) = 3.42 p < .01, 95% CI = [-.28 -.07]), on average. We
also found a positive correlation between number of links and disruption to brand identity
(Mcorr = .21, t(88) = 3.41 p < .01, 95% CI = [.09 .33]), on average.
Analysis with all participants
We performed the correlational analysis from study 1C with all participants—i.e.,
we included participants who failed the attention checks and gave all the same answers to
the disruption to identity questions or the number of causal links question (as described
above, participants who gave all the same answers were assigned a correlation coefficient
of 0). The results are similar to those presented in the main manuscript.
Changes to causally central features more negatively impacted brand loyalty than
changes to more causally peripheral features. The average correlation coefficient was
significantly less than zero (Mcorr = -.15, t(99) = 3.17, p < .01, 95% CI = [-.24 -.05]). The
majority of participants (54%) demonstrated a negative individual-level correlation
between the number of connections a feature had and change in loyalty.
Changes to more causally central features were more disruptive to brand identity
than changes to more causally peripheral features. The average correlation coefficient for
number of links and disruption to identity was positive (Mcorr = 0.19, t(99) = 3.55, p <
.001, 95% CI = [.08 .29]). The majority of participants (66%) had a positive individual-
level correlation between the number of connections a feature had and rated
disruptiveness of change.