note: to print these slides in black on white, choose grayscale under options in print preview
TRANSCRIPT

NOTE: To print these slides in black on white, choose grayscale under Options in print preview.

MISSISSIPPI ECONOMIC OUTLOOK 2010-2015
NATIONAL TRENDSMISSISSIPPI TRENDS
EMPLOYMENT
INDUSTRIES
STATE BUDGET
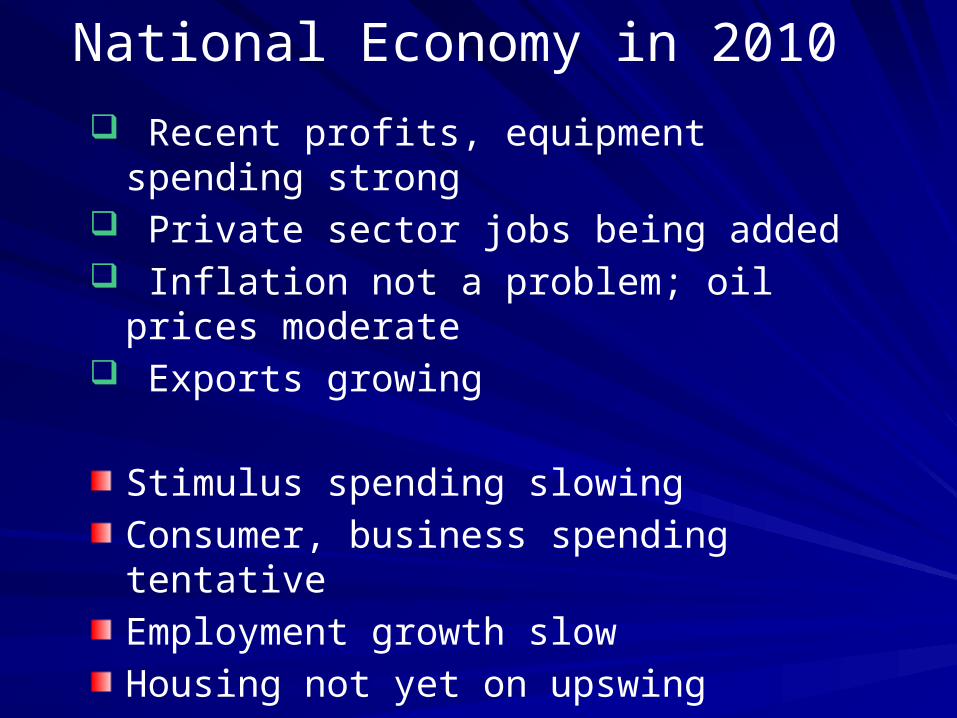
National Economy in 2010
Recent profits, equipment spending strong Private sector jobs being added Inflation not a problem; oil prices moderate Exports growing
Stimulus spending slowing
Consumer, business spending tentative
Employment growth slow
Housing not yet on upswing
Toxic assets remain on financial books
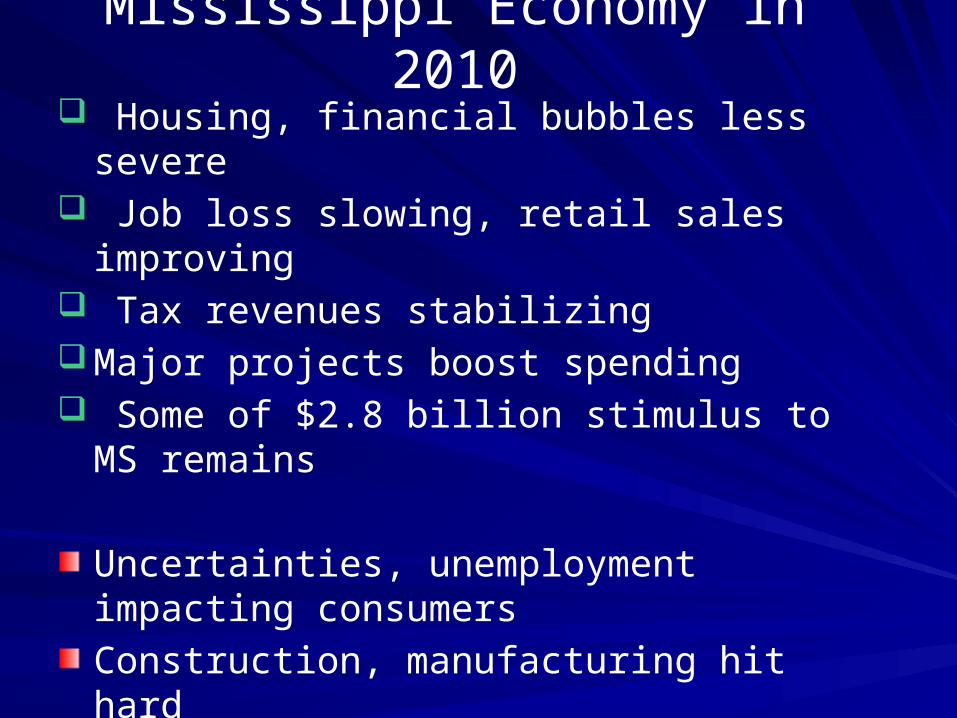
Mississippi Economy in 2010 Housing, financial bubbles less severe Job loss slowing, retail sales improving Tax revenues stabilizing Major projects boost spending Some of $2.8 billion stimulus to MS remains
Uncertainties, unemployment impacting consumers
Construction, manufacturing hit hard
Tax revenues low relative to state budget
Long-term challenges on hold
5
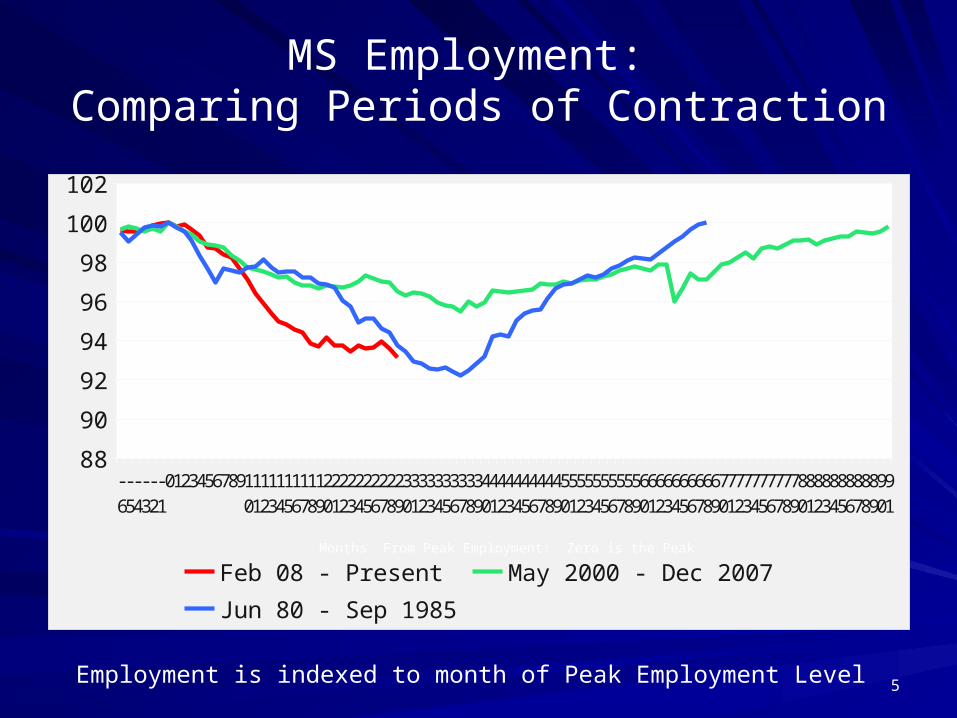
MS Employment: Comparing Periods of Contraction
-6-5-4-3-2-101234567891
0111213141516171819202122232425262728293031323334353637383940414243444546474849505152535455565758596061626364656667686970717273747576777879808182838485868788899091
88
90
92
94
96
98
100
102
Feb 08 - Present May 2000 - Dec 2007 Jun 80 - Sep 1985
Employment is indexed to month of Peak Employment Level
Months From Peak Employment: Zero is the Peak
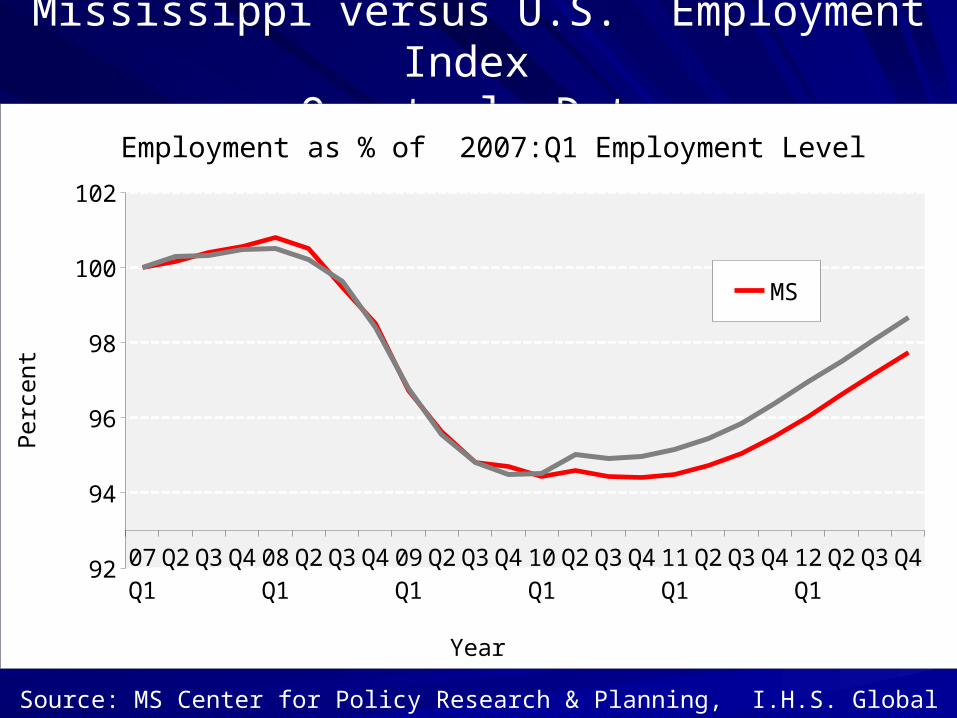
Mississippi versus U.S. Employment Index Quarterly Data
Source: MS Center for Policy Research & Planning, I.H.S. Global Insight.
07Q1
Q2
Q3
Q4
08Q1
Q2
Q3
Q4
09Q1
Q2
Q3
Q4
10Q1
Q2
Q3
Q4
11Q1
Q2
Q3
Q4
12Q1
Q2
Q3
Q492
94
96
98
100
102
Employment as % of 2007:Q1 Employment Level
MSUS
Year
Per
cent
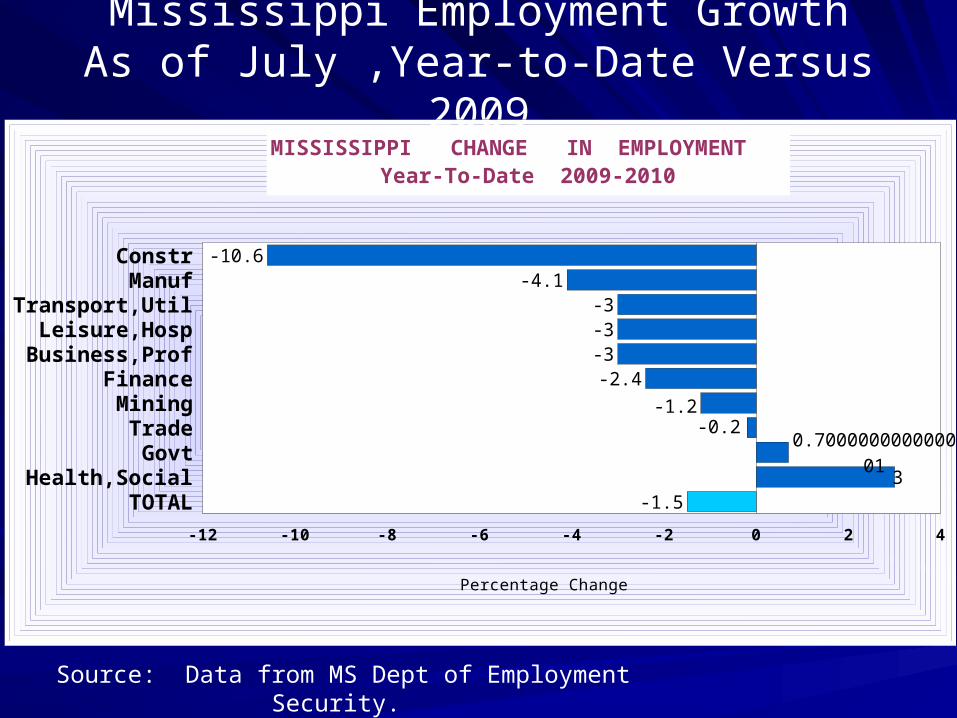
Mississippi Employment GrowthAs of July ,Year-to-Date Versus 2009
Source: Data from MS Dept of Employment Security.
ConstrManuf
Transport,UtilLeisure,Hosp
Business,ProfFinance
MiningTradeGovt
Health,SocialTOTAL
-12 -10 -8 -6 -4 -2 0 2 4
-10.6-4.1
-3-3-3
-2.4
-1.2-0.2
0.700000000000001
3-1.5
MISSISSIPPI CHANGE IN EMPLOYMENT Year-To-Date 2009-2010
Percentage Change
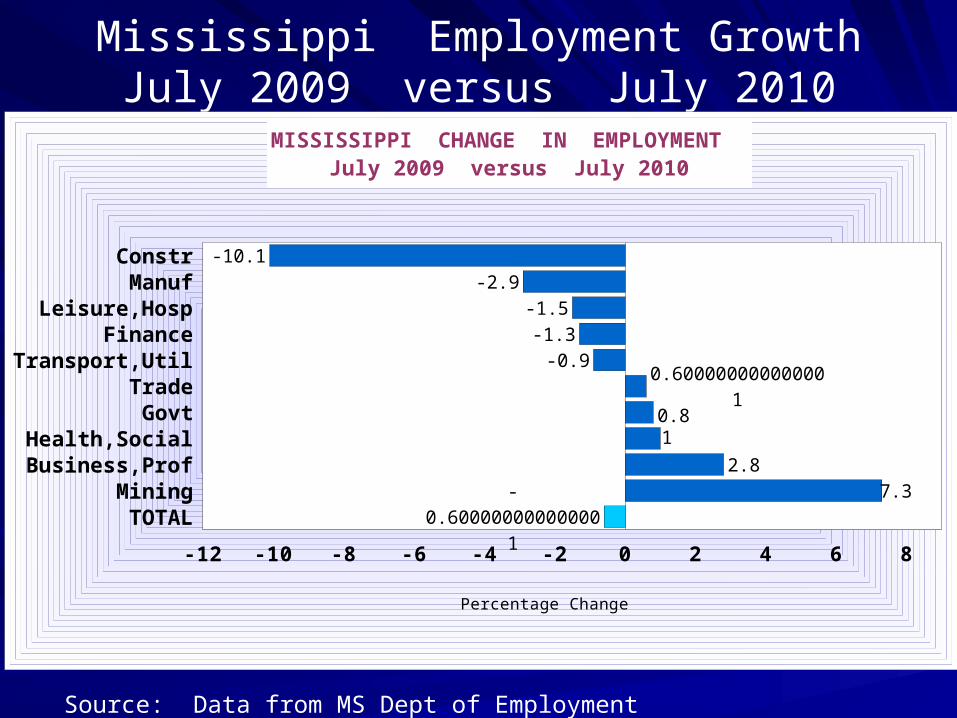
Mississippi Employment GrowthJuly 2009 versus July 2010
Source: Data from MS Dept of Employment Security.
ConstrManuf
Leisure,HospFinance
Transport,UtilTradeGovt
Health,SocialBusiness,Prof
MiningTOTAL
-12 -10 -8 -6 -4 -2 0 2 4 6 8
-10.1
-2.9
-1.5
-1.3
-0.9
0.600000000000001
0.81
2.8
7.3-
0.600000000000001
MISSISSIPPI CHANGE IN EMPLOYMENT July 2009 versus July 2010
Percentage Change
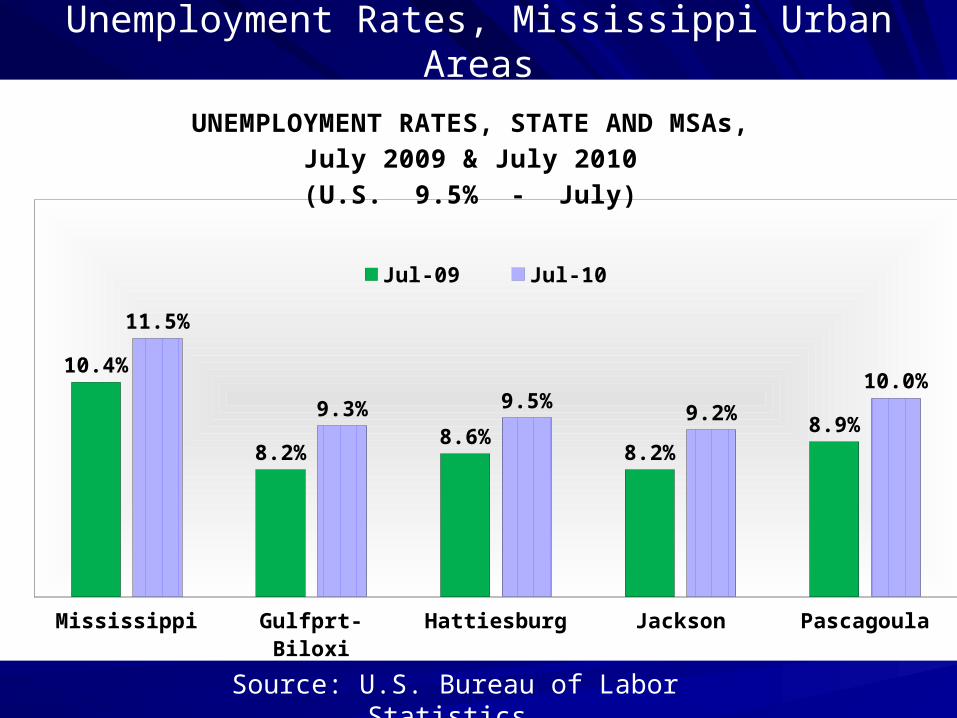
Unemployment Rates, Mississippi Urban Areas
Source: U.S. Bureau of Labor Statistics.
Mississippi Gulfprt-Biloxi Hattiesburg Jackson Pascagoula
10.4%
8.2%8.6%
8.2%8.9%
11.5%
9.3% 9.5%9.2%
10.0%
UNEMPLOYMENT RATES, STATE AND MSAs, July 2009 & July 2010
(U.S. 9.5% - July)
Jul-09 Jul-10
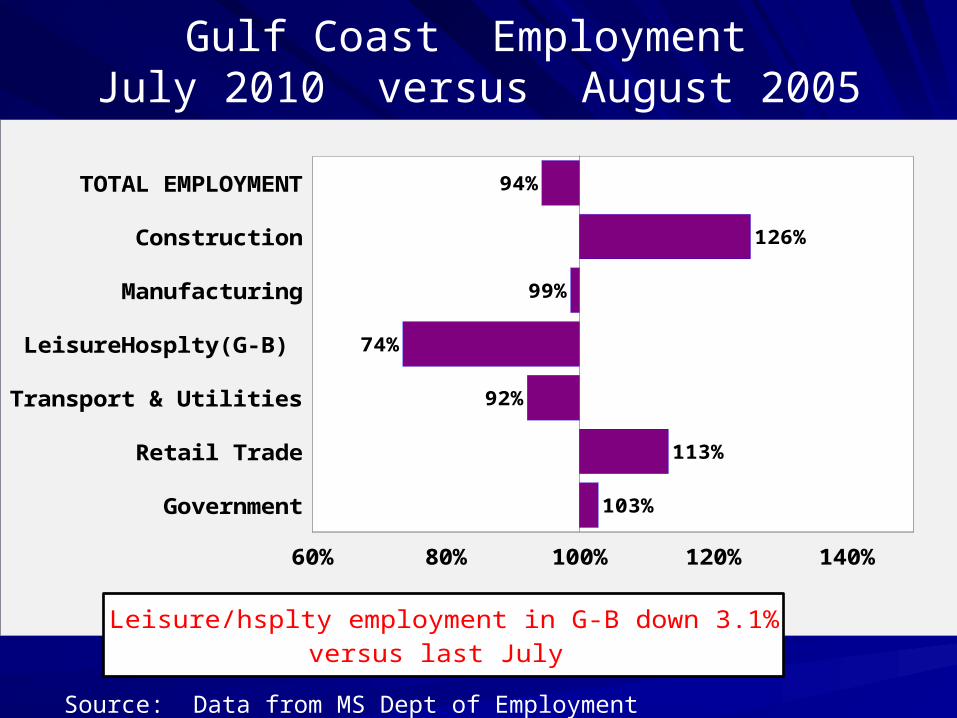
Gulf Coast Employment July 2010 versus August 2005
Source: Data from MS Dept of Employment Security.
TOTAL EMPLOYMENT
Construction
Manufacturing
LeisureHosplty(G-B)
Transport & Utilities
Retail Trade
Government
60% 80% 100% 120% 140%
94%
126%
99%
74%
92%
113%
103%
Leisure/hsplty employment in G-B down 3.1% versus last July
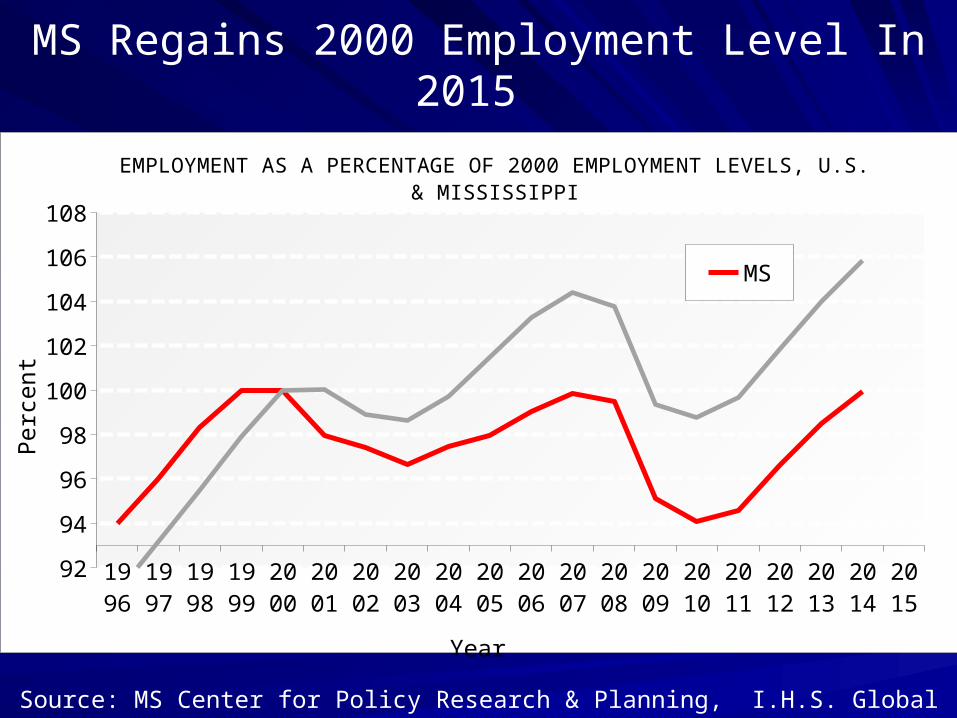
MS Regains 2000 Employment Level In 2015
Source: MS Center for Policy Research & Planning, I.H.S. Global Insight.
1996
1997
1998
1999
2000
2001
2002
2003
2004
2005
2006
2007
2008
2009
2010
2011
2012
2013
2014
2015
92
94
96
98
100
102
104
106
108
EMPLOYMENT AS A PERCENTAGE OF 2000 EMPLOYMENT LEVELS, U.S. & MISSISSIPPI
MSUS
Year
Per
cent

Employment By Sector 2010, MS vs. U.S.(Percent)
Source: US Bureau of Labor Statistics.
0%
10%
20%
23%
13%
16%
11%
4% 4% 4%
11%
8%
17%
13%
MS US
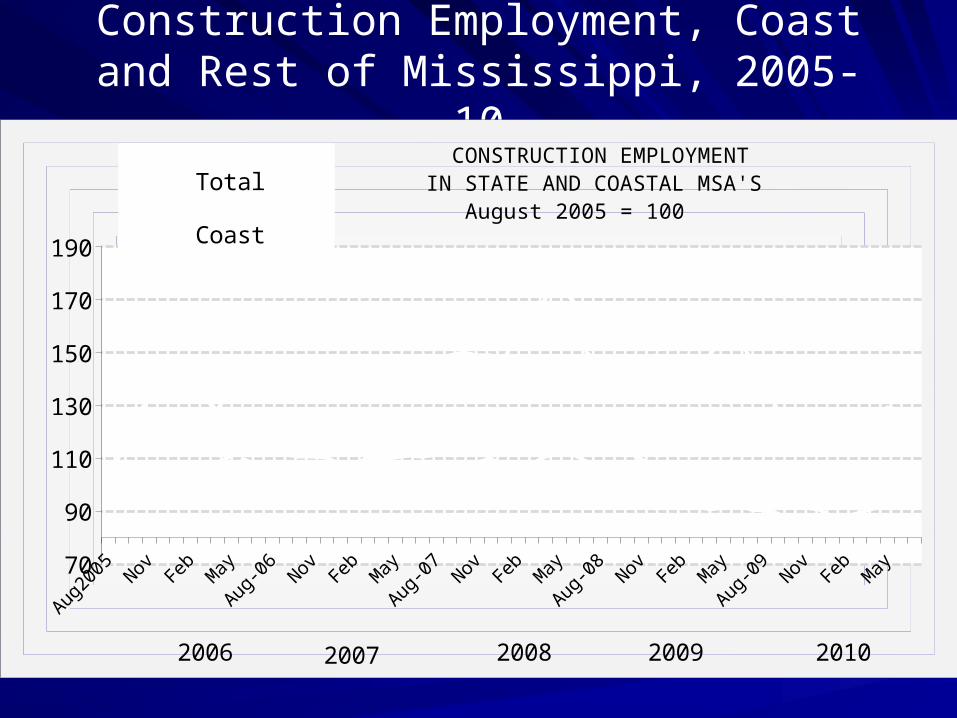
Construction Employment, Coast and Rest of Mississippi, 2005-10
Aug2005
NovFeb
May
Aug-06
NovFeb
May
Aug-07
NovFeb
May
Aug-08
NovFeb
May
Aug-09
NovFeb
May70
90
110
130
150
170
190
CONSTRUCTION EMPLOYMENT IN STATE AND COASTAL MSA'S
August 2005 = 100 Total
Coast
Rest of State
2007 2008 2009 20102006
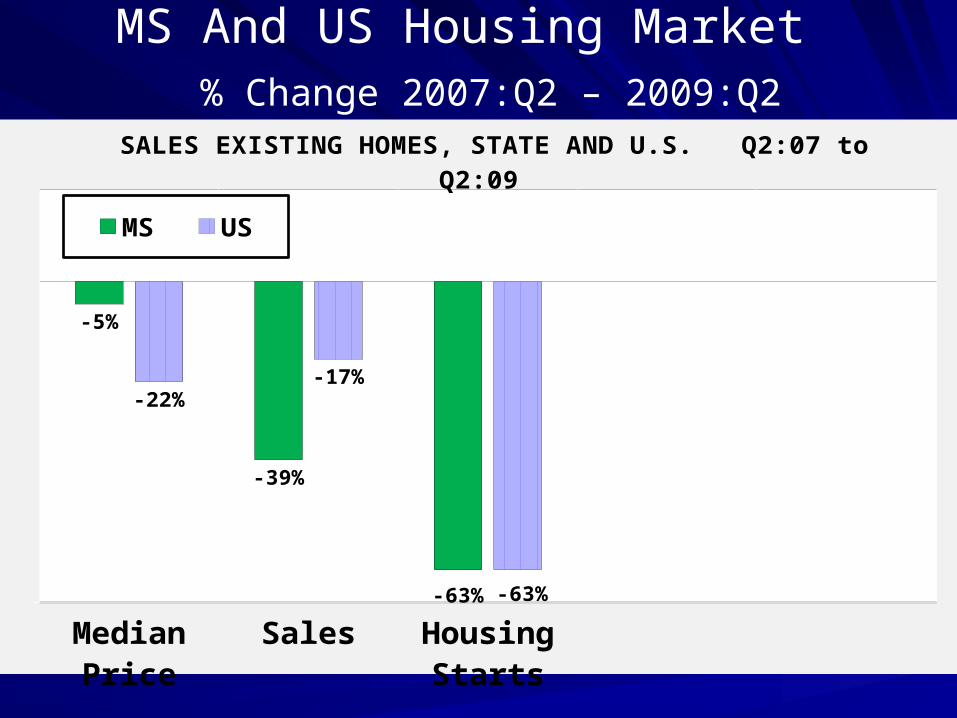
MS And US Housing Market % Change 2007:Q2 – 2009:Q2
Median Price
Sales Housing Starts
-5%
-39%
-63%
-22%-17%
-63%
SALES EXISTING HOMES, STATE AND U.S. Q2:07 to Q2:09
MS US
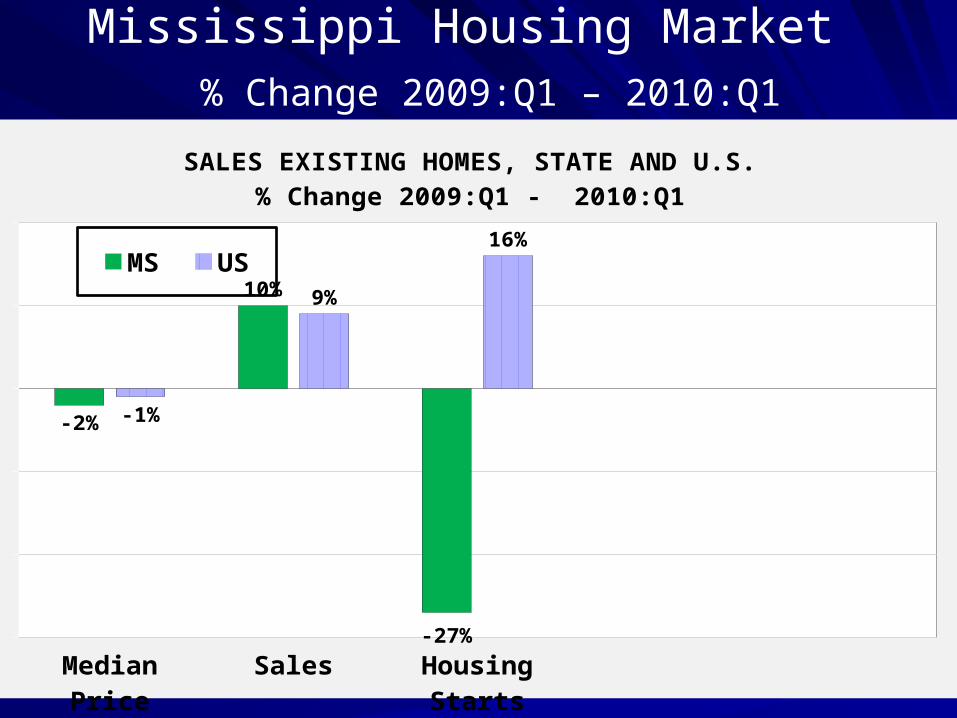
Mississippi Housing Market % Change 2009:Q1 – 2010:Q1
Median Price Sales Housing Starts
-2%
10%
-27%
-1%
9%
16%
SALES EXISTING HOMES, STATE AND U.S. % Change 2009:Q1 - 2010:Q1
MS US

Value of Housing Building Permits Mississippi, Aug. 2008 - July 2010
Aug Sep Oct Nov Dec Jan Feb Mar Apr May Jun Jul20
40
60
80
100
120
140
160
180
Value of Residential Building Permits($ millions)
08-09 09-10
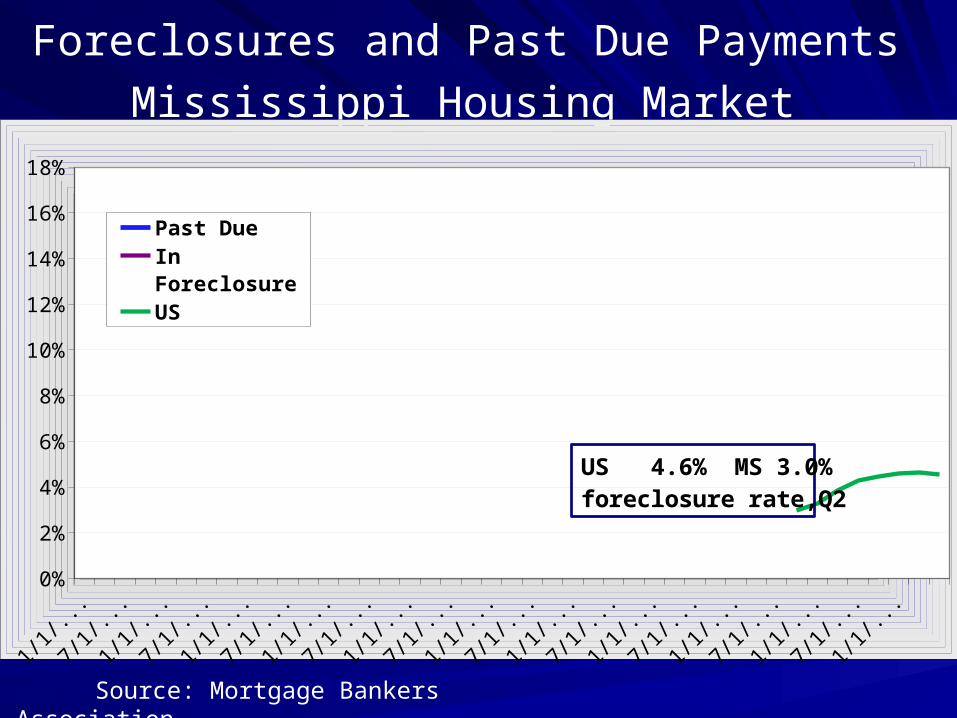
Foreclosures and Past Due Payments
Mississippi Housing Market
Source: Mortgage Bankers Association.
J-00 J-01 J-02 J-03 J-04 J-05 J-06 J-07 J-08 J-09 J-100%
2%
4%
6%
8%
10%
12%
14%
16%
18%
Past Due
In Foreclosure
US
US 4.6% MS 3.0%foreclosure rate,Q2
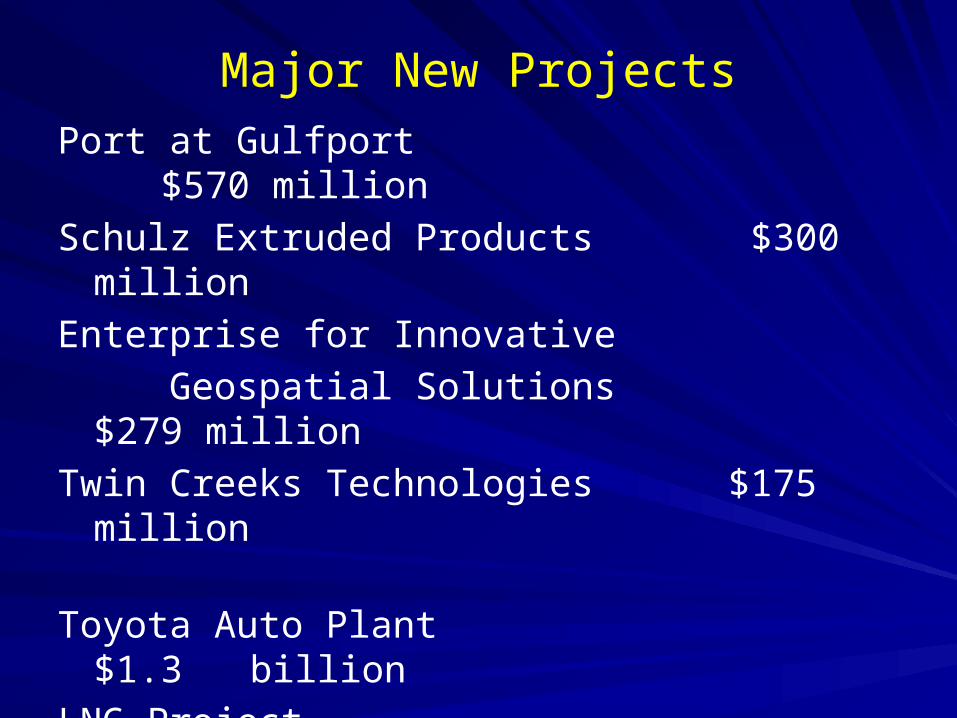
Major New Projects
Port at Gulfport $570 million
Schulz Extruded Products $300 million
Enterprise for Innovative
Geospatial Solutions $279 million
Twin Creeks Technologies $175 million
Toyota Auto Plant $1.3 billion
LNG Project $1.1 billion
Severstal Expansion $500 million
Keesler Air Force Project $950 million
Source: Mississippi Authority Development

Mississippi Retail SalesAugust 2008 to July 2010
Source: Mississippi Department of Revenue.
Jul Aug Sep Oct Nov Dec Jan Feb Mar Apr May Jun2,500
2,700
2,900
3,100
3,300
3,500
3,700
3,900
4,100
4,300
4,500
Retail Sales$ millions
08-09 09-10
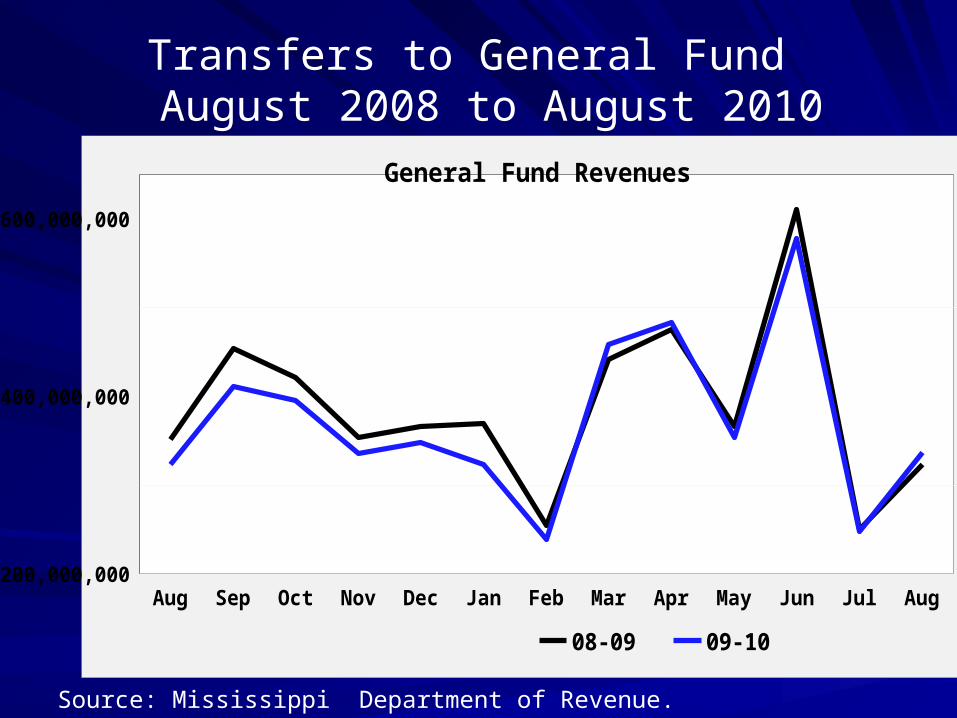
Transfers to General Fund August 2008 to August 2010
Source: Mississippi Department of Revenue.
Aug Sep Oct Nov Dec Jan Feb Mar Apr May Jun Jul Aug200,000,000
400,000,000
600,000,000
General Fund Revenues
08-09 09-10
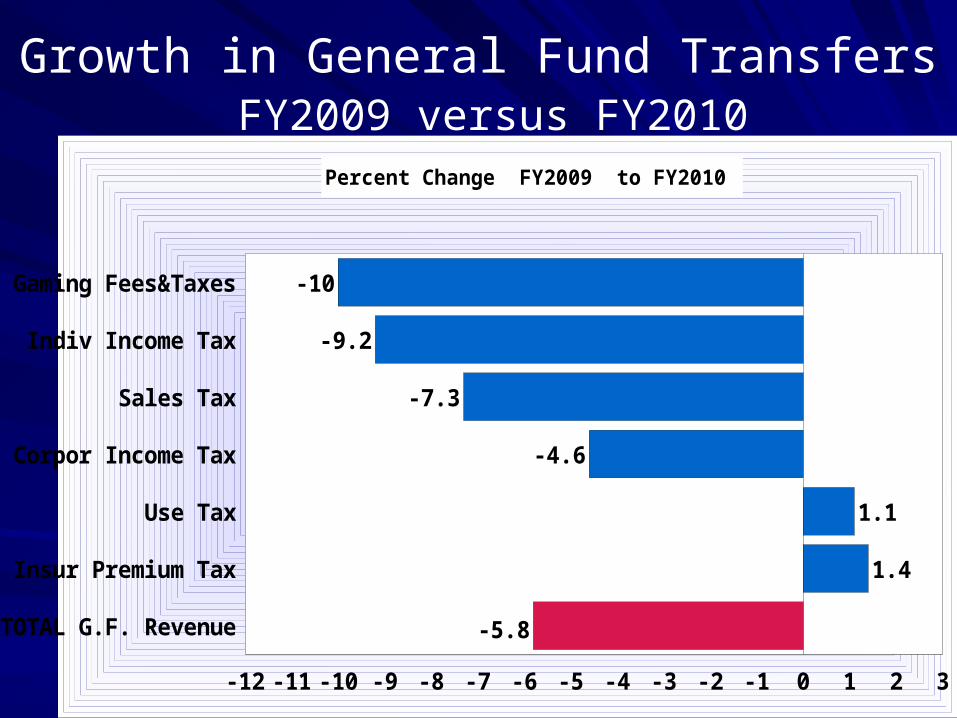
Growth in General Fund Transfers FY2009 versus FY2010
Gaming Fees&Taxes
Indiv Income Tax
Sales Tax
Corpor Income Tax
Use Tax
Insur Premium Tax
TOTAL G.F. Revenue
-12 -11 -10 -9 -8 -7 -6 -5 -4 -3 -2 -1 0 1 2 3
-10
-9.2
-7.3
-4.6
1.1
1.4
-5.8
Percent Change FY2009 to FY2010
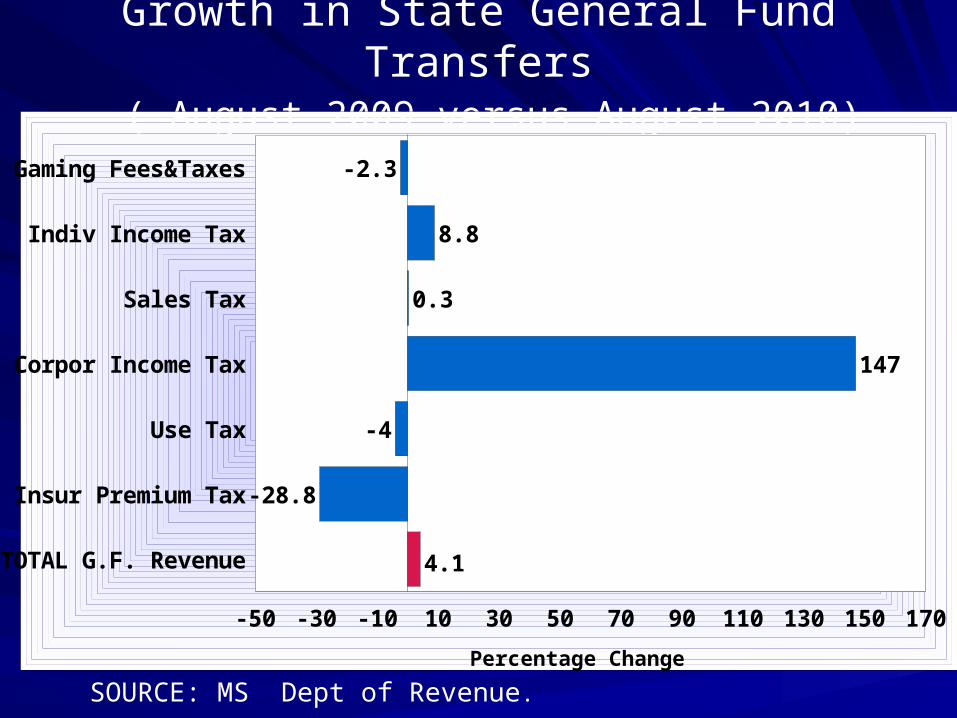
Growth in State General Fund Transfers ( August 2009 versus August 2010)
SOURCE: MS Dept of Revenue.
Gaming Fees&Taxes
Indiv Income Tax
Sales Tax
Corpor Income Tax
Use Tax
Insur Premium Tax
TOTAL G.F. Revenue
-50 -30 -10 10 30 50 70 90 110 130 150 170
-2.3
8.8
0.3
147
-4
-28.8
4.1
Percentage Change
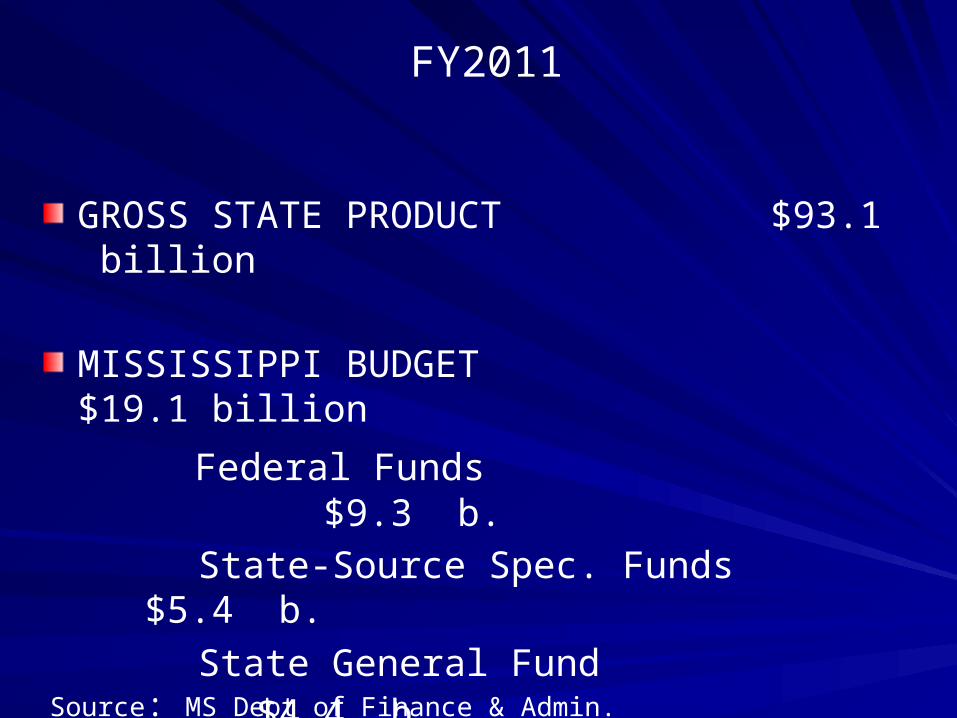
FY2011
GROSS STATE PRODUCT $93.1 billion
MISSISSIPPI BUDGET $19.1 billion
Federal Funds $9.3 b.
State-Source Spec. Funds $5.4 b.
State General Fund $4.4 b.
Source: MS Dept of Finance & Admin.
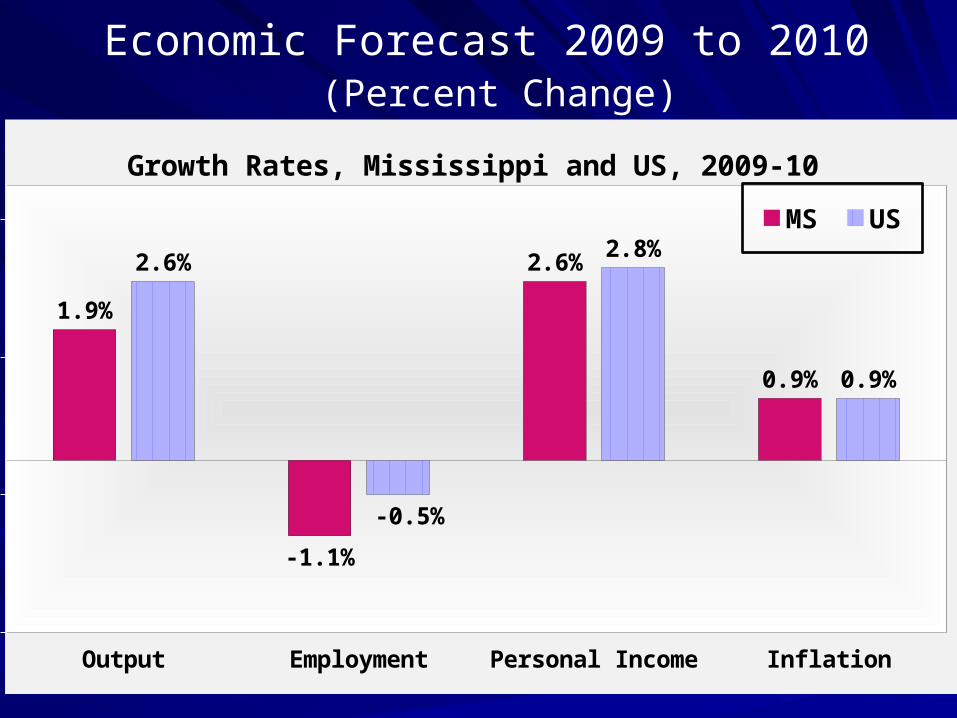
Economic Forecast 2009 to 2010 (Percent Change)
Output Employment Personal Income Inflation
1.9%
-1.1%
2.6%
0.9%
2.6%
-0.5%
2.8%
0.9%
Growth Rates, Mississippi and US, 2009-10
MS US
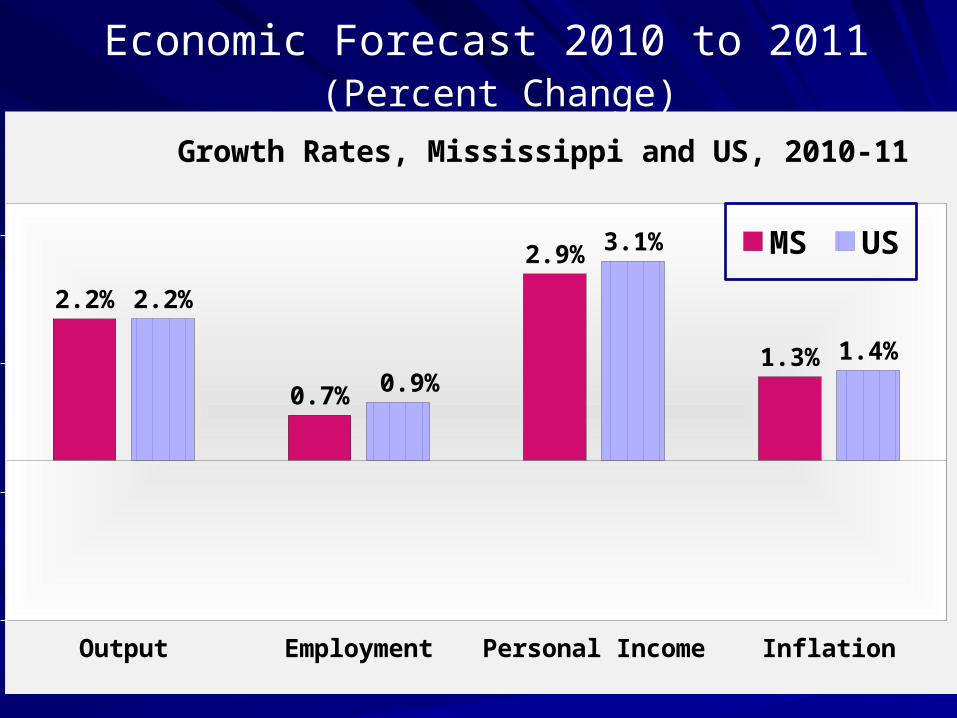
Economic Forecast 2010 to 2011 (Percent Change)
Output Employment Personal Income Inflation
2.2%
0.7%
2.9%
1.3%
2.2%
0.9%
3.1%
1.4%
Growth Rates, Mississippi and US, 2010-11
MS US
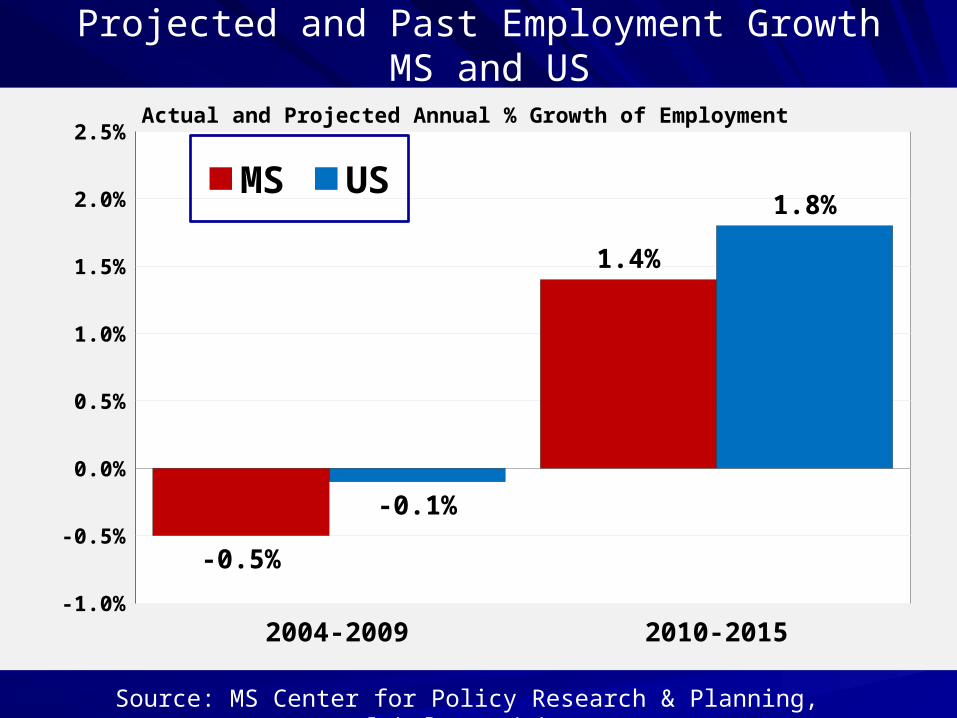
Projected and Past Employment Growth MS and US
Source: MS Center for Policy Research & Planning, Global Insight.
2004-2009 2010-2015-1.0%
-0.5%
0.0%
0.5%
1.0%
1.5%
2.0%
2.5%
-0.5%
1.4%
-0.1%
1.8%
Actual and Projected Annual % Growth of Employment
MS US
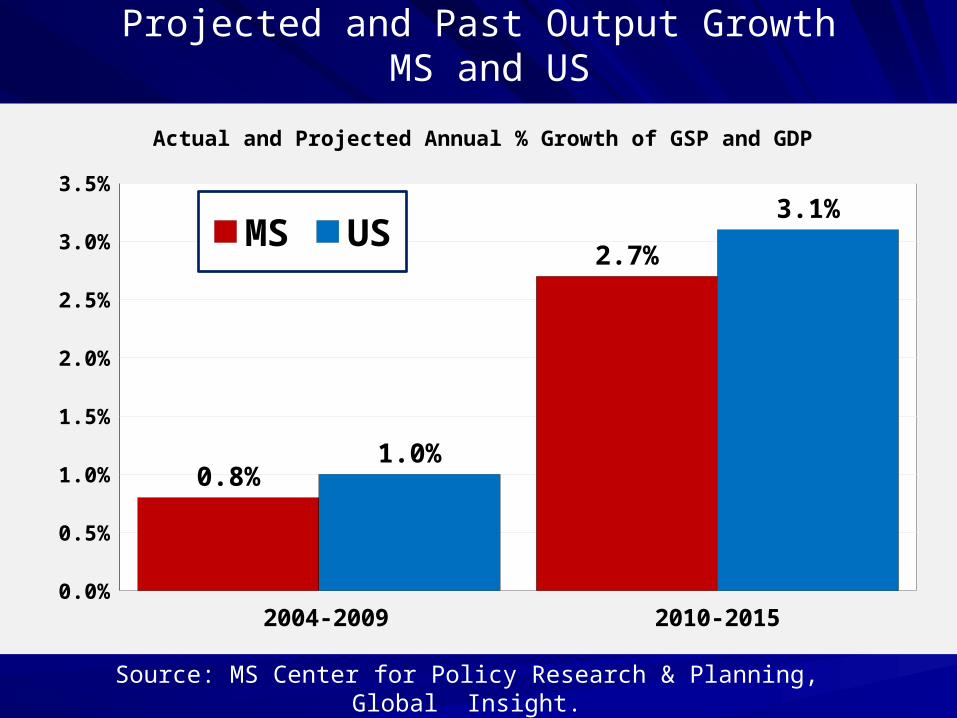
Projected and Past Output Growth MS and US
Source: MS Center for Policy Research & Planning, Global Insight.
2004-2009 2010-20150.0%
0.5%
1.0%
1.5%
2.0%
2.5%
3.0%
3.5%
0.8%
2.7%
1.0%
3.1%
Actual and Projected Annual % Growth of GSP and GDP
MS US
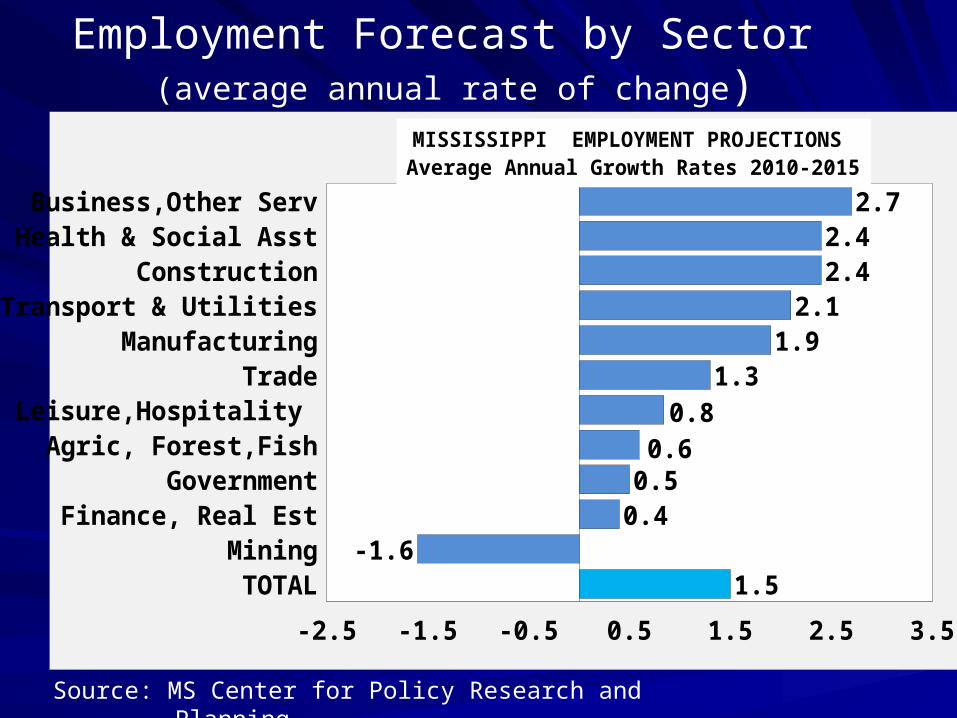
Employment Forecast by Sector (average annual rate of change)
Source: MS Center for Policy Research and Planning.
Business,Other ServHealth & Social Asst
ConstructionTransport & Utilities
Manufacturing Trade
Leisure,Hospitality Agric, Forest,Fish
GovernmentFinance, Real Est
MiningTOTAL
-2.5 -1.5 -0.5 0.5 1.5 2.5 3.5
2.72.42.4
2.11.9
1.30.8
0.60.5
0.4-1.6
1.5
MISSISSIPPI EMPLOYMENT PROJECTIONS Average Annual Growth Rates 2010-2015

WILL THIS CRISIS BE AN OPPORTUNITY LOST?
Financial Sector: Transparency & Accountability
Restructuring: Health, Energy Social Safety Net State Budget: Performance-Based
Budgeting, Policymaking Capacity,
Tax Reform
EDUCATION AND THE SKILL GAP
29% of persons in U.S. from 25 to 64 years old have a bachelor’s degree or higher
Only 20% of persons from 25 to 64 years old in Mississippi have a bachelor’s degree or higher
SOURCE: U.S. Census and U.S. Monthly Labor Review, U.S. Dept. of Labor, 2007.
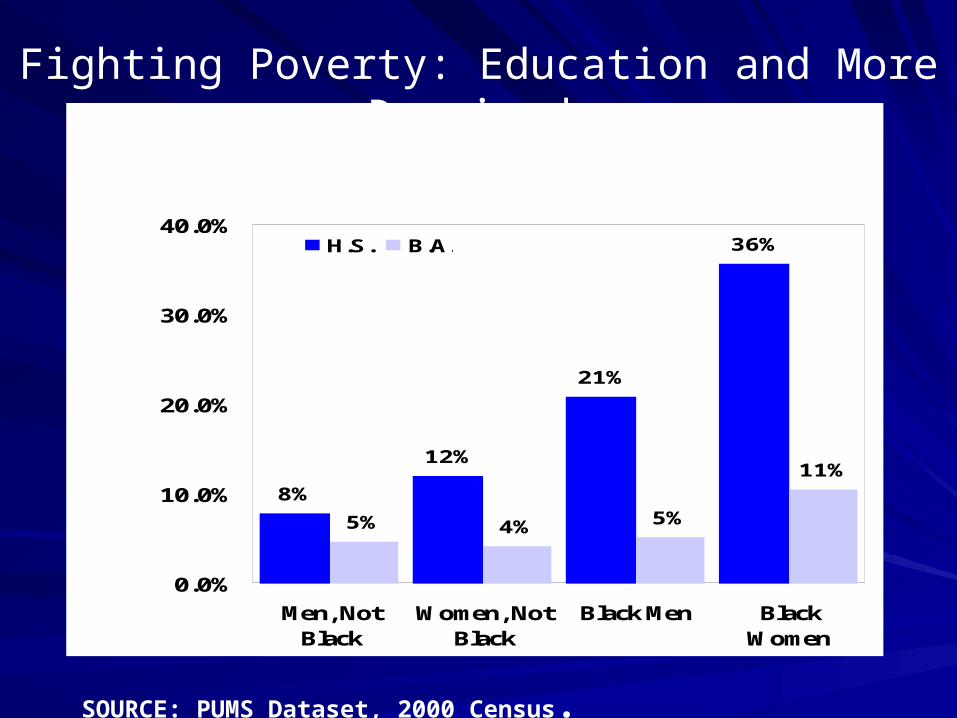
SOURCE: PUMS Dataset, 2000 Census.
8%
12%
21%
36%
5% 4% 5%
11%
0.0%
10.0%
20.0%
30.0%
40.0%
Men, NotBlack
Women, NotBlack
Black Men BlackWomen
H.S. B.A.
POVERTY RATES OF ADULTS, AGED 18 - 64,BY LEVEL OF EDUCATION, MISSISSIPPI
Fighting Poverty: Education and More Required
IN SUMMARY Starting climb from bottom
Jobs, state revenues stabilizing US, world growth will be a positive Major projects on-line
Long-term challenges remain Ability to innovate, compete Education, research State budget, health, energy, social issues

MISSISSIPPI ECONOMIC REVIEW& OUTLOOK
and MISSISSIPPI’S BUSINESS at
www.mississippi.edu/URC
Join MS Economy Listserve: contact [email protected] University Research Center