notes: ecological pyramids - fths wiki · web viewbackground extinction, bioaccumulation,...
TRANSCRIPT

178

Community and Ecosystems Cover Page
179
Community and EcosystemsAt the end of this unit, I will
o LS 2-4: Use mathematical representations to support claims for the cycling of matter and flow of energy among organisms in an ecosystem.
o LS 2-2: Use mathematical representations to support and revise explanations based on evidence about factors affecting biodiversity and populations in ecosystems of different scales.
o LS 2-7: Design, evaluate, and refine a solution for reducing the impacts of human activities on the environment and biodiversity.
o LS 4-6: Create or revise a simulation to test a solution to mitigate adverse impacts of human activity on biodiversity.
o LS 2-6: Evaluate the claims, evidence, and reasoning that the complex interactions in ecosystems maintain relatively consistent numbers and types of organisms in stable conditions, but changing conditions may result in a new ecosystem.
o ETS 1-1: Analyze a major global challenge to specify qualitative and quantitative criteria and constraints for solutions that account for societal needs and wants.
o ETS 1-1: Analyze a major global challenge to specify qualitative and quantitative criteria and constraints for solutions that account for societal needs and wants.
o ETS 1-2: Design a solution to a complex real-world problem by breaking it down into smaller, more manageable problems that can be solved through engineering.
o ETS 1-3: Evaluate a solution to a complex real-world problem based on prioritized criteria and trade-offs that account for a range of constraints, including cost, safety, reliability, and aesthetics as well as possible social, cultural, and environmental impacts.
o ETS 1-4: Use a computer simulation to model the impact of proposed solutions to a complex real-world problem with numerous criteria and constraints on interactions within and between systems relevant to the problem.
Roots, Prefixes and Suffixes I will be able to understand when I see them in words are:
o Bio-, eco-, sym-, troph-, mutual-, commense-, succeed-, commune-o –ism, -system
The terms I can clearly define are:o Background extinction, Bioaccumulation, Biodiversity, Biomass, Commensalism,
Community, Competition, Ecosystem, Extinction, Genetic diversity, Habitat, Introduced/Invasive species, Mass extinction, Mutualism, Niche, Over-exploitation, Parasitism, Predation, Primary succession, Secondary succession, Symbiotic relationship, Trophic levels
The assignments I will have completed by the end of this unit are: q Ecological pyramids virtual lab activityq Pyramid of biomass vs. pyramid of numbersq Energy in trophic levelsq Deadly links gameq What is bioaccumulation?q DDT in real lifeq Notes: Biodiversityq Notes: Ecological successionq Why conserve biodiversity?q Invasive species and biodiversityq Conserving biodiversityq Lab Activity: Vanishing Frogsq Chlorophyll in lakesq Carbon cycle review
180

q Reforestation: impact on climateq Community & ecosystems unit concept mapq Parent pageq Community & ecosystems study guide
181

Notes: Community Interactions(read pages 36-40 in your textbook)
What is a community? A biological community is ______________________________________________
_____________________________________________________________________________
What is an ecosystem? An ecosystem is __________________________________________________________
______________________________________________________________________________
What is the difference between a habitat and a niche?
Habitat – _________________________________________________________
_____________________________________________________________________
o Ex. A tree or grove of trees
Niche - ____________________________________________________________
_____________________________________________________________________
o How it meets its needs for food, shelter, and
reproduction.
What are 3 ways communities can interact?
1. Competition
Occurs when ____________________________________________
____________________________________________________________
2. Predation
The act of ________________________________________________
____________________________________________________________
3. Symbiotic Relationships
The close relationship _________________________________
____________________________________________________________
182
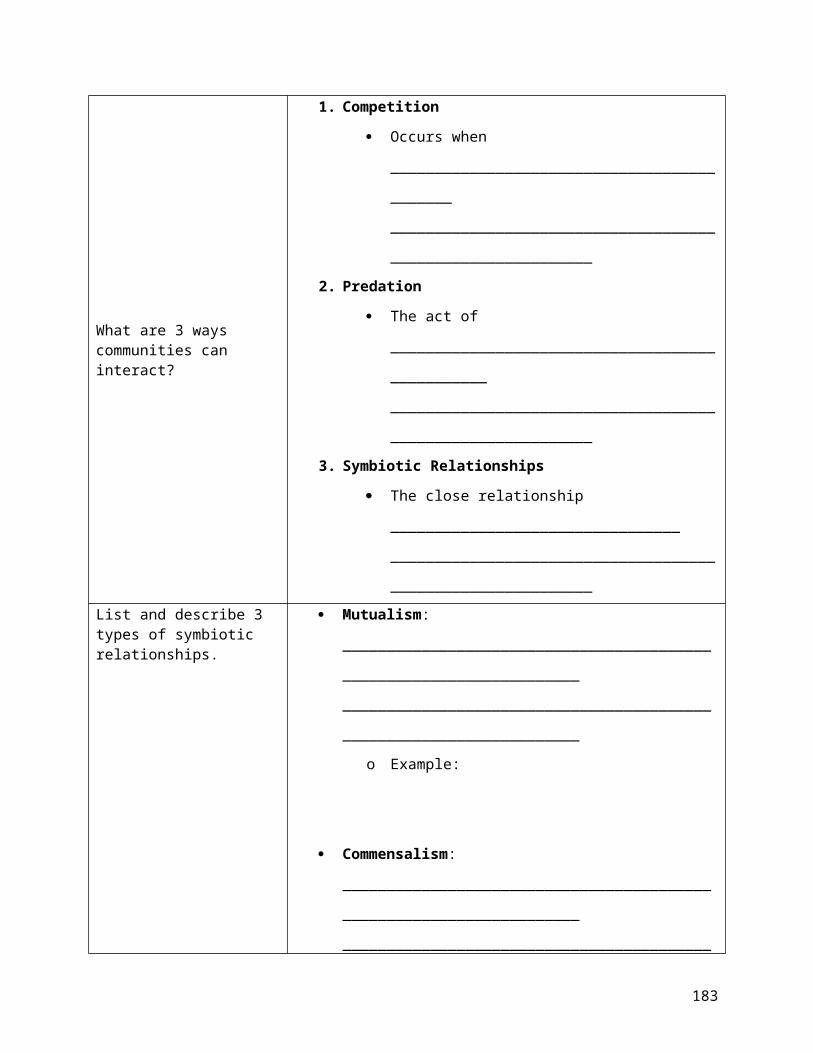
List and describe 3 types of symbiotic relationships.
Mutualism:
_____________________________________________________________________
_____________________________________________________________________
o Example:
Commensalism:
_____________________________________________________________________
_____________________________________________________________________
o Example:
Parasitism:
_____________________________________________________________________
_____________________________________________________________________
o Example:
183

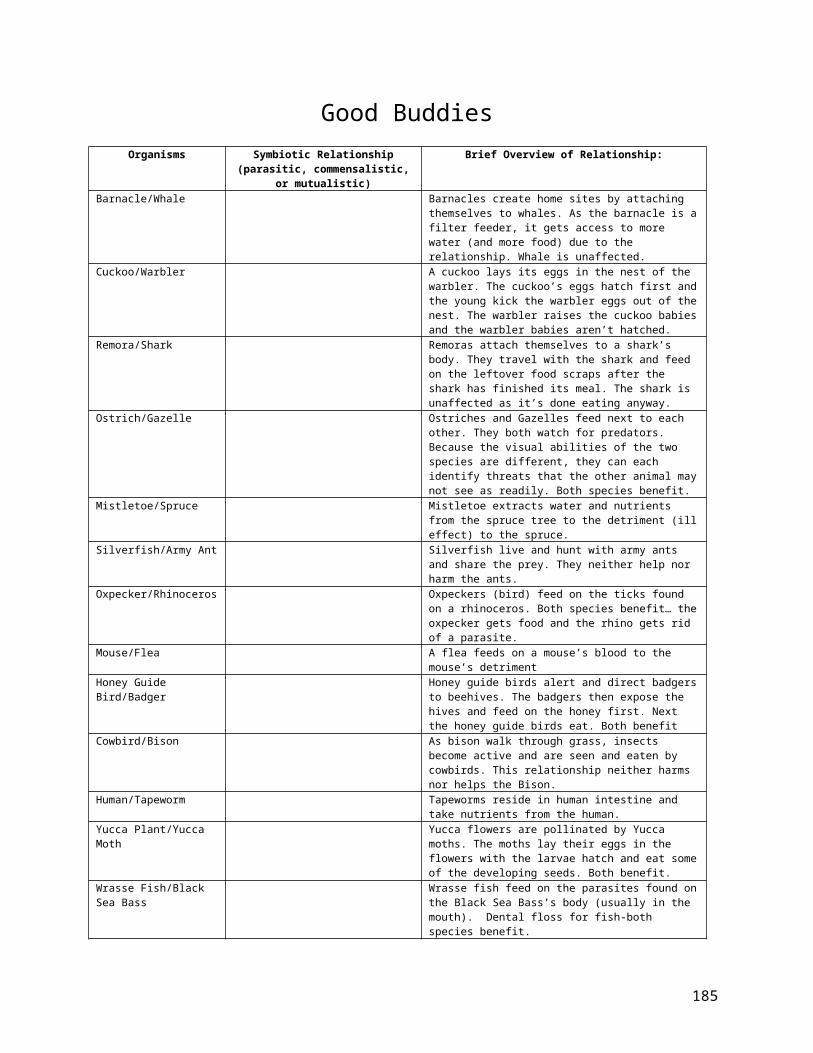
Good BuddiesOrganisms Symbiotic Relationship
(parasitic, commensalistic, or mutualistic)
Brief Overview of Relationship:
Barnacle/Whale Barnacles create home sites by attaching themselves to whales. As the barnacle is a filter feeder, it gets access to more water (and more food) due to the relationship. Whale is unaffected.
Cuckoo/Warbler A cuckoo lays its eggs in the nest of the warbler. The cuckoo’s eggs hatch first and the young kick the warbler eggs out of the nest. The warbler raises the cuckoo babies and the warbler babies aren’t hatched.
Remora/Shark Remoras attach themselves to a shark’s body. They travel with the shark and feed on the leftover food scraps after the shark has finished its meal. The shark is unaffected as it’s done eating anyway.
Ostrich/Gazelle Ostriches and Gazelles feed next to each other. They both watch for predators. Because the visual abilities of the two species are different, they can each identify threats that the other animal may not see as readily. Both species benefit.
Mistletoe/Spruce Mistletoe extracts water and nutrients from the spruce tree to the detriment (ill effect) to the spruce.
Silverfish/Army Ant Silverfish live and hunt with army ants and share the prey. They neither help nor harm the ants.
Oxpecker/Rhinoceros Oxpeckers (bird) feed on the ticks found on a rhinoceros. Both species benefit… the oxpecker gets food and the rhino gets rid of a parasite.
Mouse/Flea A flea feeds on a mouse’s blood to the mouse’s detriment
Honey Guide Bird/Badger
Honey guide birds alert and direct badgers to beehives. The badgers then expose the hives and feed on the honey first. Next the honey guide birds eat. Both benefit
Cowbird/Bison As bison walk through grass, insects become active and are seen and eaten by cowbirds. This relationship neither harms nor helps the Bison.
Human/Tapeworm Tapeworms reside in human intestine and take nutrients from the human.
Yucca Plant/Yucca Moth
Yucca flowers are pollinated by Yucca moths. The moths lay their eggs in the flowers with the larvae hatch and eat some of the developing seeds. Both benefit.
Wrasse Fish/Black Sea Bass
Wrasse fish feed on the parasites found on the Black Sea Bass’s body (usually in the mouth). Dental floss for fish-both species benefit.
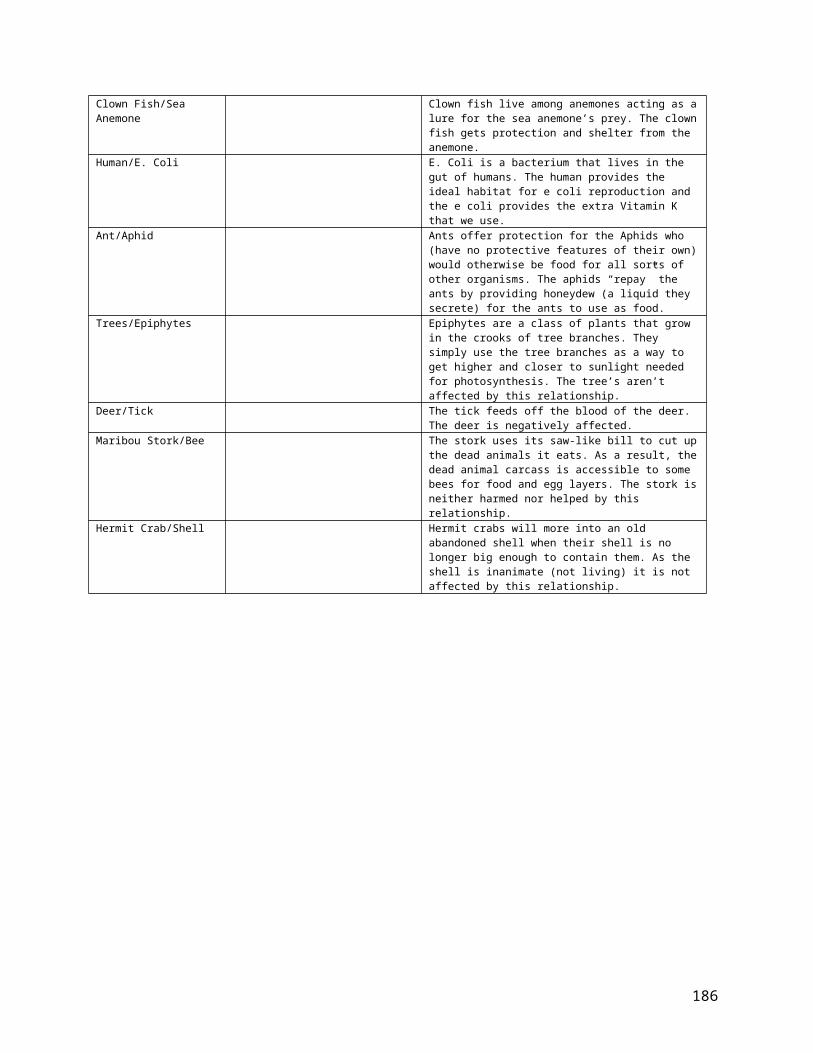
Clown Fish/Sea Anemone
Clown fish live among anemones acting as a lure for the sea anemone’s prey. The clown fish gets protection and shelter from the anemone.
Human/E. Coli E. Coli is a bacterium that lives in the gut of humans. The human provides the ideal habitat for e coli reproduction and the e coli provides the extra Vitamin K that we use.
Ant/Aphid Ants offer protection for the Aphids who (have no protective features of their own) would otherwise be food for all sorts of other organisms. The aphids “repay” the ants by providing honeydew (a liquid they secrete) for the ants to use as food.
Trees/Epiphytes Epiphytes are a class of plants that grow in the crooks of tree branches. They simply use the tree branches as a way to get higher and closer to sunlight needed for photosynthesis. The tree’s
184
aren’t affected by this relationship.Deer/Tick The tick feeds off the blood of the deer. The deer
is negatively affected.Maribou Stork/Bee The stork uses its saw-like bill to cut up the dead
animals it eats. As a result, the dead animal carcass is accessible to some bees for food and egg layers. The stork is neither harmed nor helped by this relationship.
Hermit Crab/Shell Hermit crabs will more into an old abandoned shell when their shell is no longer big enough to contain them. As the shell is inanimate (not living) it is not affected by this relationship.
185
Intentionally Left Blankfor additional notes, activities, brain-storming
186

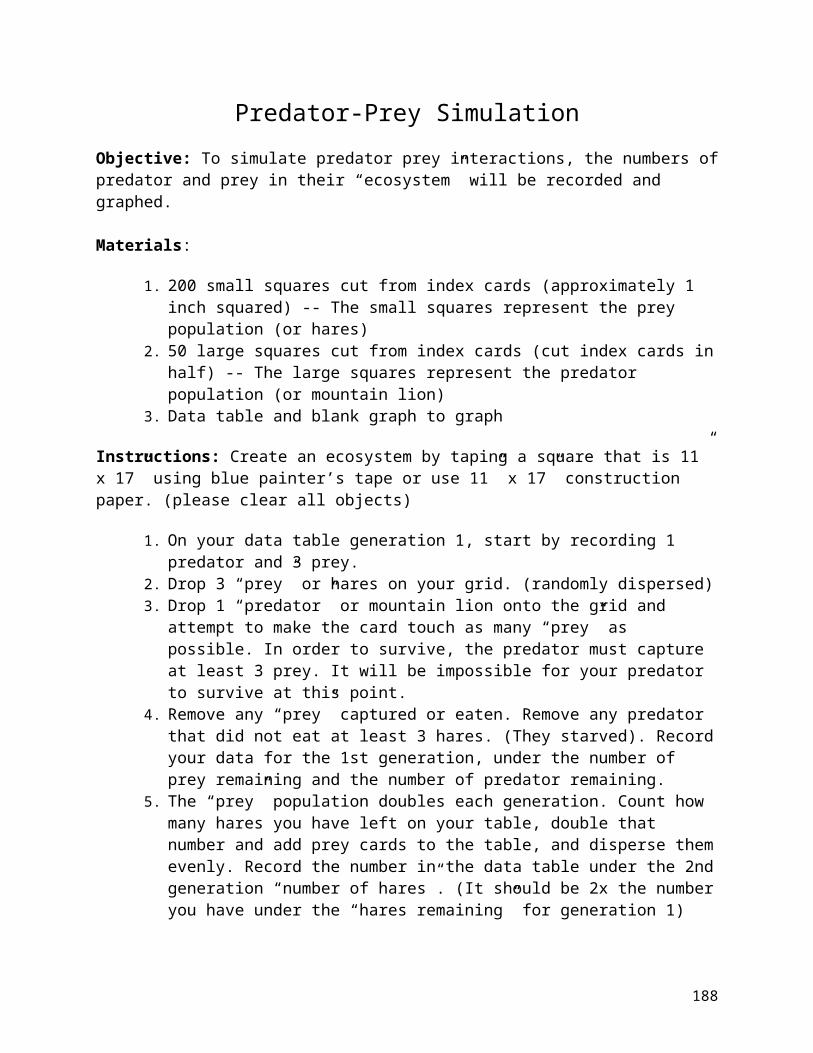
Predator-Prey SimulationObjective: To simulate predator prey interactions, the numbers of predator and prey in their “ecosystem” will be recorded and graphed.
Materials:
1. 200 small squares cut from index cards (approximately 1 inch squared) -- The small squares represent the prey population (or hares)
2. 50 large squares cut from index cards (cut index cards in half) -- The large squares represent the predator population (or mountain lion)
3. Data table and blank graph to graph
Instructions: Create an ecosystem by taping a square that is 11” x 17” using blue painter’s tape or use 11” x 17” construction paper. (please clear all objects)
1. On your data table generation 1, start by recording 1 predator and 3 prey.
2. Drop 3 “prey” or hares on your grid. (randomly dispersed)3. Drop 1 “predator” or mountain lion onto the grid and attempt to
make the card touch as many “prey” as possible. In order to survive, the predator must capture at least 3 prey. It will be impossible for your predator to survive at this point.
4. Remove any “prey” captured or eaten. Remove any predator that did not eat at least 3 hares. (They starved). Record your data for the 1st generation, under the number of prey remaining and the number of predator remaining.
5. The “prey” population doubles each generation. Count how many hares you have left on your table, double that number and add prey cards to the table, and disperse them evenly. Record the number in the data table under the 2nd generation “number of hares”. (It should be 2x the number you have under the “hares remaining” for generation 1)
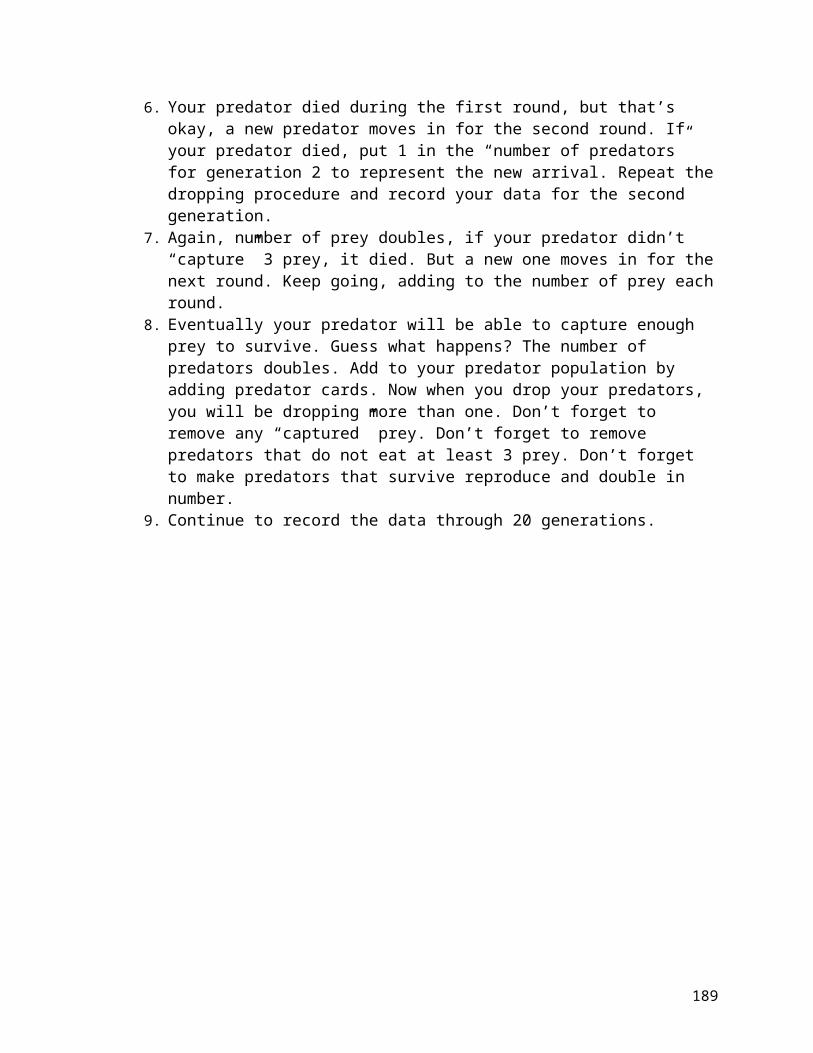
6. Your predator died during the first round, but that’s okay, a new predator moves in for the second round. If your predator died, put 1 in the “number of predators” for generation 2 to represent the new arrival. Repeat the dropping procedure and record your data for the second generation.
7. Again, number of prey doubles, if your predator didn’t “capture” 3 prey, it died. But a new one moves in for the next round. Keep going, adding to the number of prey each round.
187
8. Eventually your predator will be able to capture enough prey to survive. Guess what happens? The number of predators doubles. Add to your predator population by adding predator cards. Now when you drop your predators, you will be dropping more than one. Don’t forget to remove any “captured” prey. Don’t forget to remove predators that do not eat at least 3 prey. Don’t forget to make predators that survive reproduce and double in number.
9. Continue to record the data through 20 generations.
188
Predator-Prey Data Table
Generations Number of Mountain Lions (Predator)
Number of Hares (Prey)
Number of Mountain Lions (Predators) Remaining
Number of Hares (Prey) Remaining
1234567891011121314151617181920
189

Predator-Prey Graph: Construct a graph. On the X-axis, put generations 1 through 20, on the Y-axis you will have the population numbers for each generation (number of predators, number of prey). Use one line for the predator and one line for the prey to graph the data. Provide a legend!
Title: ________________________________________________________
Legend:
190

Analysis Questions
1. What is a carrying capacity?
2. Did the predator and prey reach carrying capacity in this simulation? If so, are the carrying capacities of the predator and the prey population the same?
Explain.
3. What affects the carrying capacity of prey populations?
4. What affects the carrying capacity of predator populations?
5. What type of graph did you create? Explain.
6. Which population always increased first? ________________Why?
191

7. Which population always decreased first? _________________ Why?
8. How long did a cycle of increase and decrease take for hares? ______
For mountain lions? _____
9. Which population was almost always in greater numbers?
10. Which population was almost always in smaller numbers?
11. What effects did the rabbit population have on the mountain lion population?
12. What effects did the mountain lion population have on the rabbit population?
13. Keep in mind that as in any simulation, certain assumptions are made and many variables are overlooked. What other limiting factors could subject a natural population to pressure and disturbance? Name and explain at least four factors. Within your explanation, classify each factor as density dependent or density independent.
192
Ecological Pyramids
While the producers set an ecosystem's total energy budget, energy is "spent" at each step of the food web. As each consumer feeds, some energy is transferred from the lower trophic level to the higher trophic level. But most of the available energy stored in the prey organism's biomass leaves the system. For example, when a caterpillar eats a leaf, about 50 percent of the energy stored in the leaf passes out of the caterpillar's body in its wastes (feces). The caterpillar uses 35 percent of the leaf's stored energy to support its life processes, such as moving and reproducing. The caterpillar transforms only about 15 percent of the leaf's stored energy into new caterpillar biomass.
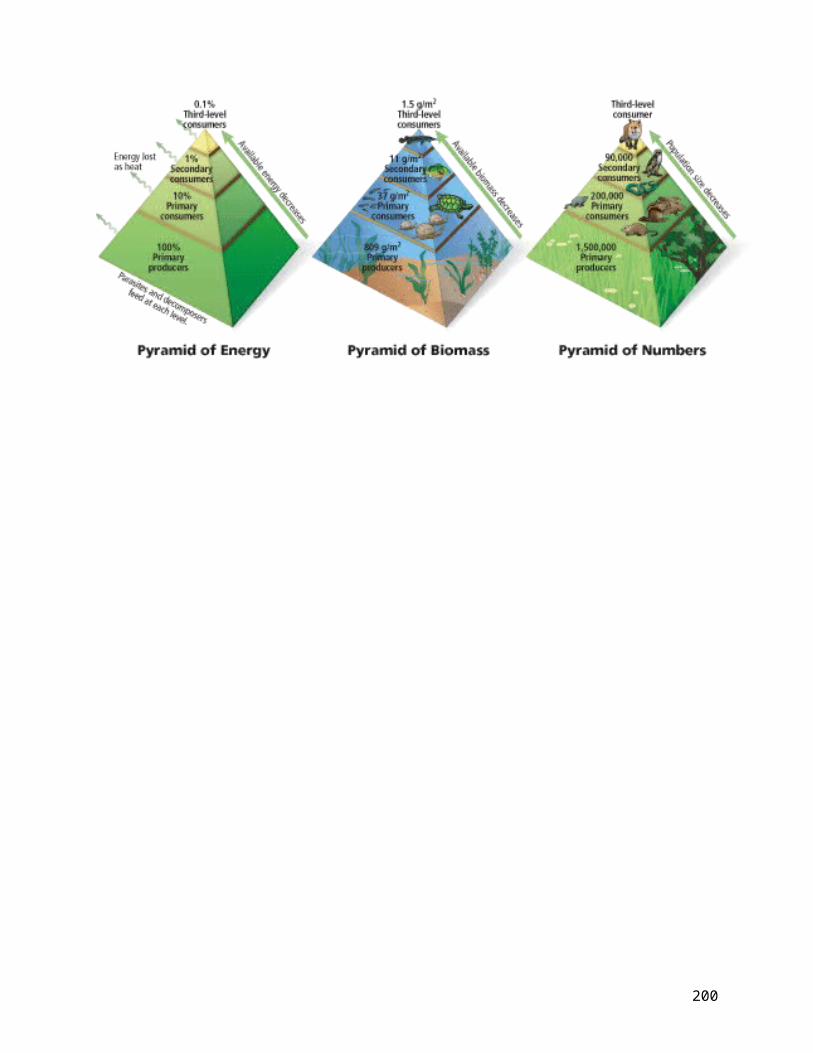
To depict information about energy, biomass, and numbers of organisms at different trophic levels, ecologists use three types of diagrams: energy pyramids, biomass pyramids, and pyramids of numbers. In each case, the foundation of the pyramid is the producer level. The primary consumers form the next block, and so on.
193
Energy Pyramids: An energy pyramid, sometimes called a food pyramid, emphasizes the energy loss from one trophic level to the next. In
general, an average of only 10 percent of the available energy at a trophic level is converted to biomass in the next higher trophic level. The rest of the energy—about 90 percent—is released from the ecosystem as heat.
Notice that the amount of energy available to the top-level consumer is tiny compared to that available to primary
consumers. For this reason, it takes a lot of vegetation to support higher trophic levels. This explains why most food chains are limited to three or four levels; there is simply not enough energy at the top of an energy pyramid to support another trophic level. For instance, lions and killer whales have no natural predators; the energy stored in populations of these top-level consumers is not enough to feed yet another trophic level.
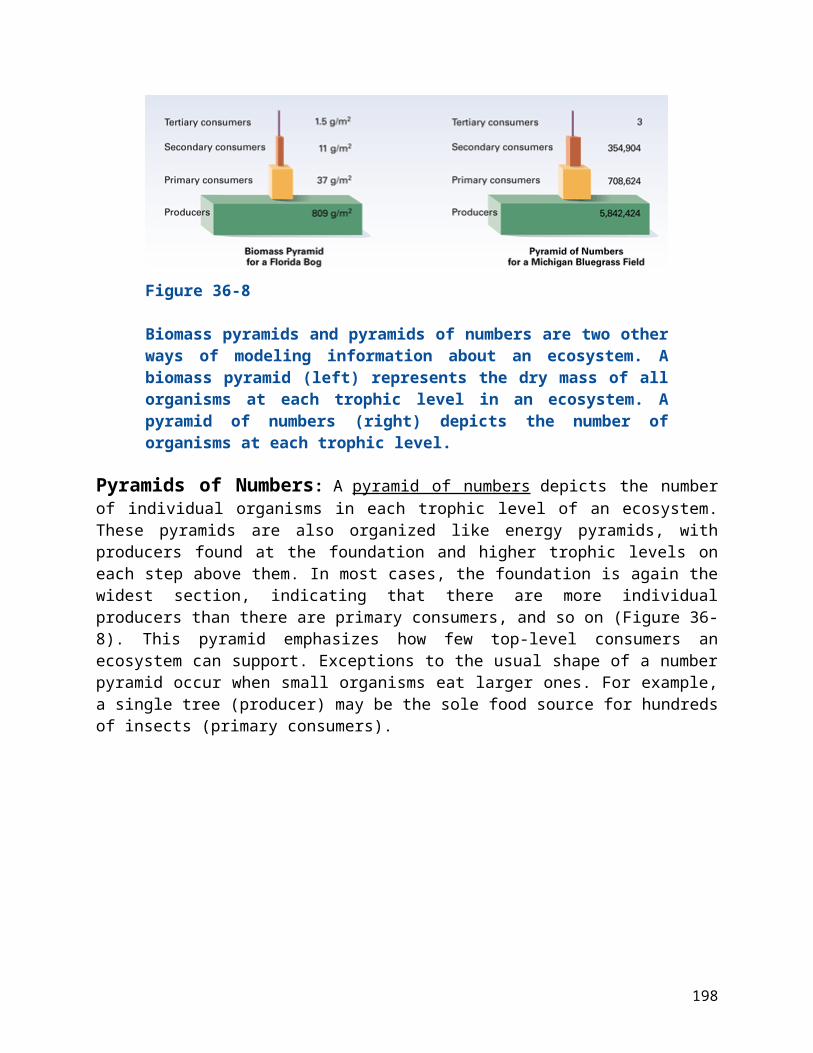
Biomass Pyramids: A biomass pyramid represents the actual biomass (dry mass of all organisms) in each trophic level in an ecosystem. Most biomass pyramids narrow sharply from the producer level at the base to the top-level consumers at the peak (Figure 36-8). There are some exceptions, however. In certain aquatic ecosystems, the zooplankton (primary consumers) consume the phytoplankton (producers) extremely rapidly. As a result, the zooplankton have a greater mass at any given time than the phytoplankton. The phytoplankton grow and reproduce at such a rapid rate that they can support a consumer population that has a greater biomass. A biomass pyramid for this ecosystem would appear top-heavy.
194

Figure 36-8
Biomass pyramids and pyramids of numbers are two other ways of modeling information about an ecosystem. A biomass pyramid (left) represents the dry mass of all organisms at each trophic level in an ecosystem. A pyramid of numbers (right) depicts the number of organisms at each trophic level.
Pyramids of Numbers: A pyramid of numbers depicts the number of individual organisms in each trophic level of an ecosystem. These pyramids are also organized like energy pyramids, with producers found at the foundation and higher trophic levels on each step above them. In most cases, the foundation is again the widest section, indicating that there are more individual producers than there are primary consumers, and so on (Figure 36-8). This pyramid emphasizes how few top-level consumers an ecosystem can support. Exceptions to the usual shape of a number pyramid occur when small organisms eat larger ones. For example, a single tree (producer) may be the sole food source for hundreds of insects (primary consumers).
195

Notes: Ecological Pyramids(read pages 42-44 in your textbook)
What is an ecological pyramid?
An ecological pyramid is _______________________________________________
______________________________________________________________________________
How is energy passed on in an ecological pyramid?
______________ of all energy is not transferred to the level above it.
This energy gets:
Consumed by _____________________________________________________
Or released _______________________________________________________
What is biomass?Biomass is ________________________________________________________________
______________________________________________________________________________
196
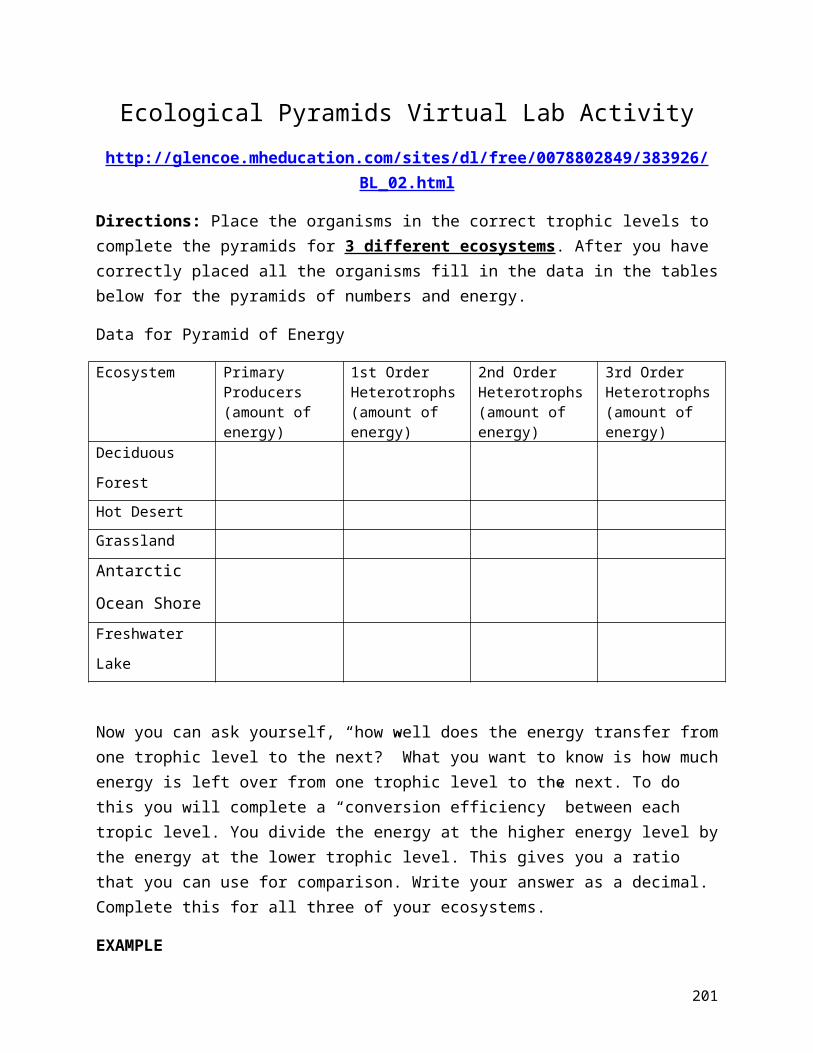
Ecological Pyramids Virtual Lab Activityhttp://glencoe.mheducation.com/sites/dl/free/0078802849/383926/
BL_02.html
Directions: Place the organisms in the correct trophic levels to complete the pyramids for 3 different ecosystems. After you have correctly placed all the organisms fill in the data in the tables below for the pyramids of numbers and energy.
Data for Pyramid of Energy
Ecosystem Primary Producers(amount of energy)
1st Order Heterotrophs(amount of energy)
2nd Order Heterotrophs(amount of energy)
3rd Order Heterotrophs(amount of energy)
Deciduous ForestHot DesertGrasslandAntarctic Ocean ShoreFreshwater Lake
Now you can ask yourself, “how well does the energy transfer from one trophic level to the next?” What you want to know is how much energy is left over from one trophic level to the next. To do this you will complete a “conversion efficiency” between each tropic level. You divide the energy at the higher energy level by the energy at the lower trophic level. This gives you a ratio that you can use for comparison. Write your answer as a decimal. Complete this for all three of your ecosystems.
EXAMPLE
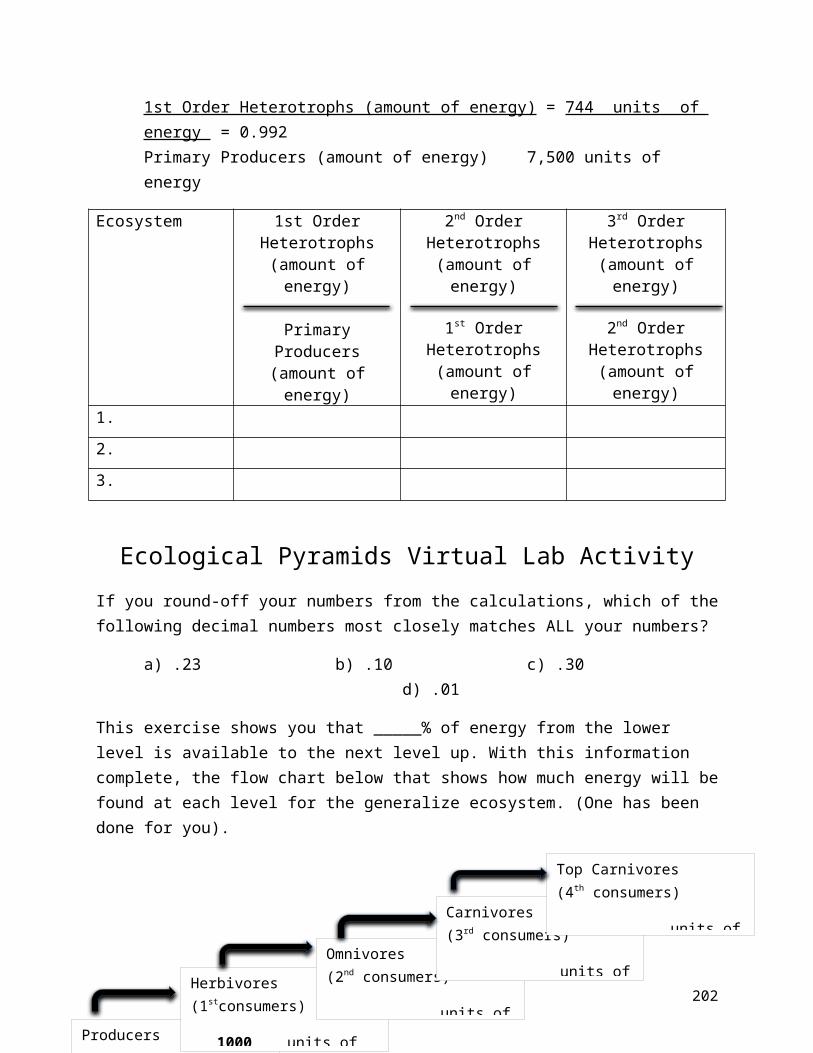
1st Order Heterotrophs (amount of energy) = 744 units of energy = 0.992Primary Producers (amount of energy) 7,500 units of energy
Ecosystem 1st Order 2nd Order 3rd Order
197
Heterotrophs(amount of
energy)
Primary Producers (amount of
energy)
Heterotrophs(amount of
energy)
1st Order Heterotrophs
(amount of energy)
Heterotrophs(amount of
energy)
2nd Order Heterotrophs
(amount of energy)
1.2.3.
Ecological Pyramids Virtual Lab ActivityIf you round-off your numbers from the calculations, which of the following decimal numbers most closely matches ALL your numbers?
a) .23 b) .10 c) .30 d) .01
This exercise shows you that _____% of energy from the lower level is available to the next level up. With this information complete, the flow chart below that shows how much energy will be found at each level for the generalize ecosystem. (One has been done for you).
Why does only 10% of the energy move onto the next trophic level?
Producers
____________ units of energy
Herbivores (1stconsumers)
1000 units of energy
Omnivores(2nd consumers)
____________ units of energy
Carnivores(3rd consumers)
____________ units of energy
Top Carnivores(4th consumers)
____________ units of energy
198
Is the rest of the energy truly “lost?” Use the law of conservation of matter and energy to defend your answer.
199
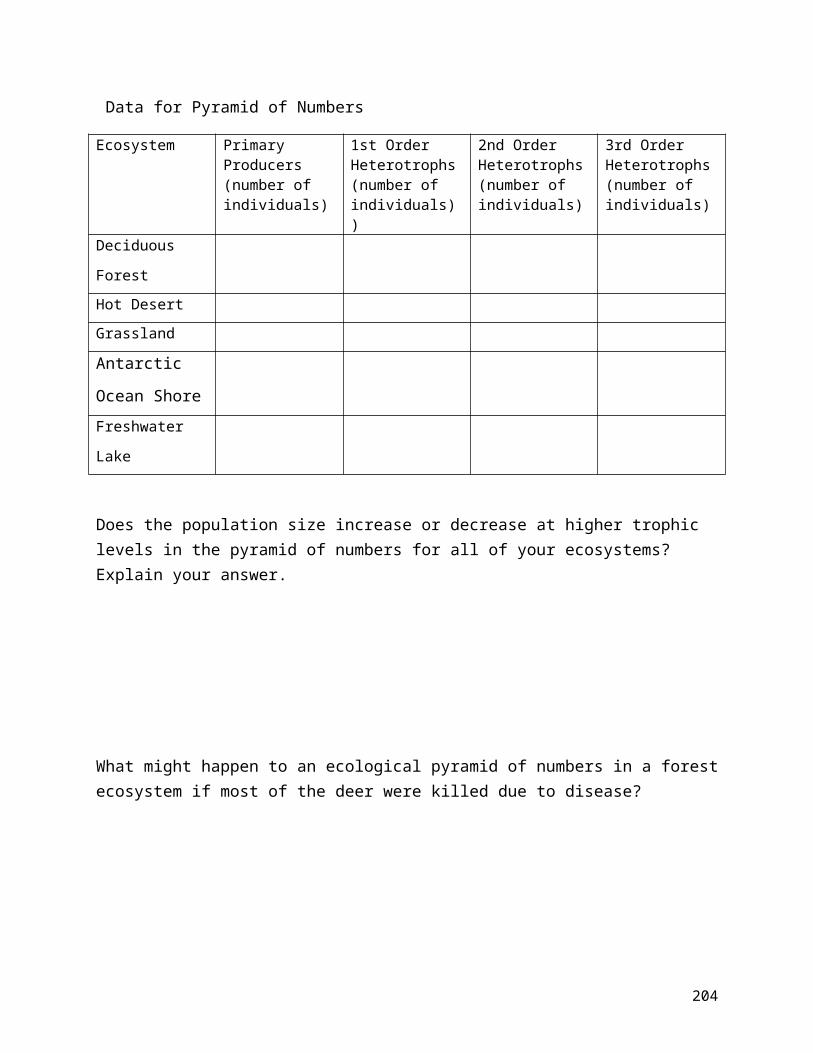
Data for Pyramid of Numbers
Ecosystem Primary Producers(number of individuals)
1st Order Heterotrophs(number of individuals))
2nd Order Heterotrophs(number of individuals)
3rd Order Heterotrophs(number of individuals)
Deciduous ForestHot DesertGrasslandAntarctic Ocean ShoreFreshwater Lake
Does the population size increase or decrease at higher trophic levels in the pyramid of numbers for all of your ecosystems? Explain your answer.
What might happen to an ecological pyramid of numbers in a forest ecosystem if most of the deer were killed due to disease?
What would happen to an ecosystem if the decomposers disappeared? Explain in terms of matter.
200
201
Using the pyramid of energy data table, chose one ecosystem and graph its pyramid of energy. Make sure the squares are to scale!
Title: ____________________________________________________________
Using the pyramid of numbers data table, chose the same ecosystem as the one above and graph its pyramid of numbers. Make sure the squares are to scale!
Title: ____________________________________________________________
Compare the pyramid of energy to the pyramid of numbers. What is the difference in purpose for the two pyramids?
202
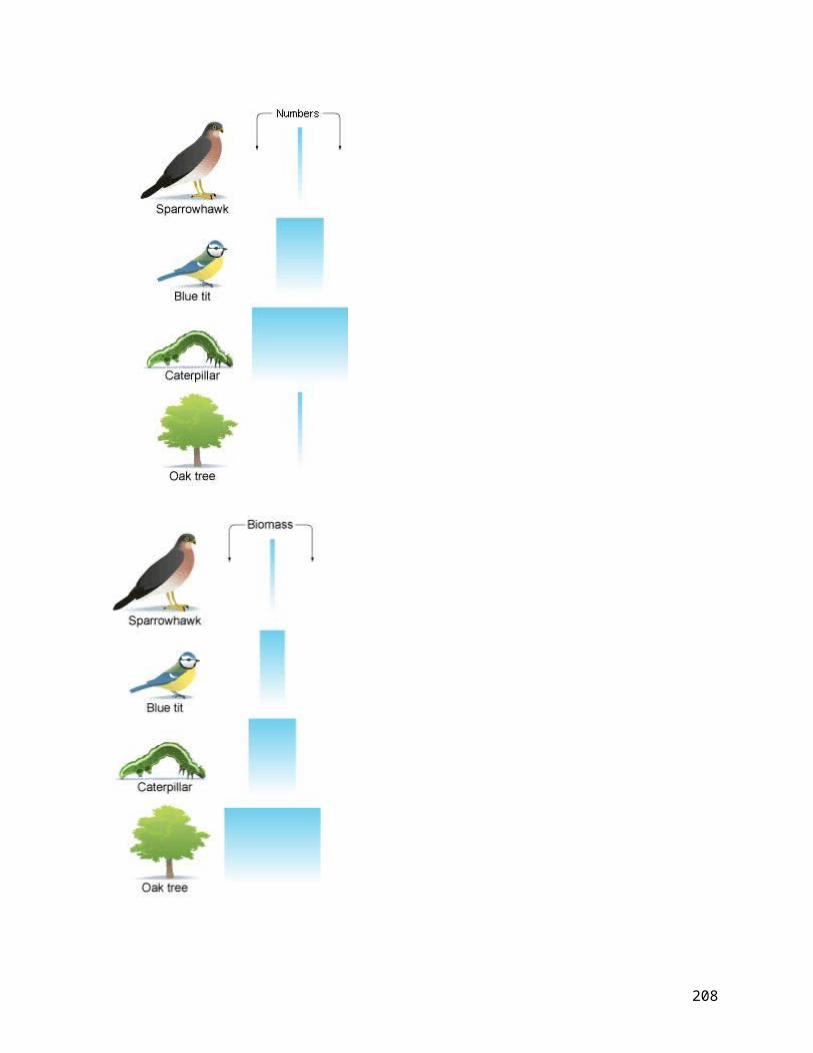
Pyramid of Biomass vs. Pyramid of Numbers
Study the pyramids above. The pyramids have different shapes, despite the fact that they represent the same food chain. Why do these pyramids differ? What does each pyramid represent?
203
204

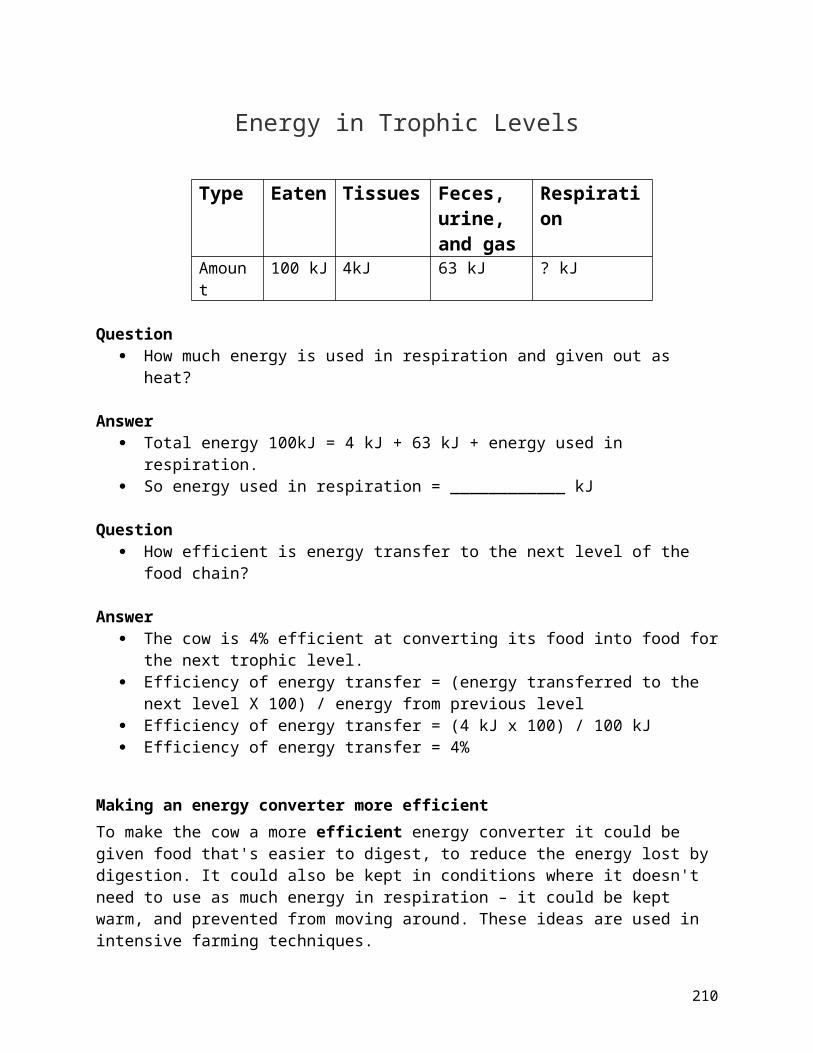
Energy in Trophic Levels
Type Eaten
Tissues Feces, urine, and gas
Respiration
Amount
100 kJ 4kJ 63 kJ ? kJ
Question How much energy is used in respiration and given out as heat?
Answer Total energy 100kJ = 4 kJ + 63 kJ + energy used in respiration. So energy used in respiration = ____________ kJ
Question How efficient is energy transfer to the next level of the food chain?
Answer The cow is 4% efficient at converting its food into food for the next
trophic level. Efficiency of energy transfer = (energy transferred to the next level X
100) / energy from previous level Efficiency of energy transfer = (4 kJ x 100) / 100 kJ Efficiency of energy transfer = 4%
Making an energy converter more efficientTo make the cow a more efficient energy converter it could be given food that's easier to digest, to reduce the energy lost by digestion. It could also be kept in conditions where it doesn't need to use as much energy in respiration – it could be kept warm, and prevented from moving around. These ideas are used in intensive farming techniques.Energy and trophic levelsEach trophic level reduces the amount of energy available to the next trophic level by about 90%. This means that the top trophic levels receive very little energy unless they live in very fertile habitats. For this reason there's a limit to the number of trophic levels in a food chain.Questions:
1. Is energy lost when the cow eats 100kJ of grass? Explain.
205

2. Explain why food chains usually only go as high as tertiary or quaternary consumers.
206
207
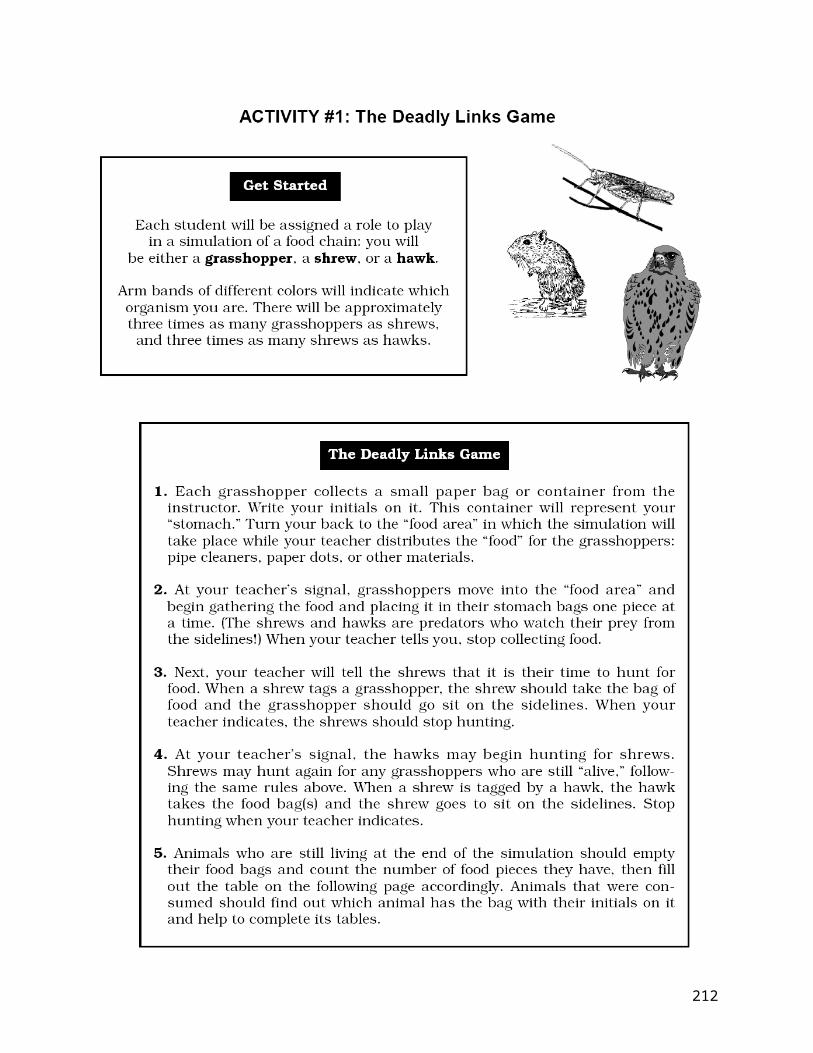
Deadly Links Game: What happened to your animal?
In the environment in which these animals live, a pesticide was sprayed onto the crops to prevent damage by the grasshoppers. The colored food pieces represent plants that contained the pesticide. Grasshoppers, shrews, and hawks should check their food pieces. What might have happened to the grasshoppers with colored food pieces?
1. What may have happened to grasshoppers that ate the colored food pieces?
2. Do shrews have more or less colored pieces than grasshoppers? What might happen to the shrews that ate grasshoppers with too many colored pieces?
3. Which organism had the highest number of colored food pieces? Why?
4. Based on this activity, try to come up with a working definition for “bioaccumulation.” What do you think this term means? Don’t worry. You will get the chance to revise your definition later. Use evidence from the activity to support your working definition.
208

209
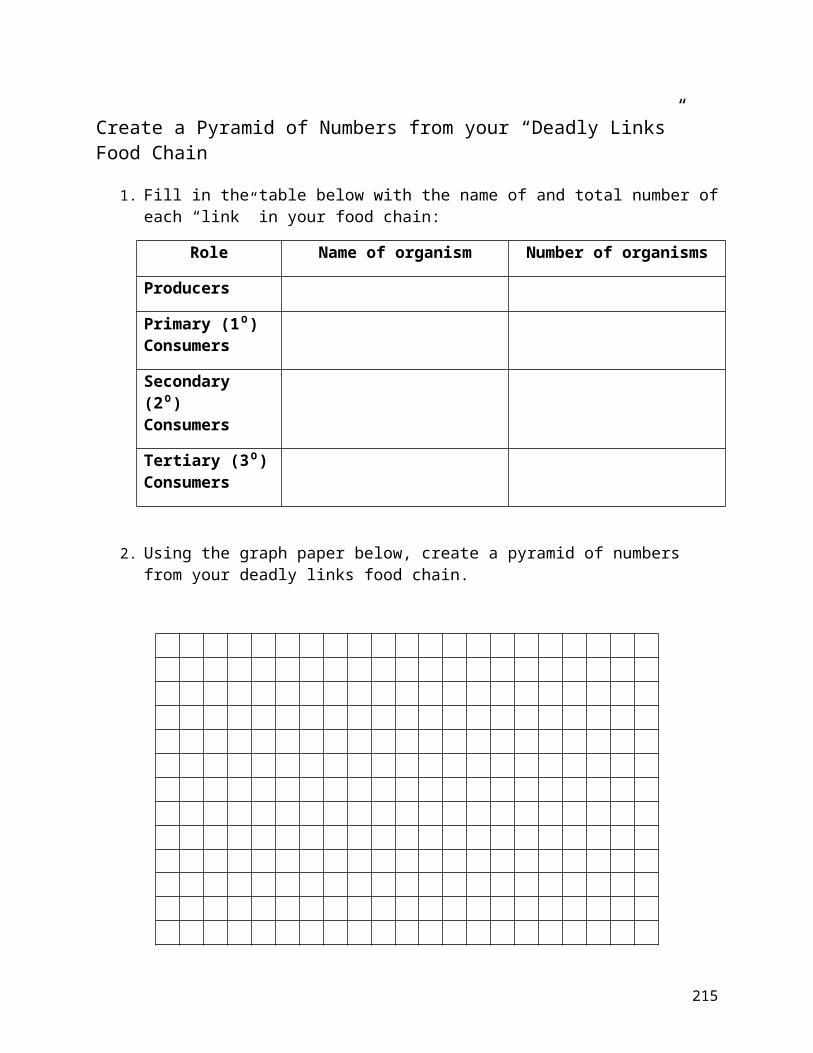
Create a Pyramid of Numbers from your “Deadly Links” Food Chain
1. Fill in the table below with the name of and total number of each “link” in your food chain:
Role Name of organism Number of organisms
Producers
Primary (1⁰) Consumers
Secondary (2⁰) Consumers
Tertiary (3⁰) Consumers
2. Using the graph paper below, create a pyramid of numbers from your deadly links food chain.
210
211
What is Bio-Accumulation?First, watch a quick video that your teacher will present to you on bio-accumulation.
Bioaccumulation is the increase in concentration of a substance in living organisms as they take in contaminated air, water, or food.
As bigger animals eat smaller animals, the level of contamination in the food is added to the level of contamination already in their body and often stored
in fat.
The circles you see in the graph to the left represent toxins moving up the pyramid. Assuming that a pesticide was added to the water that the algae grow in, defend which organism on this food chain would be the most affected. Use the space below for your response.
212
2
213

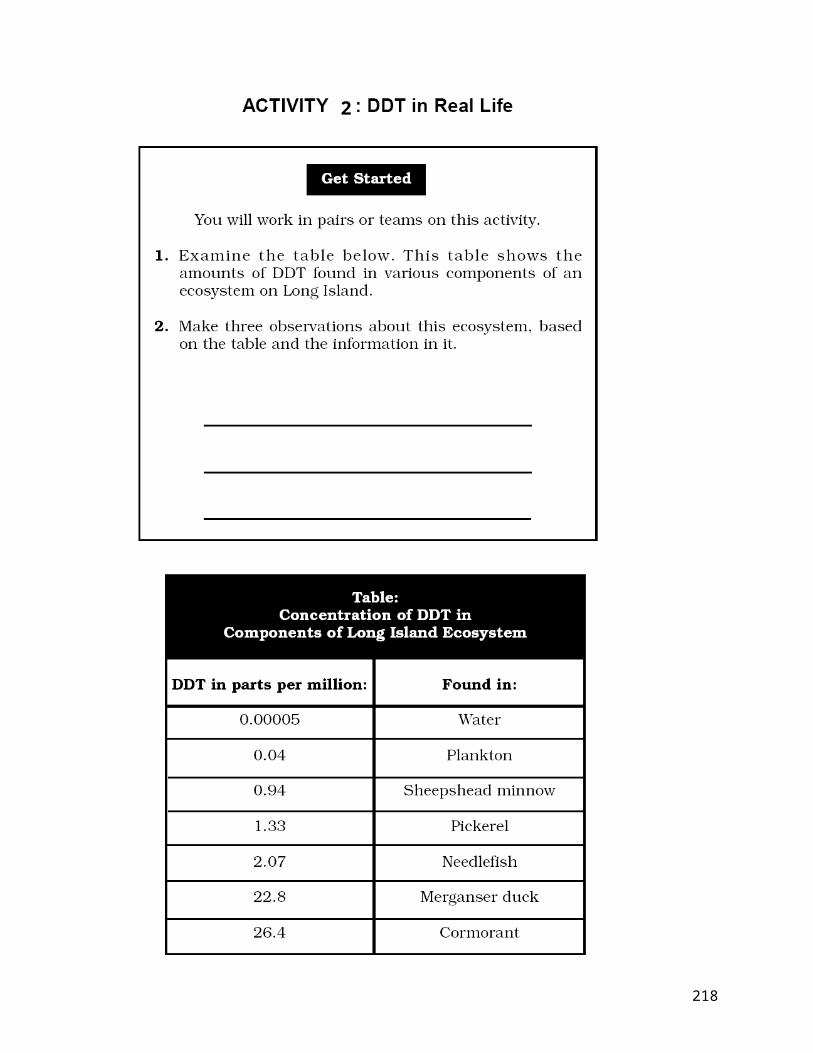
Graphing DDT in Long Island1. Graph the data points in the graph provided below:
2. Do the graph and data show biological magnification? Why or why not?
214
Notes: Biodiversity(read pages 116-131 in your textbook)
What is biodiversity?
Biodiversity is ___________________________________________________________
_____________________________________________________________________________.
It increases the ___________________________________________________
It contributes to __________________________________________________
What are extinction and genetic diversity?
Extinction is ______________________________________________________________
______________________________________________________________________________
Genetic diversity is
______________________________________________________
______________________________________________________________________________
Genetic diversity increase the chances ________________________
_____________________________________________________________________
_____________________________________________________________________
Read pages 118-120 and describe, in your own words, the importance of biodiversity.
What is the difference between mass extinction and background extinction?
Mass extinction:
________________________________________________
_____________________________________________________________________
Background extinction: _______________________________________
_____________________________________________________________________
215

What are 5 factors that threaten biodiversity?
1. Overexploitation - ______________________________________________
_____________________________________________________________________
2. Habitat loss (two types):
____________________________ of habitat
____________________________ of habitat
3. Fragmentation of Habitat - ___________________________________
_____________________________________________________________________
4. Pollution
Acid precipitation occurs when __________________ acid and
___________________ acid fall to Earth’s surface as rain, sleet,
snow, or fog.
Eutrophication occurs when ______________________________
________________________________________________________________
________________________________________________________________
5. Introduced Species - ___________________________________________
_____________________________________________________________________
What is biological magnification?
Biological magnification is ____________________________________________
216

Intentionally Left Blankfor additional notes and brainstorming
217
Types of Succession Venn Diagram
218
219
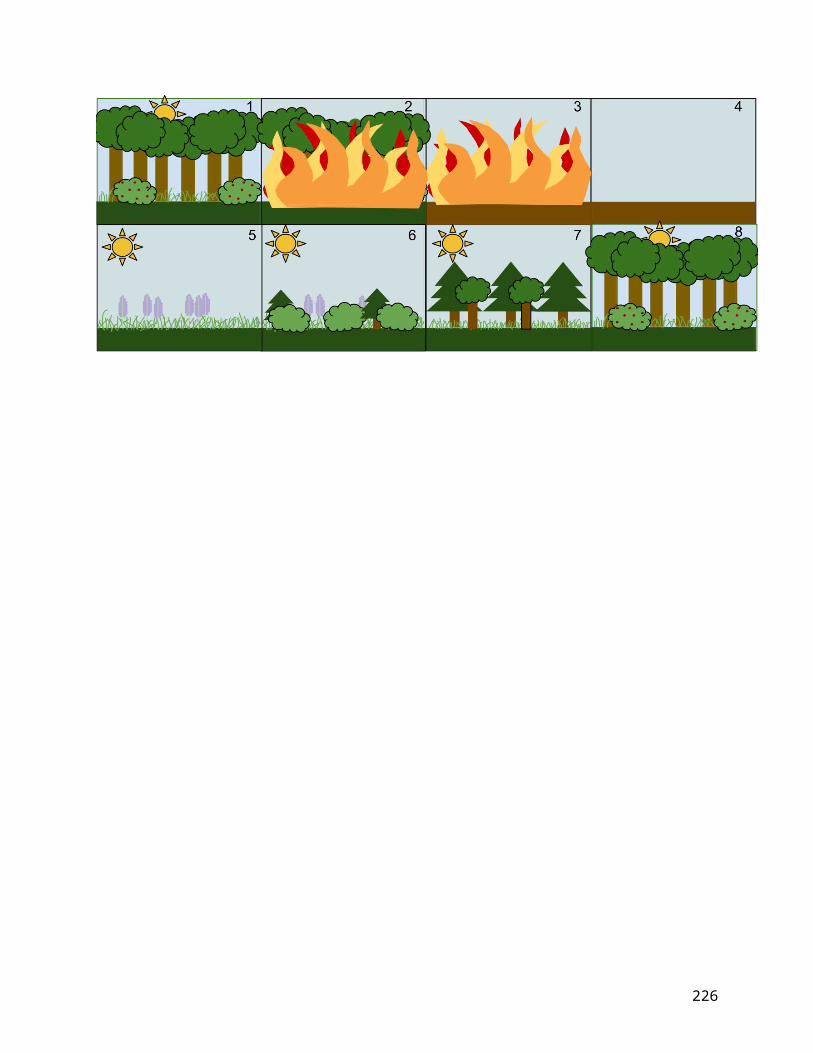
Notes: Ecological Succession(read pages 62-65 in your textbook)
What is ecological succession?
Ecological succession is _______________________________________________
_____________________________________________________________________________
_____________________________________________________________________________
What is primary succession?
Primary succession is __________________________________________________
______________________________________________________________________________
Soil is formed by __________________________ (fungus & algae).
These are called ________________________ species.
Eventually the area becomes a climax community - ________
_____________________________________________________________________
What is secondary succession?
Secondary succession is ________________________________________________
______________________________________________________________________________
______________________________________________________________________________
The images on the opposite page shows ecological succession. In a paragraph, describe what is happening in each image. What type of succession is this?
220

221

Opening Biodiversity Discussion: Imagine a food web where there are only 5 different types of animals in each trophic level. What do you think would happen to this ecosystem? Record your discussion ideas in the space below.
222

Why Conserve Biodiversity?When scientists speak of the variety of organisms (and their genes) in an ecosystem, they refer to it as biodiversity. A biologically diverse ecosystem, such as an old growth forest or tropical rain forest, is healthy, complex and stable. Nature tends to increase diversity through the process of succession.
The opposite of biodiversity is referred to as monoculture, or the growing of one species of organism, such as a lawn, a wheat field or corn-field. Monoculture often requires extensive use of pesticides and herbicides (to fight nature's tendency to diversify communities) and is very labor and energy intensive (fighting nature is tough). Humans often try to reduce diversity because it is easier to harvest a crop (whether it is wheat, corn, a lawn or a secondary forest) if it all contains the same species, but this creates serious problems.
When a habitat is very diverse with a variety of different species, it is much healthier and more stable. One of the reasons for this is that disease doesn't spread as easily in a diverse community.
In this simulation, you will discover why biodiversity is so important to the stability of an ecosystem.
Follow up questions:
1. What does biological diversity mean?
2. Why did the disease spread more in a monoculture compared to the bio-diverse culture?
223

3. In which forest would you need to use more chemicals to control disease? the Douglas fir forest or the more diversified, old growth forest? Why?
4. Which forest would have more diversity of wildlife? Why?
5. a. If you cut down the variety in a piece of forest you owned and replanted with one type of tree, what will happen to much of the wildlife that was adapted to that forest? (Hint: they cannot just move elsewhere. If other habitats are good, they will probably be near carrying capacity already.)
6. Many species can only live/reproduce in a specific habitat. The spotted owl is an example - it can only live and successfully reproduce in old growth forests (big, old cedars, hemlocks, etc.). If these old growth forests are cut down, it's unlikely this owl will survive. Environmentalists call it an "indicator" species." What does this mean? Why be concerned about 1 species?
7. Growing one plant, as is the case of growing only Douglas fir, is called monoculture. Give an example of growing one type of plant in your city.
224
8. Why would you need to use more insecticides in monoculture? Is this good or bad?
9. If you wanted to help wildlife, what would you with regards to the landscaping of your own home?
Invasive Species and BiodiversityBrainstorm: What is the difference between an invasive species and a native species? In what way do you think invasive species impacts biodiversity of an ecosystem?
225
226
Directions: Read the Time magazine article. Number your paragraphs, and mark the text. Circle important terms and highlight how invasive species affect of biodiversity. You will watch a short video after the reading.
Forget the Asian Carp. Here’s a New Great Lakes Invasive Species to Worry About
The flying Asian carp have been making their way into the Great Lakes. But now a new fish, the Eurasian ruffe, is threatening to invade the region.
Conservationists and wildlife officials have been policing the porous border between the Mississippi watershed and the Great Lakes for years. Their main concern: preventing Asian carp, an invasive species that has established itself in the Mississippi River system, from invading the Great Lakes, where the voracious eaters could cause havoc with natives. (Not to mention knocking a few recreational boaters out cold. Some Asian carp have a habit of launching themselves like missiles out of the water when they hear the roar of an approaching motorboat, as learned in this TIME video from 2010.)
Officials haven’t had a whole lot of luck with their containment effort, despite spending tens of millions of dollars on the battle. A study in October found for the first time that a subspecies of Asian carp, grass carp, had successfully reproduced within the Great Lakes watershed, in a tributary of a river that feeds into Lake Erie.
Now it turns out that there may be reason to worry about another invasive species—going in the other direction. Scientists with the Nature Conservancy, the University of Notre Dame and Central Michigan University have for the first time discovered DNA from the Eurasian ruffe in two water samples taken in July from Lake Michigan’s Calumet Harbor in Chicago. While a Eurasian ruffe might sound like some kind of Siberian motorcycle gang, it’s actually an invasive species of small perch native to central and western Europe that established itself in Lake Superior in the mid-1980s after hitching a ride in a European freighter’s ballast water tanks. Since then it’s
227

been slowly spreading around the southern shore of Lake Superior, before invading northern Lakes Michigan and Huron.
If Eurasian ruffes do establish themselves in the Mississippi watershed, the consequences would not be good. The ruffes have been identified by the U.S. Army Corps of Engineers as one of the 29 species that have the potential to transfer between the Great Lakes and the Mississippi River basin. Ruffes are comfortable in large rivers, and the Mississippi and its tributaries have twice the number of native fish as the Great Lakes basin does. That’s a lot of local fish that could be displaced if the ruffes move in.
“The Eurasian ruffe is a relatively small fish that produces a lot of eggs and reaches maturity very quickly,” says Lindsay Chadderton, the Aquatic Invasive Species Director for The Nature Conservancy’s Great Lakes Project. “They feed from the bottom of the food chain, and they’re going to compete with native and introduced species dependent on the same fauna.”
Still, Illinois officials note that no live ruffe have yet been captured in Calumet Harbor, and it’s possible the water containing the genetic material could have come from a bait bucket or ballast tanks, not from an actual fish. But even the possibility that ruffe could be poised to continue their invasion underscores how vulnerable the Great Lakes and the Mississippi basin are to invasive species and the need for some kind of two-way species barrier in the artificial canal in Chicago that connects the two systems. Invasive species might be inevitable - nature has a way of going where we don’t want it to go, but we don’t have to make it easy for them.
Reflect: After reading and watching the video, were your initial ideas about how invasive species impacts the ecosystem correct or incorrect? Explain and summarize what you learned about invasive species in the space below.
228

229
Conserving BiodiversityRead pages 131-135 in your textbook about protecting and restoring ecosystems. For each of the human-caused disasters below, brainstorm a solution. Be creative but try to keep your solutions realistic. Consider current technologies, financial cost, and preventative measures for the future.
Disaster Aspects/perspectives to consider Possible solutions
Oil spill
Industrial pollution
Acid rain
Modern agriculture
Groundwater exploitation
Urbanization
230
Thinking about Biodiversity – what would happen if…1. What would happen if all of the jackrabbits in a food web died
suddenly?
2. Is the disappearance of one species from Earth important, or will another species fill its niche?
231
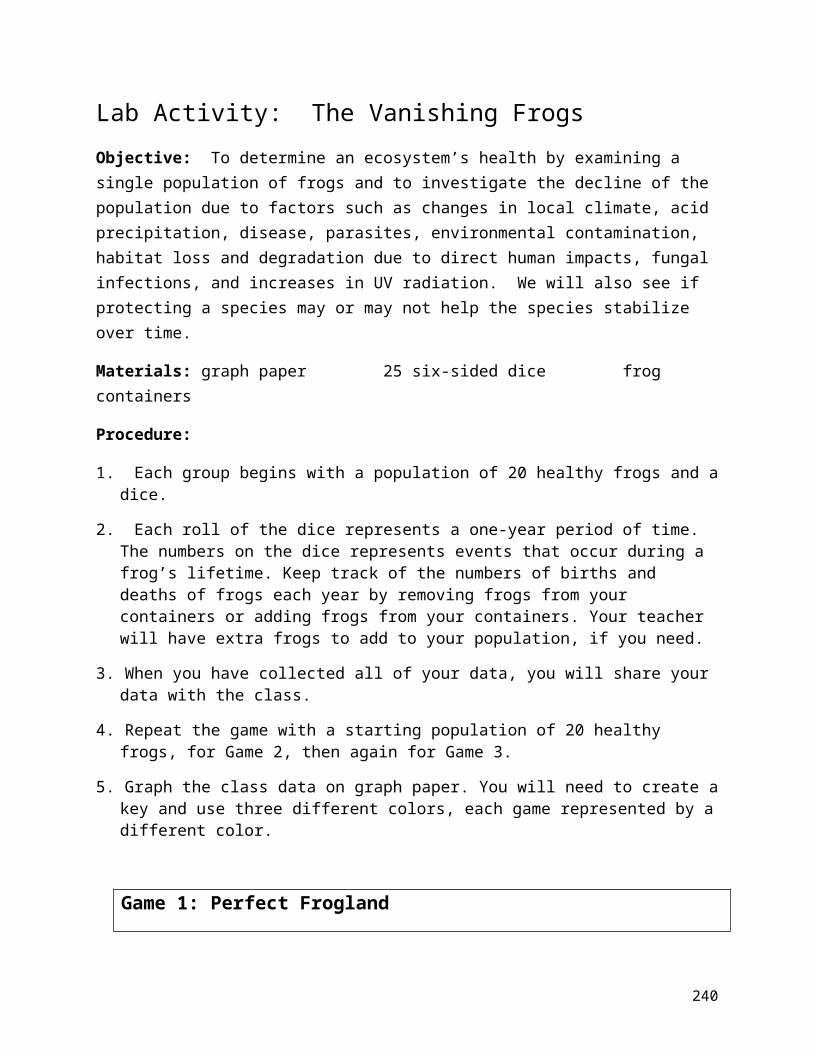
Lab Activity: The Vanishing FrogsObjective: To determine an ecosystem’s health by examining a single population of frogs and to investigate the decline of the population due to factors such as changes in local climate, acid precipitation, disease, parasites, environmental contamination, habitat loss and degradation due to direct human impacts, fungal infections, and increases in UV radiation. We will also see if protecting a species may or may not help the species stabilize over time.
Materials: graph paper 25 six-sided dice frog containers
Procedure:
1. Each group begins with a population of 20 healthy frogs and a dice.
2. Each roll of the dice represents a one-year period of time. The numbers on the dice represents events that occur during a frog’s lifetime. Keep track of the numbers of births and deaths of frogs each year by removing frogs from your containers or adding frogs from your containers. Your teacher will have extra frogs to add to your population, if you need.
3. When you have collected all of your data, you will share your data with the class.
4. Repeat the game with a starting population of 20 healthy frogs, for Game 2, then again for Game 3.
5. Graph the class data on graph paper. You will need to create a key and use three different colors, each game represented by a different color.
Game 1: Perfect Frogland
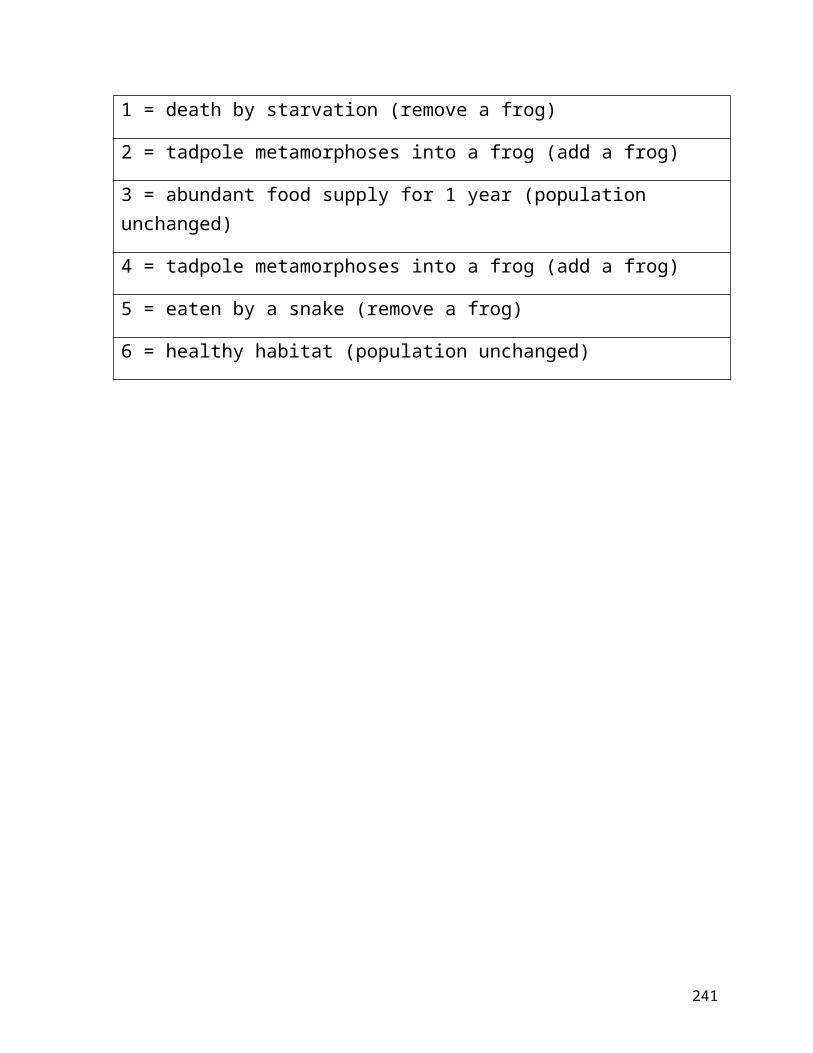
1 = death by starvation (remove a frog)
2 = tadpole metamorphoses into a frog (add a frog)
3 = abundant food supply for 1 year (population unchanged)
4 = tadpole metamorphoses into a frog (add a frog)
5 = eaten by a snake (remove a frog)
232

6 = healthy habitat (population unchanged)
233
Game 2: Humans vs. Nature
1 = death by pollution-induced starvation (remove a frog)
2 = tadpole metamorphoses into a frog (add a frog)
3 = habitat destroyed by filling in wetlands to build houses (remove a frog)
4 = habitat destroyed by building dams or canals for irrigation purposes (remove a frog)
5 = eaten by introduced species of snake or fish (remove a frog)
6 = destroyed by building new roads (remove a frog)
Game 3: Government vs. Nature: Now that the frog populations are declining, can the Endangered Species Act save them?
1 = death by pollution-induced starvation (remove a frog)
2 = tadpole metamorphoses into a frog (add a frog)
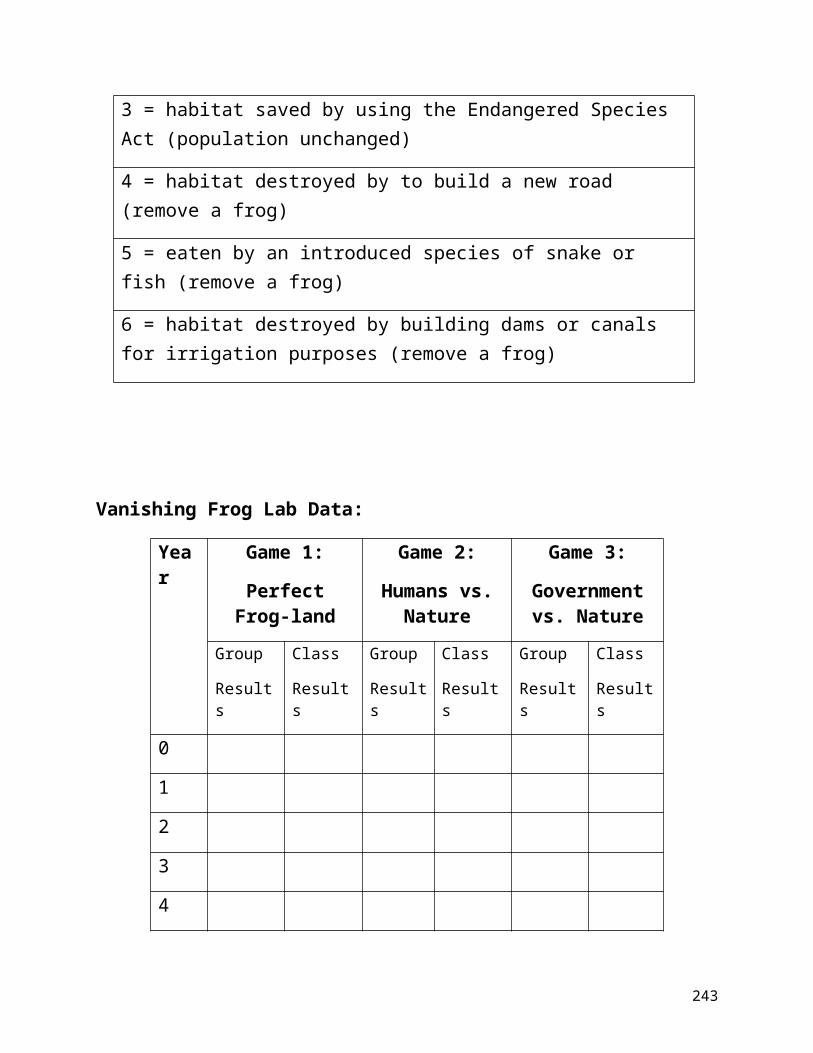
3 = habitat saved by using the Endangered Species Act (population unchanged)
4 = habitat destroyed by to build a new road (remove a frog)
5 = eaten by an introduced species of snake or fish (remove a frog)
234
6 = habitat destroyed by building dams or canals for irrigation purposes (remove a frog)
Vanishing Frog Lab Data:
Year
Game 1:Perfect Frog-
land
Game 2:Humans vs.
Nature
Game 3:Government vs. Nature
Group
Results
Class
Results
Group
Results
Class
Results
Group
Results
Class
Results
0
1
2
3
4
5
6
7
8
9
10
11
235
236
Vanishing Frog Lab Graph:
Graph the data collected during the lab below.
Title: ____________________________________________________
237

Analysis:
1. Explain the results from your games. What happened to the frog population in each game? Explain why the number of frogs changed with each game.
2. Based upon your graph, rank the three “Frog Lands,” from best to worst.
3. What will happen to the ecosystem if all of the frogs vanish?
4. If a frog population does not decline after habitat destruction, what might be the reason?
5. What does UV radiation have to do with frog decline
238
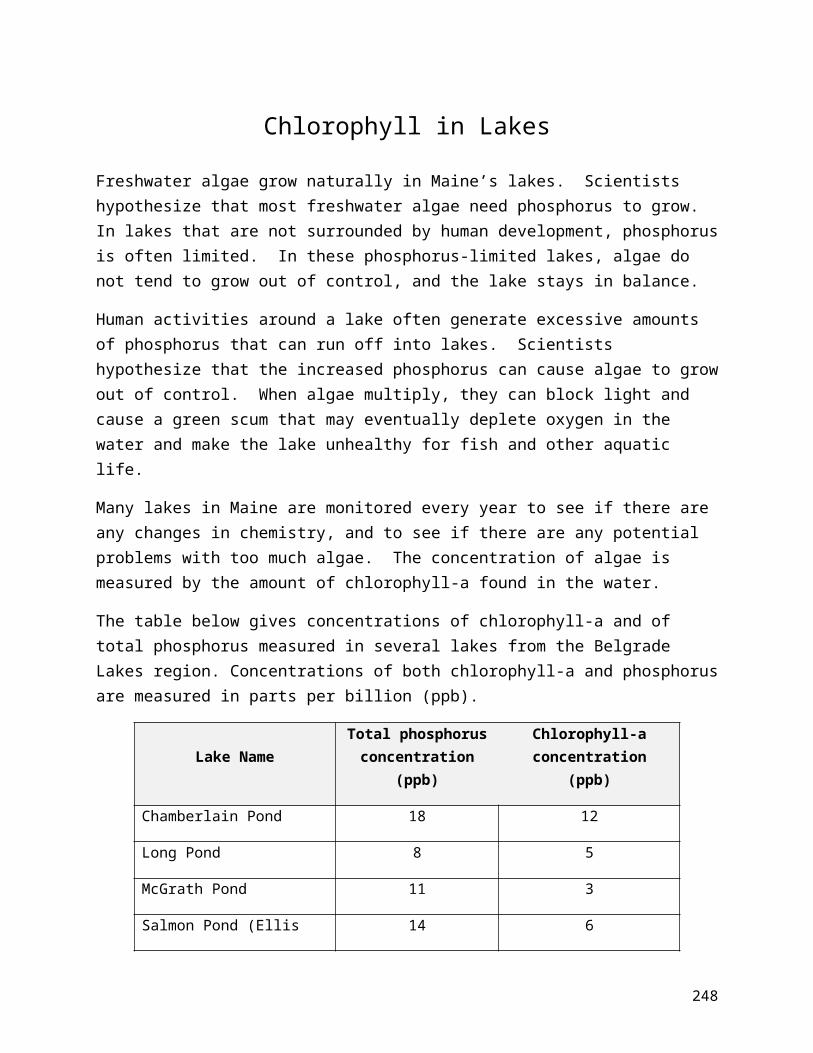
Chlorophyll in LakesFreshwater algae grow naturally in Maine’s lakes. Scientists hypothesize that most freshwater algae need phosphorus to grow. In lakes that are not surrounded by human development, phosphorus is often limited. In these phosphorus-limited lakes, algae do not tend to grow out of control, and the lake stays in balance.
Human activities around a lake often generate excessive amounts of phosphorus that can run off into lakes. Scientists hypothesize that the increased phosphorus can cause algae to grow out of control. When algae multiply, they can block light and cause a green scum that may eventually deplete oxygen in the water and make the lake unhealthy for fish and other aquatic life.
Many lakes in Maine are monitored every year to see if there are any changes in chemistry, and to see if there are any potential problems with too much algae. The concentration of algae is measured by the amount of chlorophyll-a found in the water.
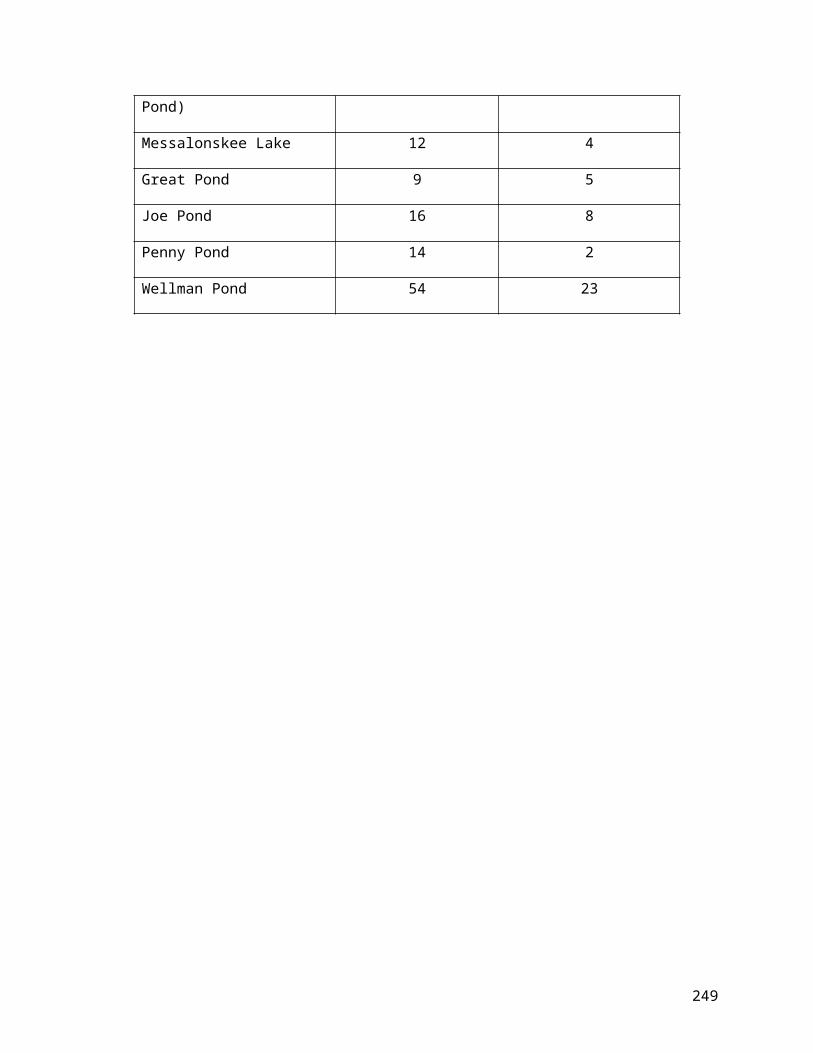
The table below gives concentrations of chlorophyll-a and of total phosphorus measured in several lakes from the Belgrade Lakes region. Concentrations of both chlorophyll-a and phosphorus are measured in parts per billion (ppb).
Lake Name Total phosphorus concentration (ppb)
Chlorophyll-a concentration (ppb)
Chamberlain Pond 18 12
Long Pond 8 5
McGrath Pond 11 3
Salmon Pond (Ellis Pond) 14 6
Messalonskee Lake 12 4
Great Pond 9 5
Joe Pond 16 8
Penny Pond 14 2
239
Wellman Pond 54 23
240
1. Make a graph that shows whether or not there is a relationship between phosphorus concentration and algae growth.
Title: _________________________________________________________
241

Analysis: 1. Explain how the graph supports or refutes the hypothesis that algae need phosphorus to grow. Use data to support your claim!
2. What type of human activities increase excessive run-off of phosphorus?
3. In what way would an algae bloom decrease aquatic biodiversity? (hint: you will need to research eutrophication)
242
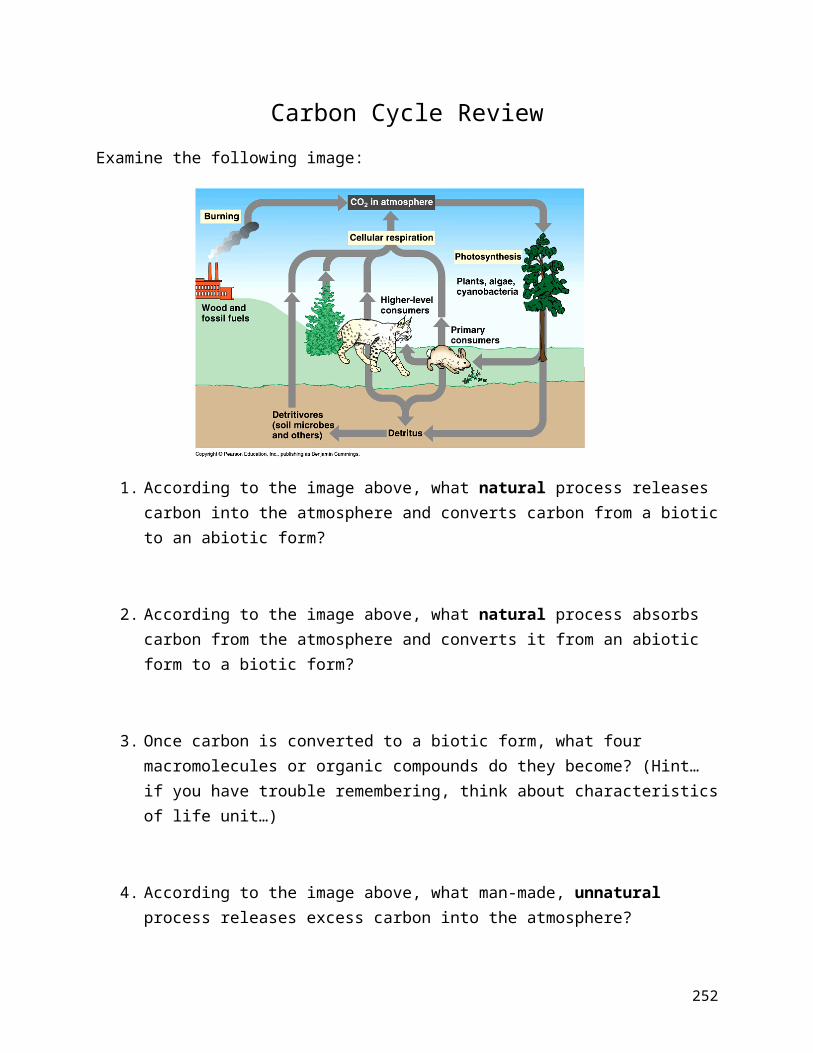
Carbon Cycle ReviewExamine the following image:
1. According to the image above, what natural process releases carbon into the atmosphere and converts carbon from a biotic to an abiotic form?
2. According to the image above, what natural process absorbs carbon from the atmosphere and converts it from an abiotic form to a biotic form?
3. Once carbon is converted to a biotic form, what four macromolecules or organic compounds do they become? (Hint… if you have trouble remembering, think about characteristics of life unit…)
4. According to the image above, what man-made, unnatural process releases excess carbon into the atmosphere?
243

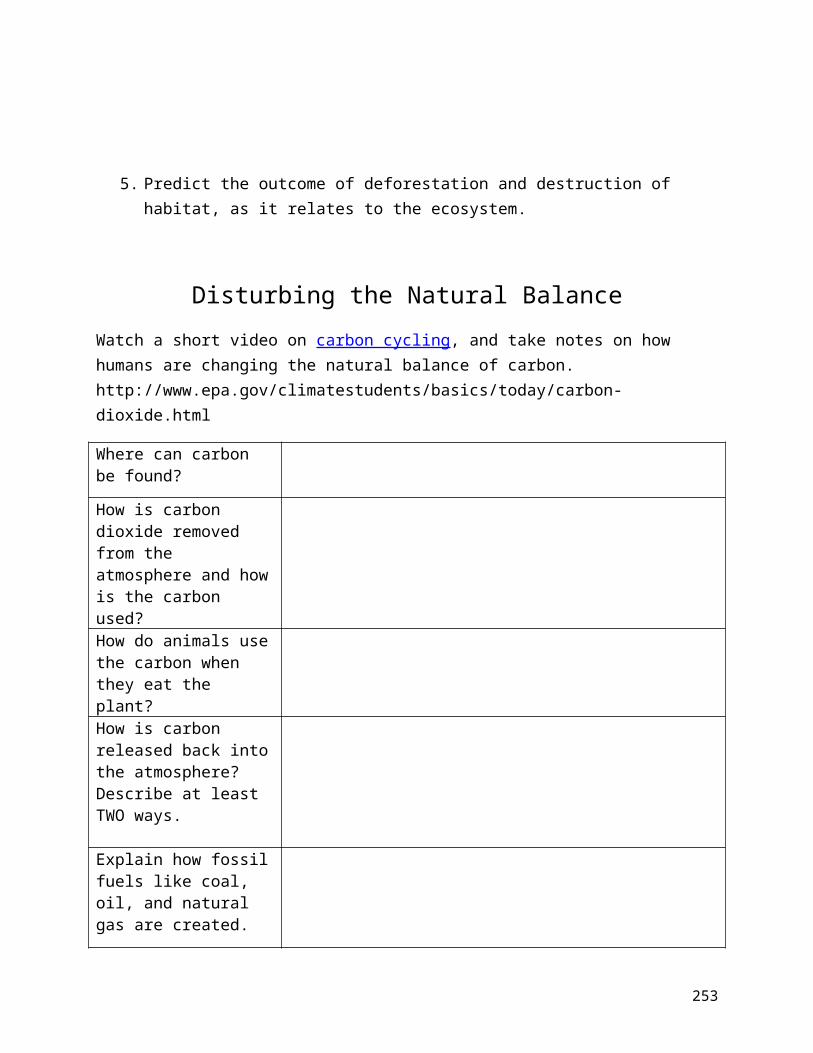
5. Predict the outcome of deforestation and destruction of habitat, as it relates to the ecosystem.
Disturbing the Natural BalanceWatch a short video on carbon cycling, and take notes on how humans are changing the natural balance of carbon. http://www.epa.gov/climatestudents/basics/today/carbon-dioxide.html
Where can carbon be found?
How is carbon dioxide removed from the atmosphere and how is the carbon used?How do animals use the carbon when they eat the plant?
How is carbon released back into the atmosphere? Describe at least TWO ways.
Explain how fossil fuels like coal, oil, and natural gas are created.
How are humans loading the atmosphere with carbon dioxide and changing the natural balance of carbon?What happens when humans cut down forests?
Why is carbon dioxide
244
called a greenhouse gas?
245
America’s Dependence on Energy: Estimating Your Ecological Footprint
It took approximately 3 million years for the world's population to reach 1 billion in about 1800. The number rose to 2 billion by about 1930, 3 billion by 1960, 4 billion by 1975, 5 billion by 1987 and 6 billion by 1999. In other words, most of the world population size we have today was added in this century. Human numbers are growing at an unprecedented pace, and we are testing the limits of our planet as never before.
Advances in science and technology were major factors leading to this rapid population growth. Medical advances and disease prevention through improved sanitation, inoculation and pest control have brought down child mortality rates and led to longer life spans. Advances in agriculture and transportation have led to increased food production and improved nutrition.
These improvements in people's quality of life are remarkable and laudable achievements, yet they have also created a new and major social problem: population growth so rapid that it throws off the delicate balance of nature. Air and water pollution, deforestation, thinning of the ozone layer, global warming, threats to biodiversity, soil erosion and depletion of many other natural resources are among the serious impacts of continuing growth in human numbers.
Because most of the population increase today is occurring in developing countries (over 95%), many Americans feel that they neither contribute to nor are they affected by the problem. U.S. growth, however, places disproportionate demands on the world's resources. During the next decade India and China will each add to the planet about ten times as many people as the United States will -- but the 57.5 million new Americans will contribute more greenhouse gases to the atmosphere than the roughly 900 million Indians and Chinese combined.
Why do you imagine we are supposed to stay on the walking trails when we hike through the woods of a state park? It is for the same reason your mother might yell at you for walking through her flowers in the yard. Footprints can be very destructive to delicate environments like nature preserves and tulip beds. It might be okay for one person or even a few people to walk off the trail sometimes, but what if everyone did it? Soon all of the next generation of little trees emerging would be tromped down with no hope of survival. As the old trees wither and fall, it could mean the end of the landscape as we know it. The forests would give way to invading species of small shrubs and grasses that can withstand the constant beating down of many large footprints. Nature can survive our footprints, but we might not like the way that it has to evolve. So, we post signs and make trails to ensure that we will not cause too much of an impact on the environment.
A carbon footprint is a way to roughly measure the impact a person’s daily and long term choices on the environment. It is measured by the greenhouse gas emissions that result from the choices you make and
246

activities that you participate in. People have become so accustomed to their diet, cars, homes, and energy use that they don’t realize that the Earth will not be able to provide the needed resources indefinitely. For instance, when you choose to drive to school instead of walking or riding the bus you are choosing to emit more greenhouse gases and increasing your footprint on the climate. There are many activities in your life that produce greenhouse gases, but none that you have such a direct impact on as your energy use choices. Being aware of your footprint will bring to attention what you can do about protecting your environment.
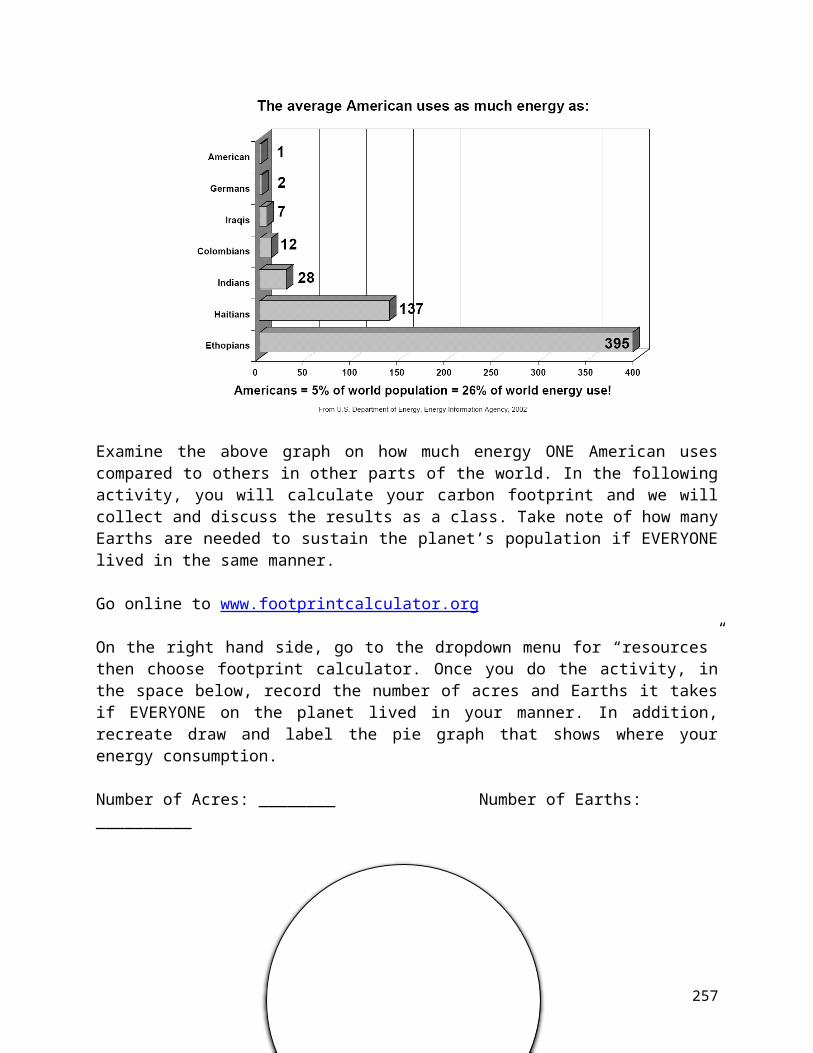
Examine the above graph on how much energy ONE American uses compared to others in other parts of the world. In the following activity, you will calculate your carbon footprint and we will collect and discuss the results as a class. Take note of how many Earths are needed to sustain the planet’s population if EVERYONE lived in the same manner.
Go online to www.footprintcalculator.org
On the right hand side, go to the dropdown menu for “resources” then choose footprint calculator. Once you do the activity, in the space below, record the number of acres and Earths it takes if EVERYONE on the planet lived in your manner. In addition, recreate draw and label the pie graph that shows where your energy consumption.
Number of Acres: ________ Number of Earths: __________
247
248
Class Data:
Student Number of Acres/Earths
Student Number of Acres/Earths
249

Discussion:
1. What is the average number of acres for the students in the class? What is the average number of earths needed?
2. What statistic would you use if you wanted to point out the lack of awareness of the environment? Which statistic would you use if you did now want to alarm the public?
3. What was the biggest source of emissions that contributed to the high number of acres/Earths? (personal data)
4. What was the class’s biggest source of emissions that contributed to the high number of acres/Earths? (Your teacher may need to take a survey).
5. Of the students that used the least amount of energy, what were the reasons? (Your teacher may need to take a survey).
250
Reforestation: Impact on Climate1. What do you already know about climate change? And in what ways do you think deforestation drives climate change?
2. Watch the following short video on climate change by Bill Nye. https://www.youtube.com/watch?v=tugoFbmOoZMAs you watch the video, jot down notes on what you didn’t already know.
3. In addition, watch another short video on reforestation and the impact on climate. http://vimeo.com/77792711As you watch the video, jot down the benefits of reforestation.
251
Socratic Seminar on the Pros and Cons of Deforestation
You will be participating in a Socratic seminar. In this seminar, you will be grouped by roles and will discuss through sharing different perspectives on the pros and cons of deforestation. The roles are:
Conservationists: Forests are home to many species of plants and animals.
Logger: My job is to cut down trees and without this job I cannot provide for my family.
Pharmacist: Many medicines come from our forests and many are yet to be discovered.
Farmer: I clear away land by burning a few acres of trees to grow crops for my family to eat.
Environmentalist: Forests help moderate climate change by taking in carbon dioxide during the day. Too much carbon dioxide leads to an increase in greenhouse gases, which causes changes in our climate.
Restaurant owner: I need paper and meat products to meet my customers’ demands.
To prepare for the seminar, you will research more information about your role in small groups. Organize your research using the Placemat Strategy. On one placemat, write down supporting evidence for your position for or against deforestation. On the other write down ways in which the actions associated with your role impact the carbon cycle.
252
What evidence do you have in support of your
argument for or against deforestation?
253

How does evidencefor your role impact
thecarbon cycle?
254
Offsetting the Global Carbon EmissionsYou will now find a tree outside. Select a tree that is at least 5 feet tall of known species. Measure the circumference at breast height in cm. Breast height is the circumference of the tree at 4.5 feet from the base.
Use the equation below to measure the biomass of the tree. Information about the species coefficient can be found at: http://www.yale.edu/fes519b/saltonstall/biomass2.html#estimate
Calculate the biomass of your tree in kg ______________Formula: M=aDb
M= biomassa= species coefficient D= diameter at breast heightb= species coefficient b
After calculating the biomass, determine the amount of carbon stored in their tree.
Is the species hardwood or softwood? ______________________Calculate the amount of carbon in your tree in kg: __________________
Hardwood trees: Multiply biomass (M) by 0.521 Softwood trees: Multiply biomass (M) by 0.498
Covert kg to tons to make it easier to compare your measurement and the carbon counter’s measurement of greenhouse gases in the air: ______________ (1 metric ton = 1000 kg)
255
Compare your figure to how much carbon dioxide is expected to be emitted by 2025.
Reflect:How many trees would you need to plant to offset carbon emissions in North America in 2025? in Emerging Asia?
Is this number of trees/amount of land needed to plant the trees practical? Why or why not?
256
Create a proposal/or a practical solution to this global problem… Consider everything that you learned from this unit, especially the data! Think about what we discussed in the Socratic seminar, and all of the topics you learned in recent activities on climate change, carbon foot-printing, and so forth.
257

Community & Ecosystems Unit Concept Map
258
Parent/ Significant Adult Review Page
Student PortionUnit Summary (write a summary of the past unit using 5-7 sentences. Use your concept map to guide your writing. Be sure to include all important topics from the unit):
Explain your favorite topic/activity this unit:
Adult PortionDear Parent/ Significant Adult:This Interactive Notebook represents your student’s learning to date and should contain the work your student has completed. Please take some time to look at the unit your student just completed, read his/ her reflection and respond to the following
Ask your child to explain biomagnification to you. Record your discussion below:
Look through your student’s notebook. Which assignment do you think your student excelled at?
Parent/ Significant Adult Signature:
259

Comments? Questions? Concerns? Feel free to email your child’s teacher.
260