nov 2002 1 practical methods for measuring human …steve/resources/uipm.pdf · practical methods...
TRANSCRIPT

Nov 2002 1
Practical Methods forMeasuring Human-Computer Interaction
by S.W.DraperThese notes were originally created with a lot of help from Keith Oatley, as part of a project creating teaching materials for HCI with Keith
and me together with Phil Gray and Alistair Kilgour.
IntroductionOpinions and ideas in HCI often begin with personal experience: of frustration or enjoyment at an interface, orof seeing something happen to someone else. To take the next step beyond this requires gathering moreobservations in order to give one's opinions and ideas a wider and more solid basis. For instance, you mightask several people to try the same task on a given machine and time how long they took, or count the errorsthey made. Or you might ask several users the same set of questions, and compare the answers you got. Thisis simple empirical measurement of the performance of human interaction with that machine or program, and itis our subject here.
To see what is involved in general, it is helpful to think of an analogy with an electronics technician's workshop(which we discuss further below). Various instruments are widely used (e.g. voltmeters, oscilloscopes), thoughthe way they are used and what they measure depends on the particular task being addressed: the same methodsare used for a range of objectives. We shall discuss these ranges of measures, instruments, and objectives, andhow they relate to each other.
What follows is really only an introduction to all that might be said on the subject of measuring human-computer interaction. It is worth studying however, because even doing small amounts of actual practicalmeasurements can both greatly benefit the project you are working on, and also give you a feel for what suchmethods might be good for. This is useful if you wish to contract others to do more of such work for a teamyou are part of.
We are here concerned with empirical measurements — not analytic methods for predicting the performance ofa design, such as GOMS or TAG. Although analytic methods hold out the promise of being faster, cheaper,and do not need the design to be already implemented, there is no sign yet of their being able to predictperformance in a practically useful way — HCI theory is still far short of being predictive. In any case,developing and checking such methods requires empirical measurements.
In HCI the iterative prototyping cycle is fundamental. One step in that cycle is that of observing the interactionbetween users and some version of the design. The methods described here can be used for that, and this isone important reason to study them. However they may also be used for other things: for instance forcomparing two commercial products. Such activities are often called "evaluation", but the methods describedhere are best described as practical methods for human-computer interaction measurement: firstly because theycan be used for other things than value judgements (e.g. detecting bugs), and secondly because other non-empirical methods (e.g. analytic methods) are often described as evaluation but are not dealt with here. Thesemeasurements are, strictly speaking, measurements of the performance of the combined system comprising ahuman user and a machine (usually a computer program): of system performance. One could use suchmeasurements to report on how well different users perform compared to each other. However here we discussmeasurement only from a user-centered viewpoint which takes the attitude that all problems are problems in thedesign of the machine, and in particular of its user interface.
The term "evaluation" has been widely used, but implies too narrow a view. "Evaluation" refers to a goal;measurement is more basic — part of the means to a number of alternative goals. Such measurement is askilled activity in its own right, that can usefully be considered as a separate subject. Putting this another way,we can say that evaluation properly has two parts. One is measurement. The other is assessing measurementsin relation to goals.
We shall begin by developing these introductory remarks into a conceptual framework for thinking aboutmeasurement in terms of five stages, each with properties that affect how you would make the choices involvedin carrying out a measurement study. We shall then deal with each of the five levels in turn. We give a briefdiscussion of measures, then describe seven basic instruments — this is much the largest portion. Next, wedeal with testing episodes, then the calculation of results, and finally we will discuss the reports that an evaluatormight make.

Nov 2002 2
Measurement FrameworkIn general, we think of interface performance measurement as involving the following issues. First there is theissue of what measures are taken, e.g. time to learn, user attitudes, errors made in doing a particular operation.Secondly there is a choice of instrument for making the measurements. In fact instruments are often best usedin combination to form a testing episode: different combinations are used in different cases. Then theresults are summarised or calculated, perhaps using statistics. Finally the conclusions are reported.
These choices can be summarised as:
Measures —> Instruments —> Testing episode —> Results —> Report
Besides issues of what to report and how to present it, often an investigator knows a lot about what is wanted— the real purpose of the study — and uses this to make the choices about measures and instruments. Finally,there is the issue of theories of HCI. A general theory would predict what factors or features of the systemand the testing situation determine the measurements observed. Theories thus tell you what measures might beworthwhile. Measurements are more general than theories — that is why they can be used to test theories.Nevertheless you can't measure everything all the time, so theories are influential in deciding what measures toattend to, and what features of an interface to change in order to try to improve the values observed. Here,however, we aim only to present seven instruments and how to use them — but not to present any theoriesabout what values to expect to observe in particular cases.
The techniques of measurement we recommend are like a set of instruments on an electronics work bench:meters for measuring voltages and currents, oscilloscopes for inspecting signals, devices for testing pieces ofhardware. They are indeed psychological instruments, and they measure aspects of the goals, plans, actions,and knowledge of a user interacting with an interface and the information flowing from it. In any design orevaluation process these need to be used in particular ways at particular points. Often several instruments willbe used together in a single testing episode: for instance you might set up an experiment but give the subjects aquestionnaire before, and interview them immediately afterwards. Thus a user interface together with itsapplication program are like an audio amplifier and speakers; the task set the user is like a signal generator; theinstruments (e.g. questionnaires) are like meters; the measures (e.g. satisfaction, or time to achieve the task) arelike the quantities measured (e.g. voltage); the testing episode determines additional conditions such as theavailable help for users, or the temperature and power supply for electronics; the report generated afteranalysing the results might give the frequency response of a hi-fi system, or summarise interface performanceon a set of standard tasks.
Properties affecting the choices in a measurement studyA complete method for a measurement study involves choices at each of the five levels. In the framework wedevelop here, we discuss the issues that affect the choices that must be made: how to select the best method fora given job. Each level has alternatives, and these vary in several important properties. For instance instrumentsvary both in how much they cost each user, and in how much they cost the investigator. In addition there aresome properties that are affected by several or by all levels. We have organised our material around this idea.The alternatives and properties for each level are summarised together here, but are more fully described in thesection dealing with the level with which they are associated.
However there are a number of qualifications that emerge. Firstly the sets of alternatives are all open-ended:there are really an indefinitely large number of them at each level, and here we concentrate on the ones mostoften useful in HCI. Secondly the choices at different levels are not fully independent, partly (for instance)because some instruments are mainly useful only for some kinds of measure. Thus in practice you only makefree choices at some levels, and some others are then heavily constrained. This shows up most perhaps at thefourth level (results), where if you have chosen everywhere else then the method of analysis you choose is oftenjust a matter of reporting everything you meaningfully can given the nature of the data; conversely, if you wantto be able to report a comparison (a particular type of result) then this constrains what you may do at otherlevels (e.g. probably choose an experiment as the instrument, and be careful at the episode level to control allthe variables).
Thirdly the testing episode level is somewhat different in that you must make not one but several separatechoices (of task, users, machines etc.); however these share some important properties e.g. similarity to "real"practice. Fourthly, the controlled experiment behaves rather differently from the other instruments in terms ofthis framework because in some ways it is more like a kind of testing episode than an instrument: to do anexperiment means on the one hand making choices at the episode level that ensure that the set of measurementsare strictly comparable (variables are controlled) and on the other hand other instruments may be employedwithin it e.g. questionnaires. Nevertheless in practice, an investigator faced with a question such as "how easy

Nov 2002 3
is it to produce a short letter using this word processor" has a choice between (say) doing a questionnairesurvey of established users, doing think alouds on a sample, or doing a controlled experiment. Thuspragmatically, if not logically, experiments belong to the set of instruments, and satisfy a definition ofinstrument as "a means of doing measurement".
Summary of the frameworkMeasuresAlternatives: time on task, time to learn, number of errors, feeling of enjoyment, ...Properties:
Type of unit: Open-ended, events, category, ordinal, ratio scaleComparability: open-ended vs. the rest
Underlying thing to be measured: User behaviour, knowledge, intention, values, attitudes, ...Internal/external: measure internal (e.g. mental) state or behaviour
or "attitudes" (internal estimates of external factors)Measure: machine, environment, or user
How well are you measuring what you really want to know?(e.g. How close to proposing specific design modifications)
InstrumentAlternatives: Focus group, questionnaire, feature checklist, semi-structured interview, think aloud protocol,incident diary, ethnographic field study, controlled experiment, ...Properties:
Whose judgementComparability: improved by centralised or mechanised judgement
Internal/external: Measure by asking the user, or by observing what happensCost to userCost to investigatorRetrospective or on the spotType of additional prompting: none, investigator, other users, ...
Testing episode:Alternatives: Separate choices of each of:
Environment (including sources of help)MachineUser:
Task (user’s current goal)The knowledge (expertise) users haveUser’s permanent characteristics
Properties:Comparability: Is the set of instances under each choice uniform (controlled)?Validity: Are they natural (representative of the intended set)
Laboratory study <—> Field study (Roughly: on this spectrum,the former increases comparability but reduces validity,while the latter has the inverse properties.)
Coverage of the potential space of bugs
Results:Alternatives: Transform measures, combine, averages, describe distributions, decide whether two sets are
probably distinct (significantly different), ...Properties:
Comparability: may the measurements be meaningfully combined, or not?
Report:Alternatives: Find bugs, compare two designs, compare a design against benchmarks, compare users, ...Properties:
Where in the design cycle is the study done (illuminative, formative, summative)(How complete a prototype interface is needed)
Comparability: does the report's goal require comparison of measurements?

Nov 2002 4
ComparabilityThere is one important property of measurement that appears at all five levels in different ways — thecomparability of the measurements — which we therefore introduce here (since it does not belong simply toone level). Whether comparability is desired is determined by the kind of report that is wanted. If twoprograms are to be compared, then comparability is necessary, whereas if all that is required is for a list of bugsto be assembled, then it is not (unless data on the frequency and severity of each bug is also required). Theimportance of comparability emerges at the stage of result calculation: you should only add together things thatare comparable (e.g. apples with apples, but not with oranges). If you want to calculate the difference inaverage time that users of two programs take, this is only meaningful if every other factor is comparable: thetask they were attempting, their prior experience with the program and the machine, the speed of the machines'hardware, how much they were told to try to be quick, etc. If the report's goal requires comparisons, then youwill need to make some such calculation at the results stage, but it will only be sensible and permissible ifcomparability has been achieved at the three previous stages. At the testing episode stage, this means setting thesame or comparable tasks to comparable users (e.g. all novices) under the same conditions. At the instrumentstage, this often means doing an experiment and not a more realistic field study. If you choose an instrumentlike a questionnaire, then you must think about comparability: will the questions mean the same thing to bothgroups of users? are the users of each program whom you are asking similar in other ways e.g. age, how busythey are etc.? At the instrument level the property of whose judgement decides the values recorded is alsoimportant to comparability: interviews are more comparable than questionnaires because a single person (theinterviewer) makes all the judgements; and a measure like time decided by the stopwatch manufacturer is stillmore comparable. At the level of measures, the issue is that the unit of measurement cannot be open ended, butmust be one of the other, comparable, measures (categories, ratio scale, etc.).
Measures (level 1)We need to make a number of distinctions, which may be summarised as follows. We need to distinguishbetween the underlying entities that have causal effects (e.g. what a user knows), and the quantities actuallymeasured (e.g. their score on a test), which we hope indicate the underlying entities that we are really interestedin. For both of these there are two independent issues: the kind of thing being measured (e.g. time orintention), and the kind of metric used (e.g. quantitative or qualitative). The things measured may be propertiesof the user or of the machine or environment; and they may be external behaviour or internal (e.g. mental) state.
There are two sense of measure to consider: the underlying things we wish ultimately to measure which ingeneral we believe to be basic causes and effects in the interaction, and the more immediate properties that wemeasure as evidence of the underlying things. For instance, a simple thermometer measures the length of acolumn of liquid as a proximal or surface measure indicating the distal or underlying quantity of temperature. A voltmeter may actually measure current, using current through a standard resistance as a measure of voltage.A car's fuel gauge has position of a needle on a dial as the proximal surface measurement indicating the distalquantity of fuel in the tank (the needle depends on the current, the current depends on a variable resistance inthe tank, the resistance depends on the height of a float in the tank, and the height of the float depends on theamount of fuel). Thus an instrument is a design for getting an indication of an underlying property, often bymeans of a measurement of some other, related property. In this section we discuss distal measures: theunderlying things we wish ultimately to measure. The proximal, surface measures are the business of theinstruments, which we discuss in the next major section.
The kinds of underlying thing to be measuredThe first major division of measures is between measures of the machine, of the environment, and of the humanuser. In principle every kind of measure could be apply to the machine as well as to the user: the overallperformance of an interaction can depend on the machine's response time, its errors (if there are bugs in theprogram), its estimates of a user's abilities (if it has an active user model), its goals or intentions (e.g. programsmay have built in "goals" such as saving work periodically without commands from the user). We shallcomment on this, but most of what we have to say will concentrate on measures of the user. This is onlybecause most user interface technology so far makes the state and actions of the machine very easy to observe.In particular, the basic feature of direct manipulation is to reflect machine state on the screen, so either a videocamera or a human investigator can usually capture the state and behaviour easily. However in future it may bethat other interface styles make machine measures more difficult and more important. For instance, if theinterface adapts itself significantly, then it may become hard to replicate exact machine behaviour so as to do thesame test on different users, and then more attention will have to be paid to measuring and recording exactmachine states. (This point is familiar to programmers: many bugs are repeatable,and so are relatively easy totrack down. Notoriously difficult are bugs that are intermittent because they depend on some hidden andvariable part of the state e.g. network traffic.) In fact as well as measuring the user and the machine, it may

Nov 2002 5
sometimes be important to measure things to do with the environment e.g. the presence and availability ofinformation resources such as the telephone, colleagues at adjacent desks, or a printed manual. Theenvironment is part of the relevant "system" to be observed and measured if it affects the course of theinteraction.
The second, independent, major division of types of measures concerns the external/internal distinction:measures that are of external behaviour (e.g. what the user does, how long they take to do it), versus those thatare of internal, mental state (e.g. what the user knows, what they were trying to do). (This distinction alsoapplies to observing the machine: external behaviour concerns its output, while internal behaviour concerns itshidden state.) In fact there is a third kind of measure: not only external behaviour and internal state such asintentions, but "attitudes" in the sense of internal estimates of external things. For instance, people generallyhave rough estimates of how difficult it would be to use a program. These estimates are important becauseusers' decisions about what to try and what to do (and whether to buy a program) are largely governed by theseestimates. These attitudes are often approximately accurate even when they do not sound it. For instance,someone may say the don't like a word processor and may apologise for it, but in fact this may correspond tothe fact that that word processor takes a long time to learn and the user would not recoup the cost of learning byany benefit for their particular tasks. However whether or not these estimates are accurate reflections ofinterface performance, they are sometimes important to measure because they independently influence userbehaviour. These attitudes, then, are a third class of thing to measure. (They may also occur in machines whichhave user models: internal estimates (possibly quite wrong) of what a give user knows or wants.)
Examples of attitudes are estimates about how long it takes to do something, about the chances for succeedingat a task, about whether it will be enjoyable. Examples of external behavioural measures are time to complete atask, the number of errors made, what actions a user takes: in particular, which method they choose (the mostefficient, or a roundabout one), whether they use shortcuts, etc. Other possible external measures might befacial expressions, or exclamations (e.g. curses).
Internal measures may be roughly divided into three classes, depending on whether they typically vary over avery short time, a medium time, or only over very long periods. Examples of the first class (short timedurations) are intentions (what the user is trying to do e.g. to select the command "cut", to delete a letter), andinterpretations ("I think that command 'cut' might be for dividing my file into two parts"). Both of these oftenvary almost from second to second as the interaction proceeds. Examples of the second class (medium timedurations) are knowledge of commands, of how useful the machine is turning out to be, of how annoying itfeels. Examples of the third class (long time durations) are abilities (e.g. is the user blind?, can they read?), andpersonality characteristics.
Types of unit (metric)The other independent important issue for measures is the type of unit in which it is described. This propertymay be loosely described as qualitative versus quantitative, but more accurately by listing the major alternatives.These are:• Open-ended. An unstructured answer to a question, or description of the user's behaviour is recorded.• Event. A definition of an event (e.g. the user opens a menu but then closes it without selecting a command)is used, and everything that happens is classified as either an instance of the event or not.• Categories. Whereas with events, most things are not recorded at all, here most things are classified intoone of a set of categories. For instance user behaviour might be classified into: typing, using the mouse, gazingat the screen, thinking. However there is no particular way to rank the alternatives.• Ordinal measures. Here the categories used have a definite order. For instance users might be asked toscore each command as "difficult", "moderate" or "easy"; or their use of each command as "very frequent","frequent", "seldom", "rare", "very rare". These categories have a definite order, but probably no furtherreliable numerical properties: for instance, is "seldom" twice as frequent as "very rare"? Many questionnairequestions use numbers as response categories, but you shouldn't therefore believe that it is sensible to add ormultiply them: unless you have direct evidence that this makes sense, you should treat the numbers asexpressing only order. (This is just like the use of numbers in programming to represent different cases e.g. 1for red, 2 for blue, 3 for green. Numbers are convenient code labels, but arithmetic cannot be sensibly appliedto arbitrary codes.)• Ratio scales. Some units however are part of scales (e.g. time), and it then makes sense to apply arithmetic.
The major division in the above spectrum of types of metric is between open-ended and the rest. The rest allsupport some kind of quantitative comparison between subjects or measures, while the open-ended does not.On the other hand, only the open-ended can allow the investigator to discover something wholly unexpectedsuch as a bug. Qualitative, descriptive methods are important for getting impressions about what is going onbetween the user and the interface — in a sense they are the bedrock. Without the intuitions gained from them,

Nov 2002 6
quantitative methods make no real sense. Thus for comparability, quantitative metrics must be used, but todiscover the unexpected (as opposed to testing hypotheses, or measuring standard features) some open-endedmeasure must be used. The choice then often depends on the goal of the investigation (the report type), but it isalso common to see the types mixed, or to have an investigation in which the first phase uses open-endedmeasures to get an overall picture, and a second phase uses quantitative measures to give a detailed picture ofthe issues identified by the first phase.
It is also possible to record open-ended data, and then to categorise them by some coding scheme at a laterstage (of result calculation). This has the advantage of allowing several different analyses to be done later, butthe disadvantages that it is often an excuse to defer until later the vital decisions about what will be done withthe data (which often affect how the measures are taken), and that it prevents the investigator getting the subjectto help with the categorisation ("which did you really mean?").
Further examplesIn principle we can fit everything we might want to measure into the above scheme. For instance we frequentlywish to measure users' "past experience". This is an external measure (for how long they have actually, in thepast, used a give program), which has a ratio scale (e.g. hours). To measure the past, of course, necessarilyrequires indirect measures. Whether we ask the users themselves, or consult records of their past activities, is amatter for the instrument we select. Past experience is a question of external behaviour, but in fact very oftenwhat is really wanted is a measure of what the user now knows (their expertise) which is an internal matter ofknowledge: it may be better to measure that more directly, either by asking what they know or by testing theirability behaviourally (which would constitute an external type of instrument seeking to measure internalknowledge indirectly). Knowledge does not really have an applicable ratio scale despite the practice ofexaminations: if user A scores twice as much as user B on a typical test, they may know everything B knowsplus some more, or they may know a different set of things.
Another case is value judgements. How much a user values the benefit of employing a program (its utility) is amedium term internal measure, while how much a user enjoys or dislikes using the program is a differentmedium term internal measure (part of its usability): some programs are not used because although quite usablethey aren't useful, while others are used although hated because they do something vital. One common measureis questions with answers on an ordinal scale (see the section on questionnaires). Although these things areinternal, another way to measure them is through an instrument looking at external (behavioural) signs: wecould record facial expressions, or offer people a choice of programs with varying utility and usability and usetheir choices as indicators of the values they put on them.
An issue of importance for designers is what commands are needed by users. This could be inferred from whatcommands are used frequently (i.e. use an instrument whose surface measure is command use). Users couldbe asked during use whether they needed that command as opposed to it being an accidental invocation: thiswould be a direct internal measure. Users could be asked retropsectively about what commands they needed,which would rely on their memory: an internal surface measure directed at an internal underlying issue. Needis either a binary or an ordinal scale (for degree of need) applied to each command separately.
A final case is that of errors. These are frequently used as an external measure, but this can be problematicbecause it is not always clear what should count as an error. The essential trouble is, that our intuitive notion oferror is really an internal one: doing something which we would not do if given a choice. But this is seldomwhat is measured. Instead "errors" are usually defined as an external measure: a particular class of action.However, is it an error to do something unnecessary? Users would probably agree that deleting a file byaccident is an error. But looking up something in the online help is also unnecessary (if you had learned itbefore). Similarly, typing at a reasonable rate involves inserting some wrong characters, but if the alternative istyping extremely slowly then perhaps this should not be regarded as an error. Not convinced? Well whatabout opening a pulldown menu, moving the cursor very fast to the approximate position, pausing, thencorrecting the position of the cursor until it is on the command you want: was that an error? It cost you time,and obviously you would prefer it in an ideal world if your cursor had landed on the right command first time.In the end how a measure is defined may not be a general objective issue, but may depend on the purpose of thewhole measurement study: the five levels are not wholly independent.
In fact nothing we have said so far tells you what measures will be useful: the scheme we have just described isonly a way of organising the space of possible alternatives. How useful a measure is depends on how well itmatches the overall purpose of the measurement study (the report type). This degree of match is anindependent property of a measure in relation to a particular study. A useful definition of error depends onyour aims, though in any case it would be sensible to ask a few users what they feel counts as an error in thesituation you are studying. Another case is that of bug descriptions. What is ultimately wanted by designers is

Nov 2002 7
descriptions of feasible modifications (e.g. "the command name should be changed"), although it may be hardto do better than descriptions of symptoms ("several users got lost while attempting to move text"). Either ofthese might be categories or events or open ended descriptions; it is a separate issue whether the investigator isable to get evidence not just of the existence of a problem, but of its cause and hence approach possiblemodifications.
Summary of properties of measuresType of unit: {Open-ended, events, category, ordinal, ratio scale}
Comparability: open-ended vs. the restUnderlying thing to be measured: behaviour, knowledge, intention, attitudes, ...
Internal/external: measure internal (e.g. mental) state or behaviour or "attitudes" (internal estimates of external factors)Measure: machine, environment, or user
How well are you measuring what you really want to know?
Instruments (level 2)Above we discussed measures, and their alternative properties. In principle any instrument could be used totake any measure, but in practice some make much better sense than others, and we will note these mainapplications as each instrument is discussed. For instance one could use a questionnaire to ask users aboutanything, but in practice people remember some things much better than others, so they are much more usefulin asking about stable habits and attitudes, than about what someone was thinking about on a particularoccasion.
Instruments, then, are ways of doing measurement that have largely evolved to achieve some particular point inthe space of alternatives already outlined, and also in the space we outline below as determined by properties ofinstruments themselves. They are not in practice fully independent of the other levels, and this is noted in thesections discussing each instrument. In particular, as noted earlier, the experiment has many of the features of atesting episode as well as of an instrument. However in this framework we discuss them as if they wereindependent so that you can see what the logical alternatives are, even if some of them have little application.
We now discuss some properties specific to the level of instruments, before describing seven alternativeinstruments.
Internal or external surface measureThe underlying thing being measured may be internal (e.g. mental state) or external (e.g. behaviour), butindependently of that, the surface indication used to measure it may be either internal or external. Thusinstruments may be divided into whether they are internal — ways of asking the user — or external —basically to do with observing and recording user behaviour. This choice is in principle independent of thechoice of underlying measure (though some combinations work better than others). For instance you can ask auser about anything: about external matters of behaviour (how often have you used this command), or internalones (what are you trying to do now). Conversely, besides using external methods for external measures (e.g.use a camera to record keystrokes), you can try to estimate internal matters from external ones: use facialexpression to indicate feelings, use the length of a voluntary rest to estimate how tiring the user found theprevious task.
How the measure is made? (whose judgement)Whose judgement or interpretation determines the recorded result or measure that is aimed at inferring anunderlying entity? There are basically three possibilities:
A device e.g. a stopwatch, store keystrokes in a fileAn observer e.g. the investigator perceives a gesture, judges an intentionEach subject (user), when asked to reply to a question
Note that although at first the method seems to be determined by what is being measured (e.g. if it is time thenuse a stopwatch, if an intention then ask the user), in fact there is a large overlap of possible methods. Forinstance, a user's past experience with computers is an objective fact which might be measured withoutintervening human judgement, but in practice it's easiest to ask the user. Similarly you can ask someone whatthey are trying to do, or an observer may judge it (as when you see the cat with a paw in the goldfish bowl andinfer that its intention is not to cool its feet), or even estimate it mechanically as burglar alarms do.
Nov 2002 8
Devices have the judgemental criteria built in (e.g. electrical meters or gas chromatographs) as the result of ahistory of research and debate in the literature. If observers are classifying behaviour, then you need to trainthem and provide operational definitions of each category used, in a way comparable to devices.
Devising explicit judgement procedures. One way round the problems of getting observers or subjects tomake reliable judgements is to make the judgement process more overt and mechanical. For instance we mightdecide to judge whether a user is a novice or expert by setting them a test, and defining an expert as one whoscores more than 50%. Strictly speaking, having a device (e.g. a stopwatch) make judgements still involveshuman judgement in two ways: someone still has to read the watch, and the issue of defining time in terms ofwhat a particular watch measures involved both theory and judgement. However the gain is large: watches areeasier to read than being trained to judge time intervals oneself, and they make far more repeatablemeasurements. The debates about timing were done once and for all, and nowadays are effectively frozen intoinstruments like watches and do not call for further discussion.
Because such meters for aspects of human thought and behaviour are much less established, we are ofteninvolved in developing them for specific purposes. Thus instead of asking people whether they were expert, wemight devise a standard test. In fact many measures involve something like this. For instance you might wantto know how often people use a command, and use a monitoring system built into the interface to record this.The problem is, some uses will be accidental (perhaps through typing errors, or the mouse slipping while doinga menu selection), so you are not getting the measure you really want. In general, observing people's physicalactions is not a wholly reliable clue to their "actions" in the everyday sense, which also involve their intentions.
Asking people a lot of questions about details, and putting together the final category judgement oneself,preferably by a fixed explicit algorithm, is a way around this kind of problem. The essential idea, like buildingstopwatches, is to reduce the amount of complex case by case judgement in favour of using a uniform methodfor every case. Thus using a trained observer can be made more like a device, and more reliable than askingeach user to make a judgement separately.
There are two basic ways of collecting measures of verbal output from the user. Either one must provide theuser with some way of making a response in a directly categorised or quantitative way, such as a set ofresponse categories or a number; or allow a response in natural language, so that the investigator can categoriseit. The first is usually done by giving the user boxes to tick, or asking for quantitative estimates in terms ofnumbers. In the second, the investigator must develop a way of categorising different kinds of verbal reply.
This is the essential difference between questionnaire and interview types of instrument, and the issue of whatthe interviewer is prepared to do in the way of interactive probing. In both cases the goal of the investigator isto be able to categorise the user's response and then to count these categorised responses. Typically then,responses of a range of users in each category can be tabulated, and calculations made to infer underlyingentities shared by a population of users.
The issue is first that English is a vague language, and you may need to chat quite a bit before the userunderstands what you are after. Secondly the user may not have, as mental concepts, the categories that yourtheory is requiring you to use. In other words you will have to teach them new concepts; or else ask them a setof diagnostic questions in order to decide yourself what category they or their experience fit into.
Another alternative is to let the user speak or write in unprompted English. But then the understanding burdenis on the investigator and again being able to discuss what was meant with the subject is usually invaluable. Insummary, either the investigator or the user can choose the language (e.g. in questionnaires or open-endedcomments respectively). However two-way dialogues are much better than either alone.

Nov 2002 9
Issues in askingIf you ask the subject/user, then there are two parts to this issue. One aspect is the factors influencing theirjudgement, basically influencing the access they will have at the time of the question to their own consciousnessand memories. The other aspect is the communication of the meaning of the question and answer categoriesfrom questioner to subject. Questions should of course be tested to reduce ambiguity and lack of clarity. Theymay then be aided by prompting: the kind of prompting used varies depending on the instrument.
PromptingPrompting is important for two reasons: clarifying the question, and helping the user to remember. Thealternative kinds of prompt include:
No prompt (questionnaires)Verbal prompting (semi-structured interviews with probes)ReadingBehaviour i.e. subject does things (if an instrument is administered during interaction e.g. diaries)Videotape (record a subject and ask them to think aloud later, while watching themselves on videotape)Other users (as in a focus group).
Memory issues: do they know the answer?Asking the user is the "internal" method: one of the two general approaches to measurement. We have justdiscussed how to get the most out of questions and answers, but even more fundamental is the issue of whetherthe user knows the answer even if you ask the question in the best way. The first issue is that of accessibility toconsciousness: is the underlying thing to be measured something we know about anyway? For instance we arenot aware of many of the muscle movements we make, nor of how we recognise things. A second issue is thatwe may know some things yet be unable to recall the answer except in the right circumstances. It is well knownfor instance that recognition of something is usually much easier than recalling it in answer to a blank question.For instance few people can write down all the commands on the menus of a program they use regularly, yet ifgiven a checklist of the commands, they can recognise them and say whether they use them often.
The third issue is simply that some things are transient: forgotten very quickly. You are unlikely to be able toremember the mouse movements you made at your computer yesterday; yet if you had been asked at the time,you would have been able to say what each one was for.
Retrospective vs. on the spotOne of the most important properties of an instrument is whether it is retrospective, or on the spot. I.e. whethersubjects have to rely on their memory, or whether the measures are applied to events at the time. As we haveseen, there is an important class of things which are accessible to consciousness, but which we forget veryquickly: these are are the things which it is important to have an on the spot instrument to pick up. Thesethings are internal measures with a short typical time span; for instance, intentions, and interpretations of what adisplay means.
CostsAn important property of an instrument is how much it costs to apply, and they differ greatly from each otheron this issue, which is of considerable practical importance. In fact there are 2 kinds of cost (in time andmoney) of applying the instrument:
Cost to the subject (user) e.g. time to fill in a questionnaireCost to the investigator e.g. time to design an interview and the time to carry out the interview with each subject.
Summary of properties of instrumentsWhose judgement? {user, investigator, instrument}Measured via a surface measure that is {internal (ask the user), or external (observe the user)}Cost to investigatorCost to each userRetrospective or on the spotPrompt typeTypical measureTypical testing episodeTypical result calculationTypical report goal
Instrument 1: Focus groups

Nov 2002 10
Primary functionThe distinctive feature of a focus group is that it is a group setting, where users talk in free-form discussionwith each other more than with the investigator, whom they outnumber. It maximises the chance of hearing notjust what users think, but the way they think: it aims to elicit associations and connections that are in factimportant to the users, but tend to get missed by other methods because they are not obviously functional andbusinesslike. Thus focus groups are intended to discover what might otherwise be missed because it isunsuspected. Focus groups can be used in three ways.
The first is very early in the design, to broaden the requirements for a design, by discovering what goals andassociations actual users have in this area. It is a supplement to task analysis: a formal analysis of what tasksusers actually or officially perform. In a focus group, you can discover how they actually use the existingsystem and what concerns are actually important for the users. It is thus an important alternative or supplementto task analysis and the project requirements drawn up by managers. You can use focus groups in this way forstudying a) existing user wants and tasks b) associated user thoughts and especially emotional connotations —what they want, and why they will be performing those tasks c) How they think about those tasks, which willhave implications for how they should be asked to express parameters to the system e.g. are they movingwindows to fixed coordinate positions, or to "look right" d) prior user experience (concepts of how-to). Thiscan be and should be done before any design or implementation, to provide basic data for the design.
The second application of focus groups is as a debriefing session, as an alternative follow-up after exposingusers to an interface rather than (or as well as) interviews and questionnaires. A particular advantage here, isthat it may be possible to tell subjects that they have "failed" with much less hurt to them, supported by theirpeers who are either in the same situation or in any case have no particular respect for the device. And oneuser's remarks may prompt another into mentioning something which would otherwise be lost.
A third application is as an alternative to questionnaires for measuring users' affective and other attitudes.Whereas questionnaires are often structured, or else ask open ended questions with limited ability to put theuser in the right frame of mind, focus groups encourage and support extended expressions of judgements andfeelings. It can allow investigators to see vividly how users bring non-computer experiences with them: forbetter or for worse. Designers who are unaware of this will never understand why customers are avoiding theirwork.
Basic ideaGet together an audio recorder, 4-6 users, and an investigator to lead the discussion. Introduce a list of pre-settopics one at a time, and facilitate free discussion. A session might last, say, 45 minutes. The main aim is tofind out how people naturally think about the topics, so the method makes sure that users outnumber theinvestigator (unlike any other method), and relies on chance remarks by one person to trigger others.
MethodPrepare the questions or topics (the "focus" of the group). Use an audio recorder, and bring together 4-6 users,and an investigator to lead the discussion. Introduce the list of pre-set topics) one at a time, facilitate freediscussion including ensuring that everyone is heard, ensure that clarification of all (!) vocabulary and conceptsused is made. The designer may wish to be present, or to listen to a recording later.
If it is pre-design, then the chief aim is to elicit the natural habitat of the proposed device, or at least of existingmembers of its species: how it is used. This breaks down into several distinct questions:
• What the associated aims and feelings are. E.g. heating controls seem to be used by one person onbehalf of a whole household, so the goals are not personal, and are taken seriously (?like first aid kits and notlike VCRs). This is vital in that it is a measure of the value attached by users to the function performed: thedenominator of the all subsequent tradeoffs of cost.
• What are the tasks and their exact mental specifications that users perform with the device. E.g. dopeople think of putting the heating on for 2 hours, or from 6:20 to 8:20, or from 18:20 to 20:20? Do they wantit on "over lunchtime" or "from 12 to 2". Do they come in and want to be able to turn it on in one button push,and then forget it? Do they really think of "I want it warm by 6:30" or "I want it to start warming at 5"?
• What are the devices and associated methods and habits (of both thought and action) that the userscurrently employ? This will affect what interface methods they recognise readily.

Nov 2002 11
If it is a post-trial debrief, begin with refreshing their memories with a demonstration and telling them how itreally worked. Ask them what they feel about the device, whether they would use it etc. Try out probes on theinvestigator's hypotheses about the sources of trouble observed. Get them to propose modifications (e.g. onpaper) as another method of eliciting what they really think was wrong, and what the device should really aim atdoing.
AnalysisThere are two ways. A qualitative analysis notes the concepts that emerge, and evaluates their implications forthe purpose. Usually less relevant, a quantitative analysis would count or collect instances of particularconcepts. To be meaningful, this would require that the group leader to elicit comparable amounts of commentfrom each participant.
BibliographyD.L.Morgan Focus groups as qualitative research (1988) (Sage: London) [SocSci A370 MOR2]T.J. Gage "Theories differ on use of focus group" Advertising age vol.4 (1980) 19-22.R.Foshay Guidelines for evaluating PLATO programs TRO technical paper no.2 (1992) p.23; available at: http://it.coe.uga.edu/itforum/paper50/paper50.pdf
Summary of propertiesWhose judgement decides the data: It is conducted in the users' terms; not dependent on their
understanding of investigators' concepts. And can be used to discover users' concepts and the wordsthey use for them. Thus: data is in user terms and not distorted before recording. This leaves theproblem of translating it into investigators' terms (something to try to ensure in the group), and ofcomparing different groups.
Internal / external surface measure: Internal — ask the userCost to each subject: the time for the session (say an hour).Cost to the investigator: Preparation time. 1 hour running each group, plus time to organise getting the
subjects there. Money for the subjects' time. Analysis time.Retrospective or on-the-spot?: Retrospective. (Hence not good at capturing behaviour; but good for
measuring attitudes, affective stuff, persistent concepts, user vocabulary for concepts.)Prompt type: Other users’ comments, investigator’s general questions.Typical measure Tasks and supertasks. Bugs mentioned.Typical testing episode Can't easily compare it to other groups in that the discussion will develop differently
in different groups, and may depend on what gets raised by the subjects. However the topics raised arethe same, and it would be possible to apply a uniform coding scheme. Ecological validity entirelydepends on the discussion. It can be used to elicit information on real situations of use.
Typical result calculation Count tasks or bugs mentioned.Typical report goals Pre-design requirements capture; debriefing for bug detection.
Other remarksIt is the only one of these instruments to use peer interaction and groups. The advantages of this are that thediscussion will be more natural than with the investigators, and that subjects may prompt each other moreeffectively than happens in semi-structured interviews. The effect is probably something like: when a singlesubject talks to an investigator, they select their utterances to fit in with formal ideas about skill, objectiveaspects of the interface, being business like. When talking to peers, subjects select what they say for beingrecognisable (understandable) by their peers: so common situations, feelings, anecdotes come out. We needthis because subjects' ideas of what is formally relevant are probably not a good guide to real relevance, andbecause whether and how people choose to use devices in real life is probably influenced by things other than"formal" factors.
Listening to others talking may be valuable not just for setting a different tone than the investigator easily can,and not just because one user's remarks may act as a prompt or probe and trigger another user; but also justbecause it takes time without boredom and yet staying on one subject for memories and associations to surface— groups talking can do this.
Example of prompt sheet for leader of a focus groupFocus group on personal organizers : points to cover
• Usage now of diary, alarm, address book, notebook, etc. including where carried and how often used.• Problems with the current means of doing these functions• Extras that could be included by a computer based device• What one would ideally prefer such a device to be like
• What are the snags?

Nov 2002 12
Instrument 2. Think-aloud protocolPrimary functionThe main function of this method is to allow rapid and immediate qualitative feedback from the user about whatit is like to use the interface. It is the closest one can get to a window into the mind of the user. It is related tosimply observing user behaviour (without asking them to think aloud). If the investigator has particular issuesin mind, they may ask specific probe questions in which case the method becomes similar to a semi-structuredinterview conducted withthe task at hand. Incident diaries may be used as an alternative, to investigateinfrequent events.
Basic ideaThis method involves asking colleagues, friends, and then, more especially, people from the potential userpopulation to use the interface. While doing so, the user says whatever comes into their mind.
MethodSit with the user so that you can see the interface and the user's actions.
Introduction. Say that the interface, system etc. is being developed, or evaluated, and it would be of great help ifthe user could use it, and while doing so to say what s/he is aiming to do, where s/he gets stuck, what problemsarise — in fact everything that comes to mind when using the interface. Say that you want mainly to listen,rather than to give advice at this stage, because it is important that the interface can be used by people without anadvisor present.
Think aloud protocols consist of observing a user interact with a system while encouraging them to think aloud:to say what they are thinking and wondering at each moment. They are a simple extension of the most basicmethod of observation: just watching users. You can see a lot by just watching, but when users hesitate youcannot often tell why, so having them tell you is very informative. Similarly when they commit what you see asan error, you need to know why, and they can tell you.
Although you can tell what people are doing and why while they are performing as you would, when they dosomething unexpected only they can tell you what their intention is; when they are puzzled, usually only theycan tell you what the puzzle is; when they choose the wrong menu item, only they can tell you why it seemedthe most likely to them.
People can in practice only tell you about what they are thinking for thoughts that take an appreciable time —such as puzzling about something. They cannot tell you about very fast mental processes — e.g. touch typistscannot say anything very useful about how they decide which fingers to move, or why they sometimes makeerrors. But people can with a little encouragement talk about some of the things most important to designers:what seems obvious or obscure on the screen, what users want to do at a particular point, and so on. Theadvantage of having them talk aloud as they act, is that people quickly forget almost all the details of littlepuzzles and errors, so asking them afterwards in questionnaires or interviews will miss all except the mostpainful experiences. In fact in many cases, a new user does not know they are making an error at the time, eventhough this may be painfully obvious to an observer, so live observation gathers more, and more valuable, data.Think-aloud protocols can be done on any kind of user at any time. However they are most often done on newusers, because problems typically come very frequently then, so that it is worth the observation time. Also, asusers become more experienced they understand more of what is happening, and are more likely to be able tomake a detailed report later.
To gather a think-aloud protocol, the basics are a willing subject, sitting down at the system and a pad to takenotes. Then let them begin. Recording sound or video has the advantage of allowing you to go over the tapelater to observe more details, to get the subject to discuss it with you. The biggest advantage however may wellbe in communicating with the designers: a video tape of users having problems is convincing as nothing else iswhen arguing for changes to a system.
You need to get the subject at ease in talking aloud. The first thing to do is to make it clear that it is the systemnot the user who is being tested and criticised. Say that your aim is to build a system that will let anyone have atrouble free time, and you want to hear about even momentary puzzles and problems. The second thing is toapologise in advance for being there in a chatty situation but refusing (as you should) to give them any usefulhelp even when they ask for it. This is unnatural, but (as you should tell the subject) you need to see whetherthey find an answer to their difficulties themselves, or whether the problem turns out to be a big one.
This is not a rigid rule: it is just that the more you help subjects by answering their questions or giving themhints, the less you find out about how the system performs for users without an adviser sitting there. It is hard

Nov 2002 13
to resist your normal impulse to be helpful, but mostly you should. However if they get totally stuck, you maydecide that you will learn more from the session by giving them a hint so they can get going again (make a noteof the hint, which obviously the interface should have provided itself). Again, if you have already decided tochange the system to provide some bit of information, you might decide to give it verbally to the user in order tosimulate what the system will be like.
As the session proceeds, you should feel free to prompt them to do more thinking aloud, and to ask specificquestions e.g. they look puzzled and pause, and you might ask what they are wondering about, and what it isthey want to find a way to do. There is nothing wrong with you saying quite a bit — this helps to develop achatty and informal atmosphere — you just have to do it in a way where the subject talks about their thoughtsand opinions, but you do not mention your opinions or knowledge of the interface. You should however showyour very real interest in their thoughts.
Think-aloud protocols are open ended and non-directive — they are mostly for finding bugs, not answeringpredetermined questions. As open-ended measures, they are better than interviews because they probe duringnot after the event. They are about recording problems (symptoms), not how to change the design: thus theyneed later interpretation by designers. Thus interviews might be used to ask about problems encountered whenthe subject was not observed; we needn't ask about problems during observation. We can ask the subject'sviews on what to change, although this is unlikely to be useful except as another way to indicate areas that havea problem, or to tell about new functions needed (only users can tell about goals).
Recording. Your main task will be to jot down what happens. This may be helped by a structured data sheet.We will provide one that has some categories to observe, and that can be used as prompts. Note taking isimportant even if you are tape-recording the session. Minimally an investigator sits beside her at the interface,making notes. More elaborately the sessions can be video or audio recorded for later analysis, and keyboardstrokes can also be recorded. The more elaborate methods are not typically necessary however, in mostapplications. Rather the interface should be offered to several users until basic problems are discovered.
Prompts. Particularly if the user stops talking, ask: "What are you thinking now?", "What are you trying to dothere?", "Why did you do that?" and so on.
Hints. The method is entirely informal, with no fixed procedures. It depends largely on your skill in creating aninformal atmosphere, free of any suggestion that the user is being tested, or evaluated.
Analysis. The analysis of these protocols is in terms of the content of the commentary of specific episodes ofaction by the user, so-called content analysis. Content analysis means assigning naturally occurring utterancesto categories. E.g, for each episode: Is it obvious to the user what goals s/he might have with the system? Howdoes s/he form a plan to achieve each goal? When implementing a plan, is what happens expected? How doesthe user recover from unexpected events?
All this can, however, be done informally, assisted by note-taking data sheets laid out with headings.Quantitative content analysis is usually best done from recordings.
VariationsQuestion-answering protocols. This alternative has been used with subjects who are shy, or who mightotherwise be reluctant to speak their thoughts aloud. Here the user asks the interviewer how to do this, that orthe other. The interviewer thereby gains a sense of what is obvious from the interface and what is not. Thedisadvantage of this is that the essentially passive role of the user, and the direction by the interviewer, preventssome some of the bugs that a lone user will discover from being encountered.
Constructive interaction protocols. These require two people to work out together how to use the interface, withthe interviewer listening in. Again, the conversation that emerges will be informative about the features of theinterface that are misleading or unhelpful.
Do it yourself evaluation. This method is important when you want to evaluate a product for yourself, ratherthan primarily to consult or observe other users. It is usually important to have a set of features, goals,guidelines etc. to watch out for.
Logging speed, errors, and other performance measures. It is hard to make any useful evaluation withoutusing either think aloud protocols or semi-structured interviews. In either case, the psychological measurementscan often be enhanced if they are accompanied by performance measures of various kinds, for instance fromlogging keystrokes of a session, or video recording the screen.But whereas think-aloud protocols are helpful on

Nov 2002 14
their own, logging or recording sessions is not very much help without some data about the user's goals, plans,thoughts etc.Behaviour Observation. Watch (either via video or live) the activity of users, but without interacting with themor requiring them to talk aloud. What they do can be categorised and counted.
AnalysisA list of symptoms, plus your interpretations of these especially as you begin to see similarities between users'sproblems.
BibliographyR.L.Mack, C.H.Lewis, & J.M.Carroll "Learning to use a word processor: problems and prospects" in either:
R.M. Baecker & W.Buxton (1987) "Readings in human computer interaction: a multi-disciplinaryapproach" or in: ACM transactions on office information systems vol.1 no.3 (1983) pp.254-271
J.M.Carroll & R.L.Mack "Learning to use a word processor: by doing, by thinking and by knowing" and in: Thomas & Shneider Human factors in computer systems (Norwood NJ: Ablex) (1984) pp.13-51.
MethodEricsson, K.A. & Simon, H.A. (1980) Verbal reports as data Psychological Review vol.87 215-251.Nisbett, R. & Wilson, T. (1977) Telling more than we can know: verbal reports on mental processes
Psychological Review vol.84 227-236.Gilhooly,K. & Green,C. (1996) “Protocol analysis” chs.4-5 pp.43-74 in Handbook of qualitative research
methods for psychology and the social sciences (ed.) J.T.E.Richardson (BPS books: Leicester).
Summary of propertiesWhose judgement? investigator, or behavioural measures too.Internal / external surface measure: Both — ask the user and observe the userCost to investigator The same, repeated for each subject. Expensive.Cost to each user The length of the sessions: 10 min to hoursRetrospective or on the spot On the spot.Prompt type: Investigator; and events with the machine.
Typical measure Bug descriptions (open ended). Both behaviour and intention.Typical testing episode Just apply this instrument. May set specific tasks, or not. Both Field study and lab.
study, but never very controlled since the task is at best weakly specified, and the probes and remindersto think aloud will vary widely with different subjects.
Typical result calculation Count frequency and cost of bugs.Typical report goal Debugging an interface

Nov 2002 15
Instrument 3. Incident diary
Primary functionThe main function of this method is to provide the user with a simple means of recording examples of events ofinterest to the investigator, but without the necessity for an interviewer to be present. It is thus an alternative tothink aloud protocols, which can be used for acquiring information about relatively low frequency events thatmight occur after the main, high-frequency bugs have been eliminated.
Basic ideaThe basic idea, at the abstract level, is to have an instrument that is an on the spot questionnaire (not aretrospective one). Thus it is mainly targeted at measures that are of transient and forgettable, rather than stable,items; events, thoughts, and emotional reactions, rather than attitudes and degrees of familiarity. It is always arecorder of events, and may or may not additionally record some of the attributes of those events. Thus there isa range of functions for it: from just event (frequency) recorders, to complicated open ended descriptions ofthe events (recorded as soon as possible afterwards). Two fairly extreme examples: 1) a pilot writing anaccident report (high motivation, lots of detail, rare event) 2) A user recording how often they do some action,and perhaps why they did it: an alternative to a checklist. User motivation and memory for doing it is the keyproblem, and depends on the combination of frequency, the cost of filling in each entry, and the importance ofthe diary to the user.
The basic idea of this method is to provide the user with structured forms on which s/he can record whathappens when certain kinds of event occur. One such event of fundamental importance to the designer or thedocumentation writer is the user getting stuck. The example diary which you will administer in this course isabout what happens at these points.
MethodThe investigator has two main problems.
A. Designing the diary. The following steps will give a guidei. Define what events you want the user to pay attention toii. Give at least one exampleiii. Lay out the diary in an easy to read manner, so that s/he can fill it in with a minimum of thought,
and taking a minimum of time. (Giving the users too much to do will mean that they will not fill thediary in at all! Users are reluctant to interrupt their ongoing plans.)
iv. Ask the user to estimate how accurate s/he has been in completing the diary
B. Getting the user to fill in the diary. The investigator often has to be careful to ensure that the user knowswhat events s/he is being asked to record. This may require some training, and is often best done by promptingthe user during the first few episodes if this is at all possible.
AdvantagesThe important advantages with a diary are that once the user has taken on the task of completing it, informationcan be collected very cheaply, and without further investigator intervention. One kind of diary that is veryhelpful, for instance, asks users to record what they do when they get stuck for any reason, or have to consult asource of help.
However, although diaries may ask open ended questions, they are usually only useful with focussed questions.Thus it is rather a controlled measure, good only for pursuing relatively specific questions.
VariationA variation of asking users to record a specific kind of event, like getting stuck, is to ask users to give structuredreports on new interfaces. Many companies have a small group of customers who will provide them withfeedback in this way, before a product is released more generally. Other even less formal versions of thisinvolve having complaints departments, logging user phone queries and so on. Though such methods can allbe helpful, two cautions need to be observed:
i. data collected in these ways, from special or self-selected groups of users, may be unrepresentative ofusers in general
ii. though complaints, phone queries, etc. can generate very specific suggestions, it is seldom the casethat users will know what to do about the problem — in other words these suggestions need to betreated as species of measurement, not as things to control a design or decision process.

Nov 2002 16
AnalysisDepends on the measures used. For events and times, simple numerical summaries. For a diary on the sourcesof help, compile a comparative table showing comparative use. For open-ended questions, as for think-aloudsyou will report the symptoms plus your interpretations.
BibliographyJ.T. Reason & K. Mycielska (1982) Absent minded? The psychology of mental lapses and everyday errors(Prentice-Hall: Englewood Cliffs, New Jersey).
Summary of propertiesWhose judgement? Subject's, but after training for non-behavioural data.Internal / external surface measure: Internal — ask the userCost to investigator Small: but if training is needed, may have to attend for a while.Cost to each user Only 5-60 seconds per entry.Retrospective or on the spot On the spot if the subjects remember (but in practice often filled in some time
later).Prompt type: The diary, events.Typical measure Event counts, category questionsTypical testing episode Long time periods, just this instrument applied alone, no set tasks: field study
conditions.Typical result calculation Frequency counts.Typical report goal Debugging an interface
Problem: Getting subjects to remember to fill it in.Advantage: Capturing observations in rare and hard to get at situations.
Example: Diary of getting stuck[Front sheet]
Surname DateForename
Please fill in a page of the diary whenever a Problem occurs
Definition of a “Problem”. Whenever you have to break off what you are doing to consult one of thefollowing sources of help, we will call this a “Problem”.
Sources of Help: Sought on-screen Help Consulted manualAsked other userConsulted notesWatched other userAsked advisorOther source of Help
Please record the first five problems that you encounter, by filling in a separate page for each.
After that, please answer these questions:
Did you remember to fill in a sheet for every problem? For what % of problems did you forget?
Did you remember to fill in the sheet at the time the problem occurred, or later? How long after the problem onaverage?
<Then on separate pages, come copies of the diary form:>[Incident sheet]
1. At what time did the problem occur ...............

Nov 2002 17
2. How was the problem triggered? (Please tick one.)Unhelpful screen messageOther unexpected eventNeed to know something to carry onCuriosityOther
3. Which of the following Help facilities did you try first? (Please tick one, and say how long it was until yougot the information, including the time spent using the resource.)
On-screen help, including menus Minutes till help obtained? ..........Manual Minutes till help obtained? ...............Asked other user Minutes till help obtained? ...............Watched other user Minutes till help obtained? ...............Asked Duty Advisor Minutes till help obtained? ...............Other Minutes till help obtained? ...............
4. Did the information you got resolve your problem? (Please tick one.)Yes, completely Yes, partly No
5. Which of the following statements best describes how much you knew before you started to try and solveyour problem? (Please tick one.)
Had no idea where to start looking for a solutionKnew in general where to start looking, e.g. a chapter in the manualKnew facility existed but not its nameKnew name of facility but not how to use itKnew how to call facility but not how to tell if it worked correctlyOther (Please specify) .......................................................

Nov 2002 18
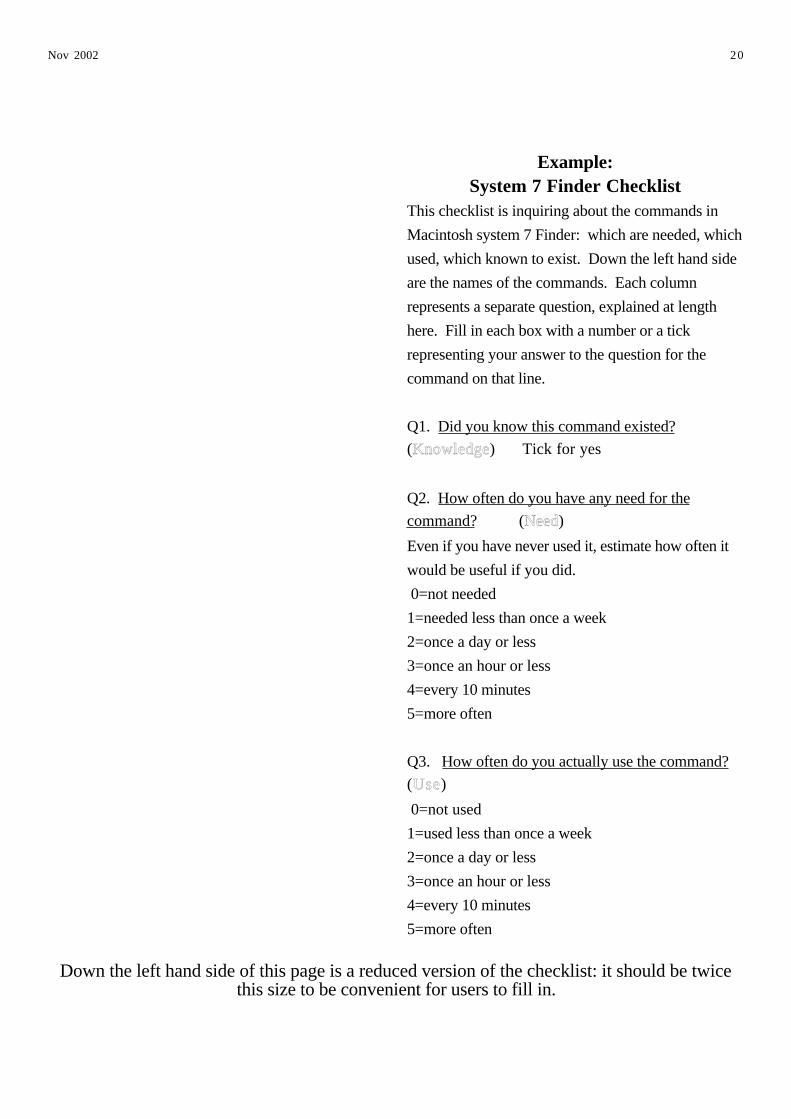
Instrument 4. Feature checklistPrimary functionThe main function of this method is to discover which features are actually used by users. A great deal ofeffort goes into the construction of new features. Little effort as yet goes into determining which are used andby whom. Some features simply serve to make the system more cumbersome, and this can have a substantialeffect in putting off people who are attempting to learn the system. More generally, we can use featurechecklists to help find out why features are unused: e.g. because a command is unknown, because it isunnecessary, because it does not perform the functions the user needs, etc. So we want to ask about usage,knowledge, need, and sources of information.
The main alternative instrument is automatic logging by the system of command usage. If this is available itshould be used in combination. Logging does not rely on users' memories; but it records only usage, not needor knowledge i.e. you cannot conclude that a user does not know a command because you do not observe theirusing it during some period. Logging also records accidental uses (e.g. typing slips) which are potentiallymisleading.
Basic ideaThe idea is to have a checklist of all the features of a system, and response categories indicating usage,knowledge, need, and sources of information. If there are short cuts e.g. keyboard command equivalents on theMacintosh, ask about knowledge of these as well for each command.
Checklists are simple lists asking what a subject knows about something e.g. a list of all the commands in asystem. Since all the subject has to do for each item is to check a box, they are very quick to fill in even if theycontain many items. They are an example of measuring what subjects know or do by relying on their ownmemory and view of themselves. This is normally accurate for remembering whether they know a commandand how frequently they use it. It is unlikely to be accurate for whether they have ever executed a commandaccidentally or as an experiment while searching for some other function.
The most common application is to detect commands that are seldom or never used. When such commands arefound, designers need to know whether the command is not in fact useful to users, or whether the interface(including documentation) has failed to alert users to its presence, or to allow them to discover how to use it.
Thus we want to discover whether a command is useful, whether it is known by name, or at least known of.(Frequent) use of a command implies all three, but lack of use requires more detailed questioning. To addressthis, an elaborate checklist might contain one line for every command or feature of a system; and for each, askwhether the user suspects the command's existence, knows how to execute it, thinks it would be useful, has everused it, and how frequently.
MethodDesign and pilot the checklist, and distribute it, preferably to people who have used the system for some time.New users may not know the names of various features, and their usage will not have settled into a pattern.
Usage: The main issue to pay attention to is to ask people to give specific quantitative estimates. E.g. "Howmany times did you perform a Save each hour during the last day when you were were word processing?" Not:"Do you save, infrequently, sometimes, often...". Remember that user's memories are fallible, so try not to leavetoo long between performance and filling in a checklist.
Check for knowledge: For each command — ask if user: suspects/expects that such a command exists, if theyknow it exists, if they have ever used it. An issue here is whether to describe the function or name thecommand or both.
Check for need: You can ask whether they ever need this function, and current frequency of need, and theirview of how this corresponds to actual use e.g. "On what proportion of the times when it would be useful didyou invoke it?"
Check for sources of information: You can also ask them to name the people they are most likely to chat withabout, or comment on, commands and features of this interface. See if you can identify social clumps ofusage/knowledge by correlating knowledge as measured by the checklist with these links between names.

Nov 2002 19
AnalysisYou will have data on: total number of commands, which known, needed, used, and perhaps the source of theknowledge.
Known - Needed -> info. flood i.e. danger of distracting user with useless commands.Needed - known -> info. delivery problem i.e. users haven't discovered commands they need(Needed & known but not used -> reminding problem: users don't remember at the right moment.)Total - Need ( or Total - Used) -> too many features?
Bibliography See questionnaire bibliography
Summary of propertiesWhose judgement? user'sInternal / external surface measure: Internal — ask the userCost to investigator cheap: the time to adapt the standard questions, copy in the list of commands,
duplicate and handout the checklist.Cost to each user 2-15 minutesRetrospective or on the spot retrospective
Typical measure CategoryTypical testing episode Just this instrumentTypical result calculation See above: compare the answers in different columns for a single item
(command) and a single user.Typical report goals Market survey, background information in fixing bugs, requirements capture for next
version of software
Nov 2002 20
Example:System 7 Finder Checklist
This checklist is inquiring about the commands in
Macintosh system 7 Finder: which are needed, which
used, which known to exist. Down the left hand side
are the names of the commands. Each column
represents a separate question, explained at length
here. Fill in each box with a number or a tick
representing your answer to the question for the
command on that line.
Q1. Did you know this command existed?
(Knowledge) Tick for yes
Q2. How often do you have any need for the
command? (Need)
Even if you have never used it, estimate how often it
would be useful if you did.
0=not needed
1=needed less than once a week
2=once a day or less
3=once an hour or less
4=every 10 minutes
5=more often
Q3. How often do you actually use the command?
(Use)
0=not used
1=used less than once a week
2=once a day or less
3=once an hour or less
4=every 10 minutes
5=more often
Down the left hand side of this page is a reduced version of the checklist: it should be twicethis size to be convenient for users to fill in.

Nov 2002 21
Instrument 5. Questionnaire
Primary functionTo assess preferences and pleasure in using an interface, tap knowledge, ask about the sense of competence,where there are large numbers of users and the investigator wants a method that is cheap in time and and otherresources, and needs only relatively coarse results.
Any question may be asked, but it turns out that questionnaires are best suited for the above kinds of question.Focus groups may be used for a fuller probe into such attitudes. The main alternative or supplement is semi-structured interviews; where possible it is often a good idea to debug the questionnaire by administering it asan interview.
Basic ideaQuestionnaires provide a quick and easy way of allowing to the user to respond to pre-packed items in the formof questions, or statements to agree or disagree with. This is the cheapest way of gathering information, but theinformation is correspondingly limited, and suitable only for some kinds of application. Once the questionnaireis designed it can be used in large numbers, without the presence of the investigator.
MethodThe basic method of questionnaires is to make each item simple and without ambiguity.
Two things have to be designed: the questions and the response scales. For any one questionnaire form it isusually best to keep the format of the questions and the response scales standard.
Questions can be about anything. But they must be simple, not compound ideas or clauses joined by an "and"or an "or". Otherwise the responses become uninterpretable. It is, on the other hand, acceptable to ask a seriesof closely related simple questions — indeed this is the method that experienced psychometricians use. Theycan then check statistically, over the responses of a set of subjects, to see how much each of the simplerquestions typically contributes to a more complex underlying entity.
As to response scales, these can vary from simple yes/no category responses to an analogue scales, e.g. a 10 cmline, with anchor points at each end. An "anchor point" is a verbal description indicating to the subjects adefined point on a scale. Verbal anchor points are usually necessary for every kind of scale. An example of thelowest point on a scale of preference is: "The worst I have ever experienced".
Typically a scale with three, four or five response categories is adequate. Psychologists have found that formost purposes increasing the number of points on a scale beyond seven does not increase accuracy, so if youuse more response categories than that, remember that the margin of error is likely to be at least 15%.
If you are making a scale with two extremes and a midpoint (a bipolar scale), e.g. from the least to the most ofsomething, make the scale symmetrical and have an odd number of response categories with a well defined midpoint. E.g. a five point scale asking subjects to agree or disagree with a statement might have the responsecategories:
strongly disagree | disagree | don't know | agree | strongly agree.
Unipolar scales, e.g. going from "not at all" to "every time", need not have an odd number of responsecategories.
AnalysisTake simple summary statistics of each response: mean, min, max, standard deviation. Perhaps a measure ofskew. Depending on the set of questions, further statistical analysis may be possible e.g. comparing theresponses of different age groups. Complex questionnaires are often analysed using sophisticated statistics.
BibliographyBrynner, J. & Stribley, K.M. (1979) Social research: principles and procedures. Longman.This is an edited set of articles for social science students on many aspects of research design. It includesarticles on how to word questionnaires, virtues of checklists versus questionnaires etc.
Coolican,H. (1994) Research methods and statistics in psychology ch.9 (Hodder & Stoughton: London)
Oppenheim A.N. (1966) Questionnaire design and attitude measurement. Heinemann.
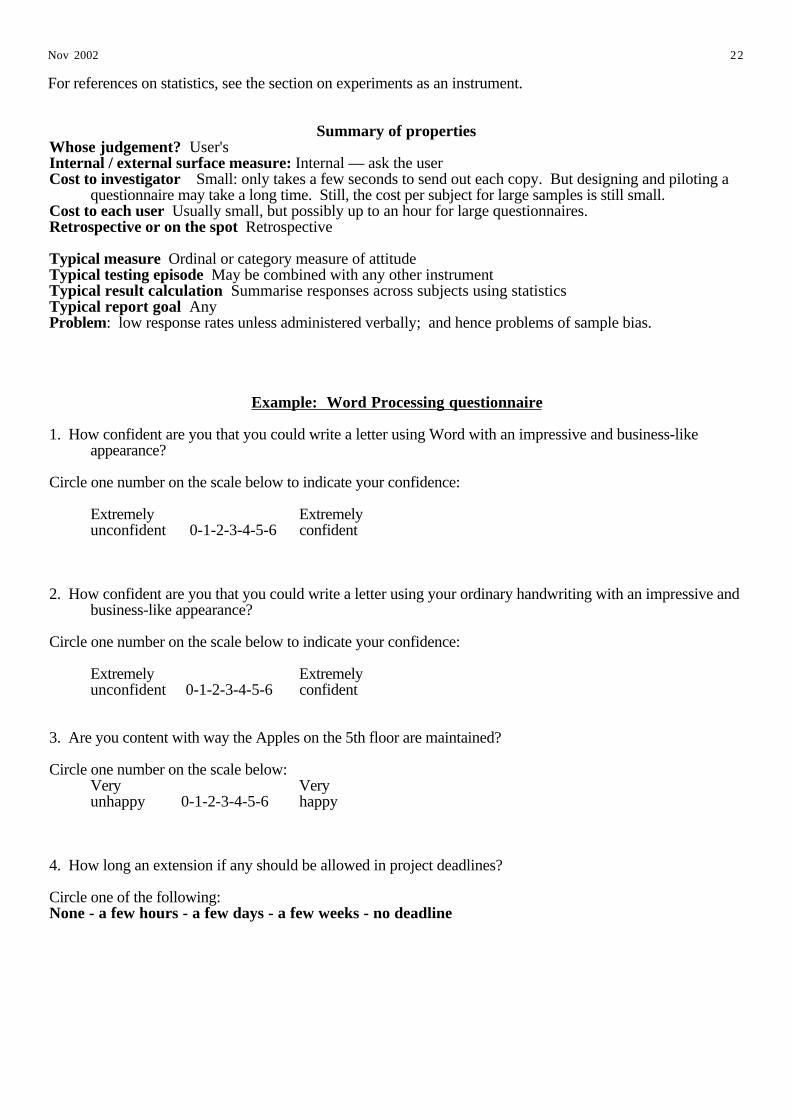
Nov 2002 22
For references on statistics, see the section on experiments as an instrument.
Summary of propertiesWhose judgement? User'sInternal / external surface measure: Internal — ask the userCost to investigator Small: only takes a few seconds to send out each copy. But designing and piloting a
questionnaire may take a long time. Still, the cost per subject for large samples is still small.Cost to each user Usually small, but possibly up to an hour for large questionnaires.Retrospective or on the spot Retrospective
Typical measure Ordinal or category measure of attitudeTypical testing episode May be combined with any other instrumentTypical result calculation Summarise responses across subjects using statisticsTypical report goal AnyProblem: low response rates unless administered verbally; and hence problems of sample bias.
Example: Word Processing questionnaire
1. How confident are you that you could write a letter using Word with an impressive and business-likeappearance?
Circle one number on the scale below to indicate your confidence:
Extremely Extremelyunconfident 0-1-2-3-4-5-6 confident
2. How confident are you that you could write a letter using your ordinary handwriting with an impressive andbusiness-like appearance?
Circle one number on the scale below to indicate your confidence:
Extremely Extremelyunconfident 0-1-2-3-4-5-6 confident
3. Are you content with way the Apples on the 5th floor are maintained?
Circle one number on the scale below:Very Veryunhappy 0-1-2-3-4-5-6 happy
4. How long an extension if any should be allowed in project deadlines?
Circle one of the following:None - a few hours - a few days - a few weeks - no deadline
Nov 2002 23
Instrument 6. Semi-structured interview
Primary functionThe semi-structured interview has become one of the most important methods in social science. It producesquantitative data of far higher quality for most purposes than questionnaires. This occurs because you can goon talking to the subject in what ever way seems natural and relevant until you are sure s/he understands whatyou mean, and until you are sure that s/he has either told you what you want to know, in a form that you cancategorise accurately, or that the person does not have the information you want.
At the same time, because users talk directly about their experience with the interface, the investigator can get agood qualitative sense of what it is like for them, sometimes almost as good as can be obtained from think-aloud protocols, though obviously the results will be affected by forgetting, and elaborations, in ways that think-aloud methods are not. Alternatives, then, are questionnaires and focus groups for investigating relativelypermanent attitudes and issues; and think alouds for specific events and problems.
Basic ideaA fully structured interview is one where the interviewer speaks only a fixed script: essentially a spokenquestionnaire. An unstructured interview is open-ended, so that the responses are not comparable to each other.The semi-structured interview has fixed (structured) topics and ultimate response categories, but the actualwords used by both interviewer and subject are flexible.
The basic idea is:i. to conduct interviews in which you have fixed the agenda, with preset categories of response that you willscore for, with ready rehearsed probes to remind the subject of important things to consider, ii. to be open-minded, talking without a script until you can categorise the subjects response accurately, and alsowith a view to recording the unexpected.
MethodAt the same time as being informal, the interviewer must be careful not to put words into the subject's mouth.Interviewing is a skill which needs training and practice. At first it is best to tape record interviews, and havethem listened to by people experienced in interviewing.
An interview schedule is made up of four components.(a) the questions, in forms of words that you will ask the subject(b) sets of probes(c) sets of response categories(d) boxes for scores, which are typically categories of response, or quantitative estimates
Interviews invariably need piloting and practising before you go to the users you are most interested in.And ifthere will be more than one interviewer, there will need to be training and standardisation among theinterviewers.
The aim is to try to get either quantitative measures (e.g. how long, how often) or behavioural indices, or both.These could be done with questionnaires, but the problem then of whether each subject is applying the samestandards often prevents useful conclusions from being drawn.
AnalysisAs for questionnaires.
BibliographyJ.E. Cooper et al. (1977) "Further studies on interviewer training and inter-rater reliablilty of the Present StateExamination (PSE)" Psychological medicine vol.7 517-523.G.W. Brown & T. Harris (1978) Social origins of depression (London: Tavistock). Especially appendix 5.
The pioneering work on making this technique objective and reliable was done in the psychiatric field.Ignore the psychiatric content, but attend to the method.Draper, S.W. & Anderson, A. (1991) "The significance of dialogue in learning and observing learning"Computers and Education, vol.17 no.1 pp.93-107.

Nov 2002 24
Summary of propertiesWhose judgement? investigatorInternal / external surface measure: Internal — ask the userCost to investigator A few minutes up to an hour for each subject: expensive.Cost to each user A few minutes up to an hour.Retrospective or on the spot retrospectivePrompt type: Investigator’s dynamic judgement about how to promptTypical measure Ordinal or category measure of attitudeTypical testing episode May be combined with any other instrumentTypical result calculation Summarise responses across subjects using statisticsTypical report goal Any
Example of a semi-structured interview
1. How confident are you that you could write a letter using Clarisworks with a business-like appearance?
Probes Categories Score
What will they think at a glance? Couldn't do it at all 0
Will it look professional? 1
would not look good 2
3
words OK, some details of format poor 4
5
Could make it perfect 6
2. How confident are you that you could write a letter using your ordinary handwriting with an impressive and
business-like appearance?
Probes Categories Score
What will they think at a glance? Couldn't do it at all 0
Will it look professional? would not look good 2
words OK, some details poor 4
Could make it perfect 6
3. Are you content with way the Apples on the 5th floor are maintained?
Probes Categories: frequency Score
Does the system work well? Something almost always wrong 0
Long delays? Goes wrong >50% of the time 1
No apparent response? Goes wrong <50% of the time 2
3
Categories: type of complaint 4
No-one to help Things went wrong only 1 or 2 times 5
People unhelpful Perfect 6
Takes too long to get anything fixed
Very good service
4. How long an extension, if any, should be allowed in project deadlines?
Probes Categories Score

Nov 2002 25
What if you're ill? None 0
Extensions just mean you up to 24 hours 1
won't keep up with other work? up to 1 week 2
up to 1 month 3
No deadline = Till exam time 4Instrument 7. Experiment
Primary functionWe often want to measure some aspect of performance with a user, or small group of users. We might thenalso want to see whether this measurement is associated with some particular aspect of the interface, e.g. speedand errors for doing an operation the same if the relevant information is presented in this way or that.
Secondly we might wish to discover whether one system is better than another, or than some baseline, on aparticular quantitative dimension. This method can be contrasted with think aloud protocols, where one gets agreat deal of information from a single user, but at the same time can be very influenced by the particularcharacteristics of that user, who may not be typical. The experiment is a search for objective measures that aretypical of an interface design, independent of biases of the investigator or idiosyncrasies of the particular peoplewho are sampled as users.
Basic ideaSince there is inevitable variability between users, there is limited point in careful quantitative measurement ofthe performance of any single one. Usually we need several. From the several performances we calculate meanscores for a particular type of user. Even then if we measure the mean for a group of subjects using oneinterface design, and compare it with the mean using another design, we will probably not know intuitivelywhether the difference is large enough to rely on.
The idea of doing an experimental trial, therefore, is to control the experimental conditions, make themeasurements, and using significance tests calculate the probability that any difference we observe can beattributed to features of the interface the users have used, and is not just due to extraneous factors, individualcharacteristics of users, measurement errors, or other uncontrolled factors.
CautionThough experiment is the most favoured method of experimental psychologists, as the ultimate generator ofreliable quantitative knowledge, its use is restricted. It is only worth doing if a small number of reliablymeasurable variables is relevant, and when there is a reasonable chance of superiority of one system overanother as measured by these variables.
Experiments are good at generating facts that are free of speculation and bias. With the right skills is possibleto measure aspects of human performance quite accurately — e.g. do people read screens faster with textdisplayed in this typeface or that one, does this interface feature produce more errors of some kind, than thatone.
The reason experiments are not relevant to most evaluation problems is that there is nothing in experimentalmethod which tells one which facts will be important. This is particularly problematic in HCI because there arethousands of "facts", thousands of quantitative comparisons, that could be generated for any interface. It is vitalto establish, before doing any controlled experiments, what the dominant factors are, and this cannot be done byexperiments themselves. If this is not done, then the results will be true but wholly unimportant, as in normal(i.e. uncontrolled, non-laboratory) situations, the effects found will be much smaller than, and so swamped by,other factors. Landauer (1987) attributes to this the failure of academic cognitive psychology to make atheoretical impact on HCI.
Other drawbacks are as follows. First the method will only allow discrimination between like and like, e.g.comparisons within some local region. It is not usually good for multivariable comparisons. Secondly, suchcomparisons only tell one whether a reliable difference between the systems tested exists or not, they do not saywhether this difference is important, or whether its size means much. The experiment is expensive in time andother resources. It also requires the development of a considerable array of skills on the part of theinvestigator. It requires intuitions about whether this particular measurement and comparison will beinformative.

Nov 2002 26
In the end, though, it is only by properly designed experimental comparisons of this kind, that one can say thisfeature is better than that. In the end also, it is only by using experimental methods that issues about whatactually causes what can finally be settled.
MethodTwo basic types of measure of performance are typically useful, those based on time, and those based on thenumber or errors in a performance (or conversely number of items correctly performed).
Assignment of users to groups. The simplest experiment is one in which there are just two conditions. Allanalyses of experiments rely on the a very careful assignment of subjects to conditions, which must beeffectively random: not haphazard, but mathematically random.
Since we humans have very poor intuitions about randomness, and cannot generate random sequences the onlyway of conducting a random assignment to conditions is to use a mechanical means, tossing a penny, referringto a book of tables of random numbers, generating a pseudo-random sequence with a computer algorithm...
Pilot experiments and planning. Experiments do not work well without careful planning. To conduct anexperiment without having planned it, and practised it until it goes like clockwork is a complete waste of time.One must test and refine each sub-procedure on subjects who will not themselves be in the main experiment.Then a dress-rehearsal is needed of the whole procedure to see that all the parts fit together.
AnalysisCan be sophisticated and statistical, since an experiment allows detailed comparisons.
BibliographyRobson, C. (1990) "Designing and interpreting psychological experiments" ch.17 pp.357-367 in Human-
Computer Interaction (eds.) J.Preece & L.Keller (Prentice Hall)
Landauer, T.K. (1987) "Relations between cognitive psychology and computer system design" ch.1 pp.1-25in Interfacing Thought (ed.) J.M.Carroll (MIT Press: Cambridge, Mass.).
Miller, S. (1984) Experimental design and statistics. London: Methuen New Essential Psychology.
Robson, C. (1973). Experiment, design and statistics in psychology. Harmondsworth: Penguin.The books by Miller and by Robson are minimal statistics books aimed at undergraduates with littleknowledge of maths, to allow them to design an experiment and analyse it statistically.
StatisticsEricson, B.H. & Nosanchuk T.A. (1979) Understanding data: An introduction to exploratory and
confirmatory data analysis for students in the social sciences. Milton Keynes: Open University Press.This is one of the very best books on statistics, written by two people who were students of John Tukey,who did much to make statistics into a method that could be used to explore data.
Siegel, S. (1956). Non-parametric statistics for the behavioral sciences. McGraw-Hill.Still the favourite book on non-parametric statistics, a model of its kind.
Examples of ExperimentsBaxter, I. & Oatley, K. (1991) "Measuring the learnability of spreadsheets in inexperienced users and those
with previous spreadsheet experience" Behaviour and Information Technology vol.10 pp.475-490.
Bewley, W.L., Roberts, T.L., Schroit, D., and Verplank, W.L. (1983) Human factors testing in the design ofXerox's 8010 "Star" office workstation Proc CHI'83: Human factors in computing systems 72-77 (ACMpress). Also in ch.18 pp.368-382 in Human-Computer Interaction (eds.) J.Preece & L.Keller (PrenticeHall)
Carroll, J.M., Smith-Kerker, P.L., Ford, J. and Mazur-Rimetz, S.A (1987/1988). The minimal manual. HumanComputer Interaction, 3, 123-153.

Nov 2002 27
Card, S. English, W. & Burr, B. (1978). Evaluation of mouse, rate-controlled joystick, step keys and text keysfor text selection in a CRT. Ergonomics, 21, No 8.
Karat, J., McDonald, E. & Anderson, M. (1986). A comparison of menu selection techniques: touch panel,mouse and keyboard. International Journal of Man-Machine Studies, 25.
Summary of propertiesWhose judgement? instrument maker (e.g. stopwatch)), or investigator.Internal / external surface measure: Mainly external — observe the userCost to investigator Often 1-3 hours for each batch of subjects. Plus a lot of piloting.Cost to each user Often 1-3 hours.Retrospective or on the spot On the spotPrompt type: Hopefully, only carefully controlled experimental instructions
Typical measure Usually pre-determined fixed, behavioural measures e.g. time, number of errors. But canalso do e.g. an interview for non-behavioural and/or open-ended measures.
Typical testing episode An experiment is a testing episode in effectTypical result calculation StatisticalTypical report goal To compare two thingsProblem: designing an experiment that is relevant to the real issues.Advantage: potential for reliable quantified generalisations across users.

Nov 2002 28
Comparing instruments: how they merge into each otherThink-aloud protocols can merge into SSIs (semi-structured interviews) and experiments and field studies.They may be entirely open ended, but as the investigator becomes more focussed in tracking down someparticular problem, so they may (1) set a definite task in order to elicit the problem quicker — this makes itmore like an experiment; (2) ask probing questions with some focus, thus making it more like an interview.Thinkalouds observe the task with verbal extra data; while SSIs use recall with the machine and task as anoptional aid to prompt recall. (3) Another variable is the degree of naturalness in the conditions. This is partlyabout what tasks are set (are they just those that this subject and/or typical subjects would be doing in theirwork?). But it is also about whether the study is done at the subjects' workplace (on their terminal, in theiroffice), or not; and whether the investigator waits to observe the tasks that are part of their job, or whether theyare doing it as an extra activity. Complete naturalness makes it a field study, complete artificiality anexperiment, and the usual case is in between.
A fully structured interview is one where the interviewer speaks only a fixed script: essentially a spokenquestionnaire. An unstructured interview is open-ended, so that the responses are not comparable to each other.The semi-structured interview has fixed (structured) topics and ultimate response categories, but the actualwords used by both interviewer and subject are flexible.
An experiment is really a testing episode as well as an instrument. All the other instruments may be appliedwithin it: and questionnaires often are, in addition to behavioural measures.
A questionnaire is usually applied to a) attitudes and affect b) as in checklists, to reliable memory of stablehabits rather than one-off events. But questionnaires can be open-ended (and so are comparable withthinkalouds).
Diaries may be used for debugging: if so, most likely to be followups, and focussed: verging on interviews orquestionnaires, rather than thinkalouds.
Diaries can also be used however for counting events or behaviour. They are then like behavioural observationby the experimenter. In this respect, they really are like thinkalouds; but a) the probes are more likely to bespecific than general b) the event is defined, so it is not open ended. However the focus is by event rather thanby task.
Questionnaires often have redundant questions to provide an internal validity / reliability check. In contrast,SSIs typically have a single topic but redundant probes.
The deep issue is behaviour vs. asking the user. One can get at most things via either method in principle, butin practice you need both despite the large area of overlap. If you ask the user you are relying on their memory,and then the issue is on the efficacy of various prompts, from none, to probes, to careful visual prompts, tohaving them view themselves on videotape or to do the task to aid recall.

Nov 2002 29
Testing episodes: Packages of instruments (level 3)In practice for any one kind of problem a package of instruments will be needed, and further examples will begiven in the next section where the types of measurement study are listed. For instance a designer may puttogether a package of think-aloud sessions, interviews, and diaries to provide feedback in the development anddebugging of a system. A product manager may want market research questionnaire and interview data, and theresults of a more formal comparative experiment on prototypes. Thus someone training to become aprofessional evaluator or contract researcher may wish to practice as many methods of the kind we haveoutlined as possible for different kinds of interface, to be in a position to offer specialist consultative advice, andcomparisons across a range of systems.
In general, the different instruments will be used in different combinations for different purposes. Eachinstrument can, moreover, be used to conduct cross checks on others.
The testing episode however involves determining many other things. In general, choices are made of whichusers, which machine(s), and which environmental factors will be used. Under the choice of user, the majorvariables include: what permanent characteristics will they have (e.g. age, gender, physical abilities), what priorknowledge of various kinds will they have, and above all which tasks will be set. (Tasks may be regarded eitheras a feature of the user, since they are a mental state, or as an independent variable since to a large extent anyuser can be set any task and will probably cooperate. However this is only an approximation, since a subject'sdecision about what to do when instructed to "produce a business letter" by an experimenter may differ bothfrom other subjects and from what they would really try to do in a real work situation.)
1. Users: On whom are the measurements made?There are indefinitely many types of user, and contexts in which a system will be used. But for practicalpurposes we must define a manageable set. One frequently used distinction is between naive users, intermittentusers and expert users. We believe that although this distinction can be helpful, it can also be somewhatsuperficial as different groups of users may have different areas of knowledge. We have found it useful toassess users' prior expertise separately in three areas: in the task domain (have they ever used anotherspreadsheet?), in the machine (have they ever used this kind of computer before? a mouse? etc.), as well as inthe particular program to be tested.
Ideally, one might also want to be able to assess asymptotic performance on a system by highly practisedexperts, and use such measures in comparative tests among different systems. In practice this is oftenexpensive or impossible.
In terms of a framework of measurement, we need to choose carefully the users on whom we will makemeasurements, as how we choose them will affect the generality of the conclusions we can draw.
2. TasksIf you are going to do on the spot observations of a user (e.g. in an experiment), then what you see will dependon what tasks they attempt. In a study at their work, users may just do whatever their work dictates. Howeverif it is a new interface for them, then there is the question of what task you set them, or what they come up withif you don't specify one. In fact these apparent alternatives can be closer than you expect: if you do not setthem a task, they may select one partly to fit in with what they imagine is appropriate to show you e.g. they maynot try out computer games or read news, even if they normally would. On the other hand, if you do give thema task through a verbal instruction, they will interpret this according to their own ideas about tasks (and this canbe rather different between subjects). For instance if you ask them to type a letter on a word processor, howmuch formatting they do will depend on their habits with word processors and what they know about letterformats. In fact it has been found that the only way to get subjects to do exactly the same thing is to dictateevery detail of the task (which is then unrealistic since normally users decide these details themselves).
If you wish to test an interface, then you have in fact two conflicting goals: to observe not only how theinterface behaves but which parts of it a user will normally and spontaneously use, and to observe how everypossible part of the interface behaves. In other words, you would like to see normal user behaviour, both asdata in itself, and to gather frequency information on which things get used often; but you would also like totest the interface artificially to check every part of it. The former implies setting no task, while the latter requiresyou to set a series of tasks that will together exercise every part. In practice you may wish to do both; perhapssetting no particular task in the first part of a session, and then producing a set of test tasks for a second part.
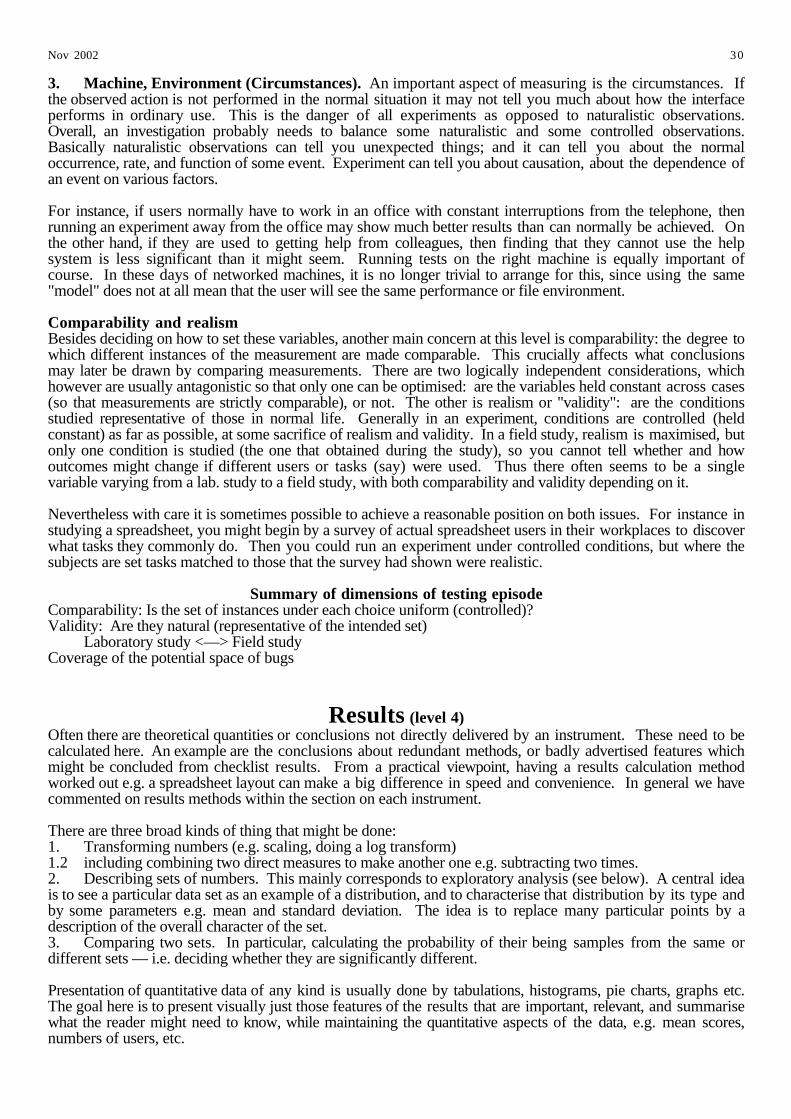
Nov 2002 30
3. Machine, Environment (Circumstances). An important aspect of measuring is the circumstances. Ifthe observed action is not performed in the normal situation it may not tell you much about how the interfaceperforms in ordinary use. This is the danger of all experiments as opposed to naturalistic observations.Overall, an investigation probably needs to balance some naturalistic and some controlled observations.Basically naturalistic observations can tell you unexpected things; and it can tell you about the normaloccurrence, rate, and function of some event. Experiment can tell you about causation, about the dependence ofan event on various factors.
For instance, if users normally have to work in an office with constant interruptions from the telephone, thenrunning an experiment away from the office may show much better results than can normally be achieved. Onthe other hand, if they are used to getting help from colleagues, then finding that they cannot use the helpsystem is less significant than it might seem. Running tests on the right machine is equally important ofcourse. In these days of networked machines, it is no longer trivial to arrange for this, since using the same"model" does not at all mean that the user will see the same performance or file environment.
Comparability and realismBesides deciding on how to set these variables, another main concern at this level is comparability: the degree towhich different instances of the measurement are made comparable. This crucially affects what conclusionsmay later be drawn by comparing measurements. There are two logically independent considerations, whichhowever are usually antagonistic so that only one can be optimised: are the variables held constant across cases(so that measurements are strictly comparable), or not. The other is realism or "validity": are the conditionsstudied representative of those in normal life. Generally in an experiment, conditions are controlled (heldconstant) as far as possible, at some sacrifice of realism and validity. In a field study, realism is maximised, butonly one condition is studied (the one that obtained during the study), so you cannot tell whether and howoutcomes might change if different users or tasks (say) were used. Thus there often seems to be a singlevariable varying from a lab. study to a field study, with both comparability and validity depending on it.
Nevertheless with care it is sometimes possible to achieve a reasonable position on both issues. For instance instudying a spreadsheet, you might begin by a survey of actual spreadsheet users in their workplaces to discoverwhat tasks they commonly do. Then you could run an experiment under controlled conditions, but where thesubjects are set tasks matched to those that the survey had shown were realistic.
Summary of dimensions of testing episodeComparability: Is the set of instances under each choice uniform (controlled)?Validity: Are they natural (representative of the intended set)
Laboratory study <—> Field studyCoverage of the potential space of bugs
Results (level 4)Often there are theoretical quantities or conclusions not directly delivered by an instrument. These need to becalculated here. An example are the conclusions about redundant methods, or badly advertised features whichmight be concluded from checklist results. From a practical viewpoint, having a results calculation methodworked out e.g. a spreadsheet layout can make a big difference in speed and convenience. In general we havecommented on results methods within the section on each instrument.
There are three broad kinds of thing that might be done:1. Transforming numbers (e.g. scaling, doing a log transform)1.2 including combining two direct measures to make another one e.g. subtracting two times.2. Describing sets of numbers. This mainly corresponds to exploratory analysis (see below). A central ideais to see a particular data set as an example of a distribution, and to characterise that distribution by its type andby some parameters e.g. mean and standard deviation. The idea is to replace many particular points by adescription of the overall character of the set.3. Comparing two sets. In particular, calculating the probability of their being samples from the same ordifferent sets — i.e. deciding whether they are significantly different.
Presentation of quantitative data of any kind is usually done by tabulations, histograms, pie charts, graphs etc.The goal here is to present visually just those features of the results that are important, relevant, and summarisewhat the reader might need to know, while maintaining the quantitative aspects of the data, e.g. mean scores,numbers of users, etc.

Nov 2002 31
Another general issue here is, where possible, to compare results from one instrument with those from another.For example, an interview can be done using the same questions as a questionnaire. If the average answers aremuch different from the two instruments, this is a reason to suspect that one or the other instrument was notwell administered (e.g. selection bias in the subject sample).
Statistical analysis of dataWhen the data are gathered they must then be presented to oneself in a form that will make the results visible,and easy to understand, easy to brood over, and easy to check any mistakes in transcription or elsewhere. See,e.g. the book by Ericson & Nosanchuk (1979) on exploratory analyses in the reference list.
The purpose of exploratory analysis is to present the data to oneself and others in such a way that itsunderlying patterns become clear. Thus imagine either observing responses by users during think aloudsessions, or collecting such responses from an interview. Imagine also that these responses have been sortedinto four categories — then a good way to get a sense of their relative frequency is in the form of a histogram.E.g.
Histogram of X1 : Category
0
1
2
3
4
5
6
7
8
9
Cou
nt
Category0 .5 1 1.5 2 2.5 3 3.5 4 4.5 5 5.5 6
Other exploratory methods similarly are designed to display patterns in tables or diagrams in such a way thatimportant pattersn become visible, emerging from the clutter of individual observations.
Then there is confirmatory statistical analysis. With instruments 3 to 6 these analyses are usually tests ofcross-tabulations, correlations, tests of differences between means for different conditions etc. (For the idea oftesting differences, see the following paragraphs, and the introductory statistics books in the reference list.).
An experiment, instrument 7, will typically be based on the testing of a hypothesis. This in turn implies thetesting of differences between outcomes, for example between an experimental condition and a controlcondition, which one would expect to be different if the experimental condition had had an effect.
Statistical methods exist for determining whether any such differences that are found are large enough to takeseriously. The convention is that if a difference between outcomes for different conditions that has aprobability of occurrence by chance of less than one in twenty (p <.05) this difference is described as"significant at the five percent level". It implies that the experimental manipulation made a difference. (See e.g.the introductory statistics books in the reference list.)
These statistical methods are called significance tests.
They can be either "parametric" or "non-parametric". The former means that they are based on estimatingparameters, such as the variance, of statistical distributions of known properties. Such tests are typically usedwhen the measurement scales have proper mathematical properties (e.g. when a score of 4 really does meantwice as much as a score of 2). These tests include t-tests and analysis of variance.

Nov 2002 32
Alternatively there is another set of methods called "non-parametric" which do not rely on the distribution ofdata having such closely defined mathematical properties. These tests typically require outcome measures to beconverted into ranks, e.g. the highest score from an experimental measurement gets rank 1, the next highest,rank 2, and so on. Such tests include the Mann-Whitney U test, the Wilcoxon test, and the Friedman test. (Seee.g. the book by Siegel, in the reference list.)
The underlying logic of most significance tests is to form a ratio or fraction, of the difference between themeans of outcomes for people in the different experimental conditions, divided by some measure of thevariation of outcome measures for people in the same experimental condition. E.g:—
mean of experimental group - mean of control group / variation of score within each group.
or, more generally:—
difference due to the experimental manipulation / estimate of measurement errors and other noise
Then there are tables or calculations that will allow one to see whether this ratio indicates that the differenceattributable to the experimental manipulation was larger than could have been expected by chance, where"chance" means because of the errors of variation among individual subjects each giving a somewhat differentestimate of the the underlying entity that you would like to know about, measurement error etc.
It is possible to do many of the calculations to make such tests by hand, with a pocket calculator or spreadsheet,using the recipes supplied in any of the statistics books listed in the references. It is by far preferable, however,to do statistical calculations using one of the several statistical packages available on either micro-computers ormainframes. For Macintosh computers we recommend StatView, for mainframes or IBM PCs SPSSx. Theformer makes use of the Macintosh interface, though you will also need a statistics book to understand the testsbeing used. The latter is the most popular mainframe package used by social and behavioral scientists, and issupported by particularly good documentation, including full and clear discussion of each statistical testavailable.
Both types of package allow one to tabulate one's data in a systematic way, and then manipulate them, performvarious kinds of test, and produce various kinds of table and graphical output.
Kinds of resultDiscuss the kinds of result we want, and produce. On the one hand, comparative measures; on the other hand,lists of bugs or goals or supertasks or complaints: i.e. things whose content is valuable, rather than whosenumber.
Summary of dimensions of result calculationComparability: may the measurements be meaningfully combined, or not?

Nov 2002 33
Producing a report (level 5)
(Goals for measurement studies)The gap between measurement and decision
The reason we have described evaluation as based on measurements, is that measurements are not themselvesjudgements about what to do, either for design, purchase, or other kinds of decision. This requires putting themeasurements into the context of a set of goals that are not themselves part of the measurement process.Measurements cannot themselves tell one what to do.
Types of reportWhen an evaluation has been made, typically a report has to be given. What kind of report might actually bewanted? One common and important need is (1) for a report which will allow the person reading it to make apurchasing decision. The situation is that the decision to purchase something has been taken, and nowinformation is needed comparing alternative products. A manager is not likely to want to be told what to do bya self-proclaimed expert. As we can see from the reports in the Consumer Association publication "Which?",even private consumers prefer a table listing numerous properties of the alternative products, allowing them todecide how to weigh the various properties for their own purposes in making some final decision. Managersare not likely to require less information and more hand-holding than this.
Similarly (2a) managers in charge of designing and producing products are likely to want to make the decisionsthemselves which combine reports on market demands and opportunities with reports on the properties andperformance of designs produced by their company. The business of those who "evaluate" designs for suchmanagers is to produce the latter kind of report, not to second-guess market research or to dictate advicedirectly. The measurements here are likely to be on a single design, using relatively fixed standards. Just asthere are benchmarks, and specifications, technical standards etc., for speed, capacity performance underdifferent conditions for hardware, we may hope that computer manufacturers will begin to take up the idea thatthe properties of interfaces can be specified in relation to users. We believe that such benchmarks will be to thebenefit of both manufacturers and consumers, in the same way that hardware specifications have been, and (2b)constitute another type of report. So learning times for new users, data on user preferences, asymptoticperformance, and data on typical user competence may gradually become available, and also be used inassessing the suitability of interfaces for a given purpose. This corresponds to a second type of purchasingdecision (3), where the decision is whether to purchase a computer system at all, and the performance of thecandidate system must be compared with the individual needs of the purchaser.
Another kind of report (4) is at a higher level of generality (closer to the questions that academic psychologistsare used to addressing). An example might be to determine whether adaptive interfaces are worthwhile. Hereagain, what is really wanted is not a report of whether one adaptive user interface is better than one non-adaptiveinterface, but the tracking down of as many differences as can be found, plus reliable results on some featuresof obvious prior interest (e.g. speed of learning or productivity), preferably on a number of interfaces ratherthan a single representative of each type. Again, what is wanted is measurement and reporting of numerousproperties. Only in the light of this will readers of the report be able to decide how to discuss what is"worthwhile" in this context.
In the area of constructing programs, there are potentially several kinds of report: pre-design requirementscapture (5), debugging an interface under construction (7), benchmark measurements on completed designs(2b), and perhaps a report on the properties of a completed design in relation to competitors' products (1), itsown properties (2a), and customer demands (8).
Pre-design requirements capture (5) can be approached in numerous ways, many of which depend more or lessclosely on users' experience of existing systems that the new design is to replace such as focus groups, fieldstudies, and surveys of command and feature usage (see 6 below). Perhaps best of all if resources permit is theuse of early prototypes, so that users can try out the new proposals and their reactions studied in think alouds,and debriefing interviews and focus groups. This latter approach avoids having to depend on users' verylimited ability to imagine what new designs would be like in practice.
Another kind of report (6) looks at how a machine is actually used (as opposed to how its designers may haveexpected it to be used). This may be for managers to establish its usefulness, or to guide revisions or even newdesigns. It might list the tasks users choose to carry out, or the comparative frequency of different tasks, undernatural conditions. A variation on this is to look at the tasks and methods chosen by users at different levels.For instance at a low level, the comparative frequency of use of menu and keyboard commands (when both areavailable) might be measured; the relative frequency of use of different commands and features; the tasks

Nov 2002 34
which people set themselves (e.g. on a word processor, letters versus memos, versus papers, versus wholebooks). And finally the "supertasks": the surrounding considerations users may have. For instance, whenthey quit an application do they usually want to save the document? do they want to back it up immediately ona separate, extra floppy disk?
Another goal (7) for measurement is to discover the bugs in a user interface. If the aim is to build a perfectinterface, then a simple detection of the bug is enough. In addition, it may be required to search out all bugs,and so to exercise the interface comprehensively by setting users tasks, even if unnatural, that will cause them touse all parts of the machine. If, as is often the case, there are only resources to fix some bugs, then such areport should also give estimates of the frequency of occurrence of the problem in normal usage, together withhow much it costs the user each time.
There is also (8) the business of determining user attitudes and values. These can sometimes be measured aspart of another study, but are worth mentioning separately as different instruments may have to be used. Thereare both positive and negative aspects to this: the utility a person feels they gain from the work or fun had witha machine, and the affective (emotional) costs in mental strain or dislike. These should be separately measured.They are ultimately seen in their effect on user choice (of whether to use a machine, or which one to purchase),but only in their net combination or sum. However a designer should know if there are aspects of the designwhich the user dislikes or finds punishing, as perhaps these can be remedied without affecting the positiveutility (which is all that keeps the user loyal currently).
Finally, (9) it would be possible to use this approach to do comparative measurements on users, either to gradeusers, to certify their level of training, or to compare the system's performance with different classes of users.
Considering the range of functions that performance measurements serve suggests that measuring, rather thanvalue judgements, is the heart of the matter; that almost always such measurements should be reported ratherfully (not used to make a judgement and then hidden); and that such measurement is a skilled activity in itsown right, that can usefully be considered as a separate subject. Putting this another way, we can say thatevaluation properly has two parts. One is measurement. The other is assessing measurements in relation togoals.
Other ways of describing alternative report typesIn the literature, different goals for measurement, and hence different report types, are described by labels suchas:
formative — to help create or modify the designsummative — describe the performance of a fixed designilluminative — identify factors that are important.
Summary of dimensions of goals (report types)Where in the design cycle is the study done? {illuminative, formative, summative?}
(How complete a prototype is needed?)Comparability: does the report's goal require comparison of measurements?