november 11, 2015 kimberly scranage › content › dam › facultysenate... · • 2015-2016...
TRANSCRIPT
Annual Enrollment Update
November 11, 2015
Kimberly Scranage Vice President for Enrollment & Degree
Management
Vickie Natale Assistant VP for Planning & Institutional
Research
Board of Regents

Overview
• Enrollment & Degree Management
• Enrollment Landscape
• Fall Census
• Successes and Opportunities
• Perceptions and Pricing
• 2015-2016 Initiatives

WHAT IS ENROLLMENT AND DEGREE MANAGEMENT?
A comprehensive process designed to assist the University achieve and maintain optimal recruitment, retention, and graduation rates of students.
Stabilize enrollments
Link academic programs and E&DM
Optimize resources
Improve services
Improve quality
Improve access to information
Reduce vulnerability to environmental forces
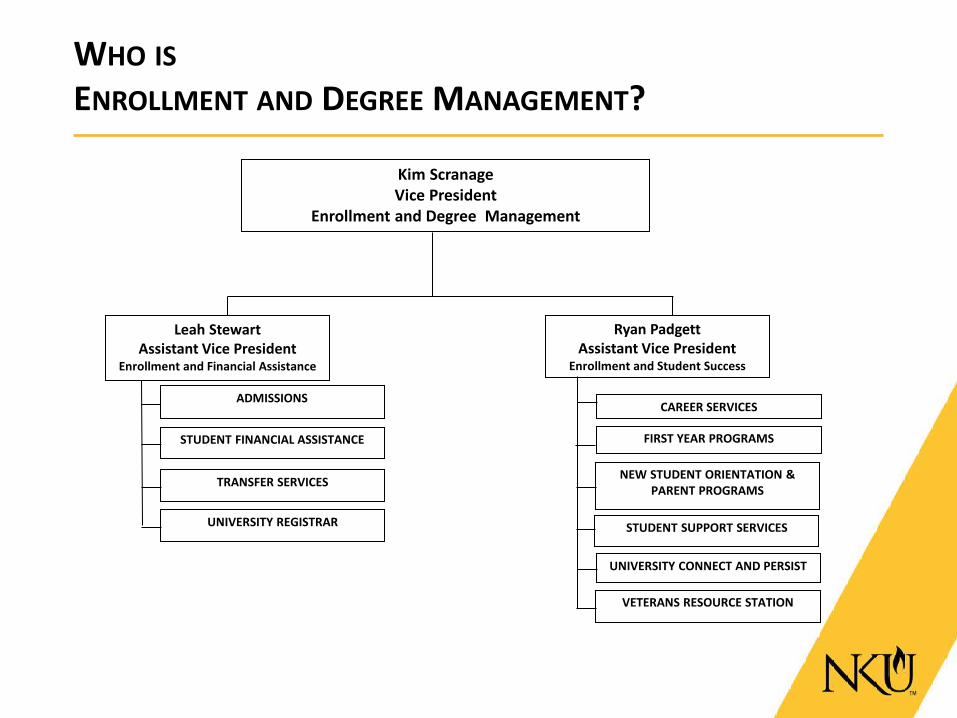
WHO IS ENROLLMENT AND DEGREE MANAGEMENT?
Kim Scranage Vice President
Enrollment and Degree Management
Leah Stewart Assistant Vice President
Enrollment and Financial Assistance
ADMISSIONS
STUDENT FINANCIAL ASSISTANCE
TRANSFER SERVICES
UNIVERSITY REGISTRAR
Ryan Padgett Assistant Vice President
Enrollment and Student Success
CAREER SERVICES
FIRST YEAR PROGRAMS
NEW STUDENT ORIENTATION & PARENT PROGRAMS
STUDENT SUPPORT SERVICES
UNIVERSITY CONNECT AND PERSIST
VETERANS RESOURCE STATION

Optimal Enrollment Formula
25%
75%
New Students + Returning Students = Enrollment (Graduation, Attrition) +

What do we know today? Enrollment down over last year
Fall 2012 Fall 2013 Fall 2014 Fall 2015
Undergraduate Total 13,344 13,166 13,110 12,806
New Freshman 2,126 2,273 2,194 2,266
New Transfers 886 799 671 664
School-Based Scholars 602 645 982 1,036
Continuing Students 9,730 9,399 9,263 8,840
Graduate 1,768 1,661 1,579 1,480
Law 548 506 425 434
Total 15,660 15,283 15,114 14720
-2.4% -1.1% -2.6%
What do we know today? Enrollment down over last year
Fall 2012 Fall 2013 Fall 2014 Fall 2015Undergraduate Total 13,344 13,116 13,110 12,806
New Freshman 2,126 2,273 2,194 2,266New Transfers 886 799 671 664School-Based Scholars 602 645 982 1,036Continuing Students 9,730 9,399 9,263 8,840
Graduate (w/DNP) 1,768 1,661 1,579 1,480 Law 548 506 425 434Total 15,660 15,283 15,114 14,720
-2.4% -1.1% -2.6%

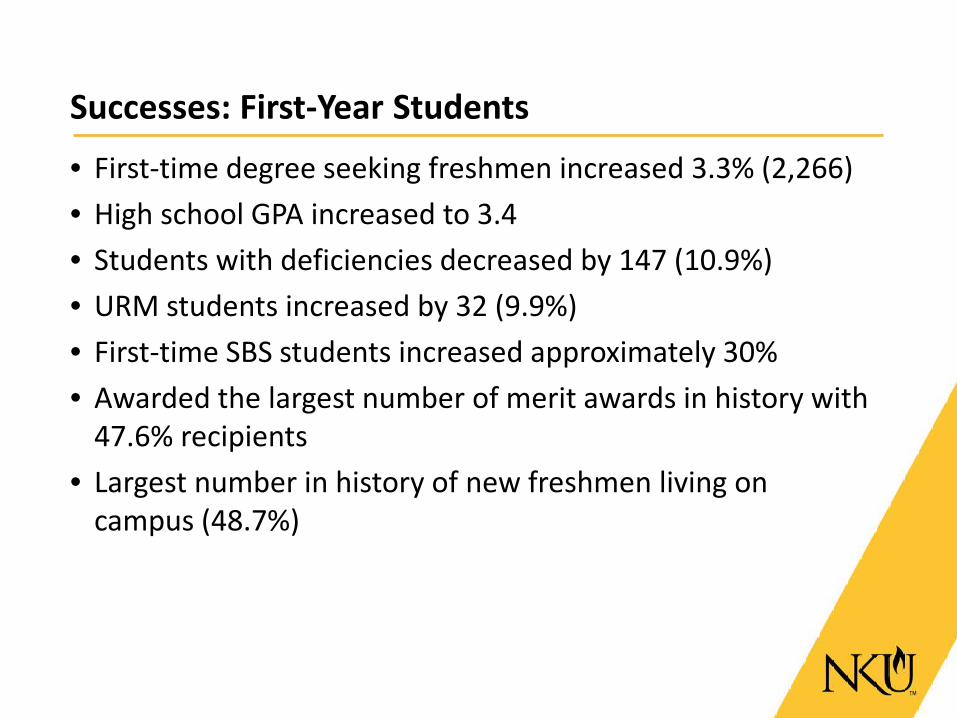
Successes: First-Year Students
• First-time degree seeking freshmen increased 3.3% (2,266) • High school GPA increased to 3.4 • Students with deficiencies decreased by 147 (10.9%) • URM students increased by 32 (9.9%) • First-time SBS students increased approximately 30% • Awarded the largest number of merit awards in history with
47.6% recipients • Largest number in history of new freshmen living on
campus (48.7%)
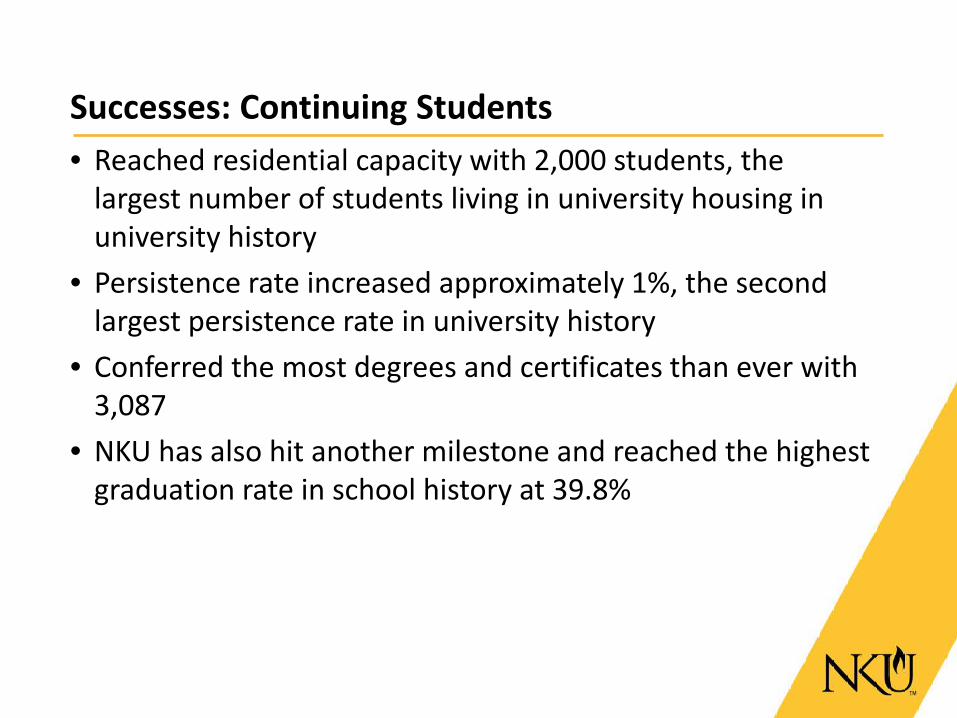
Successes: Continuing Students • Reached residential capacity with 2,000 students, the
largest number of students living in university housing in university history
• Persistence rate increased approximately 1%, the second largest persistence rate in university history
• Conferred the most degrees and certificates than ever with 3,087
• NKU has also hit another milestone and reached the highest graduation rate in school history at 39.8%

Continued Opportunities https://www.polleverywhere.com/free_text_polls/XRS9BoT6FoKjBMa
Please Text 22333 with NORSE You will Receive an auto response that you have joined the poll Answer the poll question with 1 -2 words.

Opportunities • Approximately 63% of SBS participants enroll at a post-secondary
institution other than NKU one year after high school graduation • Expand KY market in counties outside of the CPE geographic area of
responsibility • Fall-to-fall retention rates remain flat for the bachelor’s cohort • Explore additional opportunities for expanded development for
residential options • Increase transfer enrollment through programs such as
Gateway2NKU and CState2NKU • Reach national six-year graduation rate • Overall graduate enrollment decreased by 99 students from fall 2014
to fall 2015 but new graduate students experienced a modest increase of 10 students
• Sustained growth for continuation rates and degrees conferred

Art and Science Group Pricing and Positioning Study • Study focused on identifying market perceptions and how to
strengthen the competitive position of NKU, as well as sensitivities to price and financial aid with prospective undergraduate students
• Four phases of work: • Strategic assessment • Market research with inquirers and admitted applicants • Financial aid modeling • Recommendations
• Interviewed campus constituents, surveyed students, and continue to work with an institutional committee with finance, enrollment, institutional research, marketing and communications and faculty representatives

Art & Science Group’s Next Steps • Over the next few weeks we will further discuss with NKU
the implications of these findings as well as our recommendations for NKU moving forward
• These recommendations will be focused on: • Strategies for supporting and reinforcing this positioning
through recruitment and communication efforts • Further analysis of potential net revenue effects arising
from pricing and positioning options • Institutional strategies designed to improve the
University’s overall competitive appeal

Higher education marketing firm focused on “full funnel” communications for enrollment offices Current NKU Projects: • Senior and Junior Search: focused, variable campaign
designed to target “likely to apply” students; has social media integration as well as branded communications.
• Yield campaign: strategic yield campaign designed to push deposit submissions in spring.
• Graduate campaign: multiple graduate marketing initiatives for both internal and external audiences.
• Transfer campaign: integrated transfer student campaign.

NKU Summer Bridge • Specifically targeting first-generation students and students
with a high school GPA between a 2.5 – 3.5 (i.e., “murky middle”)
• Two Concurrent tracks that include a full-day residential or half-day commuter component
• An inclusive five-week summer bridge program that offers incoming students the opportunity to (a) demonstrate math competency and/or (b) complete three credit hours in a general education course
• In addition to completing college-level coursework, students will be introduced to vetted non-cognitive skills associated with student success, including academic efficacy, time management, financial literacy, and resiliency

EAB Student Success Collaborative • The Student Success Collaborative platform will use predictive
analytics to help departments leverage real-time data, streamline direct support to students, and improve key performance indicators by delivering:
• Comprehensive student risk data • A platform for proactive outreach and interventions • A streamlined campus-wide case management system • Central reporting and evaluation functions
• Specifically, the platform will assist NKU by: • Identifying bottleneck courses within the curriculum
pipeline • Identifying a curriculum pipeline that assists students on a
timely and successful progression towards graduation • Predicting student risk and retention patterns
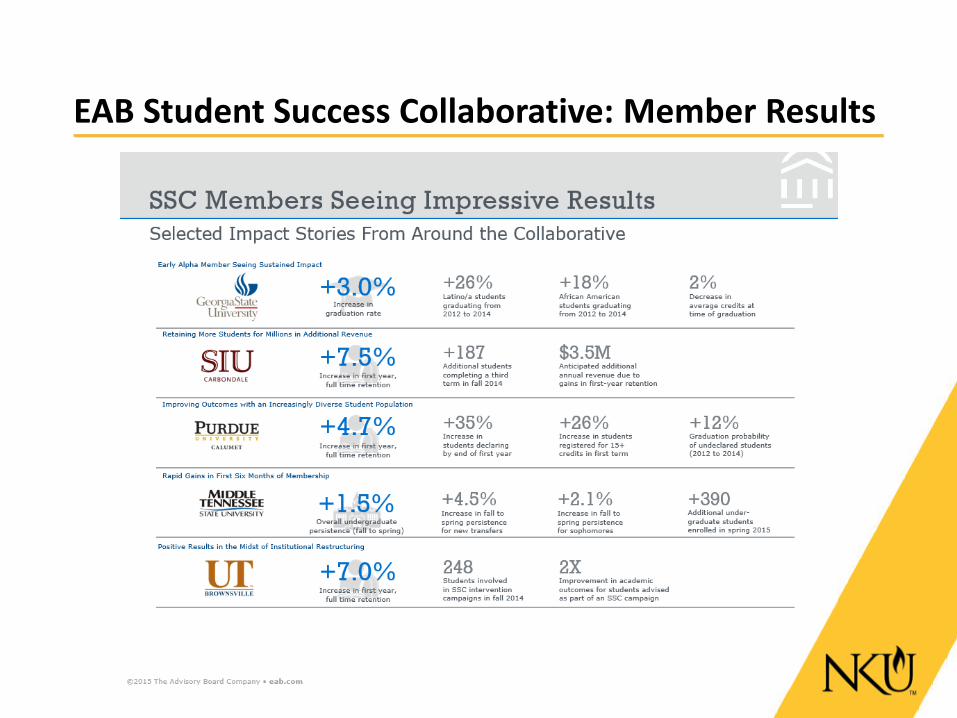
EAB Student Success Collaborative: Member Results
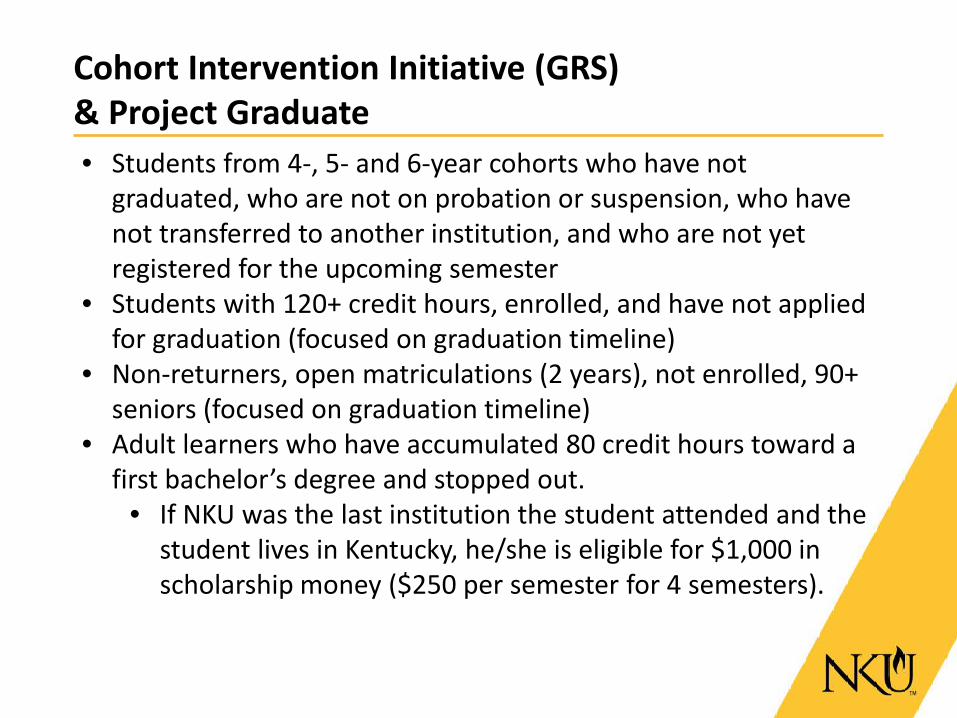
Cohort Intervention Initiative (GRS) & Project Graduate • Students from 4-, 5- and 6-year cohorts who have not
graduated, who are not on probation or suspension, who have not transferred to another institution, and who are not yet registered for the upcoming semester
• Students with 120+ credit hours, enrolled, and have not applied for graduation (focused on graduation timeline)
• Non-returners, open matriculations (2 years), not enrolled, 90+ seniors (focused on graduation timeline)
• Adult learners who have accumulated 80 credit hours toward a first bachelor’s degree and stopped out.
• If NKU was the last institution the student attended and the student lives in Kentucky, he/she is eligible for $1,000 in scholarship money ($250 per semester for 4 semesters).

Summary
• Realigning ourselves to meet the needs of our students throughout their academic career
• Utilizing a data-centered approach to meeting enrollment goals
• Celebrating our successes while addressing our continued opportunities
• Forecasting our enrollment competitive appeal; and
• Implementing best practice strategies along the life-cycle of the student
(Graduation/Attrition) + New Students + Returning Students = Enrollment


THANK YOU!