now you're competing': how historically-black colleges
TRANSCRIPT
RESEARCH ARTICLE Open Access
"Now you're competing": how historically-Black colleges and universities compete(and don't) on the InternetZachary W. Taylor
Correspondence: [email protected] of EducationalLeadership and Policy, TheUniversity of Texas at Austin,College of Education, 1912Speedway, Stop D5000, Austin, TX78712, USA
Abstract: No extant research has examined the web presence, web popularity, andpaid adword tactics of historically-Black colleges and universities (HBCUs) comparedto similar institutions. This study explores these measures and evaluates how HBCUweb presence, web popularity, and paid search tactics compare to similar institutionsto learn whether HBCUs are competing in one of the most competitive globalhigher education markets: the Internet. Findings suggest HBCU websites are smallerand less popular, and HBCUs spend less on web advertising than non-HBCU peers.Additionally, non-HBCUs are 3.8 times more likely to purchase desktop adwords and4.3 times more likely to purchase mobile adwords than HBCUs. HBCUs need toharness the power of this global market to compete in a globalized, twenty-firstcentury higher education market. If not, the financial situations between HBCUscould exacerbate, potentially threatening the livelihood of some of the mostsuccessful and time-honored institutions in the United States.
Keywords: Historically-black colleges and universities, Internet, Web presence, Webpopularity, Adwords, Paid search
IntroductionAlthough historically-Black colleges and universities (HBCUs) comprise only 3% of all
institutions of higher education in the United States (U.S.), over 20% of all African-
American postsecondary students receive their degree from an HBCU. Beyond degree
attainment, 40% of African-Americans in U.S. Congress, 50% of African-American law-
yers in the U.S., and 80% of African-American U.S. judges graduated from an HBCU
(Camera 2017), speaking to the value of an HBCU credential. Overall student enroll-
ment at HBCUs has risen over the past four decades, as roughly 230,000 students
attended an HBCU in 1980 compared to 293,000 students in 2015, yet the
postsecondary-going population has doubled in the U.S., with HBCUs growing at a
much slower rate than many other U.S. colleges and universities (Anderson 2017).
Beyond 2015, African-American student interest and enrollment in HBCUs has been
both high and low for these institutions across the U.S. Hampton University, Dillard
University, and other highly-ranked HBCUs have reported significant increases in
African-American and overall student enrollment in recent years, with Alcorn State
University reporting a 6% increase in 2016, representing the largest enrollment in-
crease in Alcorn State’s history (The Journal of Blacks in Higher Education 2016).
© The Author(s). 2018 Open Access This article is distributed under the terms of the Creative Commons Attribution 4.0 InternationalLicense (http://creativecommons.org/licenses/by/4.0/), which permits unrestricted use, distribution, and reproduction in any medium,provided you give appropriate credit to the original author(s) and the source, provide a link to the Creative Commons license, andindicate if changes were made.
Taylor International Journal of Educational Technology in Higher Education (2018) 15:28 https://doi.org/10.1186/s41239-018-0111-4
However, many HBCUs have faced unprecedented struggles in recent years. In May
2017, Cheyney University—the United States’ oldest HBCU—released a report detailing
its problems retaining high-quality leadership, as frequent turnover of executive leader-
ship at Cheyney has proven costly both in terms of finances and long-term planning
for increased student enrollment (Savage 2017). This problem has not been unique to
Cheyney, as HBCU presidents stay at their institution an average of three years,
whereas the presidents at predominantly-White institutions (PWIs) stay an average of
seven years, emphasizing the difficulty of long-term planning for increased student en-
rollment at HBCUs (Morris 2016). As a result, HBCUs such as Hampton, Dillard, and
Alcorn State have grown, while Morris Brown College witnessed a sharp drop in stu-
dent enrollment from 2700 students in 2003 to forty students in 2017 (Medina and
Allen 2017). University of Pennsylvania Professor Marybeth Gasman, a noted scholar of
HBCUs, best summarized this dual existence of modern HBCUs:
There are some [HBCUs] that are quite strong, and have good enrollment, and then
there are some that are sort of in the middle, that have to really ramp up their
fundraising, and make sure their students graduate. And then there are some— probably
about 15 of them — that are having a really difficult time. (Jacobs 2015, para. 8).
Outgoing President of the Thurgood Marshall College Fund Johnny C. Taylor Jr. elabo-
rated on Gasman’s assertion, noting the low enrollment of African-Americans at HBCUs
as a reason for HBCUs to increase their competitive nature: “When you used to have a
captive audience, you were guaranteed that your seats were going to be filled… Now
you’re competing… The market shifted, and you are economically challenged” (Hong
2017, para. 11). This competitive postsecondary market has resulted in only 9% of
African-American postsecondary students attending an HBCU in 2016, while 91% of
African-American postsecondary students attended other types of postsecondary institu-
tions (Anderson 2017), with nearly 25% enrolled in predatory, for-profit colleges and uni-
versities (Deming et al. 2013). As a result, many HBCU leaders and scholars have called
for HBCUs to increase their competitiveness to ensure the survival of the 100 HBCUs
across the U.S., including expanding course offering, partnering with other educational or-
ganizations, (Collins 2015), increasing affordability and loan transparency for students and
borrowers (Worf 2015), and amplifying efforts to recruit outstanding students and faculty
members to elevate the rankings of HBCUs (America 2012). However, as HBCUs have en-
deavored to become more competitive in certain contexts, these institutions may be ignor-
ing a critical method of twenty-first-century competition: competing on the Internet.
The Internet is now the most popular source of pre-college information for pro-
spective students and their support networks (Burdett 2013; Daun-Barnett and Das 2013),
with over 80% of U.S. households including at least one person of pre-college or college-
going age (ages 15–24) having paid Internet subscriptions. In addition, younger U.S.
households are more likely to have high-speed Internet access and multiple computers
and smartphones than older U.S. households (Ryan and Lewis 2017), speaking to the
popularity of the Internet with young people, many of whom are prospective postsecond-
ary students. African-American use of the Internet is nearly ubiquitous across age demo-
graphics, as 85% of all African-Americans regularly use the Internet to connect with each
other, gather information, and conduct their day-to-day lives (Pew Research Center 2017).
Taylor International Journal of Educational Technology in Higher Education (2018) 15:28 Page 2 of 15
For over twenty years, institutions of higher education have published institutional
websites to recruit students, share programmatic offerings, and disseminate institu-
tional materials of many types (Hickey 2014). As Internet technologies have advanced
in recent years, these institutions have accessed big data sources to drive strategic
Internet marketing initiatives (Selingo 2017). In addition to a web presence and big data
analysis, institutions of higher education often engage in paid search tactics to drive
traffic to their institutional website. For instance, Harvard University regularly pur-
chases thousands of paid adwords per month between August and December to drive
traffic to their website during application season (SEMrush 2017). For as influential
and ubiquitous as the Internet is, no extant research has examined how HBCUs lever-
age the power of the Internet to increase their web presence and web popularity—and
thus, prospective student interest—in their institution, potentially resulting in increased
enrollment, revenue, and appeal to attract high-quality educational leaders. In short,
this study’s two main objectives are as follows:
1.) How does HBCU web presence and popularity compare with institutions of similar
sector, size (measured by total student enrollment), admission rate, and yield?
2.) Do HBCUs employ paid adword tactics to increase their web traffic toward their
institutional web domain? If so, how do these paid adword strategies compare with
institutions of similar sector, size, admission rate, and yield?
Answering these questions will inform researchers and marketing professionals work-
ing in HBCUs to better understand how HBCUs currently compete for web presence
and popularity against other institutions on the Internet. Moreover, these questions will
inform how HBCUs could increase their web presence and popularity, thus increasing
their competitiveness and other educational stakeholders’ interest in their institution.
Literature reviewAlthough institutions of higher education have had a presence on the Internet for over
twenty years (Hickey 2014), the researching of web presence, popularity, and paid
adword tactics is a new and emerging field of inquiry in higher education. As the aims
of this paper are to articulate how HBCU web presence, popularity, and paid adword
tactics compare to similar institutions, it is important to review the literature—albeit
limited—regarding both institutional use of web analytics and paid search tactics to
drive web traffic toward their institutional .edu domain. Reviewing these sets of litera-
ture will provide an understanding of how institutions of higher education compete on
the web, informing the practices of HBCUs in their quest to increase student enroll-
ment and publicity.
How institutions of higher education use web analytics
For years, institutions of higher education across the U.S. have used big data sources to
drive the strategic recruitment and enrollment of students. In 2007, Saint Louis Univer-
sity, facing a projected 33% drop in student enrollment by 2028, began a strategic mar-
keting initiative to target prospective students through College Board and American
College Testing (ACT) databases, choosing to purchase the names of prospective
Taylor International Journal of Educational Technology in Higher Education (2018) 15:28 Page 3 of 15
students whose measurables were similar the previous year’s incoming cohort. By 2016,
Saint Louis University had enrolled five of the six largest freshman classes in the uni-
versity’s history while increasing their four-year graduation rate from 62% in 2010 to
71% in 2016 (Selingo 2017). Over the course of a decade, Georgia State University used
big data sources and analytics to cut their dropout rates by 32% (Svrluga 2017). The
University of Maryland at College Park’s data analytics initiative was so successful in
retaining students that the institution formed a separate consulting company, Helio-
Campus, that now provides data analytics services to institutions of higher education
across the U.S. (Cortez 2017).
Coupled with big data, institutions of higher education use a variety of web analytics
services to identify their web audience and craft web material to cater to their needs.
Many institutions use the free version of Google Analytics to examine the traffic
on their institutional .edu webpages, adding or altering content to make
frequently-visited pages more informative and less-visited pages more attractive
(Quacquarelli Symonds Limited 2017). However, some institutions of higher educa-
tion have used the paid Google Analytics Premium to improve the user experience
of their institutional .edu webpages, such as Arizona State University. Arizona State
University used this service to analyze who was visiting their website and when,
learning why visitors were leaving the website, why visitors were not performing a
desired action on a webpage (such as completing an application), and why more
alumni weren’t donating more money (Stein 2015). Over fifty institutions of higher
education across sectors—such as Syracuse University, the University of Pittsburgh,
and Colby College—have used Capture Higher Ed, a big data and web analytics
company that has tracked 20 million unique web visitors on their clients’ sites, gleaning
such information as what webpages prospective students visited, how long hey visited,
how often they visited, and what the students did before and after visiting the institution’s
website (Selingo 2017). Through premium data analytics services and the strategic analysis
of organic keywords—search words employed by users to find content on the Internet—
organizations of many types have been able to improve the content and volume of their
website by aligning their content with organic keyword searches and paying for adwords
to drive web traffic toward their domain, also known as search engine optimization (SEO)
(Clifton 2012; Ledford 2015; Wallace 2016).
The scholarly research regarding postsecondary use of web analytics to drive in-
stitutional website traffic has primarily focused on measuring the effectiveness of
institutional libraries. Fang (2007) used Google Analytics to improve Rutgers Uni-
versity’s Law Library website by tracking visitor behavior and then reorganizing
and reformatting the main menu to prioritize the most popular webpages near the
top of the menu. Texas Tech University’s librarians developed an online reference
tool for their institution’s library and then used Google Analytics to refine the tool
and integrate its elements into other areas of the website to increase its effective-
ness (Barba et al. 2013). Similarly, librarians at Boise State University used Google
Analytics to decrease their bounce rate—or the percentage of visitors who leave a website
after visiting only one page—from 65% in 2012 to 4.5% in 2014 (Vecchione et al. 2016).
However, no scholarly research examines how institutions of higher education use
web analytics—particularly paid search tactics—to drive web traffic toward their in-
stitutional website.
Taylor International Journal of Educational Technology in Higher Education (2018) 15:28 Page 4 of 15
How institutions use paid search tactics to drive web traffic
New data mining services, such as SEMrush, have allowed web developers to better
understand why people visit their website and what they can do to make their visitors’
experience more engaging. SEMrush uses Google Analytics data to allow users to see
which organic and paid keywords are most likely to drive web traffic toward a given
website, while also learning how competitors are using paid adwords to drive traffic to-
ward their website. SEMrush can also calculate the overall size and popularity of a web-
site by counting all webpages linked to a certain website and the number of backlinks,
or links from other websites that refer visitors to the web resource (SEMrush 2018a).
For instance (current as of January 2018), www.ucla.edu, the main website for the Uni-
versity of California at Los Angeles (UCLA), featured 28,256 webpages on their website,
while there existed 9.6 million backlinks on other websites that referred the user to
www.ucla.edu or a webpage on that website. Comparatively, www.uci.edu, the main
website for the University of California at Irvine (UC Irvine), featured 11,633 webpages
on their website, while there existed 7 million backlinks to that website, rendering
UCLA’s website both larger and more popular on the Internet (SEMrush 2018b).
Regarding paid search, many institutions of higher education have employed paid
adword search tactics during application season to drive web traffic toward their insti-
tutional .edu domain. A paid adword is the method in which an organization can com-
pose an online advertisement and pay for search keywords that direct Internet users
toward that advertisement on an organization’s website by moving the search result of
that keyword closer to the top of the search results page (Google, Inc. 2018). For instance
(current as of January 2018), the University of Florida (UF) paid for the Google adword
“forensic” to drive traffic toward their Forensic Science website at https://forensicscience.
ufl.edu/. As a result, when Internet users would search for the word “forensic,” UF’s Fo-
rensic Science website would be displayed higher on the Google search results page than
it otherwise would be if UF did not pay for “forensic” (SEMrush 2018b).
A cursory evaluation of institutional websites during undergraduate application sea-
son (September to December) demonstrated that institutions of higher education paid
for adwords specifically to drive traffic to their website during application season. For
example, from September 2017 to December 2017, Harvard University steadily in-
creased their paid adword search monthly, as Harvard paid for 15,300 keywords in Sep-
tember, 22,500 keywords in October, 24,000 keywords in November, and 24,000
keywords in December 2017 to boost their web traffic via Google’s paid search results.
Although Harvard’s marketing budget was likely larger than the average HBCU’s mar-
keting budget, Harvard’s paid search tactic resulted in between 31,000 and 33,000 more
visits each month to Harvard’s website (SEMrush 2017), with many of these visits likely
coming from prospective students during application season. Other elite, non-Ivy
League institutions performed the same paid search tactic, as the University of Texas at
Austin (39% acceptance rate; National Center for Education Statistics 2017) paid for
1600 keywords in September; 4600 in October; 5400 in November; and 5400 in Decem-
ber 2017 as a way to drive web traffic toward their institutional .edu domain during
application season (SEMrush 2017). Wellesley College (28% acceptance rate; National
Center for Education Statistics 2017) did the same, albeit on a smaller scale, as Welles-
ley paid for 55 keywords in September, 286 in October, 329 in November, and 329 in
December 2017 (SEMrush 2017).
Taylor International Journal of Educational Technology in Higher Education (2018) 15:28 Page 5 of 15

However, no extant research has examined these paid adword tactics, nor has extant
research compared HBCU web presence and popularity to similar institutions. There-
fore, the purpose of this study is to explore HBCU web presence and popularity, com-
pare that presence and popularity to similar institutions, and evaluate how HBCU paid
search tactics compare to similar institutions to learn whether HBCUs are competing
in one of the most competitive global higher education markets: the Internet.
MethodsThe following sections will detail how data were collected and analyzed from multiple
databases, as well as how this study is limited and how future research can further ex-
plore the phenomenon of web presence, popularity, and paid adword search tactics.
Data collection and analysis
All HBCU institutional data was gathered from the Integrated Postsecondary Education
Data System (IPEDS; National Center for Education Statistics 2017), current as of the
2016–2017 academic year. This search included 39 public, four-year institutions, 50
private, non-profit four-year institutions, 10 public two-year institutions, and 1 private
non-profit two-year institution (100 HBCUs in total). As a proxy for institution size
and prospective student interest, the following variables were collected: sector, total
undergraduate enrollment, undergraduate applications, undergraduates admitted, and
undergraduates enrolled. After these variables were collected, admission rate and yield
were calculated to provide a metric of student interest in each HBCU, following the
logic that prospective students show interest in an institution of higher education by
applying to that institution and enrolling in that institution.
To generate a database of institutions comparable to HBCUs, institutional data was
gathered from IPEDS using the following search: institutions in the U.S. only, public
and private non-profit four-year institutions and public and private two-year institu-
tions. The same variables were then collected as were for the HBCUs: sector, total
undergraduate enrollment, undergraduate applications, undergraduates admitted, and
undergraduates enrolled. From this database, admission rate and yield were calculated,
and then the database was sorted by sector, admission rate, yield, and total enrollment.
Excel’s index matching function was used to pair each HBCU with a comparable insti-
tution, first in terms of sector, then total enrollment, then admission rate, and then
yield. All HBCUs were paired with an identical institution in terms of sector and ad-
mission rate. Standard deviation between HBCUs and the comparable institution in
terms of total undergraduate enrollment and yield was 601 students and 16% respect-
ively. There was no HBCU that identically matched their peer institution in terms of
sector, enrollment, admission rate, and yield.
Once these two datasets were generated, each institution’s .edu web domain was investi-
gated by SEMrush, examining the following variables associated with web presence, popu-
larity, and paid adwords: backlinks, keywords, web traffic, cost of web traffic, total
number of webpages, paid desktop adwords, desktop traffic gain from paid adwords, desk-
top paid adwords cost, paid mobile adwords, mobile traffic gain from paid adwords, and
mobile paid adwords cost. Both desktop and mobile paid adword data were gathered as
92% of people ages 18–29—the approximate age category for the majority of
Taylor International Journal of Educational Technology in Higher Education (2018) 15:28 Page 6 of 15

postsecondary students—regularly use the Internet on their smartphones every day, the
highest percentage across any age demographic in the U.S. (Pew Research Center 2017).
Furthermore, extant research has suggested that mobile advertising is effective among
college-aged (18–24) people (Hanley and Becker 2008; Saran et al. 2015; Unni and Har-
mon 2007).
Descriptive statistics were generated by sorting each dataset—the HBCU set and the
set of comparable peer institutions—by sector and then finding absolute distances be-
tween each variable of each HBCU and their peer institution. Means and standard devi-
ations for all HBCUs by sector—and all peer institutions by sector—was calculated per
variable and then displayed in Tables 1, 2, 3 to demonstrate the differences between
HBCUs and comparable peer institutions.
FindingsA comparison of HBCU to peer institution by web presence and popularity can be
found in Table 1 below.
Regarding public, four-year institutions, data in this study suggest that HBCU web-
sites are much smaller, much less popular, and spend less on web hosting than non-
HBCU peers. Public, four-year non-HBCUs are 61% more popular on the Internet than
their HBCU peers measured by backlinks, while non-HBCUs have 35% more organic
keywords leading Internet users to their institutional domains and experience over
three times as much web traffic as their HBCU peers. Public, four-year non-HBCUs
also spend nearly twice as much on web hosting and are over three times as large as
HBCU peers as measured by webpages on their institutional domain. Inversely, private
four-year HBCUs are nearly four times as popular on the Internet as their non-HBCU
peers; however, Paul Quinn College (PQC) was mentioned as an outlier in this study,
as PQC has over 20 million backlinks. PCQ’s outlier status was likely owed to its
unique history, mission, and location as the oldest HBCU west of the Mississippi River
and the first “urban work college” in the United States situated in the Dallas-Fort
Worth metropolis of nearly 7 million residents (Young 2018, para. 3). Beyond back-
links, private, four-year non-HBCUs were four times as popular than HBCUs by or-
ganic keywords and twice as popular by web traffic, while non-HBCUs also spent
slightly more on web advertising and were over five times as large as measured by web-
pages on their institutional domain.
Additionally, data in this study suggest public two-year HBCUs and non-HBCUs
were much more comparable in terms of web presence and popularity. HBCUs were
slightly more popular than non-HBCUs measured by backlinks, organic keywords, and
web traffic. However, HBCUs outspent non-HBCUs by an average of $200,000 per year
on web advertising, although non-HBCU websites were larger by an average of 1958.
This finding indicates that public two-year HBCUs feature fewer webpages on their in-
stitutional websites than their non-HBCU peers, but these webpages are more popular
and cost the institution more in terms of web advertising.
Finally, Shorter College, the only private, two-year HBCU in this study, is smaller and
less popular than its non-HBCU peer, Louisburg College, measured by backlinks, or-
ganic keywords, web traffic, web advertising, and webpages.
A comparison of HBCU to peer institution by desktop paid adwords can be found in
Table 2 below.
Taylor International Journal of Educational Technology in Higher Education (2018) 15:28 Page 7 of 15

Across all sectors, data in this study suggest non-HBCUs employ desktop paid
adword tactics more frequently than HBCUs. Public, four-year non-HBCUs were three
times as likely to use desktop paid adwords, while the gap was notably larger between
private four-year institutions: 32 private four-year non-HBCUs used desktop paid
adwords in 2017 compared to 3 HBCUs. The number of public two-year institutions
using desktop paid adwords was the same, and neither private two-year institution in
this study employed desktop paid adwords in 2017.
Likewise, across all sectors, non-HBCUs paid for more desktop adwords and experi-
enced more web traffic than non-HBCUs. Four-year non-HBCUs outspent HBCUs, yet
public two-year HBCUs outspent non-HBCUs by 57%, although this tactic did not re-
sult in a comparable gain in web traffic. Here, data in this study indicate public two-
year HBCUs paid much more per desktop adword than their non-HBCU peer, yet this
paid tactic did not translate to comparable gains in web traffic. Data in this study was
Table 1 Comparison of HBCUs to comparable institutions by web presence and popularity,current as of January 2018
Web presence and popularity metrics:(backlinks, keywords, traffic, cost, size)
HBCU metrics Peer(s) metrics
Public, 4-year (n = 39)
Mean (standard deviation)
Backlinks 97,269 (203,057) 158,847 (248,274)
Organic keywords 23,425 (17,790) 67,316 (71,034)
Web traffic (in hits, yearly) 793,200 (511,164) 2,580,000 (2,040,684)
Web cost (in dollars, yearly) $147,323 ($116,651) $240,917 ($242,576)
Web size (by webpages) 2467 (1729) 8424 (8264)
Private, 4-year (n = 50)
Mean (standard deviation)
Backlinksa 474,760 (2,869,910) 120,668 (202,258)
Organic keywords 8924 (14,602) 38,290 (56,022)
Web traffic (in hits, yearly) 326,376 (505,263) 742,241 (773,352)
Web cost (in dollars, yearly) $130,186 ($198,346) $142,182 ($161,768)
Web size (by webpages) 951 (1387) 4948 (6356)
Public, 2-year (n = 10)
Mean (standard deviation)
Backlinks 15,400 (23,234) 11,961 (10,668)
Organic keywords 19,030 (33,498) 14,276 (15,117)
Web traffic (in hits, yearly) 678,360 (1,375,997) 468,480 (420,269)
Web cost (in dollars, yearly) $326,710 ($630,178) $126,730 ($134,110)
Web size (by webpages) 1419 (2407) 1958 (2398)
Private, 2-year (n = 1)b
Backlinks 220 4400
Organic keywords 200 4100
Web traffic (in hits, yearly) 16,800 115,200
Web cost (in dollars, yearly) $7900 $50,300
Web size (by webpages) 25 676aNote: Paul Quinn College was an outlier in this study in terms of backlinks with 20,200,000, nearly ten times as many asthe #2 institution, Wiley College, with 2,600,000 backlinksbNote: Shorter College (HBCU) and Louisburg College were the only two private two-year institutions in this study
Taylor International Journal of Educational Technology in Higher Education (2018) 15:28 Page 8 of 15

influenced by two public, four-year HBCU outliers, the University of the District of
Columbia (UDC) and Delaware State University (DSU). The phenomenon exemplified
by UDC and DSU—namely the concerted effort to engage with paid adwords tactics,
while similar institutions did not—will be addressed in the Implications section of this
study.
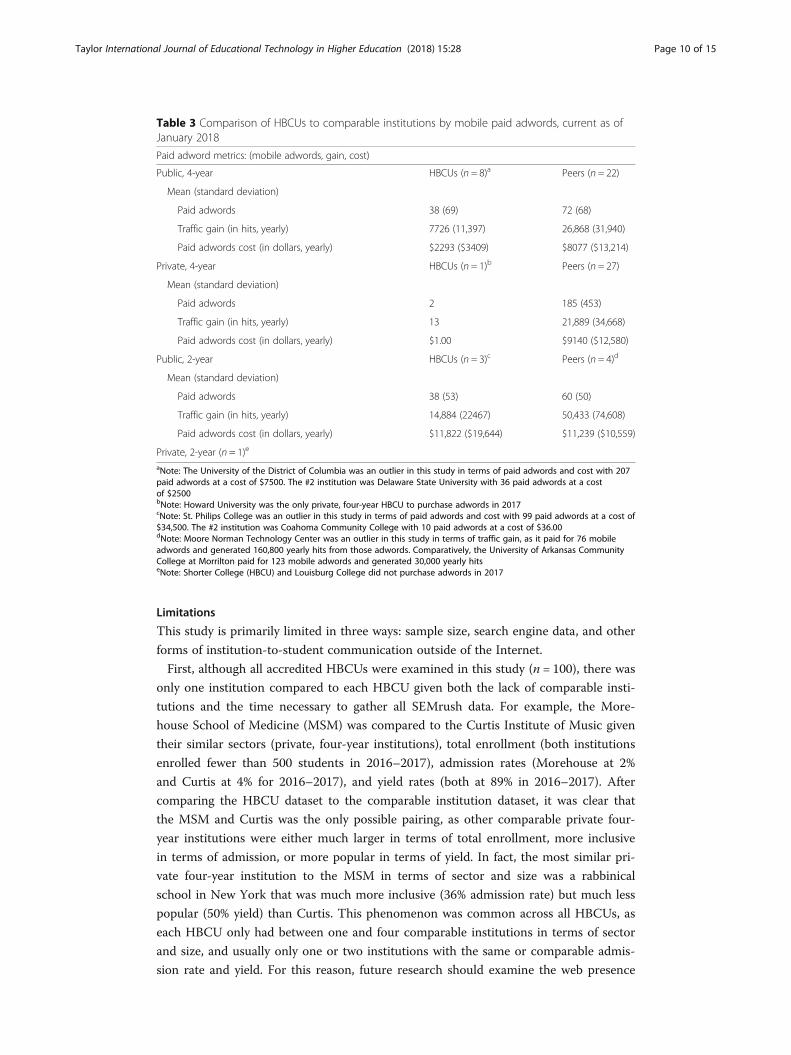
A comparison of HBCU to peer institution by mobile paid adwords can be found in
Table 3 below.
Akin to desktop paid adwords, more non-HBCUs paid for mobile adwords than
HBCUs in 2017. Across 200 institutions in this study, only 12 HBCUs paid for mobile
adwords, while 53 non-HBCUs paid for mobile adwords. Particularly notable was the
finding that 27 private four-year non-HBCUs paid for mobile adwords, whereas How-
ard University was the only private, four-year HBCU to do so. Similarly, non-HBCUs
across all sectors paid for more mobile adwords, experienced more mobile web traffic,
and paid more for mobile adwords.
Public, two-year institutions were more comparable, as 3 HBCUs and 4 non-HBCUs
paid for mobile adwords, yet non-HBCUs experienced much more traffic while paying
roughly the same amount. This finding indicates non-HBCUs paid for mobile adwords
that better directed mobile web traffic to their institutional domain than their HBCU
peers. St. Philip’s College was an outlier in this study, as this HBCU paid for 99 mobile
adwords at $34,500 in 2017 compared to Coahoma Community College, another
HBCU, that paid for 10 mobile adwords at $36.00. This discrepancy was likely due to
the postsecondary competition that St. Philip’s College encounters, as its campus is lo-
cated in San Antonio, Texas, whereas Coahoma Community College is located in
Clarksdale, Mississippi without another institution of higher education in its county.
Table 2 Comparison of HBCUs to comparable institutions by desktop paid adwords, current as ofJanuary 2018
Paid adword metrics: (desktop adwords, gain, cost)
Public, 4-year HBCUs (n = 10)a Peers (n = 29)
Mean (standard deviation)
Paid adwords 55 (221) 270 (465)
Traffic gain (in hits, yearly) 4373 (21,183) 17,976 (25,316)
Paid adwords cost (in dollars, yearly) $1884 ($7930) $5772 ($10,473)
Private, 4-year HBCUs (n = 3) Peers (n = 32)
Mean (standard deviation)
Paid adwords 55 (53) 445 (1645)
Traffic gain (in hits, yearly) 4712 (6021) 11,952 (35,988)
Paid adwords cost (in dollars, yearly) $1594 ($2690) $3991 ($10,542)
Public, 2-year HBCUs (n = 4) Peers (n = 4)
Mean (standard deviation)
Paid adwords 37 (65) 199 (213)
Traffic gain (in hits, yearly) 13,179 (23,303) 13,212 (19,458)
Paid adwords cost (in dollars, yearly) $6389 ($11,073) $3631 ($4027)
Private, 2-year (n = 1)b
aNote: The University of the District of Columbia and Delaware State University were outliers in this study in terms ofpaid adwords and cost with 1100 and 874 paid adwords at costs of $5600 and $45,100 respectively. The #3 institutionwas West Virginia State with 65 paid adwords at a cost of $21,500bNote: Shorter College (HBCU) and Louisburg College did not purchase adwords in 2017
Taylor International Journal of Educational Technology in Higher Education (2018) 15:28 Page 9 of 15
Limitations
This study is primarily limited in three ways: sample size, search engine data, and other
forms of institution-to-student communication outside of the Internet.
First, although all accredited HBCUs were examined in this study (n = 100), there was
only one institution compared to each HBCU given both the lack of comparable insti-
tutions and the time necessary to gather all SEMrush data. For example, the More-
house School of Medicine (MSM) was compared to the Curtis Institute of Music given
their similar sectors (private, four-year institutions), total enrollment (both institutions
enrolled fewer than 500 students in 2016–2017), admission rates (Morehouse at 2%
and Curtis at 4% for 2016–2017), and yield rates (both at 89% in 2016–2017). After
comparing the HBCU dataset to the comparable institution dataset, it was clear that
the MSM and Curtis was the only possible pairing, as other comparable private four-
year institutions were either much larger in terms of total enrollment, more inclusive
in terms of admission, or more popular in terms of yield. In fact, the most similar pri-
vate four-year institution to the MSM in terms of sector and size was a rabbinical
school in New York that was much more inclusive (36% admission rate) but much less
popular (50% yield) than Curtis. This phenomenon was common across all HBCUs, as
each HBCU only had between one and four comparable institutions in terms of sector
and size, and usually only one or two institutions with the same or comparable admis-
sion rate and yield. For this reason, future research should examine the web presence
Table 3 Comparison of HBCUs to comparable institutions by mobile paid adwords, current as ofJanuary 2018
Paid adword metrics: (mobile adwords, gain, cost)
Public, 4-year HBCUs (n = 8)a Peers (n = 22)
Mean (standard deviation)
Paid adwords 38 (69) 72 (68)
Traffic gain (in hits, yearly) 7726 (11,397) 26,868 (31,940)
Paid adwords cost (in dollars, yearly) $2293 ($3409) $8077 ($13,214)
Private, 4-year HBCUs (n = 1)b Peers (n = 27)
Mean (standard deviation)
Paid adwords 2 185 (453)
Traffic gain (in hits, yearly) 13 21,889 (34,668)
Paid adwords cost (in dollars, yearly) $1.00 $9140 ($12,580)
Public, 2-year HBCUs (n = 3)c Peers (n = 4)d
Mean (standard deviation)
Paid adwords 38 (53) 60 (50)
Traffic gain (in hits, yearly) 14,884 (22467) 50,433 (74,608)
Paid adwords cost (in dollars, yearly) $11,822 ($19,644) $11,239 ($10,559)
Private, 2-year (n = 1)e
aNote: The University of the District of Columbia was an outlier in this study in terms of paid adwords and cost with 207paid adwords at a cost of $7500. The #2 institution was Delaware State University with 36 paid adwords at a costof $2500bNote: Howard University was the only private, four-year HBCU to purchase adwords in 2017cNote: St. Philips College was an outlier in this study in terms of paid adwords and cost with 99 paid adwords at a cost of$34,500. The #2 institution was Coahoma Community College with 10 paid adwords at a cost of $36.00dNote: Moore Norman Technology Center was an outlier in this study in terms of traffic gain, as it paid for 76 mobileadwords and generated 160,800 yearly hits from those adwords. Comparatively, the University of Arkansas CommunityCollege at Morrilton paid for 123 mobile adwords and generated 30,000 yearly hitseNote: Shorter College (HBCU) and Louisburg College did not purchase adwords in 2017
Taylor International Journal of Educational Technology in Higher Education (2018) 15:28 Page 10 of 15

and employment of paid adwords across different institution types using advanced stat-
istical methods to better understand how institutions of higher education compete
against each other on the Internet.
Second, current as of January 2018, Google is the most popular search engine in the
world by a wide margin, firmly ahead of both Microsoft’s Bing and Yahoo! (Bhangu 2018).
Coupling this information with the recent research demonstrating that the Internet is the
leading source of pre-college information for prospective students (Burdett 2013; Daun-
Barnett and Das 2013), all SEMrush data requests were made using Google Analytics data
in this study. Because the Internet is such a popular and influential landscape for pre-
college students, future research should investigate which search engines prospective stu-
dents use, how they use organic keywords to search for institutional information, and
how they make their postsecondary choice using Internet resources. This information
would likely inform institutional practitioners in terms how to best use web analytics to
compete on the Internet and drive prospective student traffic to their institutional
website.
Finally, this study does not examine forms of institution-to-student communication
outside of the Internet. Although a wealth of longitudinal research has focused on recruit-
ing students to HBCUs from a variety of backgrounds (Freeman and Thomas 2002;
McRae 2016; Southerland and Lewis 2016; Tanaka and Gladney 1993), future research
could address new ways HBCUs could recruit prospective students using digital
means aside from the Internet, including telephone and text messaging initiatives,
given the popularity of smartphone use among college-age people in the U.S.
(Pew Research Center 2017).
Discussion and implicationsThis study answered both research questions. First, HBCU websites—across sectors—
are smaller and less popular than institutions of similar sector, size, admission rate, and
yield. Second, HBCUs do not employ paid adword tactics—in desktop or mobile for-
mat—at the same rate as institutions of similar sector, size, admission rate, and yield.
Hearkening back to the words of Outgoing President of the Thurgood Marshall College
Fund Johnny C. Taylor Jr., HBCUs are indeed competing with other institutions of
higher education, yet the data in this study indicates that HBCUs do not compete well
in the largest global market, the Internet, and the number one source of pre-college in-
formation for prospective students (Burdett 2013).
Practitioners at HBCUs—especially those in web development and marketing—can
glean several insights from this study. First, data in this study suggest HBCU websites
are much smaller in terms of webpages than peer institutions. From here, web devel-
opers at HBCUs should collaborate across departments, including admissions, financial
aid, and prospective student recruitment, to produce attractive, keyword-specific web
content for prospective students and post that content on their institutional website.
Furthermore, HBCU practitioners could explore collaborations with other institutions
or organizations and produce content that could be added to other websites. Across
sectors, HBCUs had markedly fewer backlinks to their websites than non-HBCU insti-
tutions, meaning that Internet users are much more likely to encounter non-HBCU in-
stitutional material in other places on the Internet than HBCU material. HBCUs could
consider collaborating among themselves to embed backlinks to other HBCU websites
Taylor International Journal of Educational Technology in Higher Education (2018) 15:28 Page 11 of 15
on their own, increasing the number backlinks and web presence that HBCUs could have.
Paul Quinn College could serve as a model institution in terms of how to increase web
presence and popularity: HBCUs could learn to compete from one of their own.
HBCU practitioners should also become well-versed in the science of search engine
optimization (SEO) to ensure that HBCU web content is easily searchable and locatable
by Internet users, especially prospective students and educational leaders. Data in this
study suggest HBCUs lagged behind their non-HBCU peers in terms of organic key-
words and web traffic; yet, these gaps could be closed by HBCU practitioners analyzing
the organic keywords leading Internet users to their websites and learning how to bet-
ter write their website content and produce new content to engage with those organic
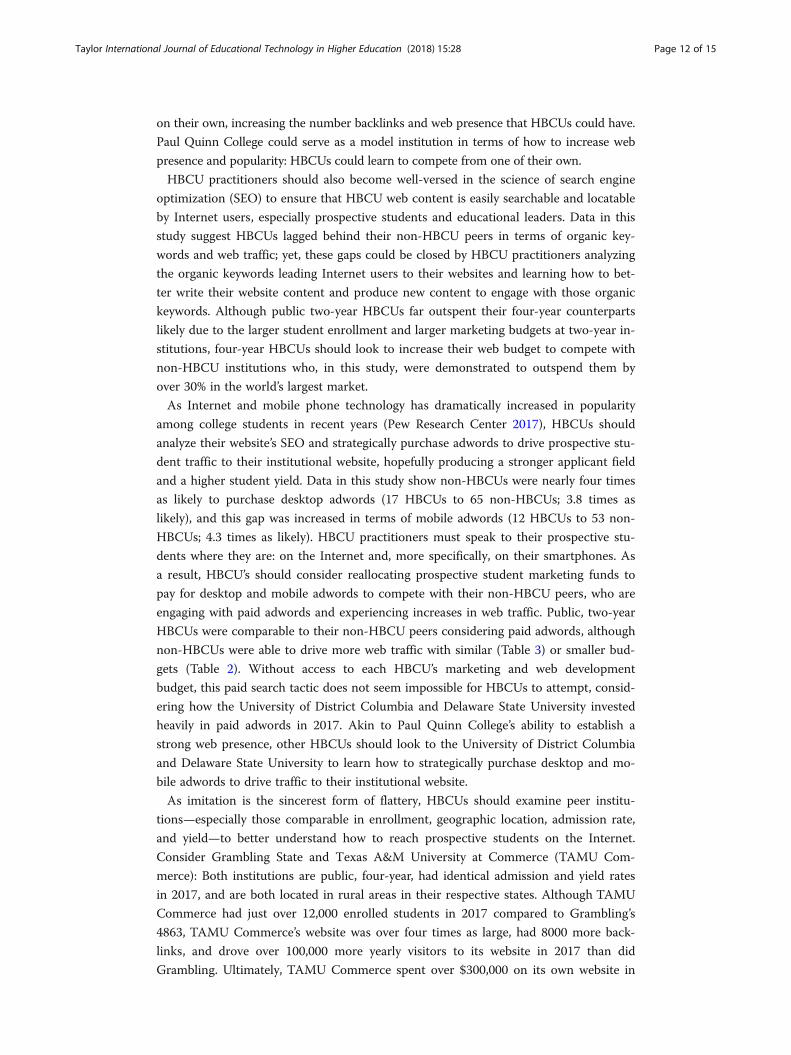
keywords. Although public two-year HBCUs far outspent their four-year counterparts
likely due to the larger student enrollment and larger marketing budgets at two-year in-
stitutions, four-year HBCUs should look to increase their web budget to compete with
non-HBCU institutions who, in this study, were demonstrated to outspend them by
over 30% in the world’s largest market.
As Internet and mobile phone technology has dramatically increased in popularity
among college students in recent years (Pew Research Center 2017), HBCUs should
analyze their website’s SEO and strategically purchase adwords to drive prospective stu-
dent traffic to their institutional website, hopefully producing a stronger applicant field
and a higher student yield. Data in this study show non-HBCUs were nearly four times
as likely to purchase desktop adwords (17 HBCUs to 65 non-HBCUs; 3.8 times as
likely), and this gap was increased in terms of mobile adwords (12 HBCUs to 53 non-
HBCUs; 4.3 times as likely). HBCU practitioners must speak to their prospective stu-
dents where they are: on the Internet and, more specifically, on their smartphones. As
a result, HBCU’s should consider reallocating prospective student marketing funds to
pay for desktop and mobile adwords to compete with their non-HBCU peers, who are
engaging with paid adwords and experiencing increases in web traffic. Public, two-year
HBCUs were comparable to their non-HBCU peers considering paid adwords, although
non-HBCUs were able to drive more web traffic with similar (Table 3) or smaller bud-
gets (Table 2). Without access to each HBCU’s marketing and web development
budget, this paid search tactic does not seem impossible for HBCUs to attempt, consid-
ering how the University of District Columbia and Delaware State University invested
heavily in paid adwords in 2017. Akin to Paul Quinn College’s ability to establish a
strong web presence, other HBCUs should look to the University of District Columbia
and Delaware State University to learn how to strategically purchase desktop and mo-
bile adwords to drive traffic to their institutional website.
As imitation is the sincerest form of flattery, HBCUs should examine peer institu-
tions—especially those comparable in enrollment, geographic location, admission rate,
and yield—to better understand how to reach prospective students on the Internet.
Consider Grambling State and Texas A&M University at Commerce (TAMU Com-
merce): Both institutions are public, four-year, had identical admission and yield rates
in 2017, and are both located in rural areas in their respective states. Although TAMU
Commerce had just over 12,000 enrolled students in 2017 compared to Grambling’s
4863, TAMU Commerce’s website was over four times as large, had 8000 more back-
links, and drove over 100,000 more yearly visitors to its website in 2017 than did
Grambling. Ultimately, TAMU Commerce spent over $300,000 on its own website in
Taylor International Journal of Educational Technology in Higher Education (2018) 15:28 Page 12 of 15
2017, whereas Grambling invested roughly $20,000.1 Although tight and ever-
tightening, perhaps HBCU marketing budgets are better spent on the Internet than
over other forms of marketing, especially given the incredible popularity of the Internet
among college-aged people in the U.S. (Pew Research Center 2017).
Ultimately, data in this study suggest HBCUs ought to consider increasing the size of
their website, increasing their collaborations with other institutions and organizations
on the Internet to increase their popularity, practice SEO, and engage with paid adword
tactics that drive prospective students to HBCU websites.
ConclusionBy many measures, HBCUs are highly unique and successful institutions. HBCUs only
comprise 3% of all institutions of higher education in the U.S., yet these institutions
graduate 20% of all African-American postsecondary students in the U.S. (Camera 2017).
Data suggest HBCU alumni are more financially successful than African-American gradu-
ates from other non-HBCU peer institutions (Gallup 2015). HBCUs have also provided
unparalleled access and support for economically-disadvantaged students, as nearly 75%
of all HBCU students are Pell Grant-eligible (Gasman and Samayoa 2017). Given the dis-
parities between African-American and White students in terms of STEM (science, tech-
nology, engineering, and mathematics) degrees, HBCUs accounted for 10 of the top 20
colleges and universities in the U.S. producing African-American STEM degree holders
(Leichter 2016). In short, the quality of HBCUs speaks for itself. Now, HBCUs need to
speak to prospective students online.
As Johnny C. Taylor asserted, HBCUs are now “competing” with other institutions
given the shifting market, resulting in “economically-challenged” HBCUs (Hong 2017,
para. 11). Data in this study suggest that this economic struggle, partly due to stagnant or
decreasing enrollments at some HBCUs (Medina and Allen 2017; Savage 2017), could be
influenced by the lack of competitiveness HBCUs demonstrate on the Internet. As the lar-
gest global higher education market, the Internet must be viewed as a competitive advan-
tage for HBCUs: These are successful institutions with a wealth of history, quality, and
affordability to offer prospective students. Now, all HBCUs need to harness the power of
this global market and share these positive institutional traits in order to compete for the
best and brightest students. If not, the financial situations between HBCUs could exacer-
bate, potentially threatening the livelihood of some of the most successful and time-
honored institutions in the United States.
Endnotes1All figures are included in the HBCU/peer database, which is available upon request.
AbbreviationsHBCU: Historically-Black college or university; IPEDS: Integrated Postsecondary Education Data System;PWI: Predominantly-White institution; SEO: Search engine optimization; U.S.: United States
AcknowledgementsThe author would like to thank Dr. Izzat Alsmadi of Texas A&M University-San Antonio for his guidance andmentorship.
Availability of data and materialsBoth HBCU and peer institution datasets are available from the author upon request.
Authors’ contributionsAll authors read and approved the final manuscript.
Taylor International Journal of Educational Technology in Higher Education (2018) 15:28 Page 13 of 15
Competing interestsThe author has no competing interests or funding sources for this study. All data is publicly available through publicly-available databases.
Publisher’s NoteSpringer Nature remains neutral with regard to jurisdictional claims in published maps and institutional affiliations.
Received: 29 January 2018 Accepted: 11 May 2018
ReferencesAmerica, R. F. (2012). Can HBCUs compete? Journal Blacks Higher Education Retrieved from https://www.jbhe.com/2012/
10/can-hbcus-compete/. Accessed 18 May 2018.Anderson, M. (2017). A look at historically black colleges and universities as Howard turns 150. Retrieved from http://
www.pewresearch.org/fact-tank/2017/02/28/a-look-at-historically-black-colleges-and-universities-as-howard-turns-150/. Accessed 18 May 2018.
Barba, I., Cassidy, R., De Leon, E., & Williams, B. J. (2013). Web analytics reveal user behavior: TTU libraries' experiencewith Google analytics. Journal of Web Librarianship, 7(4), 389–400. https://doi.org/10.1080/19322909.2013.828991
Bhangu, G. (2018). Top 10 most popular search engines in the world, 2018. Retrieved from https://otechworld.com/most-popular-search-engines-in-world/. Accessed 18 May 2018.
Burdett, K. R. (2013). How students choose a college: Understanding the role of internet based resources in the collegechoice process (Doctoral dissertation). Available from ProQuest database. (UMI No. 3590306)
Camera, L. (2017). Keeping a promise to HBCUs. Retrieved from https://www.usnews.com/news/the-report/articles/2017-09-29/struggling-hbcus-look-for-help-from-the-trump-administration. Accessed 18 May 2018.
Clifton, B. (2012). Advanced web metrics with Google Analytics, (3rd ed.,). Indianapolis: Wiley.Collins, D. E. (2015). Three things HBCUs could do to survive and succeed. Academe Retrieved from https://www.aaup.
org/article/three-things-hbcus-could-do-survive-and-succeed#.WjFvElQ-cdA.Accessed 18 May 2018.Cortez, M. B. (2017). Temple University's real-time feedback app is the latest analytics business spinoff. Retrieved from
https://edtechmagazine.com/higher/article/2017/12/temple-university-s-real-time-feedback-app-latest-analytics-business-spinoff. Accessed 18 May 2018.
Daun-Barnett, N., & Das, D. (2013). Unlocking the potential of the internet to improve college choice: A comparativecase study of college-access web tools. Journal of Marketing for Higher Education, 23(1), 113–134. https://doi.org/10.1080/08841241.2013.805708
Deming, D. J., Goldin, C., & Katz, L. (2013). For-profit colleges. The Future of Children, 23(1), 137–163 Retrieved fromhttp://scholar.harvard.edu/files/goldin/files/for-profit_colleges.pdf.
Fang, W. (2007). Using Google analytics for improving library website content and design: A case study. LibraryPhilosophy and Practice, 1–17 Retrieved from http://digitalcommons.unl.edu/libphilprac/121
Freeman, K., & Thomas, G. E. (2002). Black colleges and college choice: Characteristics of students who choose HBCUs.The Review of Higher Education, 25(3), 349–358. https://doi.org/10.1353/rhe.2002.0011
Gallup. (2015). USA funds minority college graduates report. Retrieved from http://www.gallup.com/services/186305/gallup-usa-funds-minority-college-graduates-report.aspx. Accessed 18 May 2018.
Gasman, M., & Samayoa, A. C. (2017). Historically Black colleges and universities: Fostering familial learningenvironments for student success. Retrieved from https://www.higheredtoday.org/2017/10/04/historically-black-colleges-universities-fostering-familial-learning-environments-student-success/. Accessed 18 May 2018.
Google, Inc. (2018). Search ad campaigns. Retrieved from https://adwords.google.com/home/how-it-works/search-ads/?subid=us-en-et-g-aw-a-awhp_a1!o2-awhpm-0000000002-0000000001#?modal_active=none. Accessed 18 May 2018.
Hanley, M., & Becker, M. (2008). Cell phone usage and advertising acceptance among college students: A four-yearanalysis. International Journal of Mobile Marketing, 3(1), 67–80.
Hickey, R. (2014). The history of online Education Retrieved from https://www.petersons.com/articles/online-degrees/online-education-history. Accessed 18 May 2018.
Hong, J. (2017). Outgoing TMCF leader says HBCUs must boost enrollment, finances. Retrieved from http://diverseeducation.com/article/105826/. Accessed 18 May 2018.
Jacobs, P. (2015). There's an unprecedented crisis facing America's historically black colleges. Retrieved from http://www.businessinsider.com/hbcus-may-be-more-in-danger-of-closing-than-other-schools-2015-3. Accessed 18 May 2018.
Ledford, J. L. (2015). Search engine optimization bible, (2nd ed.,). Indianapolis: Wiley.Leichter, K. (2016). HBCUs: An unheralded role in STEM majors and a model for other colleges. Retrieved from https://
www.chronicle.com/article/HBCUs-an-Unheralded-Role-in/235481. Accessed 18 May 2018.McRae, S. L. (2016). A time for change: An examination of a historically Black college or university (HBCU) and its efforts
to globalize and acculturate international students into campus life (Doctoral dissertation). Retrieved from http://digitalcommons.auctr.edu/cauetds/30/. Accessed 18 May 2018.
Medina, D. A., & Allen, R. (2017). What is the future for America’s historically Black colleges and universities? Retrievedfrom https://www.nbcnews.com/nightly-news/what-future-america-s-historically-black-colleges-universities-n725811.Accessed 18 May 2018.
Morris, C. (2016). HBCU stakeholders cite leadership instability, finances as greatest challenges. Diverse Issues in HigherEducation, 33(21), 7 Retrieved from http://www.diverseeducation.com/article/88473/
National Center for Education Statistics. (2017). Data center: Compare institutions. Retrieved from https://nces.ed.gov/ipeds/datacenter/InstitutionList.aspx. Accessed 18 May 2018.
Pew Research Center. (2017). Internet/broadband fact sheet. Retrieved from http://www.pewinternet.org/fact-sheet/internet-broadband/. Accessed 18 May 2018.
Taylor International Journal of Educational Technology in Higher Education (2018) 15:28 Page 14 of 15

Quacquarelli Symonds Limited. (2017). How to use Google Analytics to track student recruitment leads. Retrieved fromhttp://www.qs.com/how-to-use-google-analytics-to-track-student-recruitment-leads/. Accessed 18 May 2018.
Ryan, C., & Lewis, J. M. (2017). Computer and Internet use in the United States: 2015. Retrieved from https://www.census.gov/content/dam/Census/library/publications/2017/acs/acs-37.pdf
Saran, A., Cruthirds, K., & Minor, M. S. (2015). Ad acceptance: Scale development, purification, and validation of cellphone advertising acceptance. Revolution in Marketing: Market Driving Changes, 62–66. https://doi.org/10.1007/978-3-319-11761-4_31
Savage, G. (2017). An uncertain future for the nation's oldest HBCU. Diverse Issues in Higher Education, 34(14), 21–22Retrieved from http://www.diverseeducation.com/article/100704/
Selingo, J. (2017). How colleges use big data to target the students they want. Retrieved from https://www.theatlantic.com/education/archive/2017/04/how-colleges-find-their-students/522516/. Accessed 18 May 2018.
SEMrush. (2017). Domain analytics. Retrieved from SEMrush database. https://www.semrush.com/info/empty/domain_overview/?country=us
SEMrush. (2018a). Analytics reports. Retrieved from https://www.semrush.com/features/SEMrush. (2018b). Domain analytics. Retrieved from SEMrush database. https://www.semrush.com/info/empty/domain_
overview/?country=usSoutherland, E. C., & Lewis, J. R. (2016). Social media and HBCU admissions: An analysis of two-way communication. In
C. B. W. Prince, & R. L. Ford (Eds.), Administrative challenges and organizational leadership in historically Black collegesand universities, (pp. 142–150). https://doi.org/10.4018/978-1-5225-0311-8.ch008.
Stein, E. (2015). Web analytics in action in higher ed. Retrieved from https://www.universitybusiness.com/article/web-analytics-action-higher-ed. Accessed 18 May 2018.
Svrluga, S. (2017). Big data could solve the college-dropout problem. Retrieved from https://www.washingtonpost.com/news/grade-point/wp/2017/12/12/big-data-could-solve-the-college-dropout-problem/?utm_term=.19d00e0acddc.Accessed 18 May 2018.
Tanaka, J. C., & Gladney, L. D. (1993). Teaching biophysics: Strategies for recruiting and retaining minorities in physicsand biophysics. Biophysical Journal, 65(1), 552–558. https://doi.org/10.1016/S0006-3495(93)81085-3
The Journal of Blacks in Higher Education (2016). More good news on enrollments at historically black universities. TheJournal of Blacks in Higher Education Retrieved from https://www.jbhe.com/2016/09/more-good-news-on-enrollments-at-historically-black-universities/
Unni, R., & Harmon, R. (2007). Perceived effectiveness of push vs. pull mobile location based advertising. Journal ofInteractive Advertising, 7(2), 28–40. https://doi.org/10.1080/15252019.2007.10722129
Vecchione, A., Brown, D., Allen, E., & Baschnagel, A. (2016). Tracking user behavior with Google analytics events on anacademic library web site. Journal of Web Librarianship, 10(3), 161–175. https://doi.org/10.1080/19322909.2016.1175330
Wallace, P. (2016). The psychology of the internet, (2nd ed.,). New York: Cambridge.Worf, L. (2015). HBCUs seek to distinguish themselves in competition for students. Retrieved from http://wfae.org/post/
hbcus-seek-distinguish-themselves-competition-students. Accessed 18 May 2018.Young, J. R. (2018). Turning a football field into a farm: How the 'urban work college' could lower college costs.
Retrieved from https://www.edsurge.com/news/2018-01-09-turning-a-football-field-into-a-farm-how-the-urban-work-college-could-lower-college-costs. Accessed 18 May 2018.
Taylor International Journal of Educational Technology in Higher Education (2018) 15:28 Page 15 of 15