nrel/tp-560-44133 fleets: current status 2008 … · fleets: current status 2008 . ... operated by...
TRANSCRIPT
Technical Report NREL/TP-560-44133 December 2008
Fuel Cell Buses in U.S. Transit Fleets: Current Status 2008 L. Eudy National Renewable Energy Laboratory
K. Chandler Battelle
C. Gikakis Federal Transit Administration
Fuel Cell Buses in U.S. Transit Fleets: Current Status 2008 L. Eudy National Renewable Energy Laboratory
K. Chandler Battelle
C. Gikakis Federal Transit Administration
Prepared under Task No. H270.8200
Technical Report NREL/TP-560-44133 December 2008
National Renewable Energy Laboratory1617 Cole Boulevard, Golden, Colorado 80401-3393 303-275-3000 • www.nrel.gov
NREL is a national laboratory of the U.S. Department of Energy Office of Energy Efficiency and Renewable Energy Operated by the Alliance for Sustainable Energy, LLC
Contract No. DE-AC36-08-GO28308
NOTICE
This report was prepared as an account of work sponsored by an agency of the United States government. Neither the United States government nor any agency thereof, nor any of their employees, makes any warranty, express or implied, or assumes any legal liability or responsibility for the accuracy, completeness, or usefulness of any information, apparatus, product, or process disclosed, or represents that its use would not infringe privately owned rights. Reference herein to any specific commercial product, process, or service by trade name, trademark, manufacturer, or otherwise does not necessarily constitute or imply its endorsement, recommendation, or favoring by the United States government or any agency thereof. The views and opinions of authors expressed herein do not necessarily state or reflect those of the United States government or any agency thereof.
Available electronically at http://www.osti.gov/bridge
Available for a processing fee to U.S. Department of Energy and its contractors, in paper, from:
U.S. Department of Energy Office of Scientific and Technical Information P.O. Box 62 Oak Ridge, TN 37831-0062 phone: 865.576.8401 fax: 865.576.5728 email: mailto:[email protected]
Available for sale to the public, in paper, from: U.S. Department of Commerce National Technical Information Service 5285 Port Royal Road Springfield, VA 22161 phone: 800.553.6847 fax: 703.605.6900 email: [email protected] online ordering: http://www.ntis.gov/ordering.htm
Printed on paper containing at least 50% wastepaper, including 20% postconsumer waste
Acknowledgements
This document includes results and experiences from several U.S. fuel cell bus evaluation projects. The active participation of our project partners is greatly appreciated. Contributors to this report included staff members of federal and state government agencies, manufacturing firms, and transit authorities. The authors especially thank the following:
Doug Byrne, Jaimie Levin, and Mallory Nestor-Brush, Alameda-Contra Costa Transit District
Polo Del Toro and Tommy Edwards, SunLine Transit Agency
Gene Walker, Steve Miller, Golden Gate Transit
Steve Warren, Connecticut Transit
Art Douwes, Santa Clara Valley Transportation Authority
John Garbak, U.S. Department of Energy
Walter Kulyk, Michael Molloy, U.S. Department of Transportation, Federal Transit Administration
Matthew Riley, Jennifer Stewart, Dave Boudreau, and Mike Tosca, UTC Power
Byron Somerville, Ballard Power Systems
Kevin Harris, Hydrogenics
George Sverdrup and Keith Wipke, National Renewable Energy Laboratory
iii
Acronyms and Abbreviations AC Transit Alameda-Contra Costa Transit District APTA American Public Transportation Association BAAQMD Bay Area Air Quality Management District CARB California Air Resources Board CATA Centre Area Transportation Authority CNG compressed natural gas CTE Center for Transportation and the Environment CTTRANSIT Connecticut Transit DGE diesel gallon equivalent DOE U.S. Department of Energy DOT U.S. Department of Transportation EDSP Electric Drive Strategic Plan EDTA Electric Drive Transportation Association FC fuel cell FCB fuel cell bus ft feet FTA Federal Transit Administration GGT Golden Gate Transit GVWR gross vehicular weight rating HCNG hydrogen and compressed natural gas HFCIT Hydrogen, Fuel Cells, & Infrastructure Technology HHICE hydrogen hybrid internal combustion engine HICE hydrogen internal combustion engine hp horsepower ICE internal combustion engine in inches kg kilogram kW kilowatts kWh kilowatt-hours lb pounds MBRC miles between road calls mpg miles per gallon mph miles per hour MTC Metropolitan Transportation Commission NAVC Northeastern Advanced Vehicle Consortium NFCBP National Fuel Cell Bus Program NREL National Renewable Energy Laboratory NYCT New York City Transit OEM original equipment manufacturer PEM proton exchange membrane psi pounds per square inch RC road call rpm revolutions per minute
iv
SAFETEA-LU Safe, Accountable, Flexible, Efficient Transportation Equity Act: a Legacy for Users
SamTrans San Mateo County Transit District SFMTA San Francisco Municipal Transportation Agency SOC state of charge VTA Santa Clara Valley Transportation Authority WMATA Washington Metropolitan Area Transit Authority ZEB zero-emission bus ZEBA Zero Emission Bay Area
v
vi
Table of Contents
Introduction and Background ......................................................................................................... 1 The Case for Fuel Cell Propulsion .................................................................................................. 2 Accomplishments Update ............................................................................................................... 2
U.S. Fuel Cell Bus Demonstrations ............................................................................................ 2 Evaluation Results Update .......................................................................................................... 3
What’s Coming Next?..................................................................................................................... 9 Federal Transit Administration ................................................................................................... 9 California Zero-Emission Bus Demonstration .......................................................................... 11 On-Going NREL Evaluations ................................................................................................... 12
Status of Fuel Cell Transit Buses .................................................................................................. 13 Other Propulsion Technology Development Experience .......................................................... 14 Additional Comments Regarding Demonstration and Testing ................................................. 15
Needs for Continued Success........................................................................................................ 16 Bus Performance ....................................................................................................................... 16 Fueling Stations and Hydrogen Source ..................................................................................... 17 Preparation for Market Introduction ......................................................................................... 18 Cost............................................................................................................................................ 19
References ..................................................................................................................................... 20 General ...................................................................................................................................... 20 AC Transit ................................................................................................................................. 20 CTTRANSIT ............................................................................................................................. 20 SunLine ..................................................................................................................................... 20 Santa Clara VTA ....................................................................................................................... 21
Introduction and Background
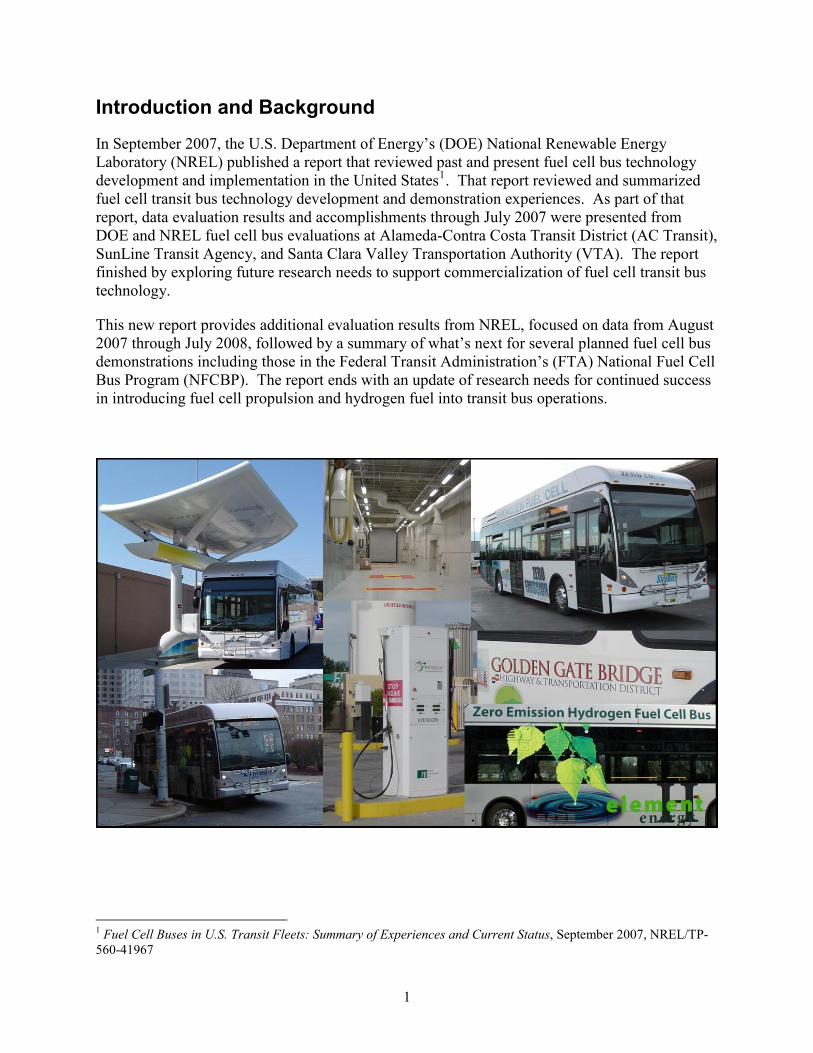
In September 2007, the U.S. Department of Energy’s (DOE) National Renewable Energy Laboratory (NREL) published a report that reviewed past and present fuel cell bus technology development and implementation in the United States1. That report reviewed and summarized fuel cell transit bus technology development and demonstration experiences. As part of that report, data evaluation results and accomplishments through July 2007 were presented from DOE and NREL fuel cell bus evaluations at Alameda-Contra Costa Transit District (AC Transit), SunLine Transit Agency, and Santa Clara Valley Transportation Authority (VTA). The report finished by exploring future research needs to support commercialization of fuel cell transit bus technology.
This new report provides additional evaluation results from NREL, focused on data from August 2007 through July 2008, followed by a summary of what’s next for several planned fuel cell bus demonstrations including those in the Federal Transit Administration’s (FTA) National Fuel Cell Bus Program (NFCBP). The report ends with an update of research needs for continued success in introducing fuel cell propulsion and hydrogen fuel into transit bus operations.
1 Fuel Cell Buses in U.S. Transit Fleets: Summary of Experiences and Current Status, September 2007, NREL/TP-560-41967
1
The Case for Fuel Cell Propulsion
The United States is facing several major energy challenges today, including:
Reducing dependence on foreign energy supplies
Developing affordable, domestic energy sources to meet current and future demands
Addressing concerns about air quality and climate change
The federal government is funding research to develop a portfolio of technologies to meet these challenges. A major part of this research is developing hydrogen as an energy carrier for a variety of applications. Hydrogen has many positive attributes that make it a good choice as an energy carrier. For example, it can be derived from diverse domestic resources such as natural gas, nuclear, and renewable power (such as from wind power). All sectors of the economy, from stationary to industrial to transportation applications, can use hydrogen. Hydrogen is also compatible with high efficiency fuel cells that can create power with zero emissions. A fuel cell is a simple device that offers the benefits of increased efficiency, quiet operation, and no emission of harmful pollutants.
Fuel cells are already being successfully proven in applications such as back-up power, small stationary power generation, and material handling equipment. These markets offer a high-value proposition with fewer technical barriers, which means a business case can be achieved in the near-term. Developing fuel cells for transportation applications is more complicated because of rigorous operating environments and packaging challenges, and therefore requires more time and effort. Much progress has been made, but there are still challenges to be addressed before there can be wide-spread market introductions. Proving fuel cell durability and reliability, optimizing on-board hydrogen storage for adequate range, optimizing hybrid–fuel cell system designs, building hydrogen fueling stations, and determining the best sources for hydrogen are just a few of the remaining challenges.
Although there are still many barriers to wide-spread use and acceptance, hydrogen and fuel cell technology offers one of the best options for addressing the energy challenges listed above.
Accomplishments Update
This section updates the accomplishments of the current and active fuel cell and hydrogen fueled transit bus demonstrations in the United States. Summaries are provided of the current experience of the transit agencies participating in the DOE and FTA evaluations from NREL.
U.S. Fuel Cell Bus Demonstrations The first fuel cell bus projects in the United States began in the mid-1990s and were focused on proof-of-concept to verify that fuel cell power systems could be packaged into a transit bus. Current demonstration programs are focused on maximizing bus use to help identify areas of improvement and optimization for reliability and, ultimately, durability. Table 1 lists demonstration projects that are currently operating fuel cell buses in the United States. Several other fuel cell bus development efforts are underway.
2
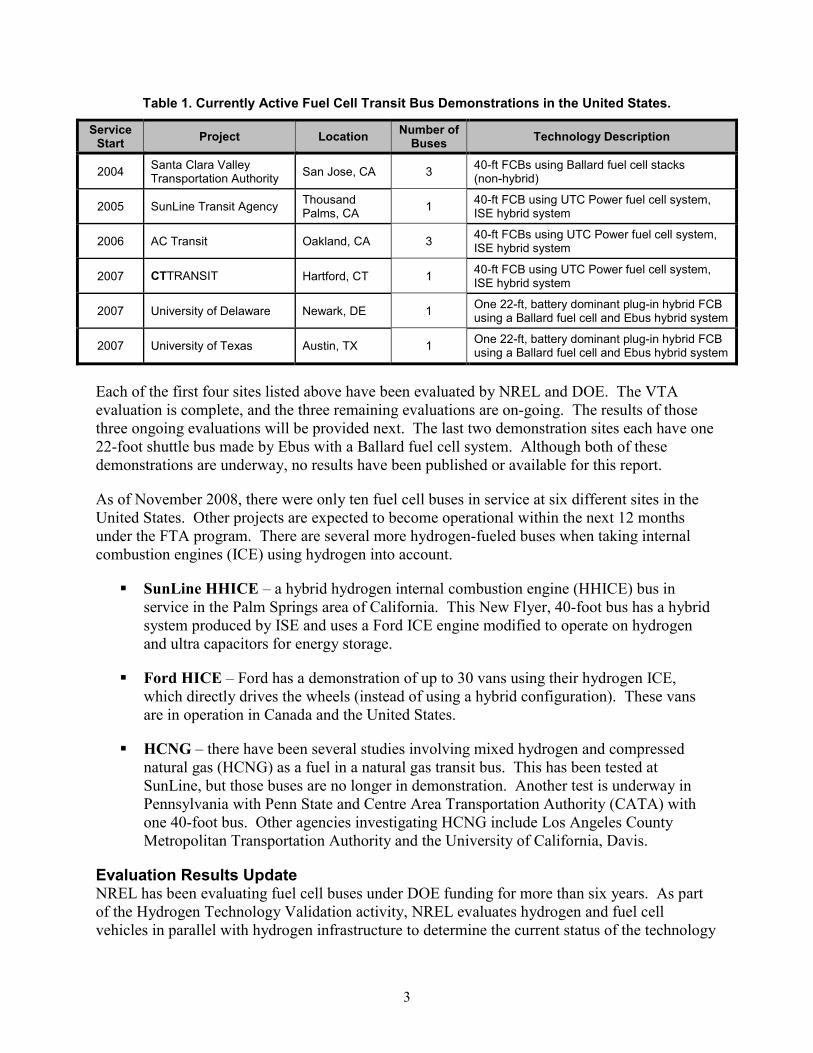
Table 1. Currently Active Fuel Cell Transit Bus Demonstrations in the United States.
Service Start Project Location Number of
Buses Technology Description
2004 Santa Clara Valley Transportation Authority San Jose, CA 3 40-ft FCBs using Ballard fuel cell stacks
(non-hybrid)
2005 SunLine Transit Agency Thousand Palms, CA 1 40-ft FCB using UTC Power fuel cell system,
ISE hybrid system
2006 AC Transit Oakland, CA 3 40-ft FCBs using UTC Power fuel cell system, ISE hybrid system
2007 CTTRANSIT Hartford, CT 1 40-ft FCB using UTC Power fuel cell system, ISE hybrid system
2007 University of Delaware Newark, DE 1 One 22-ft, battery dominant plug-in hybrid FCB using a Ballard fuel cell and Ebus hybrid system
2007 University of Texas Austin, TX 1 One 22-ft, battery dominant plug-in hybrid FCB using a Ballard fuel cell and Ebus hybrid system
Each of the first four sites listed above have been evaluated by NREL and DOE. The VTA evaluation is complete, and the three remaining evaluations are on-going. The results of those three ongoing evaluations will be provided next. The last two demonstration sites each have one 22-foot shuttle bus made by Ebus with a Ballard fuel cell system. Although both of these demonstrations are underway, no results have been published or available for this report.
As of November 2008, there were only ten fuel cell buses in service at six different sites in the United States. Other projects are expected to become operational within the next 12 months under the FTA program. There are several more hydrogen-fueled buses when taking internal combustion engines (ICE) using hydrogen into account.
SunLine HHICE – a hybrid hydrogen internal combustion engine (HHICE) bus in service in the Palm Springs area of California. This New Flyer, 40-foot bus has a hybrid system produced by ISE and uses a Ford ICE engine modified to operate on hydrogen and ultra capacitors for energy storage.
Ford HICE – Ford has a demonstration of up to 30 vans using their hydrogen ICE, which directly drives the wheels (instead of using a hybrid configuration). These vans are in operation in Canada and the United States.
HCNG – there have been several studies involving mixed hydrogen and compressed natural gas (HCNG) as a fuel in a natural gas transit bus. This has been tested at SunLine, but those buses are no longer in demonstration. Another test is underway in Pennsylvania with Penn State and Centre Area Transportation Authority (CATA) with one 40-foot bus. Other agencies investigating HCNG include Los Angeles County Metropolitan Transportation Authority and the University of California, Davis.
Evaluation Results Update NREL has been evaluating fuel cell buses under DOE funding for more than six years. As part of the Hydrogen Technology Validation activity, NREL evaluates hydrogen and fuel cell vehicles in parallel with hydrogen infrastructure to determine the current status of the technology
3
and assess the progress toward technology readiness. Recently, NREL also began working with the Federal Transit Administration (FTA)—an agency of the Department of Transportation (DOT)—to evaluate fuel cell buses in transit applications. This work directly supports FTA’s National Fuel Cell Bus Program (NFCBP), a muli-year demonstration program aimed at moving fuel cell buses toward commercialization.
Using an established protocol for data collection and analysis, NREL provides comprehensive, unbiased results on the implementation, operation, and costs of fuel cell buses compared to those of conventional-technology buses operating in the same or similar service (when available). These results are used by government and industry to determine the next steps for full implementation of the technology in bus applications. Over the last few years, NREL has worked with four demonstrations (six transit agencies) to evaluate fuel cell technology in buses, including:
Alameda-Contra Costa Transit District (AC Transit) in Oakland, California, along with its partner transit agency, Golden Gate Transit (GGT) in San Rafael, California
SunLine Transit Agency in Thousand Palms, California (in the Palm Springs area)
Connecticut Transit (CTTRANSIT) in Hartford, Connecticut
Santa Clara Valley Transportation Authority (VTA) in San Jose, California, along with its partner transit agency San Mateo County Transit District (SamTrans) in San Carlos, California
The results and experiences from these demonstrations, which have been documented in detailed evaluation reports, are the primary resource for this paper. For a complete list of publications on these demonstrations, see the References section.
NREL reports the evaluation results for each project individually by site. This status report is the only place where evaluation results are examined across sites. This report, which is an update to the original 2007 report, focuses on new evaluation results from AC Transit and GGT, SunLine, and CTTRANSIT. There are no new evaluation results available for the VTA and SamTrans demonstration. The fuel cell buses presented here are essentially the same bus design: a Van Hool bus with ISE electric propulsion design and integration, a UTC Power fuel cell power system, and three ZEBRA2 batteries per bus for energy storage.
The data presented here are focused on the last year of operation (August 2007 through July 2008) unless noted with the results. There are a couple of specific changes to the data period for some of the baseline buses used. The AC Transit diesel bus results are from June 2007 through May 2008 because the evaluation of the diesel buses at that site has concluded. The CTTRANSIT diesel buses are newer than the fuel cell bus; therefore the data period is shorter, starting with September 2007 through July 2008 except for roadcalls. In that case, the diesel bus roadcall period started with data in November 2007 because special procedures had to be implemented to capture the individual roadcall information by bus at this site.
Prototype Demonstrations – The primary objective of these prototype fuel cell bus demonstrations is to learn from problems that arise by identifying, resolving and incorporating 2 Sodium Nickel Chloride
4
the lessons learned into future designs. Demonstrations of prototype buses in real-world service are essential to validate the technology and determine what modifications are needed to increase durability and reliability for a future commercial product introduction. Each of these demonstration sites has pushed the technology to its limits (and beyond) to identify and address design issues. Many of the issues that have been documented in this report and the individual evaluation reports have been resolved, and the newest data from the demonstrations of the upgraded system in the buses suggests very positive trends in better availability and bus usage.
Service Changes – As each of the three sites (AC Transit, CTTRANSIT, and SunLine) have recently received a new version of the UTC Power fuel cell system, they have agreed to increase usage of the fuel cell buses. The fuel cell power plants at AC Transit were changed out as follows: FCB13 in March 2008; FCB2 in January 2008; and FCB3 in December 2007. The fuel cell power plant at SunLine was last changed out and started back in operation in April 2008. CTTRANSIT’s fuel cell power plant was changed in January 2008. Once these new fuel cell power systems were installed, the transit agencies intended to operate them as much as possible for testing.
At CTTRANSIT and AC Transit (FCB3), these buses are scheduled to operate at least 16 hours per day during the week and at least 8 hours per day on each weekend day. This is a significant increase in operation from the original planned weekday only service. The other two AC Transit FCBs will be used at this accelerated pace as the batteries allow; however, the focus of maximized operation is currently with FCB3 and the CTTRANSIT bus.
Issues with Energy Storage – The only limiting factor for increased operation for all of these fuel cell buses has been maintaining the control and operation of the ZEBRA batteries. The problem has been in keeping the three batteries operating at similar state of charge (SOC) without causing an over-volt fault in the propulsion system software developed by ISE. Recently, UTC Power and MES-DEA (the battery manufacturer) have been working closely together to try to better understand the operating conditions and interactions between the battery control and ISE’s propulsion system software control. MES-DEA has recently provided detailed training and troubleshooting information to UTC Power and the transit agencies, which has been extremely helpful in controlling the problems. There are also indications that the ISE control software needs to be modified to take what has been recently learned into account.
Total Miles and Hours – Table 2 shows miles, hours, average speed, and average monthly miles per bus for each of the three sites for all of their revenue service and then separately for this report’s 12-month period. The average speed for the past year results period shows that SunLine has the highest average speed at 12.6 mph, next is AC Transit at 10.0 mph, and CTTRANSIT is much lower at 6.2 mph. The SunLine fuel cell bus has the highest average monthly usage at about 1,600 miles per month.
3 AC Transit’s fuel cell buses are assigned the designations FCB1, FCB2, and FCB3.
5
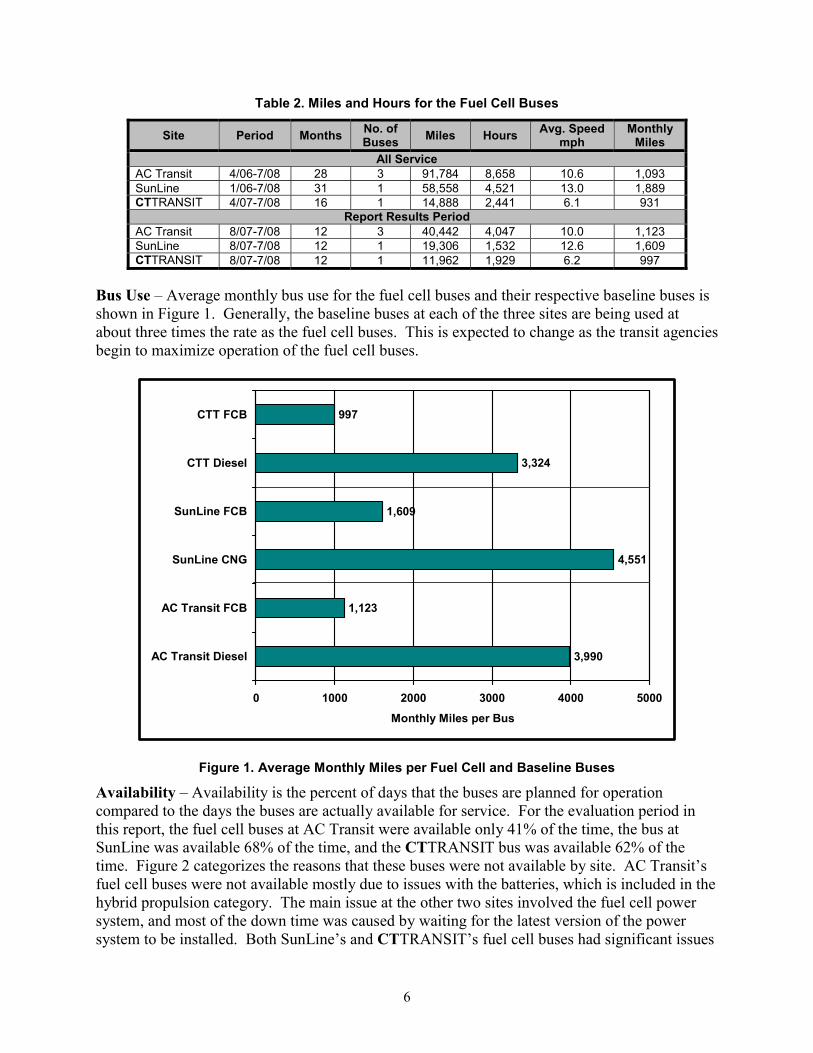
Table 2. Miles and Hours for the Fuel Cell Buses
Site Period Months No. of Buses Miles Hours Avg. Speed
mph Monthly
Miles All Service
AC Transit 4/06-7/08 28 3 91,784 8,658 10.6 1,093 SunLine 1/06-7/08 31 1 58,558 4,521 13.0 1,889 CTTRANSIT 4/07-7/08 16 1 14,888 2,441 6.1 931
Report Results PeriodAC Transit 8/07-7/08 12 3 40,442 4,047 10.0 1,123 SunLine 8/07-7/08 12 1 19,306 1,532 12.6 1,609 CTTRANSIT 8/07-7/08 12 1 11,962 1,929 6.2 997
Bus Use – Average monthly bus use for the fuel cell buses and their respective baseline buses is shown in Figure 1. Generally, the baseline buses at each of the three sites are being used at about three times the rate as the fuel cell buses. This is expected to change as the transit agencies begin to maximize operation of the fuel cell buses.
3,990
1,123
4,551
1,609
3,324
997
0 1000 2000 3000 4000 5000
AC Transit Diesel
AC Transit FCB
SunLine CNG
SunLine FCB
CTT Diesel
CTT FCB
Monthly Miles per Bus
Figure 1. Average Monthly Miles per Fuel Cell and Baseline Buses
Availability – Availability is the percent of days that the buses are planned for operation compared to the days the buses are actually available for service. For the evaluation period in this report, the fuel cell buses at AC Transit were available only 41% of the time, the bus at SunLine was available 68% of the time, and the CTTRANSIT bus was available 62% of the time. Figure 2 categorizes the reasons that these buses were not available by site. AC Transit’s fuel cell buses were not available mostly due to issues with the batteries, which is included in the hybrid propulsion category. The main issue at the other two sites involved the fuel cell power system, and most of the down time was caused by waiting for the latest version of the power system to be installed. Both SunLine’s and CTTRANSIT’s fuel cell buses had significant issues
6
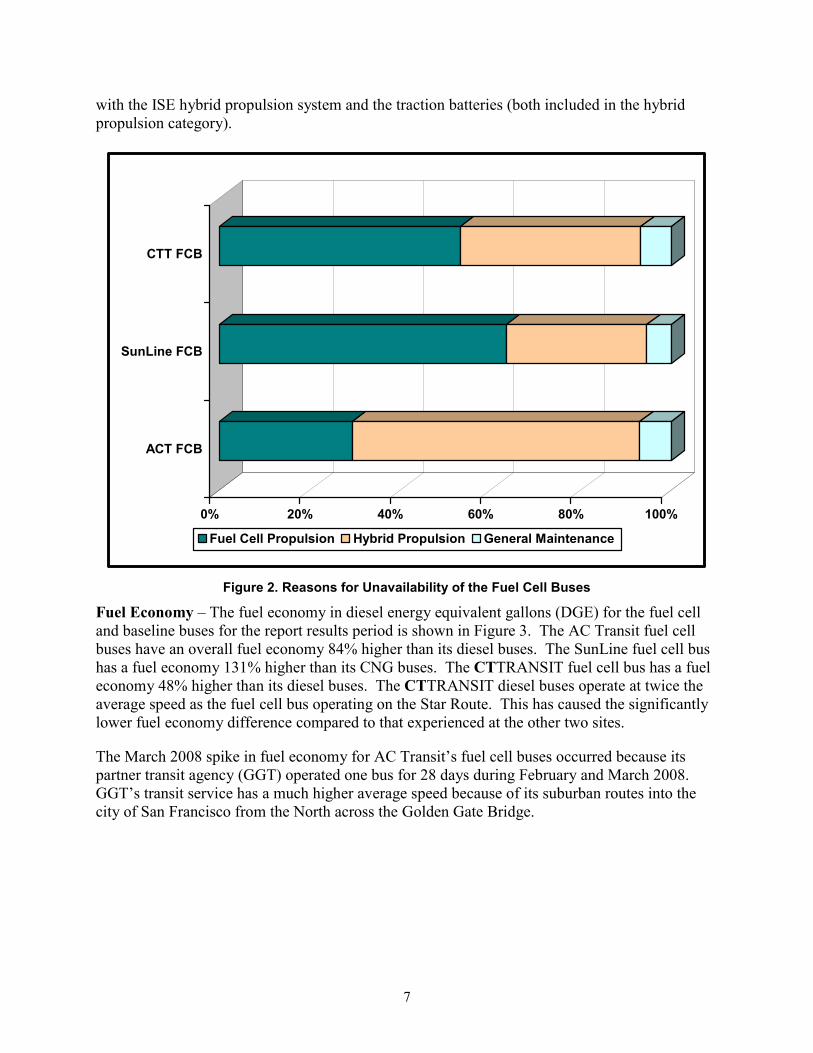
with the ISE hybrid propulsion system and the traction batteries (both included in the hybrid propulsion category).
0% 20% 40% 60% 80% 100%
ACT FCB
SunLine FCB
CTT FCB
Fuel Cell Propulsion Hybrid Propulsion General Maintenance
Figure 2. Reasons for Unavailability of the Fuel Cell Buses
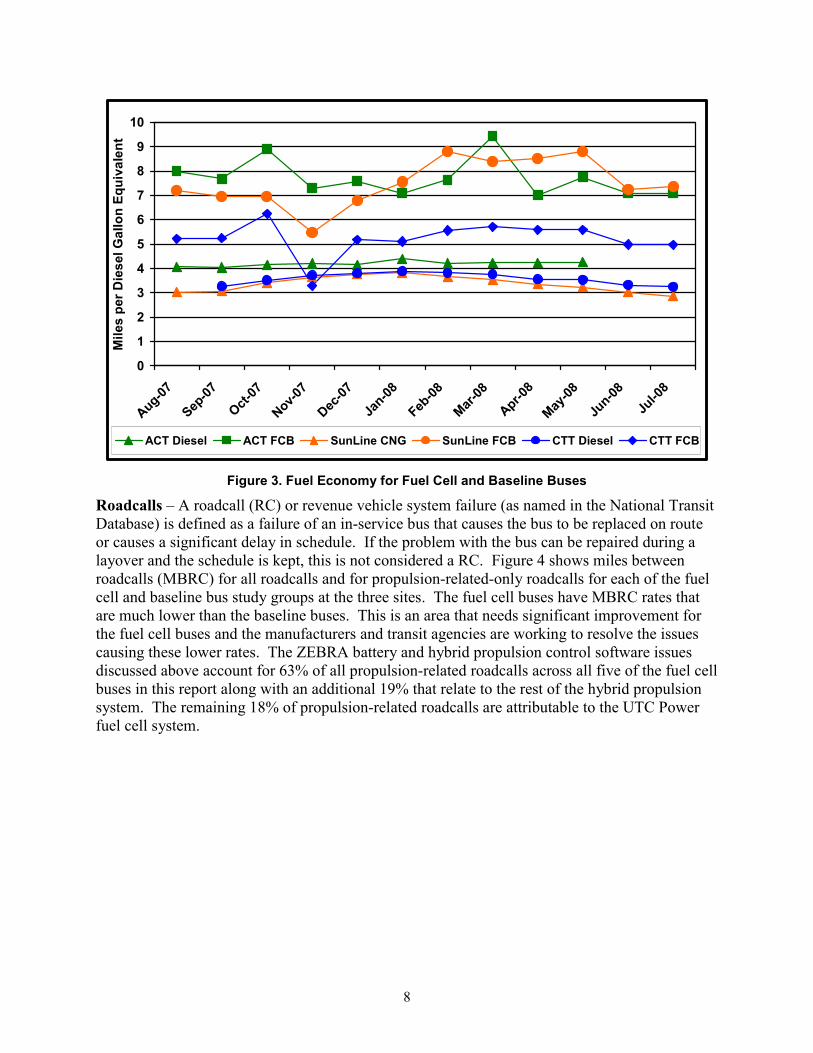
Fuel Economy – The fuel economy in diesel energy equivalent gallons (DGE) for the fuel cell and baseline buses for the report results period is shown in Figure 3. The AC Transit fuel cell buses have an overall fuel economy 84% higher than its diesel buses. The SunLine fuel cell bus has a fuel economy 131% higher than its CNG buses. The CTTRANSIT fuel cell bus has a fuel economy 48% higher than its diesel buses. The CTTRANSIT diesel buses operate at twice the average speed as the fuel cell bus operating on the Star Route. This has caused the significantly lower fuel economy difference compared to that experienced at the other two sites.
The March 2008 spike in fuel economy for AC Transit’s fuel cell buses occurred because its partner transit agency (GGT) operated one bus for 28 days during February and March 2008. GGT’s transit service has a much higher average speed because of its suburban routes into the city of San Francisco from the North across the Golden Gate Bridge.
7
0
1
2
3
4
5
6
7
8
9
10
Aug-07
Sep-07
Oct-07
Nov-07
Dec-07
Jan-08
Feb-08
Mar-08
Apr-08
May-08
Jun-08
Jul-0
8
Mile
s pe
r Die
sel G
allo
n Eq
uiva
lent
ACT Diesel ACT FCB SunLine CNG SunLine FCB CTT Diesel CTT FCB
Figure 3. Fuel Economy for Fuel Cell and Baseline Buses
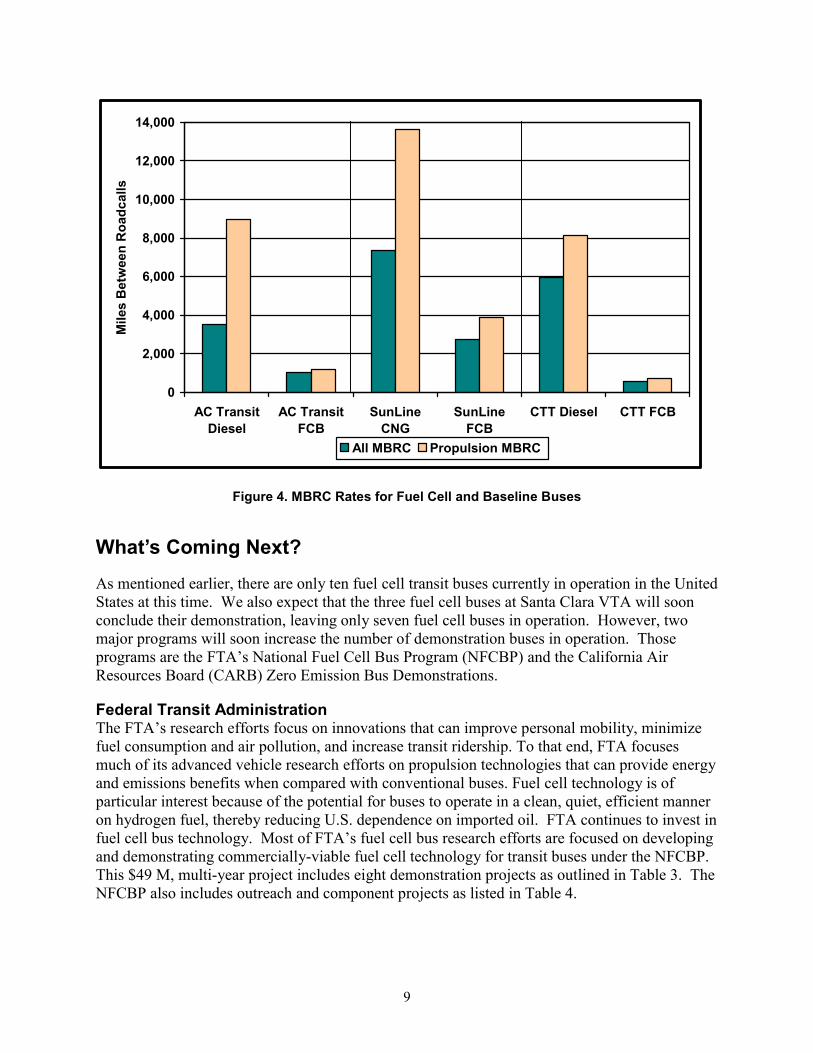
Roadcalls – A roadcall (RC) or revenue vehicle system failure (as named in the National Transit Database) is defined as a failure of an in-service bus that causes the bus to be replaced on route or causes a significant delay in schedule. If the problem with the bus can be repaired during a layover and the schedule is kept, this is not considered a RC. Figure 4 shows miles between roadcalls (MBRC) for all roadcalls and for propulsion-related-only roadcalls for each of the fuel cell and baseline bus study groups at the three sites. The fuel cell buses have MBRC rates that are much lower than the baseline buses. This is an area that needs significant improvement for the fuel cell buses and the manufacturers and transit agencies are working to resolve the issues causing these lower rates. The ZEBRA battery and hybrid propulsion control software issues discussed above account for 63% of all propulsion-related roadcalls across all five of the fuel cell buses in this report along with an additional 19% that relate to the rest of the hybrid propulsion system. The remaining 18% of propulsion-related roadcalls are attributable to the UTC Power fuel cell system.
8
0
2,000
4,000
6,000
8,000
10,000
12,000
14,000
AC TransitDiesel
AC TransitFCB
SunLineCNG
SunLineFCB
CTT Diesel CTT FCB
Mile
s B
etw
een
Roa
dcal
ls
All MBRC Propulsion MBRC
Figure 4. MBRC Rates for Fuel Cell and Baseline Buses
What’s Coming Next?
As mentioned earlier, there are only ten fuel cell transit buses currently in operation in the United States at this time. We also expect that the three fuel cell buses at Santa Clara VTA will soon conclude their demonstration, leaving only seven fuel cell buses in operation. However, two major programs will soon increase the number of demonstration buses in operation. Those programs are the FTA’s National Fuel Cell Bus Program (NFCBP) and the California Air Resources Board (CARB) Zero Emission Bus Demonstrations.
Federal Transit Administration The FTA’s research efforts focus on innovations that can improve personal mobility, minimize fuel consumption and air pollution, and increase transit ridership. To that end, FTA focuses much of its advanced vehicle research efforts on propulsion technologies that can provide energy and emissions benefits when compared with conventional buses. Fuel cell technology is of particular interest because of the potential for buses to operate in a clean, quiet, efficient manner on hydrogen fuel, thereby reducing U.S. dependence on imported oil. FTA continues to invest in fuel cell bus technology. Most of FTA’s fuel cell bus research efforts are focused on developing and demonstrating commercially-viable fuel cell technology for transit buses under the NFCBP. This $49 M, multi-year project includes eight demonstration projects as outlined in Table 3. The NFCBP also includes outreach and component projects as listed in Table 4.
9
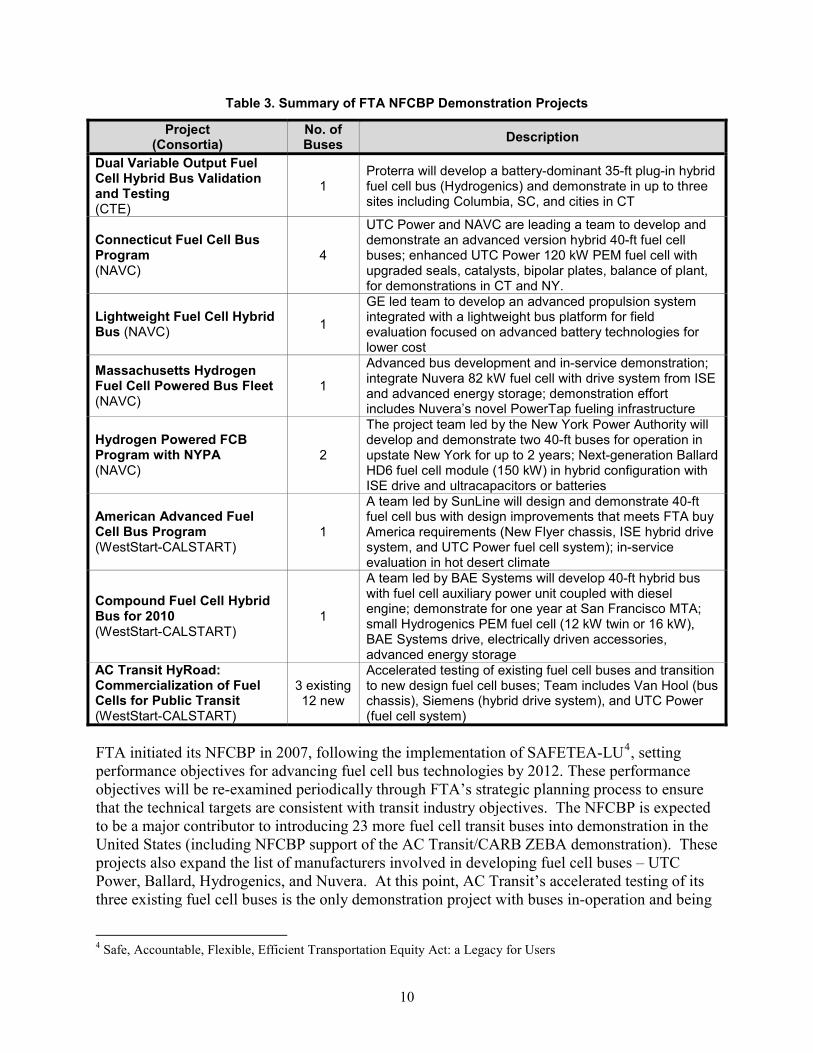
Table 3. Summary of FTA NFCBP Demonstration Projects
Project (Consortia)
No. of Buses Description
Dual Variable Output Fuel Cell Hybrid Bus Validation and Testing (CTE)
1 Proterra will develop a battery-dominant 35-ft plug-in hybrid fuel cell bus (Hydrogenics) and demonstrate in up to three sites including Columbia, SC, and cities in CT
Connecticut Fuel Cell Bus Program (NAVC)
4
UTC Power and NAVC are leading a team to develop and demonstrate an advanced version hybrid 40-ft fuel cell buses; enhanced UTC Power 120 kW PEM fuel cell with upgraded seals, catalysts, bipolar plates, balance of plant, for demonstrations in CT and NY.
Lightweight Fuel Cell Hybrid Bus (NAVC) 1
GE led team to develop an advanced propulsion system integrated with a lightweight bus platform for field evaluation focused on advanced battery technologies for lower cost
Massachusetts Hydrogen Fuel Cell Powered Bus Fleet (NAVC)
1
Advanced bus development and in-service demonstration; integrate Nuvera 82 kW fuel cell with drive system from ISE and advanced energy storage; demonstration effort includes Nuvera’s novel PowerTap fueling infrastructure
Hydrogen Powered FCB Program with NYPA (NAVC)
2
The project team led by the New York Power Authority will develop and demonstrate two 40-ft buses for operation in upstate New York for up to 2 years; Next-generation Ballard HD6 fuel cell module (150 kW) in hybrid configuration with ISE drive and ultracapacitors or batteries
American Advanced Fuel Cell Bus Program (WestStart-CALSTART)
1
A team led by SunLine will design and demonstrate 40-ft fuel cell bus with design improvements that meets FTA buy America requirements (New Flyer chassis, ISE hybrid drive system, and UTC Power fuel cell system); in-service evaluation in hot desert climate
Compound Fuel Cell Hybrid Bus for 2010 (WestStart-CALSTART)
1
A team led by BAE Systems will develop 40-ft hybrid bus with fuel cell auxiliary power unit coupled with diesel engine; demonstrate for one year at San Francisco MTA; small Hydrogenics PEM fuel cell (12 kW twin or 16 kW), BAE Systems drive, electrically driven accessories, advanced energy storage
AC Transit HyRoad: Commercialization of Fuel Cells for Public Transit (WestStart-CALSTART)
3 existing 12 new
Accelerated testing of existing fuel cell buses and transition to new design fuel cell buses; Team includes Van Hool (bus chassis), Siemens (hybrid drive system), and UTC Power (fuel cell system)
FTA initiated its NFCBP in 2007, following the implementation of SAFETEA-LU4, setting performance objectives for advancing fuel cell bus technologies by 2012. These performance objectives will be re-examined periodically through FTA’s strategic planning process to ensure that the technical targets are consistent with transit industry objectives. The NFCBP is expected to be a major contributor to introducing 23 more fuel cell transit buses into demonstration in the United States (including NFCBP support of the AC Transit/CARB ZEBA demonstration). These projects also expand the list of manufacturers involved in developing fuel cell buses – UTC Power, Ballard, Hydrogenics, and Nuvera. At this point, AC Transit’s accelerated testing of its three existing fuel cell buses is the only demonstration project with buses in-operation and being
4 Safe, Accountable, Flexible, Efficient Transportation Equity Act: a Legacy for Users
10
evaluated by NREL. Over the next 12 months, several of the new design buses funded under the NFCBP will begin operational testing.
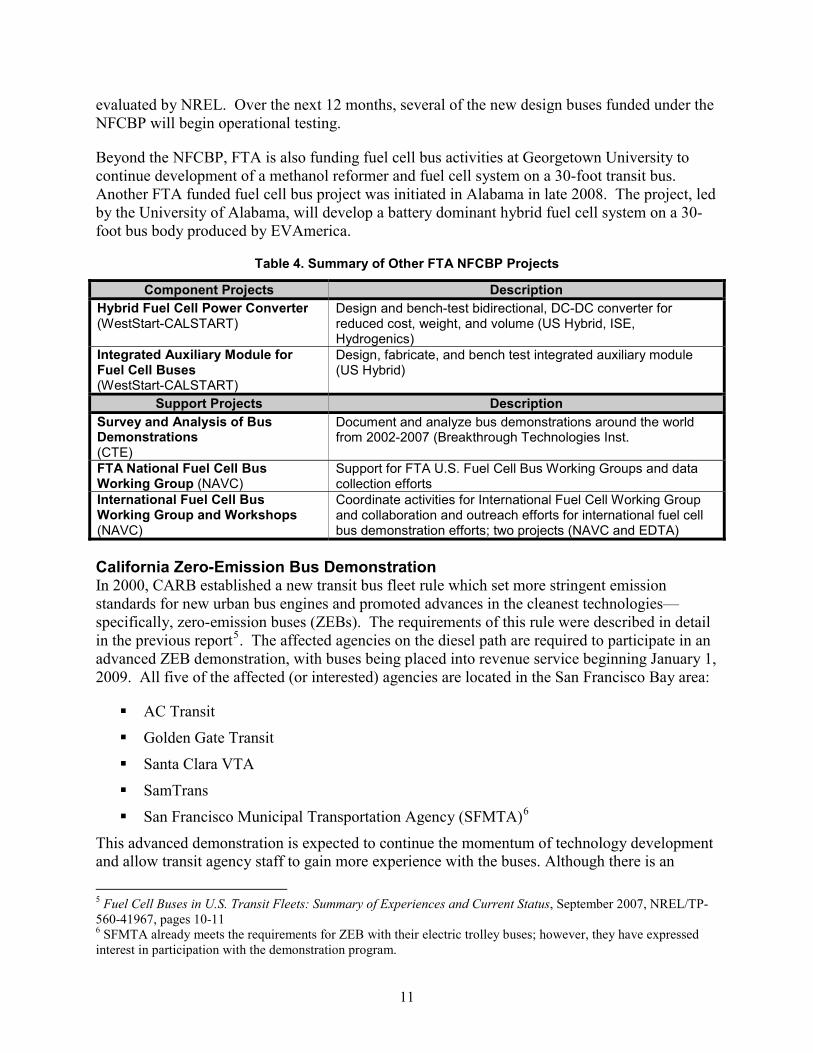
Beyond the NFCBP, FTA is also funding fuel cell bus activities at Georgetown University to continue development of a methanol reformer and fuel cell system on a 30-foot transit bus. Another FTA funded fuel cell bus project was initiated in Alabama in late 2008. The project, led by the University of Alabama, will develop a battery dominant hybrid fuel cell system on a 30-foot bus body produced by EVAmerica.
Table 4. Summary of Other FTA NFCBP Projects
Component Projects DescriptionHybrid Fuel Cell Power Converter (WestStart-CALSTART)
Design and bench-test bidirectional, DC-DC converter for reduced cost, weight, and volume (US Hybrid, ISE, Hydrogenics)
Integrated Auxiliary Module for Fuel Cell Buses (WestStart-CALSTART)
Design, fabricate, and bench test integrated auxiliary module (US Hybrid)
Support Projects Description Survey and Analysis of Bus Demonstrations (CTE)
Document and analyze bus demonstrations around the world from 2002-2007 (Breakthrough Technologies Inst.
FTA National Fuel Cell Bus Working Group (NAVC)
Support for FTA U.S. Fuel Cell Bus Working Groups and data collection efforts
International Fuel Cell Bus Working Group and Workshops (NAVC)
Coordinate activities for International Fuel Cell Working Group and collaboration and outreach efforts for international fuel cell bus demonstration efforts; two projects (NAVC and EDTA)
California Zero-Emission Bus Demonstration In 2000, CARB established a new transit bus fleet rule which set more stringent emission standards for new urban bus engines and promoted advances in the cleanest technologies—specifically, zero-emission buses (ZEBs). The requirements of this rule were described in detail in the previous report5. The affected agencies on the diesel path are required to participate in an advanced ZEB demonstration, with buses being placed into revenue service beginning January 1, 2009. All five of the affected (or interested) agencies are located in the San Francisco Bay area:
AC Transit
Golden Gate Transit
Santa Clara VTA
SamTrans
San Francisco Municipal Transportation Agency (SFMTA)6
This advanced demonstration is expected to continue the momentum of technology development and allow transit agency staff to gain more experience with the buses. Although there is an
5 Fuel Cell Buses in U.S. Transit Fleets: Summary of Experiences and Current Status, September 2007, NREL/TP-560-41967, pages 10-11 6 SFMTA already meets the requirements for ZEB with their electric trolley buses; however, they have expressed interest in participation with the demonstration program.
11
option to participate as a single agency, the five Bay-area agencies have recently elected to join together under the multiple-agency option, and formed the Zero Emission Bay Area (ZEBA) demonstration program. For this option, a minimum of 12 total ZEBs will be operated in the area, with AC Transit taking the lead. These buses will be the next generation of the current fuel cell bus at AC Transit, using a redesigned Van Hool chassis and the newest UTC Power fuel cell power system. The hybrid system will be fully integrated by Van Hool using a Siemens ELFA 2 system.
The other transit agencies involved will provide funding, participate in training activities, and periodically operate buses as part of the demonstration. There are several advantages to this team approach for demonstrating fuel cell buses. For one, larger bus numbers allow the manufacturers to collect data faster, which could help in identifying what optimizations are needed and more quickly prove durability.
Also, the transit agencies can benefit by sharing limited resources. Training sessions can be combined for operators and maintenance staff. Rather than each agency building separate fueling stations at the current high cost, the team can plan for several stations that can be accessed by all the agencies involved. Public relations and informational materials can also be shared.
The ZEBA demonstration program has also been supported through funding and planning by the Metropolitan Transportation Commission (MTC), the Bay Area Air Quality Management District (BAAQMD), CARB, and the FTA NFCBP. This support has included the purchase of 12 new fuel cell buses and new hydrogen fueling facilities.
The results will be reported to CARB at regularly defined intervals. CARB staff will use these results to determine progress toward commercialization and to recommend modifications to the ruling, as necessary, no later than July 2009. The primary drawback of this team approach for the industry, and CARB specifically, is that there will be data from only one technology available. Participation from more manufacturers will be needed to truly understand the status of the industry and allow CARB staff to make recommendations to the Board. For more information on the ruling, see www.arb.ca.gov/msprog/bus/zeb/zeb.htm.
CARB is also contributing to demonstrating additional fuel cell buses in Burbank and at SunLine. Although these projects are outside of the FTA’s NFCBP, the bus planned for Burbank is essentially the same design as the NFCBP demonstration project led by CTE and Proterra.
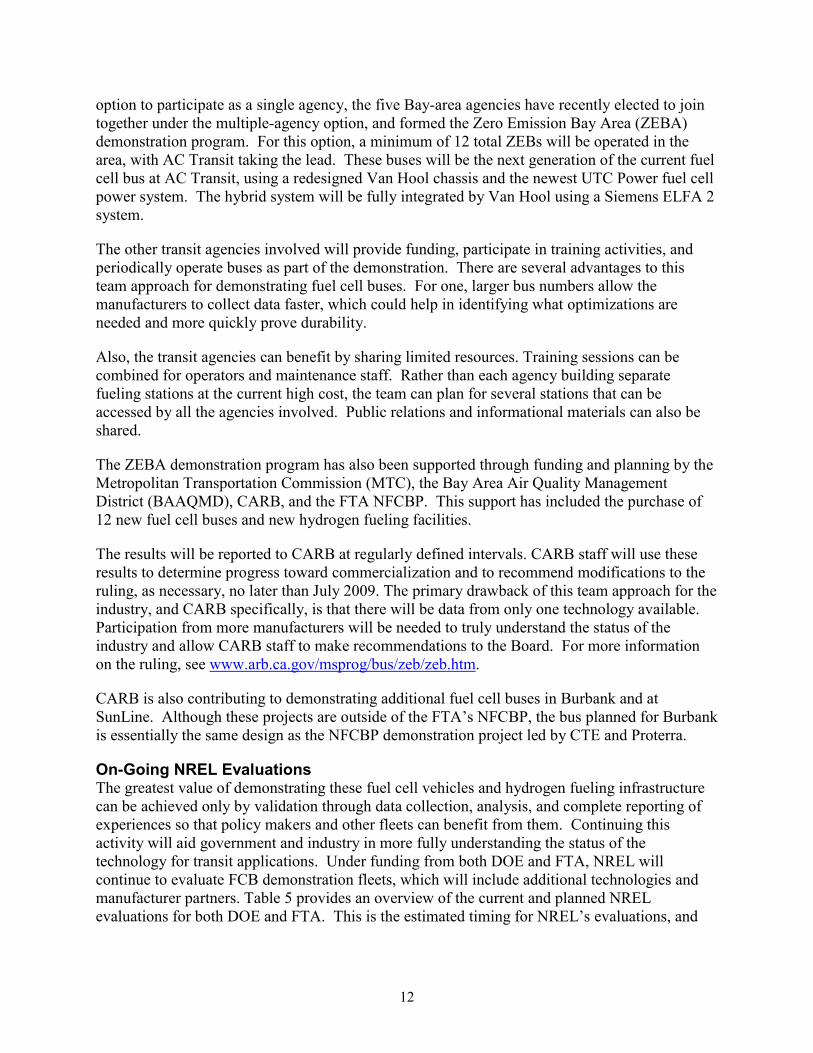
On-Going NREL Evaluations The greatest value of demonstrating these fuel cell vehicles and hydrogen fueling infrastructure can be achieved only by validation through data collection, analysis, and complete reporting of experiences so that policy makers and other fleets can benefit from them. Continuing this activity will aid government and industry in more fully understanding the status of the technology for transit applications. Under funding from both DOE and FTA, NREL will continue to evaluate FCB demonstration fleets, which will include additional technologies and manufacturer partners. Table 5 provides an overview of the current and planned NREL evaluations for both DOE and FTA. This is the estimated timing for NREL’s evaluations, and
12
does not reflect the early design, development, and construction phase for the buses. The plans for upcoming evaluations are subject to change as each project progresses.
Table 5. Summary of NREL Hydrogen Projects for DOE and FTA 2011
1 2 3 4 1 2 3 4 1 2 3 4 1 2 3 4AC Transit /SF Bay Area CA CA ZEB Advanced Demo 2009SunLine /Thousand Palms CA FCB Ext. ServiceSunLine /Thousand Palms CA Advanced FCB ProjectCTTRANSIT /Hartford CT CTTRANSIT FCB DemoCity of Burbank/Burbank CA BurbankAC Transit /Oakland CA Accelerated TestingSunLine /Thousand Palms CA American FCB DemoCTTRANSIT /Hartford CT CT Hybrid FCB DemoColumbia /Site 2/ CTTRANSIT SC/CT Dual Variable Output Hybrid FCBLogan Airport /Boston MA MA H2 FCB FleetTBD/NY NY Lightweight FCB DemoTBD/NY NY NYPA H2 Powered FCBSFMTA /San Francisco CA FC APU Hybrid
Demonstration sites color coded by geographic area:California
New England Western NY
Southeast South
Eval. Funding
2009 20102008Site/Locations State
DO
E T
ech.
Va
lidat
ion
FTA
Nat
iona
l Fue
l C
ell B
us P
rogr
am
Status of Fuel Cell Transit Buses
As described in the previous report7, there are three steps to the vehicle demonstration, testing, and preproduction phase of the introduction of fuel cell transit bus propulsion technology.
1. Field testing and design shakedown (one to three vehicles)
2. Full-scale demonstration and fleet-ready reliability testing (five to ten or more vehicles at several locations)
3. Limited production (50 to 100 vehicles at a small number of locations)
The current status has not changed much since the last report; these propulsion technologies are clearly in the first step. At this point, we need to be patient while the propulsion and integration as well as the infrastructure are developed. There is much to be excited about in the next two to three years including the FTA NFCBP and the CARB ZEB demonstration, but we will still be just entering the demonstration phase for this technology as multiple-bus demonstrations are started.
The FTA NFCBP will round out much of the research needed for completing step one with the addition of 11 new fuel cell buses at seven sites. The CARB ZEB demonstration is now planned to be concentrated in one area (the Bay-area) and at one transit agency (AC Transit) with three to four other partner transit agencies (a total of 12 new fuel cell buses in one location). This new program at AC Transit is a clear change and progress into step two. There are two additional
7 Fuel Cell Buses in U.S. Transit Fleets: Summary of Experiences and Current Status, September 2007, NREL/TP-560-41967, page 12
13
14
significant fuel cell bus demonstrations internationally at BC Transit in Whistler, Canada and in London. These two demonstrations are however outside of the scope of this assessment.
This new CARB ZEB demonstration has required an enormous amount of funding (transit agency, local, state, and federal funding). This brings to light a clear need for more national-level roadmapping of fuel cell propulsion technology for transit. This has become critical with the upcoming reauthorization of the surface transportation spending legislation, the successor to the current Safe, Accountable, Flexible, and Efficient Transportation Equity Act – A Legacy for Users (SAFETEA-LU), which currently runs through fiscal year 2009.
FTA has spent the last year developing a strategic plan for research related to electric drive systems. The focus of the effort is to improve technologies for transit buses, but includes some planning for rail as well. This Electric Drive Strategic Plan (EDSP) was presented publicly at the American Public Transportation Association (APTA) Annual Meeting and Expo in San Diego, CA in early October 2008. The EDSP identifies research needs in the following technical focus areas:
1. Program Implementation
2. Vehicle Energy Management
3. Electrification of Accessories
4. Bus Design
5. Rail Energy Management
6. Locomotive Design
A significant amount of the effort in the first four areas will support research directly applicable to fuel cell bus development and deployment. Improving hybrid drive, power management systems, fuel cell stack durability, energy storage, and infrastructure issues are major components of vehicle energy management. Broader electrification of accessories will help reduce costs and improve the performance of fuel cell bus components. The goals of the bus design focus area include modifications to the bus chassis to allow room for fuel cell stacks and energy storage systems, as well as decrease weight. Some of the specific projects proposed include: life-cycle cost analysis, large scale demonstration of fuel cell buses, standards development, industry state-of-the-art analysis, and research dissemination.
Other Propulsion Technology Development Experience For background, the development of compressed natural gas (CNG) transit buses has been attempted several times over the years, but the current baseline technology really began by testing one original equipment manufacturer (OEM) engine in 1988. The first preproduction natural gas engine for transit was the Cummins L10-240G, which debuted in 1994. This engine was produced in small numbers (less than 200 engines) and was met with criticism for being low on horsepower and difficult to keep in tune. However, it sparked the successful introduction of our current CNG heavy-duty transit bus8. The first real production CNG engines were not
8 Ten Years of Compressed Natural Gas (CNG) Operations at SunLine Transit Agency, January 2006, NREL/SR-540-39180.
available until model year 2006-20079, and this technology was not really considered mainstream until about the 1998-2000 timeframe. This means that the technology took 10-12 years of development by an actual OEM. During this time, an enormous amount of work was done for market introduction including training development, standards, and technical assistance to the transit agencies and manufacturers.
Another example is the development of diesel hybrid electric transit buses at New York City Transit (NYCT) with one manufacturer (BAE Systems) and at Metro Transit (Seattle) with another (Allison). One hybrid bus was developed and tested at NYCT starting in 1998, and later that year NYCT began testing ten prototype hybrid buses (Orion VI buses)10. NYCT made a decision in 2002 to help jumpstart the development of the hybrid technology by ordering a significant number of diesel hybrid electric transit buses (325 Orion VII buses). These buses were not delivered until 2004. NYCT continues to order and operate diesel hybrid electric buses with a total today (November 2008) of more than 800 buses in service and another 800 buses on order and in delivery.
Metro Transit (Seattle) had a similar experience, with its first hybrid bus being developed and tested between 2002 and early 2003. Metro Transit ordered 235 diesel hybrid electric buses in April 2003 which began delivery in 2004. An evaluation of these buses was published in 200611. Metro Transit has since purchased more hybrid buses for their fleet and continues to report excellent experience. Many would say that diesel hybrid electric buses have reached mainstream and just as many say not quite yet, so this is similar to the commercialization path that CNG buses took (10-12 years).
These two development examples would indicate that fuel cell transit buses are still early in the development cycle, because they are still demonstrating small numbers of buses at a few sites. If the 10-12 years of development is any indication for fuel cell transit buses, then we probably have another four to six years for the first larger orders in the preproduction step.
Additional Comments Regarding Demonstration and Testing One of the issues that surfaced while evaluating these fuel cell transit buses has been a desire to continue operating legacy technology fuel cell buses for durability and reliability studies. On the surface, this is extremely enticing based on the early development stage of this propulsion technology. However, manufacturers are demonstrating these systems to identify issues and make modifications that will lead to a commercial product. This sometimes results in quick changes and updates. The current technology that is being operated, even today, is already obsolete and continued testing may not have a significant impact on the newer products. A retrofit from an old system is not always possible, or in the best interest of the developers.
9 Alternative Fuel Transit Buses: Final Results from NREL Vehicle Evaluation Program, October 1996, NREL/TP-425-20513 and WMATA: CNG Transit Bus Evaluation, April 2006, NREL/TP-540-37626 10 Hybrid-Electric Transit Buses: NYCT Diesel Hybrid-Electric Buses, Final Results, July 2002, NREL/BR-540-32427 and NYCT Hybrid (125 Order) and CNG Transit Buses, Final Evaluation Results, November 2006, NREL/TP-540-40125 11 King County Metro Transit Hybrid Articulated Buses: Final Evaluation Results, December 2006, NREL/TP-540-40585
15
A case in point is the Gillig/Ballard bus design demonstrated at VTA. This design was not hybridized, resulting in lower fuel economy compared to the diesel control buses. The manufacturer (Ballard) has developed the next generation product for heavy vehicle applications; however, a direct retrofit into the existing buses is not possible. The manufacturer reports that the project could be supported with the original design fuel cell system if the agency had the necessary funds and interest. An estimate to convert the fuel cell buses back to a conventional bus was extremely high and not considered possible. VTA has recently entered into a partnership with the other Bay-Area transit agencies to demonstrate the next generation buses in development for AC Transit. Because of this, and the increased cost expected to support the older fuel cell buses, we expect that VTA will retire these buses.
Another example is the Van Hool bus and UTC Power design that is being used at AC Transit, SunLine, and CTTRANSIT. When the next order of buses from Van Hool arrives at AC Transit, the older design will no longer be current or supported. AC Transit intends to retire its three older fuel cell buses and only operate the 12 new fuel cell buses when they arrive. SunLine and CTTRANSIT intend to continue to operate their one fuel cell bus (of the older design) for as long as they can. NREL intends to continue to track and evaluate all of these buses as long as possible. CTTRANSIT also expects to receive up to 4 of the new fuel cell buses from Van Hool and UTC Power.
On a counterpointe, it is extremely important for the developers and funding organizations to understand that there is a need to maximize the current investment. Knowing that the prototype technology may need to change should be taken into account, and the ability of the developers to complete continuous improvement of their prototype technology is extremely important. In this way, the prototype technology can be used as much as possible and maximize the lessons learned. This indicates that the project partners and funding organizations need to understand that funding should be set aside for root cause analysis and incremental improvements of the demonstration technology.
Another issue for NREL is that the current evaluations are only tracking this one Van Hool/UTC Power fuel cell bus design. The VTA evaluation is complete and, as mentioned above, is now a dead end design. We look forward to future fuel cell development of the Van Hool/UTC Power design bus; however, the diversity of manufacturers being introduced as part of the NFCBP is extremely important to evaluating and demonstrating this new propulsion technology for transit applications.
Needs for Continued Success
The needs for continued success identified in this report are essentially the same as last year’s report; however, experiences collected over the last year have led us to re-order, re-emphasize, and expand some or all of the categories.
Bus Performance How well do fuel cell buses meet the needs of a typical transit agency? What developments are needed to move the technology to the next phase of demonstration?
16
Fuel Cell Durability – Great strides have been made toward developing longer lasting membranes and materials for fuel cells. Fuel cell systems using these advanced materials need to be validated in real-world service to prove they can achieve required durability targets and withstand the vibration and shock of transportation applications. Current fuel cell systems for buses are expected to have at least a warranty of 4,000 hours. The expected life of a 40-foot transit bus is 12 years, however many agencies operate buses for longer. To meet these demands, fuel cell systems will need to provide more than 25,000 hours of life. Demonstrating this longevity will take time and continued funding from both government and industry.
Hybrid-Fuel Cell System Optimization, Reliability, and Durability – Hybridization of fuel cell systems for buses has shown an increase in fuel economy of up to two times that of conventional buses. The specific duty-cycle appears to have an effect on the results; therefore the same bus design achieves different results from fleet to fleet. These hybrid systems are more complicated than conventional bus technology, requiring careful integration of fuel cells, energy storage, and computer control. Further optimization could result in better efficiency and increase the durability of the overall system. There is also a need to investigate new designs and advanced components, such as energy storage (for example, lithium ion batteries). Manufacturers are investigating various designs from battery-dominant, plug-in hybrids to fuel cell dominant hybrids. Upcoming demonstrations of these designs will show which of these approaches work best for various applications in transit.
On-Board Hydrogen Storage – Transit buses are often operated for over 20 hours in a day. To meet this schedule without returning to the depot for additional fuel, the bus needs adequate hydrogen storage. This is less of an issue for buses than it is for light-duty vehicles because of the space available on the roof of the buses. Current models of fuel cell buses have around 50 kg of hydrogen stored on-board. The drawback for this is added height and weight. Operating a taller bus can result in issues with clearance of buildings and trees, as well as affect the driveability. Adding excess weight to a bus means potential restrictions to the number of passengers allowed on the bus. Optimized use of hydrogen storage could address both these issues.
Fueling Stations and Hydrogen Source Everyone recognizes the need to demonstrate hydrogen production and fueling stations in parallel with fuel cell vehicle demonstrations. What issues need to be addressed with respect to transit demonstration projects?
Hydrogen Station Coverage – For hydrogen technology to succeed in the market, we need adequate station coverage and full support from energy providers. This has proved to be one of the biggest barriers so far. It’s difficult for an energy provider to sustain interest in a technology without some indication of a near-term profit potential. There is a need to base-load stations to maximize the use and begin to create a business case for energy providers. A hydrogen station with sufficient throughput will also be more efficient. Transitional technologies, such as ICEs fueled by hydrogen or a blend of CNG and hydrogen can help build demand while fuel cells are being validated. Providing station access to other fleets (both heavy-duty and light-duty) is another way to increase use. This is a challenge for most transit fleets because of various issues, such as allowing access to secure areas, training non-agency staff, and potential liability.
17
Hydrogen Station Sizing – Current projects underway involve small numbers of fuel cell buses. The hydrogen stations built to support these projects have been designed with those low numbers in mind. As fuel cell bus demonstrations move into the next development stage, agencies will need to provide larger quantities of hydrogen and be able to fuel multiple buses back-to-back. For projects at new demonstrations sites, this means building stations designed to handle the larger expected throughput. For agencies involved in the early demonstrations, this means finding a way to scale-up current facilities or design and build new ones.
Hydrogen Sources – Today, the most common method for producing hydrogen at low cost is natural gas reformation. For a truly sustainable market, we need to investigate renewable technologies that can produce hydrogen with no pollutants or greenhouse gas emissions. While this may not be cost effective in the near-term, development is needed to determine which solutions can meet future hydrogen demand sustainably.
Preparation for Market Introduction Once fuel cell buses reach the preproduction stage of development, we need to prepare the market for introduction. What steps are needed to accomplish this?
Technology Availability – When transit agencies first began the process of procuring fuel cell buses, availability of the technology was a challenge. Few manufacturers were ready to test a fuel cell bus, and the ones that had developed fuel cell buses already had several projects to monitor and support. This situation has improved over the past few years, in part due to the NFCBP. The funding available from FTA to develop and test the technology has resulted in more manufactures participating in fuel cell bus demonstrations. The projects underway include a variety of design approaches from modifying current bus chassis to purpose-built bus bodies that are designed to efficiently fit fuel cell systems and components.
Fleet Personnel Awareness and Training – To fully implement fuel cell buses into transit, we need to have trained service staff that can work on all aspects of the buses. To date, most demonstration projects have included OEM technicians on-site to diagnose and repair hybrid and fuel cell systems. This is typically true for the first two years of the project, while the buses are under warranty. As the technology moves into the next stage of development, this capability and responsibility will need to be transferred to transit agency staff. A technology will not be fully commercial until this happens. Current demonstration projects have begun working toward that end. Members of the maintenance staff are being trained to handle much of the hybrid system troubleshooting and repair and are also assisting in replacing the fuel cell systems. Agencies are also beginning to increase operator training from a small, select group of drivers to training all staff at a depot. This shows positive progress and will help the agency as it begins to implement larger numbers of fuel cell buses.
Continued Data Collection, Analysis, and Reporting – As the technology progresses toward market readiness, we need to continue evaluating the status and reporting the results. Information from third-party objective evaluations must be widely available to be useful to manufacturers, policy makers, and transit agencies. For this to be easily accomplished, the funding for new projects should include the added time and effort needed for project partners to provide this data to the evaluators. The continued use of a standardized protocol for those
18
evaluations is also necessary and will allow comparisons between technologies and demonstration sites. Development of Codes and Standards – Work must continue on completing the development of codes and standards as well as on continuing to support awareness activities for codes officials. Cost When you consider the current high capital cost of fuel cell buses, you may conclude that the number-one priority for these technologies is cost reduction. While this is extremely important for wide-spread adoption and acceptance, we first need to validate that it works and can meet transit agency needs. Purchase price has no impact if the technology cannot do the required work. Once fuel cell bus designs have proven performance and durability, then the industry can investigate ways to bring down the cost of the buses and replacement components. As with all developmental technologies, larger order quantities will spur the market and help manufacturers develop low cost manufacturing techniques. AC Transit’s recent order of fuel cell buses included more units (12), which has resulted in a reduced price. The industry will also need to investigate ways to bring down operational costs.
19
References
All NREL hydrogen and fuel cell–related evaluation reports can be downloaded from the following Web site: www.nrel.gov/hydrogen/proj_fc_bus_eval.html
General NREL (2008). Hydrogen and Fuel Cell Transit Bus Evaluations, Joint Evaluation Plan
for the U.S. Department of Energy and the Federal Transit Administration. NREL/MP-560-42781. Golden, CO: National Renewable Energy Laboratory.
Eudy, L.; Chandler, K.; Gikakis, C. (2007). Fuel Cell Buses in U.S. Transit Fleets: Summary of Experiences and Current Status. NREL/TP-560-41967. Golden, CO: National Renewable Energy Laboratory.
AC Transit Chandler, K.; Eudy, L. (2007). Alameda-Contra Costa Transit District (AC Transit), Fuel
Cell Transit Buses: Third Evaluation Report and Appendices. NREL/TP-560-43545-1, NREL/TP-560-43545-2. Golden, CO: National Renewable Energy Laboratory.
Chandler, K.; Eudy, L. (2007). Alameda-Contra Costa Transit District (AC Transit), Fuel Cell Transit Buses: Evaluation Results Update. NREL/TP-560-42249. Golden, CO: National Renewable Energy Laboratory.
Chandler, K.; Eudy, L. (2007). AC Transit, Fuel Cell Transit Buses: Preliminary Evaluation Results. NREL/TP-560-41041. Golden, CO: National Renewable Energy Laboratory.
NREL (2006). AC Transit Demonstrates Three Prototype Fuel Cell Buses. DOE/GO-102006-2286. Golden, CO: National Renewable Energy Laboratory.
CTTRANSIT Chandler, K.; Eudy, L. (2008). Connecticut Transit (CTTRANSIT) Fuel Cell Transit
Buses: Preliminary Evaluation Results. NREL/TP-560-43847. Golden, CO: National Renewable Energy Laboratory.
NREL (2008). CTTRANSIT Operates New England’s First Fuel Cell Hybrid Bus. DOE/GO12008-2529. Golden, CO: National Renewable Energy Laboratory.
SunLine NREL (2008). SunLine Begins Extended Testing of Hybrid Fuel Cell Bus.
DOE/GO12008-2610. Golden, CO: National Renewable Energy Laboratory.
Chandler, K.; Eudy, L. (2008). SunLine Transit Agency, Hydrogen-Powered Transit Buses: Third Evaluation Report and Appendices. NREL/TP-560-43741-1, NREL/TP-560-43741-2. Golden, CO: National Renewable Energy Laboratory.
Chandler, K.; Eudy, L. (2007). SunLine Transit Agency, Hydrogen-Powered Transit Buses: Evaluation Results Update. NREL/TP-560-42080. Golden, CO: National Renewable Energy Laboratory.
Chandler, K.; Eudy, L. (2007). SunLine Transit Agency, Hydrogen-Powered Transit Buses: Preliminary Evaluation Results. NREL/TP-560-41001. Golden, CO: National Renewable Energy Laboratory.
20
21
NREL (2006). SunLine Expands Horizons with Fuel Cell Bus Demo. DOE/GO-102006-2287. Golden, CO: National Renewable Energy Laboratory.
Santa Clara VTA Chandler, K.; Eudy, L. (2006). Santa Clara Valley Transportation Authority and San
Mateo County Transit District, Fuel Cell Transit Buses: Evaluation Results. NREL/TP-560-40615. Golden, CO: National Renewable Energy Laboratory.
NREL (2005). VTA. SamTrans Look into Future with Bus Demo. DOE/GO-102005-2147. Golden, CO: National Renewable Energy Laboratory.
F1147-E(10/2008)
REPORT DOCUMENTATION PAGE Form Approved OMB No. 0704-0188
The public reporting burden for this collection of information is estimated to average 1 hour per response, including the time for reviewing instructions, searching existing data sources, gathering and maintaining the data needed, and completing and reviewing the collection of information. Send comments regarding this burden estimate or any other aspect of this collection of information, including suggestions for reducing the burden, to Department of Defense, Executive Services and Communications Directorate (0704-0188). Respondents should be aware that notwithstanding any other provision of law, no person shall be subject to any penalty for failing to comply with a collection of information if it does not display a currently valid OMB control number. PLEASE DO NOT RETURN YOUR FORM TO THE ABOVE ORGANIZATION.1. REPORT DATE (DD-MM-YYYY)
December 2008 2. REPORT TYPE
Technical Report 3. DATES COVERED (From - To)
4. TITLE AND SUBTITLE
Fuel Cell Buses in U.S. Transit Fleets: Current Status 2008 5a. CONTRACT NUMBER
DE-AC36-08-GO28308
5b. GRANT NUMBER
5c. PROGRAM ELEMENT NUMBER
6. AUTHOR(S) L. Eudy, K. Chandler, and C. Gikakis
5d. PROJECT NUMBER NREL/TP-560-44133
5e. TASK NUMBER H2708200
5f. WORK UNIT NUMBER
7. PERFORMING ORGANIZATION NAME(S) AND ADDRESS(ES)National Renewable Energy Laboratory 1617 Cole Blvd. Golden, CO 80401-3393
8. PERFORMING ORGANIZATIONREPORT NUMBER NREL/TP-560-44133
9. SPONSORING/MONITORING AGENCY NAME(S) AND ADDRESS(ES)
10. SPONSOR/MONITOR'S ACRONYM(S)NREL
11. SPONSORING/MONITORINGAGENCY REPORT NUMBER
12. DISTRIBUTION AVAILABILITY STATEMENT National Technical Information Service U.S. Department of Commerce 5285 Port Royal Road Springfield, VA 22161
13. SUPPLEMENTARY NOTES
14. ABSTRACT (Maximum 200 Words) This report provides results from fuel cell bus evaluations at Alameda-Contra Costa Transit District, SunLine Transit Agency, and Santa Clara Valley Transportation Authority.
15. SUBJECT TERMS AC Transit; VTA; SunLine; Alameda-Contra Costa; Santa Clara Valley; fuel cell bus; transit; bus; fuel cell demonstration; Fleet Transit Administration; FTA; NFCBP; National Fuel Cell Bus Program
16. SECURITY CLASSIFICATION OF: 17. LIMITATION OF ABSTRACT
UL
18. NUMBER OF PAGES
19a. NAME OF RESPONSIBLE PERSON a. REPORT
Unclassified b. ABSTRACT Unclassified
c. THIS PAGE Unclassified 19b. TELEPHONE NUMBER (Include area code)
Standard Form 298 (Rev. 8/98) Prescribed by ANSI Std. Z39.18