nws hydrologic forecasting. functions and relations 2 river forecast center wfo 1wfo 2wfo 3...
Post on 19-Dec-2015
214 views
TRANSCRIPT
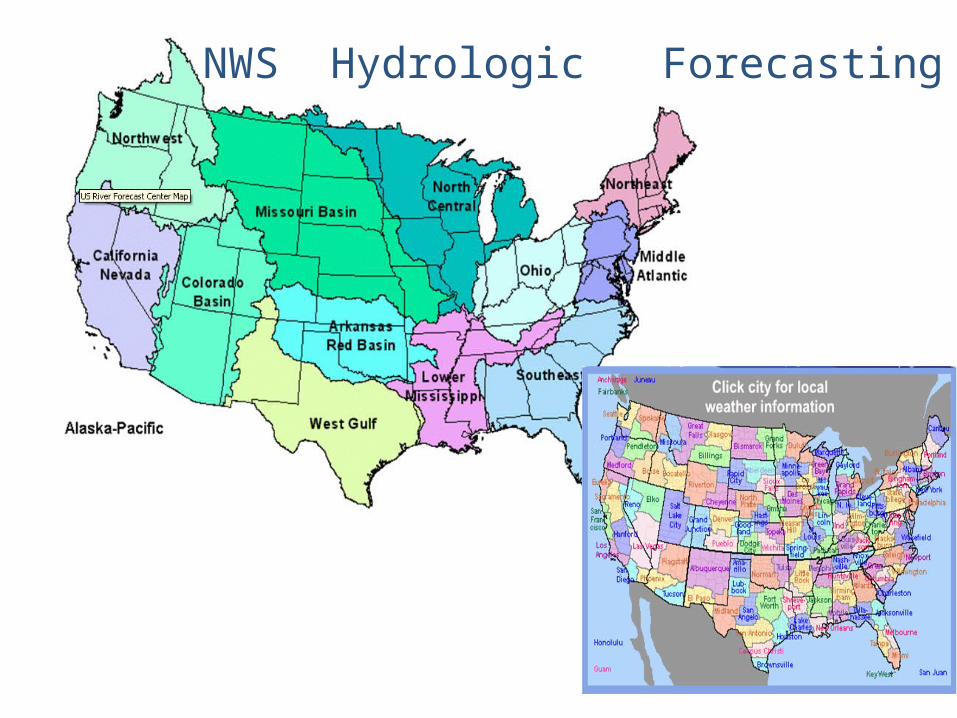
NWS Hydrologic Forecasting
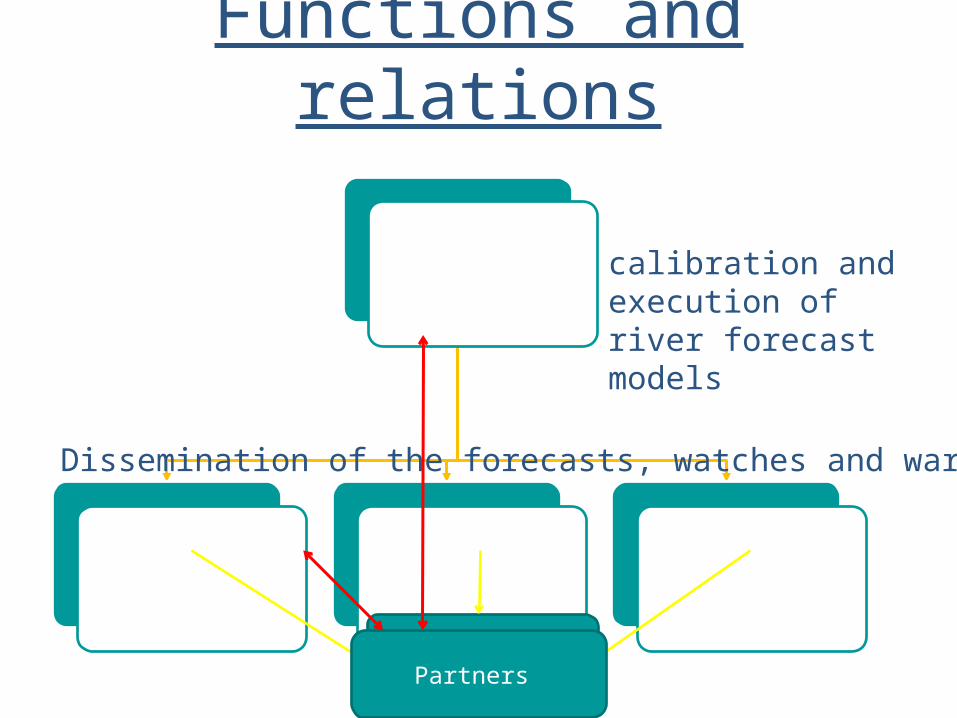
Functions and relations
2
River Forecast Center
WFO 1 WFO 2 WFO 3
Implementation, calibration and execution of river forecast models
Dissemination of the forecasts, watches and warnings
USERSPartners
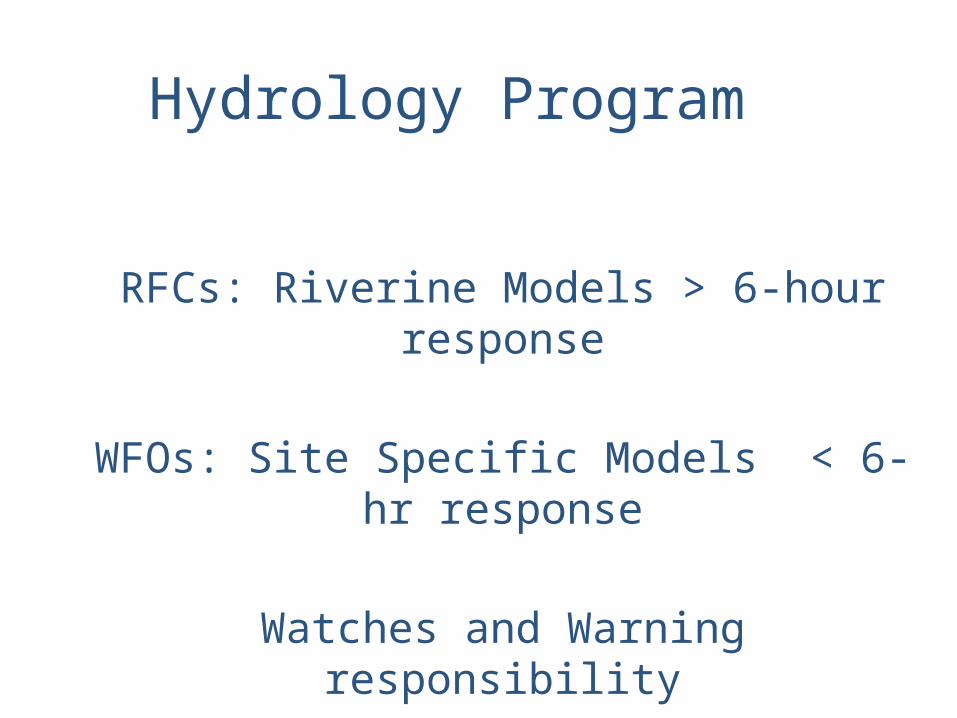
Hydrology Program
RFCs: Riverine Models > 6-hour response
WFOs: Site Specific Models < 6-hr response
Watches and Warning responsibilityFFPI FFMP DHM-TF
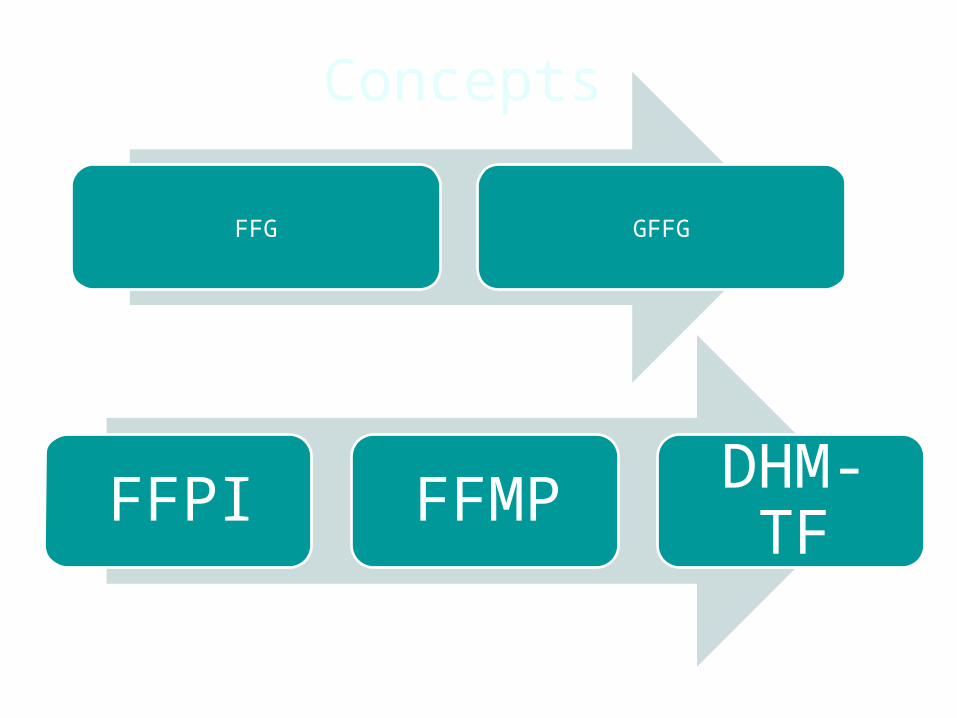
Concepts
4
FFG GFFG
FFPI FFMP DHM-TF

Questions ???
Flash Flood Potential Index
Reggina Cabrera
NOAA/National Weather Service
Eastern Region
Moneypenny Creek Flash Flood – May 2004

FFPI
• Shows areas that you should be concerned, where flash flooding could occur. It is static
7
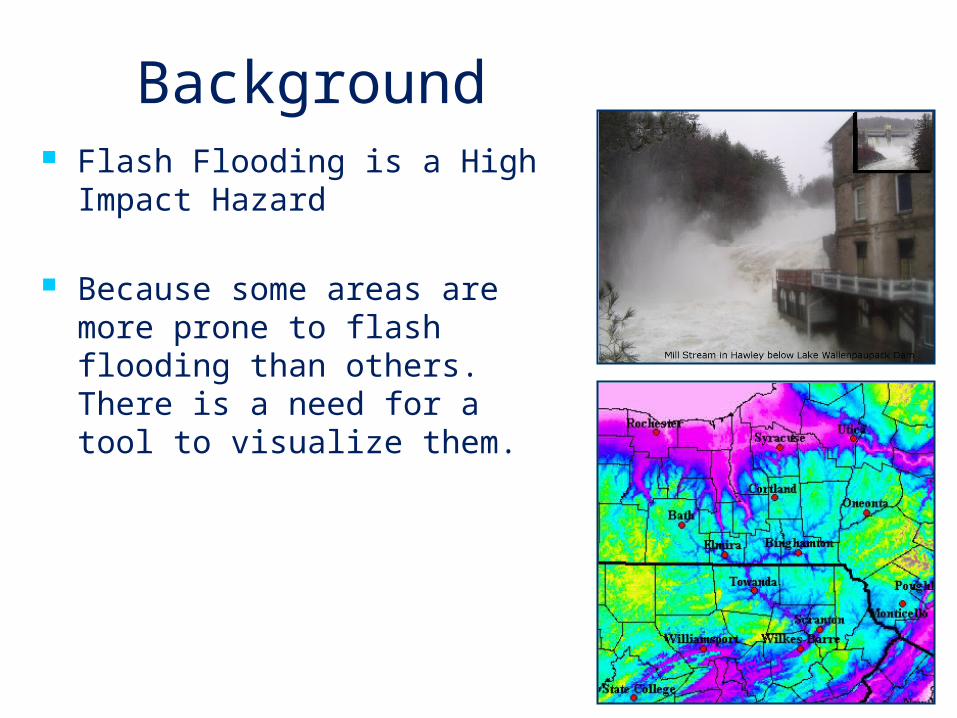
Background Flash Flooding is a High
Impact Hazard
Because some areas are more prone to flash flooding than others. There is a need for a tool to visualize them.
Flash Flood Potential Index (FFPI)
Geographical features play a key role in flash flooding. By using FFPI, the influences of land, vegetation, and urbanization in flash flooding are visualized
Developed as background information to be incorporated into production of better gridded Flash Flood Guidance
“Guesswork” to the flash flood problem is reduced
Methodology
Collected available geographic data sets
Used GIS technology to resample, project and index the data into to a common value
Develop a new geographic index grid…the FFPI
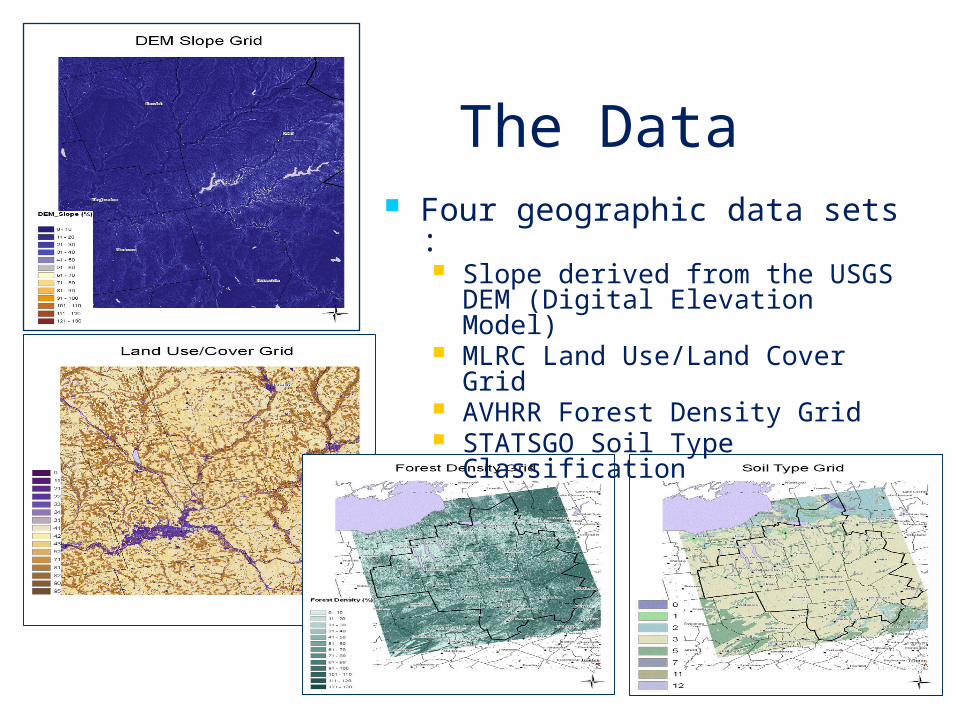
The Data Four geographic data sets :
Slope derived from the USGS DEM (Digital Elevation Model)
MLRC Land Use/Land Cover Grid AVHRR Forest Density Grid STATSGO Soil Type Classification
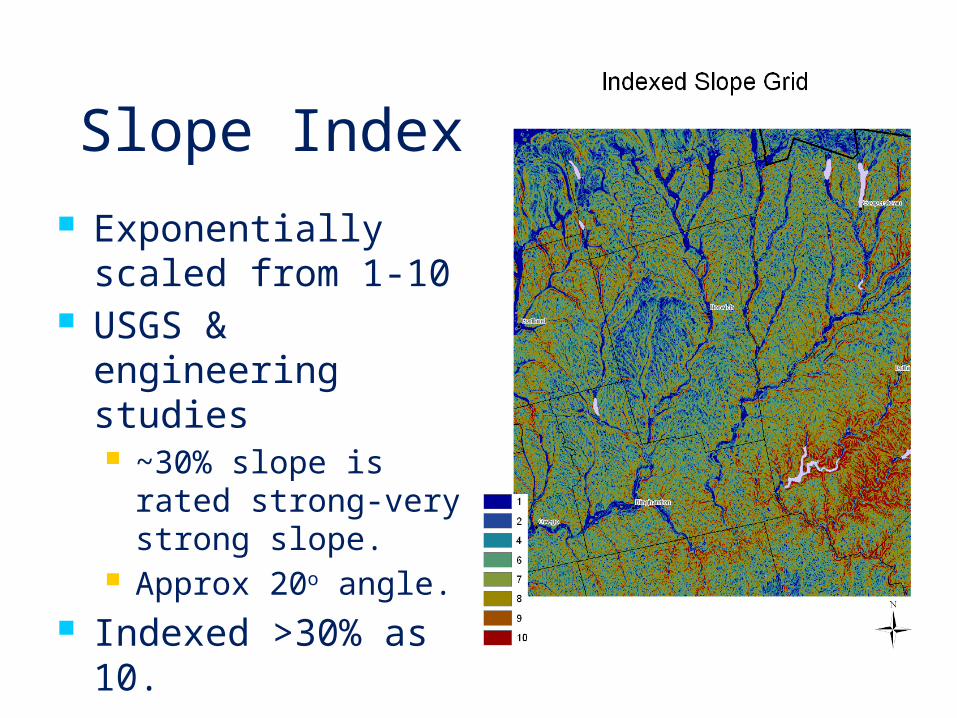
Slope Index Exponentially
scaled from 1-10 USGS &
engineering studies ~30% slope is rated
strong-very strong slope.
Approx 20o angle. Indexed >30% as
10.
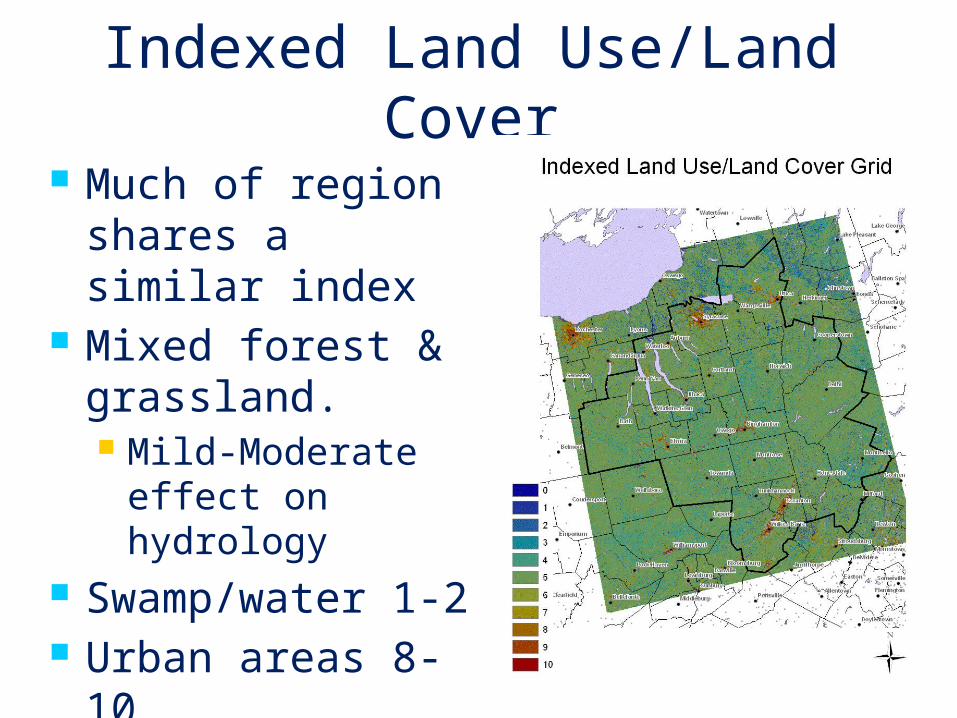
Indexed Land Use/Land Cover
Much of region shares a similar index
Mixed forest & grassland. Mild-Moderate
effect on hydrology
Swamp/water 1-2 Urban areas 8-10
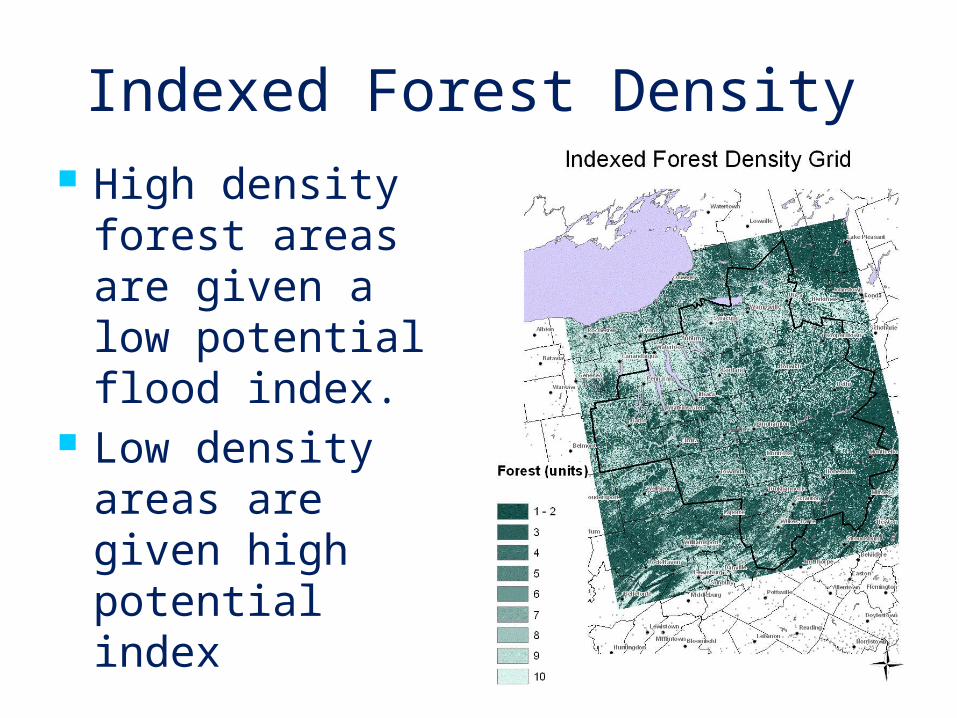
Indexed Forest Density High density
forest areas are given a low potential flood index.
Low density areas are given high potential index.
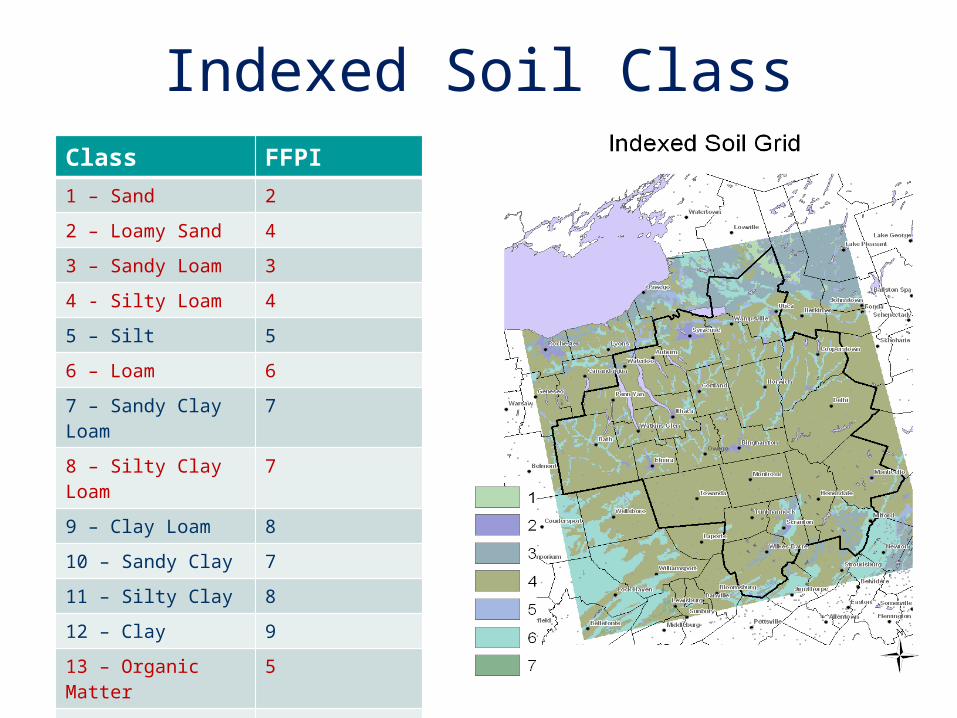
Indexed Soil ClassClass FFPI1 – Sand 2
2 – Loamy Sand 4
3 – Sandy Loam 3
4 - Silty Loam 4
5 – Silt 5
6 – Loam 6
7 – Sandy Clay Loam
7
8 – Silty Clay Loam 7
9 – Clay Loam 8
10 – Sandy Clay 7
11 – Silty Clay 8
12 – Clay 9
13 – Organic Matter
5
14 – Bedrock 10
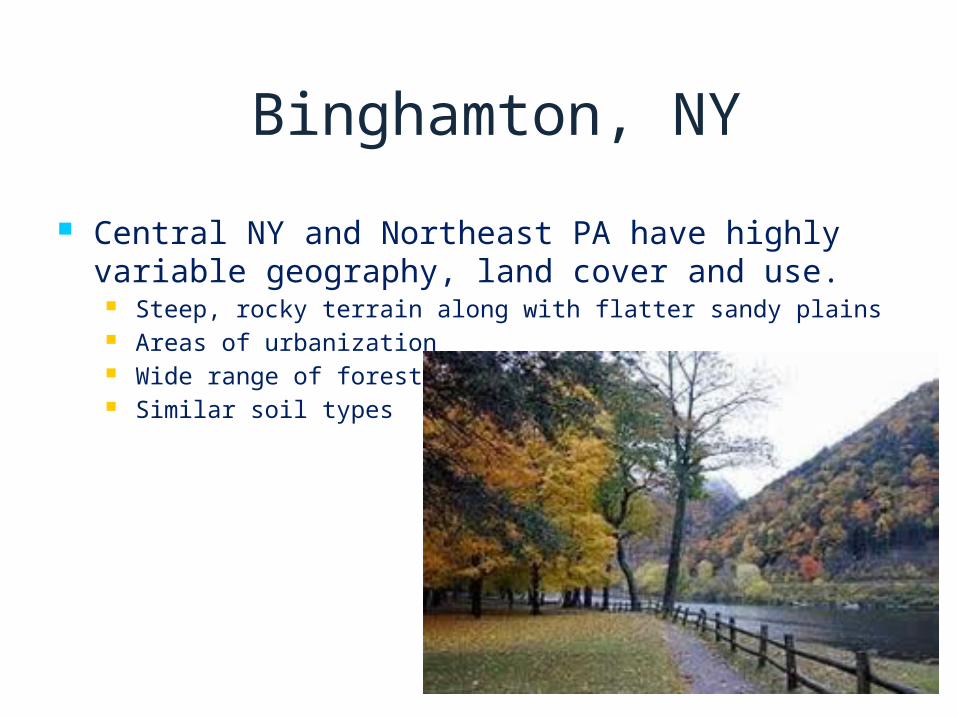
Binghamton, NY
Central NY and Northeast PA have highly variable geography, land cover and use.
Steep, rocky terrain along with flatter sandy plains Areas of urbanization Wide range of forest cover Similar soil types
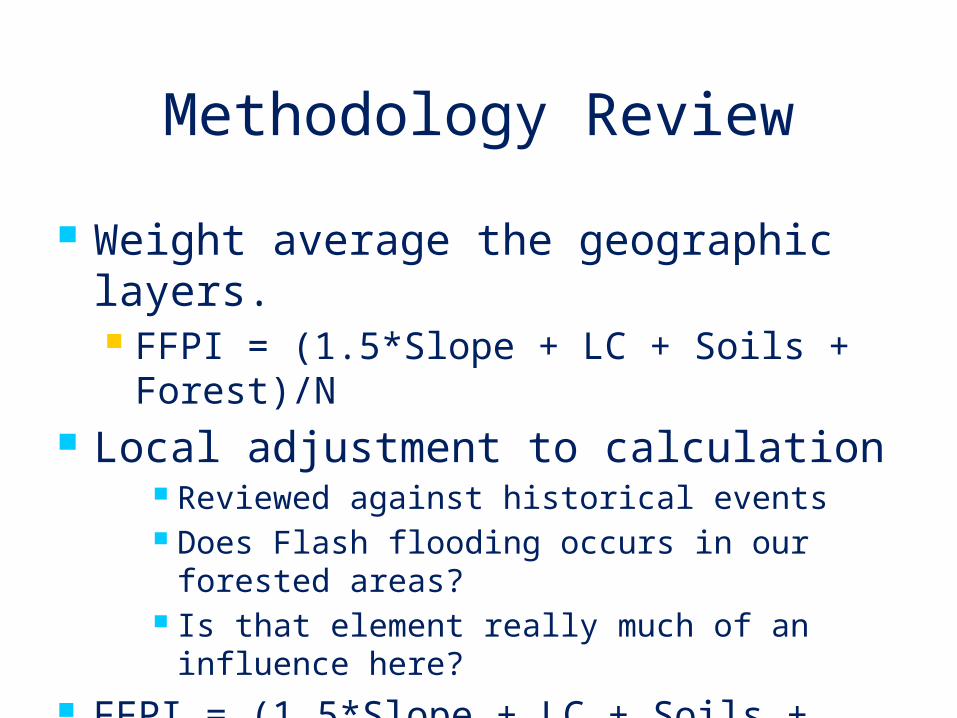
Methodology Review
Weight average the geographic layers. FFPI = (1.5*Slope + LC + Soils +
Forest)/N Local adjustment to calculation
Reviewed against historical events Does Flash flooding occurs in our forested
areas? Is that element really much of an influence
here? FFPI = (1.5*Slope + LC + Soils +
0.5*Forest)/N Grid is then averaged to individual basins.
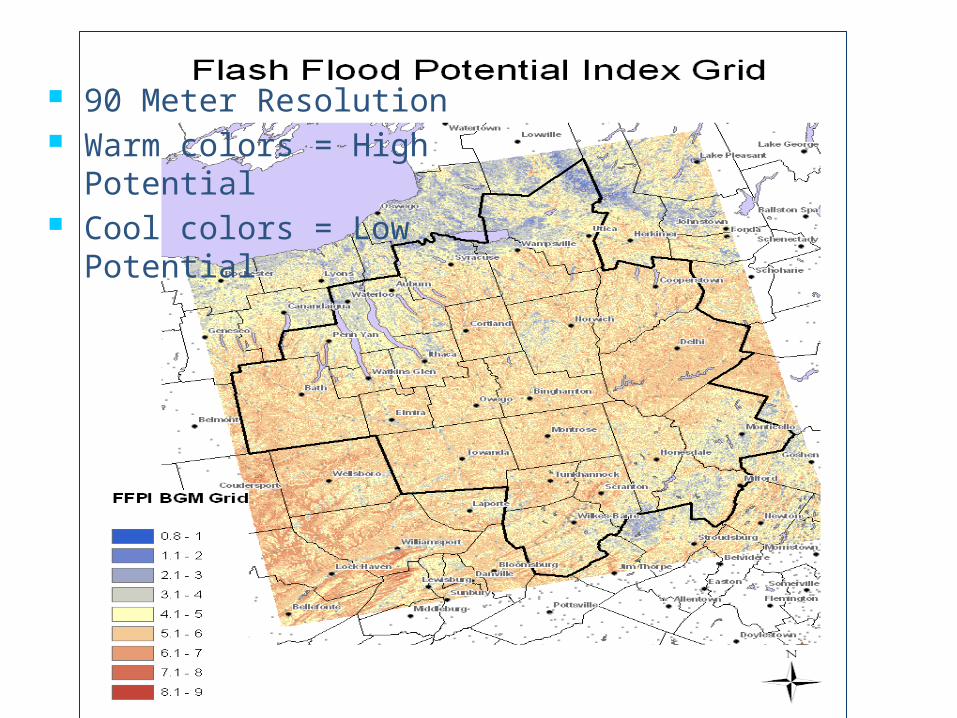
90 Meter Resolution Warm colors = High
Potential Cool colors = Low
Potential
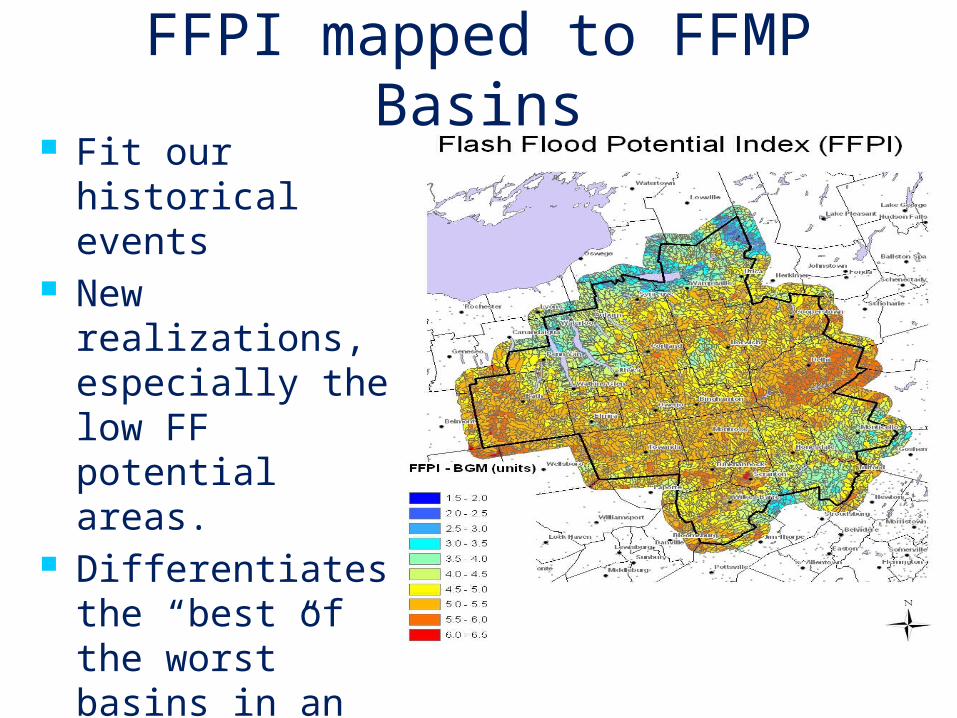
FFPI mapped to FFMP Basins Fit our historical
events New
realizations, especially the low FF potential areas.
Differentiates the “best of the worst” basins in an area generally known for high flash flood potential.
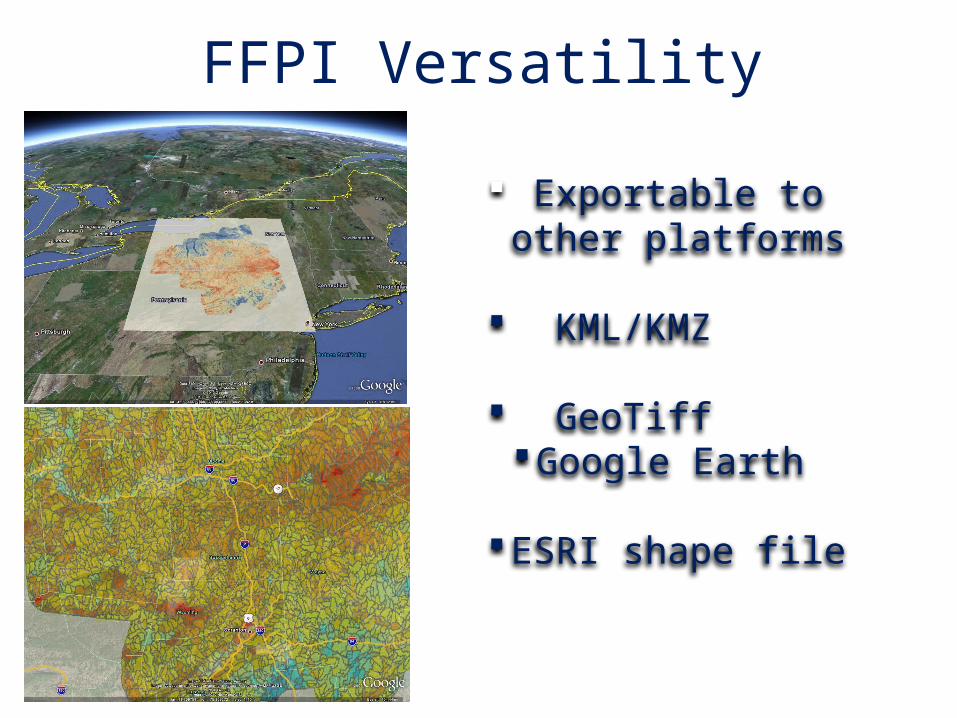
FFPI Versatility
Exportable to other platforms
KML/KMZ
GeoTiffGoogle Earth
ESRI shape file

Example
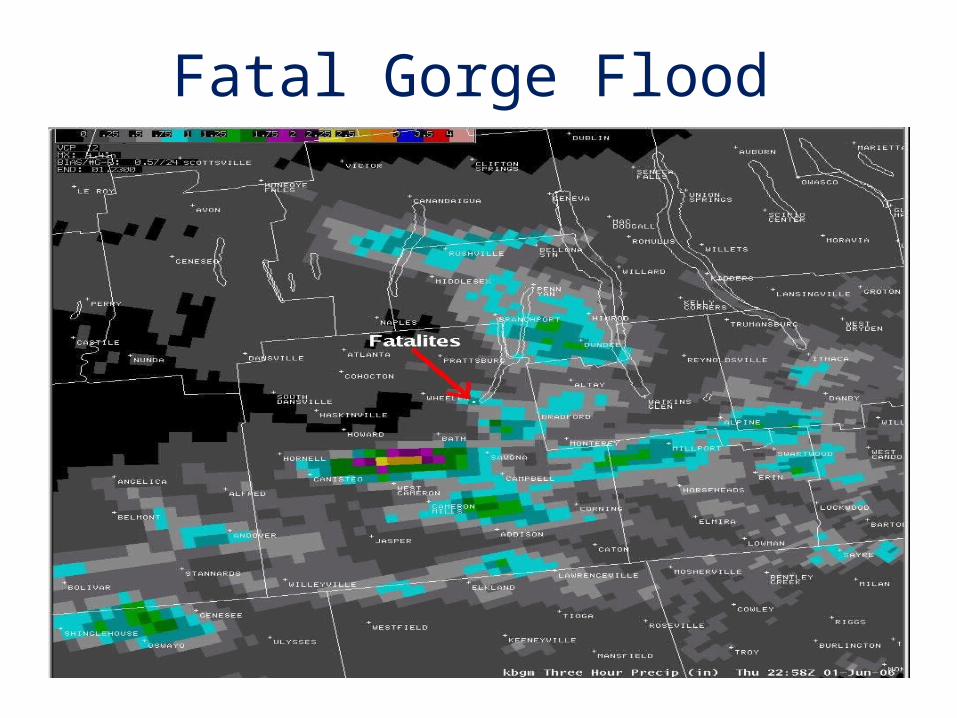
Fatal Gorge Flood
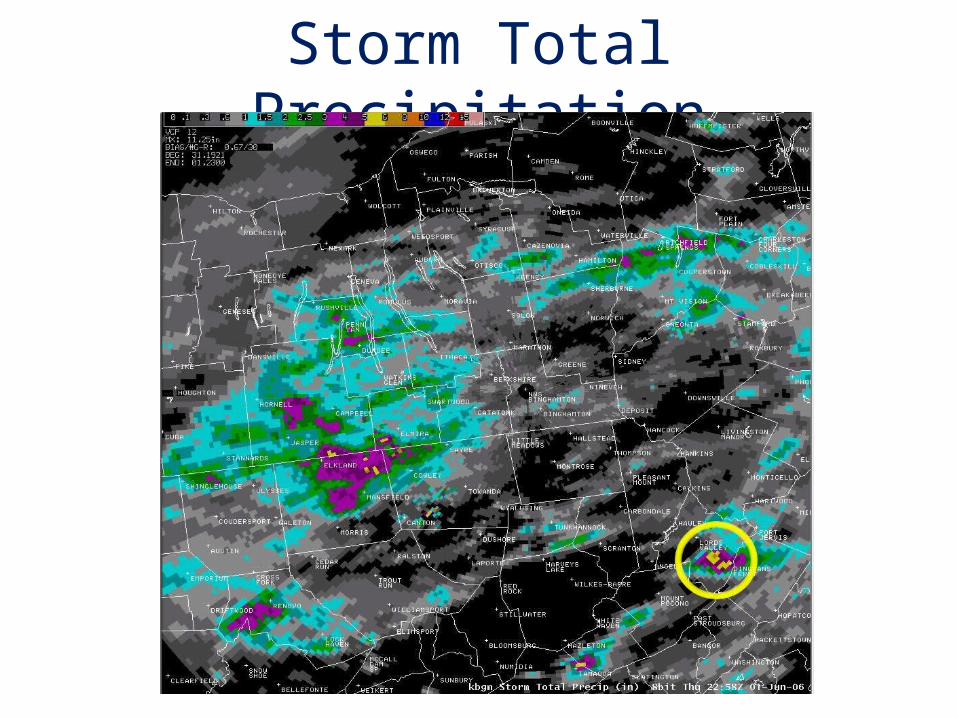
Storm Total Precipitation


90 m - High Resolution
Use of high resolution FFPI in a GIS environment can benefit emergency managers, planning boards, town highwaydepartments, and other local officials and groups.
Glen Brook Fatalities
Summary The FFPI was developed in Binghamton due to the
important need to have a static geophysical reference grid which better illustrates how local earth system features contribute to flash flooding.
The FFPI is best used in flood operations when mapped to the AWIPS FFMP basins for comparison with other flash flood tools and techniques.
Through GIS technology, the index can be exported to many formats for use by other government agencies, customers and partners for planning and mitigation.
Questions ?
Reduced false alarms Two warnings - Pike County, PA and Oneida
County, NY were not issued. Follow-up confirmed no flooding
Increased Lead Time Boosted forecaster confidence that additional
rain would lead to flash flooding (Warn on Forecast) –Major flash flooding resulted in Delaware County, NY
First Year Performance