october 2016 monthly ridership report
TRANSCRIPT
October 2016 Monthly Ridership Report Ridership Summary I Executive Summary I Local Bus I Red Routes I Blue Routes I Green Routes I Other Routes I
Community Connector I Ught Rail I Park & Ride
Note: For optimal results, we recommend you view this website with the most current Web browsers.
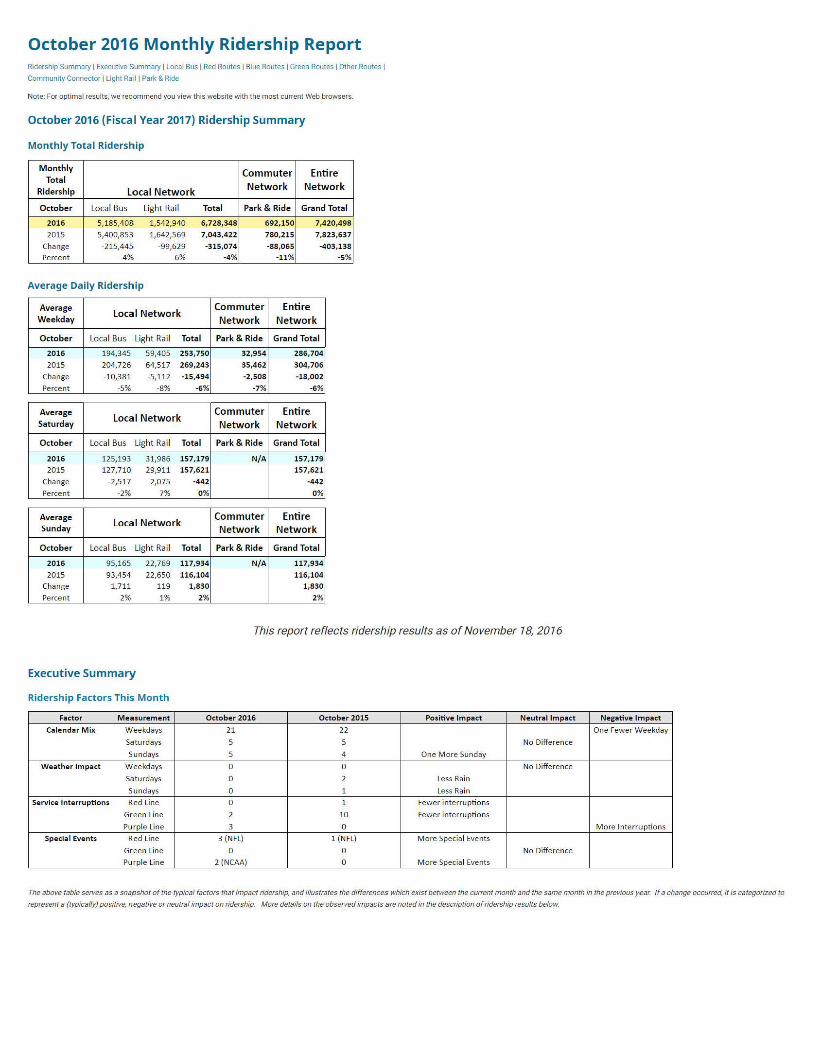
October 2016 (Fiscal Year 2017) Ridership Summary
M onthly Total Ridership
Monthly Commuter Entire
Total Network Network Ridership Local Net work
October Local Bus Light Rai l Total Park & Ride Grand Total
2016 5,185,408 1,542,940 6,728,348 692,150 7,420,498
2015 5,400,853 1,642,569 7,04 3,422 780, 215 7, 823,637
Change -215,445 -99,629 -315,074 -88,065 -403,138
Percent -4% -6% -4% -11% -5%
Average Daily Ridership
Average Local Net work
Commuter Entire Weekday Network Net work
October Local Bus Light Rail Total Park & Ride Grand Total
2016 19 4,345 59,405 253,750 32,954 286,704
2015 204,726 64,517 269,243 35,462 304,706
Change -10,381 -5,112 -15,494 · 2, 508 ·18,002
Percent -5% -8% -6% -7% -6%
Average Local Network
Commuter Entire Saturday Net work Network
October Local Bus Light Rail Total Park & Ride Grand Total
2016 125,193 31,986 157,179 N/A 157,179
2015 127,710 29,911 157,621 157,621
Change -2,517 2,075 -442 -442
Percent -2% 7% 0% 0 %
Average Local Net work
Commuter Entire Sunday Network Network
October Local Bus Light Rail Total Park & Ride Grand Total
2016 95,165 22,769 117,934 N/ A 117,934
2015 93,454 22,650 116,104 116,104
Change 1,711 119 1,830 1,830
Percent 2% 1% 2% 2%
This report reflects ridership results as of November 7 8, 207 6
Executive Summary
Ridership Factors This Month
Factor I Measurement
Calen dar M ix Weekdays
Sa turdays
Sundays
Weat h er Impact Weekdays
Saturdays
Sundays
Service Interruptions Red Line
Gr een Line
Purple line
Special Events Red Line
Green Line
Purple Line
October 2016 October 2015 Positive Impact Neutr al Impact
21 22
5 5 No Difference
5 4 One M ore Sunday
0 0 No Difference
0 2 Less Rain
0 1 Less Rain
0 1 Fewer interruptions
2 10 Fewer interruptions
3 0
3 (NFL) 1 (N FL) More Specia l Events
0 0 No Diffe rence
2 (NCAA) 0 More Specia l Events
Negative Impact
One Fewer Weekday
M ore Interruptions
The above table serves as a snapshot of the typical factors that impact ridership, and illustrates the differences which exist between the current month and the same month in the previous year. If a change occurred, it is categorized to
represent a (typicafly) positive, negative or neutral impact on ridership. More details on the observed impacts are noted in the description of ridersMp results below

Local Network Overview
Local Bus
Monthly Total
There were 5,185K boardings in October 2016 compared to 5,401 K in October 2015, a decrease of -21 SK boardings (or 4 percent decrease) on local bus service. An unfavorable calendar m ix of one fewer weekday and one more Sunday
relative to the previous year cont ributed to ridership loss.
Average Daily Ridership: Weekday/ Saturday/ Sunday
Average daily ridership decreased on Weekday and Saturday. Weekday average daily ridership decreased by -lOK boardings (or 5 percent decrease), Saturday average daily ridership decreased by -3K boardings (or 2 percent decrease)
in October 2016 compared to 2015. One year after implementat ion of the New Bus Network, ridership growth cont inues on Sunday. Average daily ridership increased by +2K boardings (or 2 percent inc rease)
Light Rail
Monthly Total
There were 1,543K boardings on all t hree light rail lines in October 2016, compared to 1,643K boardings in October 2015, a decrease of -1 OOK boardings (or 6 percent decrease). Red line ridership was down 8% over October 2015 while
Purple line ridership increased by 19% relat ive to the previous year. Green line ridership increased by a modest t wo percent over October 207 5. The continued economic downturn in the Hous·ton area and an unfavorable calendar mix of
one fewer weekday and one more Sunday relative t o the previous year contributed to the ridership loss.
Average Daily Ridership: Weekday/ Saturday/ Sunday
Average daily ridership on Weekd ay decreased in October 2016 compared to October 201 5 while average daily Saturday and Sunday ridership both increased over the previous year. Weekday average daily r idership decreased by -SK
boardings (or 8 percent decrease). Saturday average daily ridership increased by +2K boardings (or 7 percent increase) while Sunday average daily ridership increased modestly by +OK boardings (less than one percent increase) over
October 2015. The decline in average Weekday ridership is the result of the ridership decline year-to-year on the Red line as both the Green and Purple lines increased over the previous year.
Total Local Network
Monthly Total
There were 6,728K boardings in October 2016 compared to 7,043K in October 2015, a decrease of -31 SK board ings (or 4 percent decrease) .
Average Daily Ridership: Weekday/ Saturday/ Sunday
Average daily ridership decreased on Weekday and Saturday, w ith Sunday increased on total local network in October 2016 compared to 2015. Weekday average daily ridership decreased by -15K boardings (or 6 percent decrease),
Saturday average daily ridership decreased by -OK boardings (or approximately 1 percent decrease), and Sunday average daily ridership increased by +1 K (or 2 percent increase).
Commuter Network Overview
Park & Ride
Monthly Total
There were 650K Park & Ride board ings in October 2016 compared to 780K boardings in October 201 5, a decrease of -730K boardings (or 17 percent decrease).
Average Daily Ridership: Weekday
Average weekday ridership in October 2016 was 31 K boardings compared to 35K boardings October 2015 a decrease of ·4K boardings (or 13 percent decrease). According to the most recent Origin-Destination Survey, more t han 94%
of all Park and Ride trips are work-based trips. The increase in unemployment is a major cont ributor to the decrease in ridership.
Entire Network Summary
Monthly Total
There were 7,378K boardings on the entire fixed-route network in October 2016 compared to 7,824K in October 2015, a decrease of -445K boardings (or 6 percent decrease). Relevant factors were noted earlier and are included in the
table above.
Average Daily Ridership: Weekday/ Saturday/ Sunday
Average daily ridership for the entire fixed-route network increased on Sunday, with Weekday and Saturday showing a decreased. Weekday daily ridership decreased by-20K boardings (or 7 percent decrease), Saturday daily ridership
decreased by-OK boardings (or approximately 1 percent decrease), and Sunday daily r idership increased by +2K (or 2 percent increase).
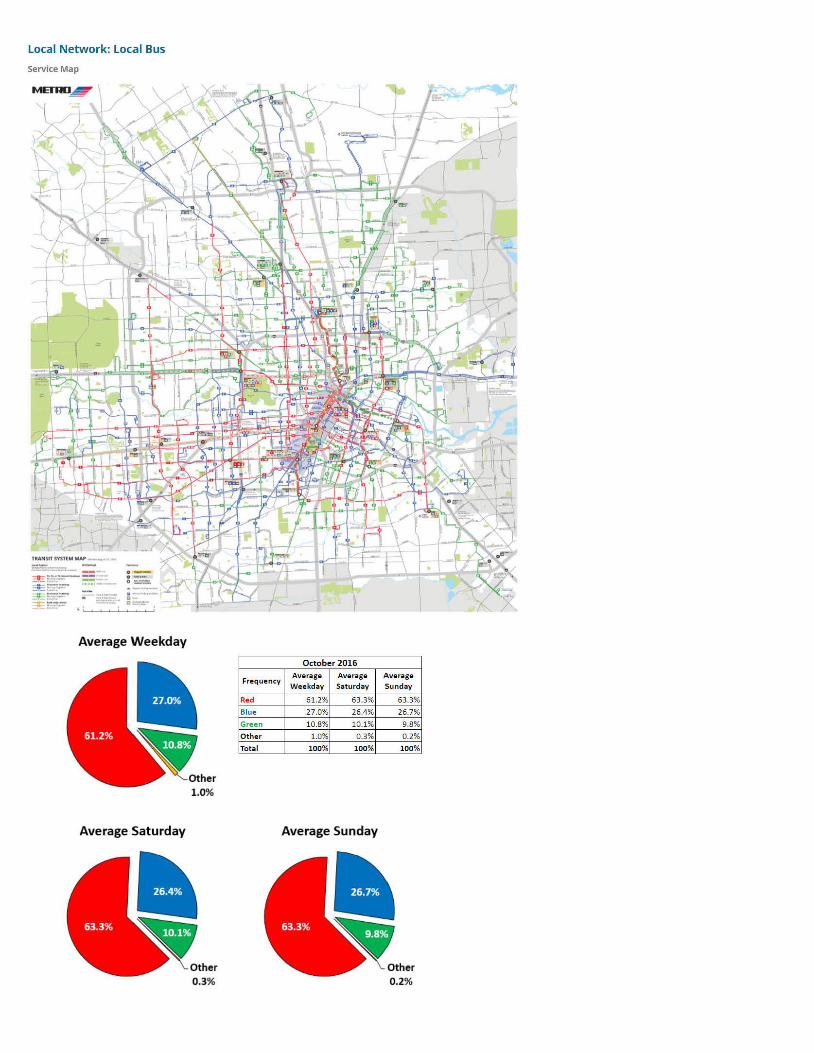
Local Network: Local Bus
Service Map
TllANSIT SYffEM ~
~;=;:-:::-. ~ =-:.,... -:-::;:~
-• -. -·-0 =---= . ... ,_ . D ,=. '
Average Weekday
Average Saturday
Other 1.0%
Frequency
Red
Blue
Green
Other
Total
October 2016 Average Average
Weekday Saturday
61.2% 63.3%
27.0% 26.4%
10.8% 10.1%
1.0% 0.3%
100% 100%
Average Sunday
Average
Sunday
63.3%
26.7%
9.8%
0.2%
100%
Other 0.2%

Red Routes (15 Minute Off-Peak Service)
Average Daily Ridership & Performance Indicators
October 2016 Weekday
Red Routes
Saturday Sunday
# Route Average Board ings per Board ings per Average Boa rd ings per Board ings per Average Board ings per Bo ardings p er
Boardin gs Revenu e Hour Reve nue Mile Boardings Rev enue H our Reve n ue M ile Bo a rd ings Rev e nue Hour Re ve nue Mile
2 Bel la ire 7,277 28.80
4 Beechnut 8,714 28.25
25 Richmond 7,012 24 .03
26 Long Po int/ Cavalcade 4,187 25.33
27 Shepherd 2,628 16.74
33 Post Oak 2,207 15.42
40 Telephone / He ights 4,661 24.36
41 Kirby / Polk 1,307 13.09
46 Gessner 6,710 32.06
50 Broadway 2,856 19.62
51 Hardy - Kelley 1,0 15 18.86
52 Hardy - Ley 2,522 22.91
54 Scott 6,311 35.60
56 Air line / Montrose 5,923 22.97
63 Fondren 4,490 31.70
65 Bissonnet 7,064 31.79
73 Bellfort 5,164 38.19
80 M LK / Lockwood 4,917 21.05
82 Westhe im er 12,238 26.06
85 Antoine / Wash ingto n 6,668 24 .16
137 Northshore Expr ess 3,213 23.41
151 Westpark Express 1,936 19 .32
152 Harwin Express 1,682 23.05
153 Harwin Express 2,417 18.67
160 M emorial City Express 88 8 .91
161 W ilcrest Express 2,847 23.50
162 M emorial Express 1,373 17.14
402 Bel laire Quickline 1,603 19 .86
Total 119,028 24.94
Blue Routes (20 - 30 Minute Off-Peak Service)
Average Daily Ridership & Performance Indicators
October 2016 Weekday
# Rout e Average Boardings per
Boa rd ings Reve nue Hour
6 Jensen / Greens 2,905 25.21
7 W est Airport 1,039 25.02
8 W est Be llfort 2,945 36.51
9 Gulfton / Holman 2,296 24.09
11 Alm ed a / Lyo ns 3,365 20.69
14 Hiram Clarke 1,811 26.48
20 Canal/ Memorial 2,218 17.31
28 OST - Wayside 2,644 26.14
29 Cullen/ Hirsch 3,462 22.75
32 Renwick / Sa n Fe lipe 1,697 14.67
36 Kempwood 2,264 20.06
44 Acres Homes 2,987 17.38
45 Tidwell 4,351 30.35
47 Hillcroft 3,058 27.94
49 Chimney Rock/ S Post Oak 2,800 21.86
60 Cambridge 2,407 26.12
68 Braeswood 2,318 21.12
84 Buffalo Speedway 1,541 12.12
86 FM 1960 / Imperia l Valley 2,629 23.12
89 Dacoma 264 18.57
102 Bush IAH Express 3,381 21.83
Total 52,383 22.40
2.86 5,989 29.82 2.70 4,681 23.36 2.11
2.27 5,301 23.11 1.64 3,934 17.16 1.22
2.15 4,636 20.25 1.78 3,469 15.29 1.33
1.96 3,125 19.78 1.53 2,361 15.06 1.17
1.57 1,950 13.44 1.16 1,477 10.18 0.88
1.61 1,446 11.95 1.20 1,173 9.70 0.98
1.99 2,864 18.76 1.54 2,182 14.30 1.17
1.14 880 9.71 0.89 768 8.47 0.78
2.78 4,827 24.41 2.06 3,443 17.41 1.47
1.48 2,169 19.11 1.41 1,694 14.95 1.10
1.93 613 13.58 1.18 479 10.61 0.92
1.94 1,684 17.69 1.38 1,379 14.49 1.13
3.39 4,168 27.06 2.53 3,025 19.66 1.84
1.75 4,732 20.41 1.58 4,287 19.04 1.43
3.37 3,284 25.32 2.53 2,525 19.89 1.94
2.92 4,596 25.89 2.12 3,269 18.47 1.51
3.23 3,384 31.51 2.64 2,465 22.95 1.92
1.70 3,345 16.18 1.16 2,555 12.82 0.89
2.56 9,563 24.86 2.30 7 ,169 21.21 1.72
1.88 4,165 18.35 1.38 3,208 14.18 1.07
1.58 1,972 19.33 1.31 1,497 14.71 1.00
1.39 N/ A N/ A N/ A N/A N/A N/ A
1.59 933 15.61 1.02 643 10.75 0.70
1.21 1,202 11.82 0.72 835 8.21 0.50
0.59 181 6.47 0.32 159 5.70 0.28
1.54 1,698 16.12 0.86 1,222 11.60 0.62
1.10 494 10.85 0.59 355 7.80 0.42
1.68 N/ A N/A N/A N/A N/A N/A
2.09 79,201 20.63 1.64 60,255 15.98 1.25
Blue Routes Saturday Sunday
Boardings per Average Board ings per Board ings per Average Boardings per Board ings per
Revenue M ile Boardings Revenue Ho ur Revenue M ile Boardings Revenue Hour Reve n ue M ile
2.09 2,027 17.63 1.46 1,685 14.77 1.21
1.89 526 15.65 1.17 408 12.19 0.91
3.09 1,820 24.67 2.18 1,342 18.19 1.61
1.93 1,293 14.18 1.08 883 9.70 0.74
1.74 1,711 14.80 1.15 1,218 10.54 0.8 2
2.06 1,19 1 20.59 1.74 9 13 15.78 1.33
1.44 1,253 14.74 1.14 1,069 12.70 0.98
2.57 1,675 22.75 1.87 1,276 17.31 1.43
1.72 2,587 20.73 1.55 1,868 14.99 1.12
1.61 1,257 13.87 1.19 987 10.89 0.94
1.62 1,279 15.43 1.36 953 14.17 1.01
1.27 2,011 13.40 0.97 1,559 10.69 0.77
2.36 2,994 27.41 2.15 2,275 20.84 1.64
3.15 2,040 23.43 2.23 1,579 18.14 1.72
1.90 1,988 18.09 1.52 1,487 13.54 1.14
3.06 966 17.44 1.96 754 13.61 1.53
1.82 1,291 16.28 1.53 1,067 13.46 1.26
1.28 965 11.66 1.06 779 9.41 0 .86
1.68 1,935 21.90 1.58 1,481 16.82 1.21
2.33 83 5.81 0.73 62 4.39 0.55
1.14 2,176 18.42 0.96 1,738 14.71 0.77
1.84 33,068 17.99 1.42 25,381 13.98 1.09

Green Routes (60 Minute Off-Peak Service)
Average Daily Ridership & Performance Indicators
February 2016 Weekday
# Route Averaee Board ings p er
Boardings Revenue Ho ur
3 Langley 749 23.42
5 Southmore 1,038 22.60
10 Willowbend 660 16 .12
23 Clay - W 43rd 747 19 .67
30 Clint on / Ella 1,232 14.47
39 Katy Freew ay 192 6 .24
48 Market 737 17.21
58 Hammerly 628 16.86
59 Aldine Mail 446 15.82
64 Lincoln City 92 3.49
66 Quitman 600 16.19
67 Dairy Ashford 665 20.53
70 Memo rial 414 12.64
71 Cottage Grove 24 1.62
72 Westv iew 505 17.12
75 Eldridge 749 16 .22
76 Evergreen 1,662 18 .65
77 Homestead 593 15 .01
78 Wayside 532 14.22
79 West Little York 1,393 21.76
83 Lee Road - JFK 497 17.02
87 Sunnyside 966 15.16
88 Sagemo nt 1,081 23.34
96 Veterans M emorial 806 22.75
97 Settegast 601 18 .99
98 Briargate 527 24.81
99 Ella - FM 1960 2,023 29.75
360 Peerless Sh uttle 210 11.29
399 Kuykendahl Shuttle 222 15.08
Total 20,592 17.77
Other Routes
Green Routes Saturday
Board ings per Averaee Boardings p er
Revenue M ile Boardings Revenu e Ho ur
1.62 479 15.54
1 .79 555 16.46
1.58 340 11.66
1.91 462 14 .54
1.21 701 9 .95
0 .54 101 3 .59
1.63 407 11.46
1.49 380 12.55
1.29 367 13.09
0 .34 54 2.04
1.31 350 11.87
2 .25 348 12.80
0 .84 154 6.45
0 .14 30 2.05
1 .26 295 13.30
1.34 377 12.83
1.47 879 17.25
1.38 483 12.25
1.27 439 11.77
1 .73 833 17.65
1.35 354 12.12
1.27 575 12.31
1.97 696 20.59
1.49 662 19.79
1 .24 207 6.65
1.83 294 21.27
2 .03 1,208 24.16
0 .93 135 7 .27
1.41 185 12.56
1.45 12,348 13.18
Average Weekday Ridership & Performance Indicators
Other Routes
Board ings per
Re ve n ue M ile
1.07
1.18
1.17
1.58
0.84
0.36
1.10
1.14
1.06
0.20
0.97
1.58
0 .44
0.18
0 .96
0 .90
1.60
1.13
1.05
1.42
0.96
1.13
1.74
1.30
0.43
1.42
1.63
0.60
1.17
1.09
October 2016 Weekday Saturday
Sunday Averaee Boardings per Board ings per
Boardings Revenue Ho ur Revenue M ile
386 12.52 0 .86
417 12.37 0 .89
245 8.41 0 .84
324 10.21 1.11
467 6.65 0 .56
83 2.94 0 .30
307 8 .80 0 .83
245 8 .08 0 .73
263 9.44 0 .76
21 0 .79 0 .08
243 8 .26 0 .67
264 9 .70 1.20
141 5.92 0 .40
8 0 .57 0 .05
194 8 .76 0 .64
273 9 .28 0 .65
695 13.69 1.26
351 8 .89 0 .82
312 8 .36 0 .74
510 10.81 0 .8 7
266 9 .18 0 .72
401 8 .59 0 .79
470 13.92 1.18
483 14.48 0 .95
162 5 .22 0 .33
213 15.40 1.03
879 17.57 1.18
111 5.94 0 .49
148 10 .03 0 .94
8,880 9.49 0.78
Sunday
# Rout e Average Board in gs p er Board ings per Average Boardi ngs per Board ings per Average Boar d ings per Boar d ings per
Board ings Revenue Hour Revenue M i le Boardings Revenu e Hour Revenu e Mile Board ings Revenue Hour Revenue M ile
108 Veterans Memorial Exp ress 1,084 21.29 1.16 N/A N/A N/A N/A N/A N/A
412 Greenlink 769 18.07 2 .96 N/A N/A N/A N/A N/A N/A
413 Greenlink Orange * N/A N/A N/A 245 5 .54 1.18 145 5.37 1.15
Total 1,853 19.82 1.55 245 5.54 1.18 145 5.37 1.15
~ Route 413: Green/ink Orange only operates on Thursday, Friday, Saturday and Sunday; theref ore an average weekday result is not available
Community Connector
Average Daily Ridership & Performance Indicators
Community Connector Routes October 2016 Weekday Saturday Sunday
# I Rou te Ave rage Boardings p er Board ings per Average Board ings per Board ings per Average Boardings per Boardings per
Board ings Revenue Hour Rev enue M ile Boardings Revenue Hour Revenue M ile Boardings Revenue Hour Revenue Mile
344 IAcres Hom es 130 4.70 0.63 78 2 .83 0.38 47 1.70 0 .23
Total 130 4.70 0.63 78 2.83 0.38 47 1.70 0.23
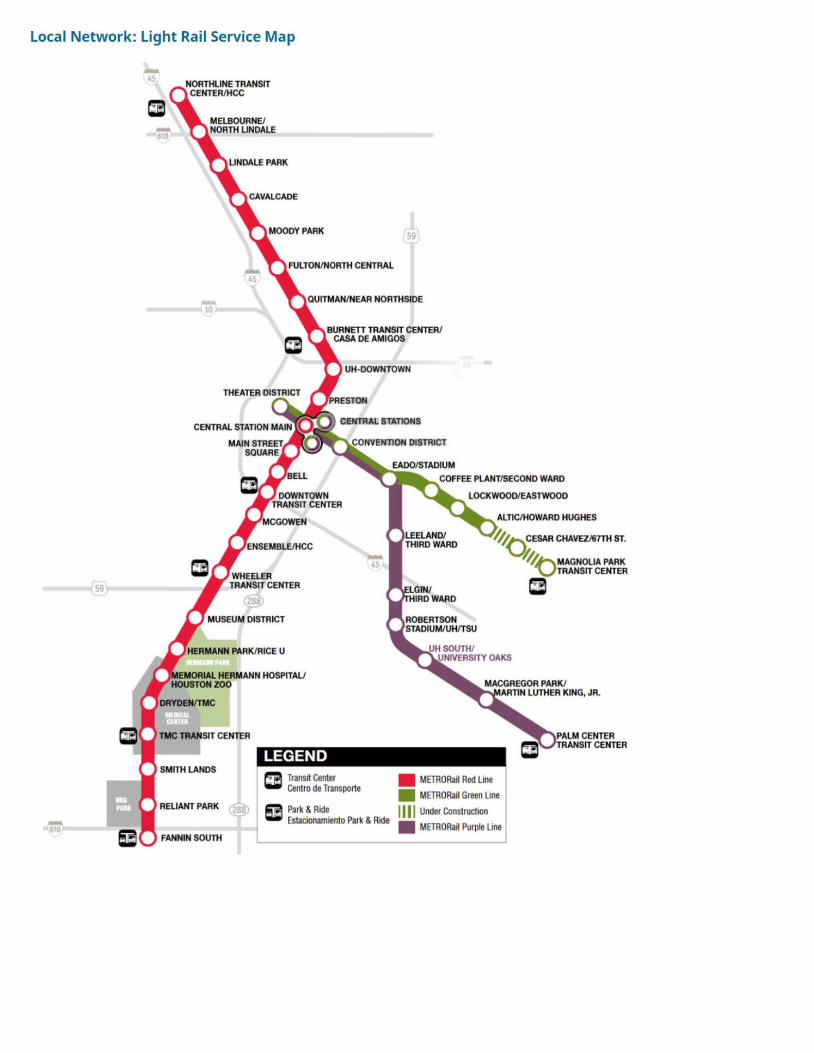
Local Network: Light Rail Service Map
---<sg·,=====
SMITH LANDS
RELIANT PARK
FANNIN SOUTH
QUITMAN/NEAR NORTHSIDE
UH-DOWNTOWN
LEGEND ~ Transit center -' Centro de Transporte
I !5i Park & Ride L Estacionamlento Park & Ride
LEELAND/ THIRD WARD
■ METRORall Red Line
ALTIC/HOWARD HUGHES ~a CESAR CHAVEZ/6TTH ST.
~"""MAGNOLIA PARK 'VTRANSIT CENTER
ca
PALM CENTER TRANSIT CENTER
■ METRORall Green Line
1111 Under Construction
■ METRORall Purple Line

Local Network: Light Rail
Average Daily Ridership
October 2016 Average Boardings I Weekday Saturday Sunday I ........
Northline Transit Center I HCC 2 995 2 183 1 826
Melbourne / North Lindale 258 155 143
Lindale Park 206 130 104
Cavalcade 844 638 420
Moodv Park 496 422 343
Fulton I North Central 1162 797 654
Quitman / Near Northside 923 614 511
Burnett Transit Center I Casa De Amioos 859 419 302
UH-Downtown 1 219 418 242
Preston 3128 1 634 1242
Central Station Main 2 311 1,343 829
Main Street Sauare 3 256 1 755 1256
Bell 1 007 535 382
Downtown Transit Center 3601 1,866 1 556
McGowen 1 493 886 598
Ensemble / HCC 2172 1 056 775
Wheeler Transit Center 3 812 2,274 1 738
Museum District 1 263 672 541
Hermann Park / Rice U 548 646 380
Memorial Hermann Hosoital / Houston Zoo 3 799 971 777
Drvden I TMC 4 996 974 713
TMC Transit Center 3 650 1 442 1 072
Smith Lands 3 404 379 256
Reliant Park 947 668 496
Fannin South 3,415 1,722 1,211
Red Line Total 51 ,764 24,597 18,363 Green Line
Theater District 284 186 150
Central Station 770 661 506
Convention District 158 189 130
EaDo I Stadium 377 413 334
Coffee Plant I Second Ward 200 191 135
Lockwood / Eastwood 563 379 287
Altic / Howard Huahes 403 356 255 Green Line Total 2,755 2,375 1,798
Purple Line Theater District 612 261 163
Central Station 972 884 577
Convention District 180 298 157
EaDo I Stadium 395 763 390
Leeland / Third Ward 144 155 90
Elain / Third Ward 368 320 248
Robertson S tadium / UH I TSU 768 1165 323
UH South I Universitv Oaks 510 305 144
MacGreqor Park / Martin Luther KinQ, Jr. 296 223 162
Palm Center Transit Center 641 640 353
Purple Line Total 4,886 5,01 4 2,607
Red, Green & Purple Lines 59,405 31,986 22,769

Commuter Network: Park & Ride Service Map
Parle & Ride Routes
IH
un 'io'
Commuter Network: Park & Ride
Average Weekday Ridership & Performance Indicators
October 2016 Weekday
# Route Average Boardings per Boardings per
Boardings Revenue Hour Revenue M ile
Peak Period 170 M issouri City 827 23.74 0 .90
202 Kuykendahl 1,881 28.62 1.15
204 Spring 1,428 33.82 1.14
212 Seton Lake 1,047 20.90 0 .94
214 Northwest Station 2,232 30.62 1.02
216 West Little York 541 17.29 0 .69
217 Cypress 2,067 28.66 0 .89
221 Kingsland 3,207 33.58 1.10
222 Grand Parkway 1,264 30.59 0 .98
228 Addicks 2,041 31.58 1.13
236 Maxey Road / Baytown 532 20.80 0 .89
244 Monroe 460 20.17 1.01
246 Bay Area 1,658 23.44 0 .96
247 Fuqua 1,006 33.39 1.51
255 Kingwood 921 20.59 0 .67
256 Eastex 904 33.56 1.20
257 Townsen 1,106 34.75 1.24
261 West Loop 298 15.64 0 .85
262 Westwood 639 19.57 0 .80
265 West Bellfort 2,870 34 .26 1.40
283 Kuykendah l - Greenway/Uptown 320 15.04 0 .65
292 Southwest Corridor - TMC 637 16.76 0 .79
297 Gulf Corridor - TMC 1,053 28.40 1.12
298 Katy Corridor - TMC 1,515 27.03 1.15
Subtotal 30,454 27.40 1.03
Off-Peak 209 North Corridor M idday/Evening 563 19 .62 0 .74
219 Northwest Corridor M idday/Evening 323 15.70 0 .70
229 Katy Corridor Midday/Evening 709 25.24 1.07
249 Gulf Corridor Midday/Evening 411 14.97 0 .69
259 Eastex Co rridor Midday/Evening 258 12.14 0.41
269 Southwest Corridor M idday/Eve ning 236 6.86 0.47
Subtotal 15.58 0.69
--- -·-__ ._.°""' --■•- Of/-°"' ==-~ . ........ 0,,.,,... 0 __ o,_,,..
UH.Ill - ,_ _ _,,,\,,_,._ ....... ,_ ....,. ___ _ _ ... ,_ ...... ___ _ __ .,...OP,\-
~ ::::::=. ..... c..-, -...-
Wlll
69 59
WI
io
/