october 30, 2009 manager of company announcements ... · 10 inspired innovation + business 12...
TRANSCRIPT

Unilife Medical Solutions Limited
Suite 3, Level 11, 1 Chifley Square, Sydney NSW 2000 Australia T +61 2 8346 6500 F +61 2 8346 6511 W www.unilife.com
October 30, 2009 Manager of Company Announcements Australian Stock Exchange Limited Level 6, 20 Bridge Street NSW 2000 By E-Lodgement
Please find attached a copy of the Annual Report for the year ended 30 June 2009 that is being sent to all shareholders that have elected to receive a copy. Any shareholder who would like to review the Annual Report on line can do so by going to www.unilife.com.
—ends—
Shareholder / Analyst Enquiries:
Australia Jeff Carter Phone: + 61 2 8346 6500 United States Stuart Fine Phone: + 1 908 469 1788
About Unilife Unilife Medical Solutions Ltd is an ISO 13485 certified company that designs, develops and supplies innovative safety medical devices. Listed on the Australian Securities Exchange (ASX : UNI) since 2002, Unilife has FDA-registered manufacturing facilities in the US State of Pennsylvania and a proprietary portfolio of clinical and prefilled safety syringes designed for use within healthcare and pharmaceutical markets.
For
per
sona
l use
onl
y

For
per
sona
l use
onl
y

+2 Annual REPORT 2009
CONTENTS
3 Key Results Summary 4 Chairman’s Message 6 Vision of the CEO10 Inspired Innovation + Business12 Inspired Innovation + Products14 Inspired Innovation + Human18 Commercial Strategy for the Ready-to-Fill Syringe 19 PharmaceuticalMarketforPrefilledSyringes20 Industrialisation of the Ready-to-Fill Syringe22 Production and Release of the Unitract 1mL Syringes 24 Business Expansion – Management26 Business Expansion – Corporate
27 Corporate Governance30 Directors’ Report48 Auditor’s Independence Declaration49 Independent Audit Report to the Members51 Directors’ Declaration52 Income Statements53 Balance Sheets54 Statements of Changes in Equity55 Cash Flow Statements56 Notes to the Financial Statements97 ASX Additional Information
For
per
sona
l use
onl
y

Annual REPORT 2009 +3
SummaryOurvisionistobeafinanciallyrobustgloballeader of medical devices that will enhance and save lives.
+ Key Results for the Year + Financial Results
•Total Revenues of A$40,413,706 (2008-2009) an increase of 869% from last year.
•Net Profit after tax of A$12,806,494 (2008-2009) compared to a loss of A$8,617,238 in the previous year.
+ Commercial Agreements
•July 1, 2008.ExclusiveAgreementwithsanofi-aventis:ReceiptofA$16.4m(€10m)feein exchange for the exclusive right to negotiate for the purchase of the Unilife Ready-to-Fill Syringe, and to bear the costs of its industrialisation subject to the signing of the Industrialisation Agreement and the completion of agreed quarterly milestones.
•June 30, 2009.IndustrialisationAgreementwithsanofi-aventis:Commitmenttocompleteand fund the A$30m Industrialisation program for the Unilife Ready-to-Fill Syringe. Retained right to negotiate with other pharmaceutical companies within therapeutic drug classes to be negotiated.
+ Proprietary Products
•Unilife Ready-to-Fill Syringe: Industrialisation Program targeted for completion in late 2010 (one year ahead of the originally-projected schedule) with the receipt to-date of A$17m (€10m)inmilestonepayments.
•Unitract 1mL Syringes: U.S. production commenced on an automated assembly system developed and operated out of Unilife’s FDA-registered manufacturing facility in Pennsylvania. Clearance for U.S. sale and marketing by the FDA.
•Pipeline Products:Significantprogressmadeonadditionalpipelinesafetysyringeproducts targeted for use in healthcare and pharmaceutical markets.
+ Business Expansion •Consolidation of key commercial and operational functions to Unilife’s facility
in Pennsylvania, and the expansion of its world-class team with the appointment of 35 management and professional personnel since July 1, 2008.
•Reviewunderwaytoestablish a major new U.S. production facility with strong support received from the Pennsylvania government.
•Commencement of initial discussions with additional pharmaceutical customers interested in the right to purchase the Ready-to-Fill Syringe.
• Proposed redomiciliation from Australia to the U.S., with a proposed listing on NASDAQ.
AllcurrencyisreflectedinAustralian(A$)dollarsunlessotherwisestated.
For
per
sona
l use
onl
y

+4 Annual REPORT 2009
Dear Shareholders:
Unilife has transitioned itself this year from being a technology company with potential to an industrial medical device manufacturer of substance. In 2005, we began to recalibrate our strategic business plantocapitaliseuponsignificantpharmaceutical interest we had received in our safety syringe technology. We knew that in order to translate this positive pharmaceutical interest into the development of solid business relationships required us to strengthen our operational capabilities and expand our horizons beyond Australia. We have since gone about quietly transforming our business so that it is positioned to become a preferred partner for pharmaceutical companies and other healthcare industry leaders. Two key steps in this recalibrationprocesswerethecertificationofour quality and business management systems to
ISO 13485 in 2006, and the acquisition of the U.S.-based medical device manufacturer Integrated BioSciences Inc (IBS) in 2007. Through these measures, we have been able to successfully validate our credentials in the design, development and production of our products and the automated assembly systems used to manufacture them. Our acquisition of IBS in particular brought in-house a level of engineering knowledge that we consider to be unrivalled for its size in the global medical device industry as well as providing a U.S.-base from which we could build a global business. With Unilife now consistently hitting its key business milestones, attracting world-class people to our team and establishing strategic relationships with global pharmaceutical leaders, I believe the results of our recent efforts are readily apparent.
Chairman’s Message
“ We have now secured the core people, products and partners to achieve our long-term goals.”
+4 Annual REPORT 2009
For
per
sona
l use
onl
y

Annual REPORT 2009 +5Annual REPORT 2009 +5
Thetwoagreementswehavesignedwithsanofi-aventisunderline how we are now emerging as a global leader in thepharmaceuticalmarketforprefilledsyringes. The acceleration of the industrialisation program to a point where we are currently one-year ahead of scheduleconfirmsourbusinessculturedefinedbyteamaccountability, personal integrity and a commitment to milestone delivery. Along the way, we have also generated revenues of A$40 million and an after tax profitinexcessofA$12millionforthelastfinancialyear. Such achievements don’t just happen. It takes a strategic business plan focused on optimising our strength in fostering innovation across all elements of our business. And it takes the commitment of a world-class team and partners which are driven to achieve nothing less than the very best.
We have now secured the core people, products and partners to achieve our long-term goals. From this point forward, we will settle for nothing less than becoming a preferred supplier of best-in-class safety syringes for global pharmaceutical and healthcare industry leaders. While there are still challenges to address, our strong patent position, device design expertise and proven production processes gives us the internal competence tocontinuemovingforwardwithconfidence.Our strategic plan for business expansion and the solid support of our industry partners are also helping us overcome competitive market forces as we continue to approach a position of global leadership status.
Jim Bosnjak OAMChairman
For
per
sona
l use
onl
y

+6 Annual REPORT 2009
The global healthcare industry is rapidly transitioning to the mandatory use of safety syringes to prevent unsafe injection practices, which cost 1.3 million lives annually.
Healthcare workers in the U.S. and Europe alone receive a combined total of 1.6 million needlestick injuries every year, while the reuse, sharing and unsafe disposal of syringes outside healthcare facilities are prime accelerants in HIV and hepatitis C epidemics. In 2000, theU.S.becamethefirstcountrytomandatetheuseofsafety syringes within healthcare facilities. Other markets such as Australia, Canada and Europe are adopting similar laws.
U.S. healthcare facilities have largely complied with this legislation. However, total recorded needlestick injuries amongst U.S. healthcare workers caused by syringes have only been reduced by around half. This suggests that many types of currently available safety syringes may not be adequately protecting healthcare workers from harm. Indeed, safety syringes now cause more reported needlestick injuries in Massachusetts than did standard syringes prior to OSHA enforcement commencing in 2002.
We believe that the healthcare workers and pharmaceutical companies are still awaiting the arrival of products with automatic, fully integrated features which can address their safety and functionality requirements.
Itisourmissiontobecomeafinanciallyrobustglobalprovider of medical devices which can enhance and save lives. To achieve this goal, we have spent over six years building our core business capabilities around the design, production and supply of innovative, world-class safety medical devices.
I believe our results have been excellent to date. We havedevelopedaproprietaryrangeofprefilledandclinical syringes which allows operators to control the rate of automatic needle retraction directly from the body into the syringe barrel where it is locked in place, virtually eliminating the risk of needlestick injury or reuse.
Our competitiveness can best be validated not by the global innovation awards we have won, but by the strong relationshipwehavebuiltwithsanofi-aventis.Thisleading global pharmaceutical company has committed to pay us a total of approximately A$47 million for the Unilife Ready-to-Fill Syringe. This funding comes from the payment of a A$16.4 million fee in return for the exclusive right to negotiate for the purchase of the
Vision of the Chief Executive Officer
+6 Annual REPORT 2009
For
per
sona
l use
onl
y

Annual REPORT 2009 +7
Unilife Ready-to-Fill Syringe, and the provision of A$30 million in payments based on milestones to be achieved under the Industrialisation program. This product is the world’sfirstknownprefilledsyringewithfullyintegratedsafetyfeaturesandcompatiblewithcurrentfillingandpackaging systems.
Astheworld’slargestpurchaserofprefilledsyringes,sanofi-aventishasrecognisedthepotentialofourproduct to minimise costs associated with attaching ancillarysafetyproductsoverstandardprefilledsyringes,while increasing opportunities for competitive product differentiation.InJuly2009,sanofi-aventisagreedto commit itself to complete funding our A$30 million industrialisation program. We are also pleased to have retained the right to market and sell the product to other pharmaceutical companies for use in other therapeutic drug classes to be designated.
This year, we have begun to truly turn our vision for global leadership into business reality. We are currently one year ahead of our originally projected schedule in the industrialisation of the Unilife Ready-to-Fill Syringe. We have also successfully commenced production of our Unitract 1mL Syringes at our facility in Pennsylvania, and secured FDA clearance for their U.S. sale.
To reach this point, we have overcome adversity through passion and teamwork, and forged a business culture driven by personal integrity, group accountability and innovation. To complete our evolution, we are continuing to expand our commercial and operational presence in the U.S. with a proposed listing on NASDAQ, and are building a world-class team and network of industry partners with the expertise to get the job done.
We will remain focused on the delivery of four key goals:theon-timecompletionoftheUnilifeReady-to-Fill Syringe industrialisation program, the successful production and commercial release of our Unitract 1mL Syringes, the continued expansion of our operational capabilities, and the implementation of our corporate investment strategy that will build shareholder value.
As CEO, I am proud to lead this highly capable team and guide our Company in the continued implementation of our strategic business plan. Thank you for this honour.
Alan ShortallChief Executive Officer
Annual REPORT 2009 +7
“ This year, we have begun to truly turn our vision for global leadership into business reality.”
For
per
sona
l use
onl
y

+8 Annual REPORT 2009 +8 Annual REPORT 2009
For
per
sona
l use
onl
y

Annual REPORT 2009 +9
Inspired INNOVATION
Annual REPORT 2009 +9
For
per
sona
l use
onl
y

+10 Annual REPORT 2009
+Inspired INNOVATION + BUSINESS
Our core business strength is our in-house capability to design, develop, validate, manufacture and market innovative medical devices.
+10 Annual REPORT 2009
For
per
sona
l use
onl
y

Annual REPORT 2009 +11
+
OUR Business ModelCompanies seeking to commercialise new products must typically carry significant business risk and committo major capital expenditure before
customer demand is secured. We have reversed this traditional business model with the Unilife Ready-to-Fill Syringe by building a strong relationship with sanofi-aventis where they have paid us an upfront fee for the exclusive right to negotiate for the purchase of the Unilife Ready-to-Fill Syringe. They are also providing us with A$30 million in payments based on milestones to be achieved under the Industrialisation program for the commercialisation of the product. We have thus secured the upfront commitment of the world’s largest purchaser ofprefilledsyringestosupportthesuccessfulcompletionof this project. Having now retained the right to market the product to other pharmaceutical companies for use in therapeuticareasoutsideof thosedesiredbysanofi-aventis, we have also further de-risked our business model.
OUR Expanding TeamWehaveusedtheglobalfinancialcrisistoouradvantageby recruiting more than 35 high-calibre professionals to our team that in many cases would not have otherwise been available. Many of these new staff either came directly from competitors or had the industry background to recognise Unilife’s market potential. Our management team now has an average 20-plus years working with either the type of business we intend to become or the customers we service. Whilst Unilife may still be small in size, we have built the nucleus of a world-class team with the expertise to help us complete our strategic business plan and compete against global industry heavyweights.
OUR Global PartnersIt’s one thing to know what you do well. It’s another thing entirely to know when to outsource something you do well. Unilife has built a core in-house capability around the design, development and validation of innovative medical devices, and the automated assembly systems used to manufacture them. Our decision to outsource the development of the automated assembly systems to manufacture the Unilife Ready-to-Fill Syringe to an establishedindustryspecialistreflectsourunderstandingof the scale of the operational project as well as the significant resourcesrequired to meet projected demand. We are also focused on building strong, flexible supply relationships with anumber of other trusted medical device and pharmaceutical companies.
For
per
sona
l use
onl
y

+12 Annual REPORT 2009
+OUR Core TechnologyWe believe retractable syringes have yet tofulfilltheirpotentialinprotectingthoseatrisk of harm from unsafe injection practices. Many retractable syringe products currently
available are similar in product design and operator performance, with IP litigation taking place among a number of manufacturers. Unilife’s technology is unlike any other known type of retractable syringe product either available or in development. Key competitive differentiators of our retractable syringe technology include the automatic (passive) retraction of the needle, the ability for operators to control the speed of retraction, and the full integration of these safety features within the barrel. Furthermore, weare the first company to present a range of clinical(plastic)andprefilled(glass)formatsyringeswhichsharethe same core safety technology.
OUR Design PhilosophyHaving the right technology is important, but it’s what you do with it that counts. We recognise that developing one producttofitallmarketswilllikelyresultinhavingaproductthat fits none. Every pharmaceutical and healthcaremarket identified byUnilife has specific injection safetyrequirements. Consequently, whilst all Unilife products feature automatic, operator-controlled retraction, each is custom-designed to address the specific safety andfunctionality needs of distinct customer groups. We have taken this design philosophy one step further to ensure the Unilife Ready-to-Fill Syringe is fully engineered for high-volume production from day one.
OUR Production StrategyIn an age where many companies are seeking to send their production offshore, we are proud to be doing the opposite. While Unilife’s relationship with KDL in China has enabled us to secure regulatory approval of our Unitract 1mL Syringes across key international markets, our intent moving forward is to utilise fully-automated assembly systems situated at our U.S. facilities to manufacture the bulk of our products. Our automated assembly systems utilise advanced robotic machinery and digital sensors to help us cost-effectively attain the highest standards in quality and device reliability. To develop, build and operate Unilife’s automated assembly systems, for example, our in-house engineering and production teams have all the core skills and experienced required. For pharmaceutical companies which are entrusting us to provide a primary container device for their therapeutic drugs, we believe production of U.S.-manufactured products is particularly important.
For
per
sona
l use
onl
y

Annual REPORT 2009 +13
Inspired INNOVATIONPRODUCTS +
We are a market-driven company focused on meeting the needs of our customers.
Annual REPORT 2009 +13
+F
or p
erso
nal u
se o
nly

+14 Annual REPORT 2009
We demonstrate our passion to customers, partners, colleagues and ourselves everyday.
+14 Annual REPORT 2009
+Inspired INNOVATION + HUMAN
For
per
sona
l use
onl
y

Annual REPORT 2009 +15
+OUR PassionWe see our Company as one of those rare opportunities to be part of a business with the right mixture of products, people, production processes and planning to truly revolutionise a global industry sector. International healthcare markets are now rapidly transitioning towards the mandatory use of safety syringes to protect those at risk of needlestick injury. Yet healthcare workers and pharmaceutical companies continue to await the arrival of productsofchoicewhichcanfullyaddresstheirspecificinjection safety and functionality requirements. We believe we can capitalise upon these market trends to become a major supplier of best-in-class safety syringes to target healthcare and pharmaceutical markets. Along the way, we hope to enhance and save countless lives—which is something we are very passionate about indeed.
OUR LegacyAccording to the World Health Organisation, more than 1.3 million people die every year from unsafe injection practices. The Occupational Safety and Health Adminis-tration (OSHA) estimates U.S. healthcare workers incur as many as 800,000 needlestick injuries each year. Outside of Africa, the reuse and sharing of syringes are also responsible for up to one-third of HIV cases worldwide and are a prime accelerant in hepatitis C epidemics. Unilife does not offer a magic bullet which can prevent the socio-economic harm caused by unsafe injection practices. However, we believe that the realisation of our strategic business plan can make a significanthumanitarian difference.
OUR CultureIn our staff recruitment process, we always look beyond the resume to determine if a prospective candidate shares the core val-ues which underpin our business culture. These Unilife values are: Transparency, Integrity, Passion, Safety, Teamwork
and Accountability (otherwise known as TIPSTA). Combined, theydefinewhoweareasaCompanyandhow we conduct our business practices. As a small, fast-growing business with an expansive agenda for international market leadership, we encourage all mem-bers of our team to be proactive in identifying areas outside oftheirofficialworktitlewheretheycanmakeaproductivecontribution. Above all, our culture encourages each team member to stand shoulder-to-shoulder and devote the necessary hours to ensure we continue to deliver upon our business milestones.
For
per
sona
l use
onl
y

+16 Annual REPORT 2009 +16 Annual REPORT 2009
For
per
sona
l use
onl
y

Annual REPORT 2009 +17
+Insp i red INNOVATION
Annual REPORT 2009 +17
For
per
sona
l use
onl
y

+18 Annual REPORT 2009
More than 50 injectable drug products, with total sales of morethanU.S.$50billion,arecurrentlyavailableinaprefilledsyringe format. Many pipeline drugs are also targeted for useinaprefilledsyringeformat.Pharmaceuticaldemandforprefilledsyringesexceeds2billionunitsayear,withthemarketgrowingatmorethan10%peryear.Sanofi-aventisistheworld’slargestpurchaserofprefilledsyringes,withMerck, Novartis, Roche, Wyeth and Teva amongst those other major pharmaceutical companies who utilise these productstofillinjectabledrugsandvaccines.
Unilifeenteredintoacollaborativerelationshipwithsanofi-aventis in 2003 for the development of the Unilife Ready-to-Fill Syringe. On July 1, 2008, the Company signed an Exclusiveagreement(theExclusiveagreement)withsanofi-aventis, pursuant to which sanofi-aventis paid Unilife a A$16.4million (€10million) fee for theexclusive right to negotiate for the purchase of the Unilife Ready-to-Fill Syringe.
On June 30, 2009, both parties signed an Industrialisation agreementpursuant towhichsanofi-aventisagreed topro-videUnilifewithA$30million(€17million)inpaymentsbasedon milestones to be achieved under the Industrialisation pro-gram for the Unilife Ready-to-Fill Syringe. Through August 31,2009,UnilifehasreceivedpaymentsofA$17million(€10million) under the Industrialisation program.
Further to a First Amendment signed on June 30, 2009 to the Exclusive agreement, should both parties be able to agree on an exclusivity list of therapeutic drug classes by February 28,2010,thensanofi-aventiswillretainexclusiverightstotheuse of the product within these designated therapeutic drug
classes until July 1, 2014. If both parties are unable to reach anagreementonsuchlistbyFebruary28,2010,thensanofi-aventis will retain full exclusivity across all therapeutic drug classes until July 1, 2012, at which time Unilife would be free to commence sales and deliveries to any pharmaceutical company across all therapeutic classes.
If both parties enter into a supply agreement prior to July 1, 2014 for the purchase of the Unilife Ready-to-Fill Syringe for usewithaparticulardrugproduct,sanofi-aventiswillreceivea ten-year extension of its exclusive right to purchase the product within the relevant therapeutic drug class. This extensionwillbereducedtofiveyearsifsanofi-aventisdoesnot sell a minimum of 20 million units of the product for use with an injectable drug product in this therapeutic class in atleastoneofthefirstfiveyearsofthesupplyagreement.Each therapeutic class on the exclusivity list will be treated separately for this purpose. The Industrialisation agreement does not require Unilife to commit more than 30% of its annualproductioncapacitytosanofi-aventis.Shouldsanofi-aventis wish to receive a greater portion of annual product capacity, it is required to provide orders to Unilife twenty-four months in advance.
Since Unilife has retained certain rights under the Industrialisation agreement with sanofi-aventis to marketand sell the product to other pharmaceutical companies, it expects to be able to pursue agreements with these companies with respect to therapeutic drug classes for whichsanofi-aventisdoesnotretainexclusivity.
Commercial Strategy for the Unilife Ready-to-Fill Syringe
+18 Annual REPORT 2009
For
per
sona
l use
onl
y

Annual REPORT 2009 +19
For
per
sona
l use
onl
y

+20 Annual REPORT 2009
While the Industrialisation agreement for the Unilife Ready-to-Fill Syringe was signed on June 30, 2009, the actual industrialisation program for the product commenced one year earlier on July 1, 2008 following the signing of the Exclusive Agreement. The program targets the development of production systems capable of supporting the supply of an initial 40 million units of the Unilife Ready-to-Fill Syringe per year. Prior to the start of the industrialisation program, Unilife had already commenced initial pilot production of the product for the supplyofsamplestosanofi-aventisforevaluation.
Unilifehasdedicatedsignificantresourcesoverasix-yearperiod towards ensuring the Unilife Ready-to-Fill Syringe is engineered for high volume production and compatible withthefillingandpackagingsystemsofpharmaceuticalcustomers. Areas where innovative design and production strategies have been utilised to de-risk the product commercialisationprocessinclude:
+ Glass Barrel: Standardprefilledsyringesuseglassbarrels which require shaping at both ends of the tube (theneedleandtheflangesusedtogriptheproduct).Thereareonlyfivecompanieswhichspecialiseintheproductionofglassbarrelsforstandardprefilledsyringes. The Unilife glass barrel design requires shaping at only one end, enabling us to enter into supply relationships with any of a multitude of manufacturers of glass cartridges.
+ Materials: Unilife has selected components in the fluidpathwhichusethesamematerialsasstandardprefilledsyringesorglassvialstofacilitatedrugcompatibility.
Industrialisation of the Ready-to-Fill Syringe
+20 Annual REPORT 2009
+
For
per
sona
l use
onl
y

Annual REPORT 2009 +21
The industrialisation program for the Unilife Ready-to-Fill Syringe is running well ahead of schedule, with its expected completion by the end of 2010. As a result, Unilife expects to be in a position to commence the supply of the product to pharmaceutical customers within 18 months.
Unilife has decided to outsource the development of automated assembly systems to be used in the production of the Unilife Ready-to-Fill Syringe. The extensive scale of Unilife’s production plans makes it prudent to contract the design and development of these assembly systems to a large and well-established industry specialist with proven expertise in key areas such as the high-volume handling of glass barrels and needles. Unilife will, however, utilise its in-house experience in the design, development and operation of automated assembly systems to ensure the appointed supplier fully meets its contract obligations. Following the development of these assembly lines by the contracted supplier, they will be installed and validated at the Pennsylvania facilities of Unilife prior to
commencing the supply of the product to pharmaceutical customers. Unilife undertook an exhaustive review of more than 30 global specialists with the industry expertise and operational resources necessary to meet production growth targets. The Company is pleased with the quality of the proposals received, and expects to make an announcement of the selected supplier for its automated assembly systems during 2009.
As a result of these discussions, Unilife has been able to increase the projected annual capacities for the Ready-to-Fill Syringe to meet anticipated market demand faster and more cost-effectively than originally envisioned. Given the strong level of interest in the Unilife Ready-to-Fill Syringe from a number of pharmaceutical companies, the competitive position of its technology and the rapid transition of international healthcare markets towards the mandatoryuseofsafetysyringes,Unilifeisconfidentthatit is in a strong position to reach an industrial capacity in excess of 450 million units beyond 2014 and 850 million units beyond 2016.
Unilife Scheduled Annual Production VolumesTotal Projected Growth of Prefilled Markets
+
For
per
sona
l use
onl
y

+22 Annual REPORT 2009
Unilife commenced production of the Unitract 1mL Insulin Syringes at its Lewisberry facility in Pennsylvania in August 2008. Thismilestonemarked the first time thatU.S. production of the Unitract 1mL Syringes has occurred in clean room conditions.
Prior to transferring the automated assembly system into the clean room, it was required to pass a series of operational tests designed to validate its performance in areas such as run speed and product quality. These tests were successfully completed, with the automated assembly system reaching up to 90% productivity. Unilife will continue to work towards achieving the optimum productivity rate for this assembly system of approximately 40 million units per annum.
In parallel to completing the transfer of the 1mL assembly system into the clean room, Unilife also installed and
tested other related manufacturing systems, including an automated barrel printer and an automated packaging system.
The automated assembly line that is now manufacturing the Unitract 1mL Syringes was fully designed, developed, builtandqualifiedbyUnilife’s in-house team.Therearefew companies in the world, particularly of Unilife’s size, which have the core competency in-house to develop innovative medical devices and the automated assembly systems used to manufacture them. This core set of operational strengths is a testament to Unilife’s success in building a world-class business via the acquisition of Integrated BioSciences Inc (IBS) and the recruitment of global medical device industry leaders.
Initial production will be used to complete accelerated device ageing studies required to support regulatory
Production and Release of Unitract 1mL Syringes
For
per
sona
l use
onl
y

Annual REPORT 2009 +23
submissions. Unilife will continue to manufacture the Unitract 1mL Syringes and hold them in quarantine until the completion of these ageing studies. Commercial release is expected to occur during the fourth quarter of 2009.
The start of U.S. production will enable Unilife to complete required product ageing studies and build inventory to fulfill currentandanticipatedorders for itsUnitract1mLSyringes. The Unitract 1mL Insulin Syringe has previously received key regulatory certifications for use within theU.S., Canada, Europe and Australia.
Unilife is currently in discussions with a number of interested pharmaceutical and healthcare companies located in the U.S., Europe and Asia regarding the Unitract 1mL Syringes. Unilife will also promote the products at key U.S. and European industry events.
+Annual REPORT 2009 +23
For
per
sona
l use
onl
y

+24 Annual REPORT 2009
Unilife started life in 2002 as a small Australian company with two inventors, one CEO and a grand vision.
Following the signing of the Exclusive agreement with sanofi-aventis in July 2008, the Company began totransition key commercial and operational functions from Sydney to the FDA-registered facilities of its wholly-owned U.S. subsidiary Integrated BioSciences Inc (IBS) situated in Lewisberry, Pennsylvania. This included the relocation ofChiefExecutiveOfficerAlanShortallandasmallnumberof other executives to Central Pennsylvania to help establish this facility as Unilife’s global headquarters.
Business Expansion – Management
Name Qualifications Position Joined Unilife
Years Experience Previous Companies
Alan Shortall ChiefExecutiveOfficer 2002 26
Dan Calvert B. Sc, M.S, CMA, MBA ChiefFinancialOfficer 2008 26 Standard Management, MBT
Bernhard Opitz M.Sc Senior VP of Operations 2008 29 Bayer AG, Ikonisys, Nanosphere
Eugene Shortall Senior VP of RTFS 2007 28 Private consultant
Mark Iampietro B.Sc VP of Quality Systems and Regulatory Affairs 2008 32 Spherics, Cynosure, MedChem
Stephen Allan B.COM VP Marketing and Communications 2002 16 Private consultant
Gerald Verollet Ph.D VPScientificandInternationalAffairs 2003 28 WHO, GSK, JNJ
Cynthia Lighty BA, JD Director of Human Resources and Legal Services 2008 23 The Hershey Company
Mark Hassett B.Sc Director of Sales and Marketing 2008 26 Safety Syringes Inc, Venetec
Lisa MacKenzie Dip.Sc, PSGT Director of Clinical Affairs and Product Management 2005 20 ResMed, Pharmacy Guild
Tom Westbye B.Sc Director of Product Development 2009 32 Safety Syringes Inc
Tim Spang MBA, B.Sc Director of Manufacturing 2009 18 MEDRAD, Ariba, JPM
Dave Watson MSME, PE Director of Engineering 2008 28 Biotronik, Fujitsu, IBM
Keith Bocchicchio BSME Director of Technology 2007 27 IBS, Synergistech, AMP
+ Craig Thorley and Joe Kaal, Managers of Research and Development + Lisa MacKenzie, Director of Clinical Affairs and Product Management
For
per
sona
l use
onl
y

Annual REPORT 2009 +25
Unilifesubsequentlycommencedasignificantrecruitmentprogramtofillanumberofkeymanagementpositionsatits Pennsylvania facility which were necessary to support the future corporate and operational requirements of the Company. This included the appointment of Bernhard Opitz as Senior Vice President of Operations, Mark Iampietro as Vice-President of Quality and Regulatory Affairs and Dan Calvert as the new U.S.-based CFO of Unilife. Each of these three members of the Unilife executive team has more than 25 years of medical device and pharmaceutical experience in leadership roles for major multinational companies. To coincide with the appointment of Mr. Calvert, the CFO role in Australia became redundant. Former CFO Jeff Carter, however, continues to serve
as a Director of the Board and as a consultant, where he is supporting Unilife’s corporate secretarial and ASX reporting requirements in Australia.
In the period between July 1, 2008 and October 1, 2009, Unilife has recruited a total of 47 staff, with more than 85 staff and full-time consultants now being employed worldwide. This includes the appointment of 35 management and professional personnel appointed at Unilife’s Lewisberry facility. Together the Unilife management team (below) has an average 23 years of experience working for a number of prominent multinational companies within the life science industry.
Name Qualifications Position Joined Unilife
Years Ex-perience Previous Companies
Dan Adlon B.Sc Director of Contract Product Development 2007 32 IBS, Synergistech, AMP
Graham Purches Ph.D (Chemistry) Director of Operations – RTFS 2008 11 ResMed, Ambri
Melissa DeHass B.Sc Senior Manager, Regulatory Affairs 2009 10 DENTSPLY
Tina Hager BA Director of Finance and Administration 2007 25 IBS, Synergistech
Deborah Karlak BA, MSA, CPA SEC Reporting and Compliance Analyst 2009 14 IAC, PWC, GGK
John Davis B.Sc. MBA, Senior Manufacturing Engineer 2009 17 United Technologies, GE Plastics
Henry Madden B.Sc Senior Project Controls Engineer 2009 29 CR Bard, Clorox, AT&T, Hitachi
Gary Reynolds B.Sc Senior Automation Engineer 2009 25 Kimberly-Clark, General Dynamics
Craig Thorley Manager of Research and Development 2002 21
Joe Kaal Manager of Research and Development 2002 32
Ralph Varrato Facilities Manager 2009 19 Schein,Teva,BostonScientific.
Grace Chung BSc, MBioE, MBA Senior Quality Engineer 2007 19 ABB
Bruce Randles BA, MMM Quality Engineer 2008 22 SaintGobain,BostonScientific
Jeff Carter M.App.Fin Company Secretary 2005 26 Coca-Cola Amatil, Ambri
+ David Watson, Director of Engineering+ Lisa MacKenzie, Director of Clinical Affairs and Product Management
For
per
sona
l use
onl
y

+26 Annual REPORT 2009
Unilife is in the middle of a significant global businessexpansion program that will consolidate key commercial and operational functions within the U.S., expand the level of in-house expertise available to complete key projects such as the Unilife Ready-to-Fill Syringe, and help position the Company to maximise shareholder value moving forward.
This global expansion commenced in 2007 with the acquisition of Integrated BioSciences, Inc (IBS), a contract medical device manufacturing company with strong expertise in automated assembly systems. The merger of the skill sets at IBS with those of Unilife created a much stronger business that had the capacity to design, develop and manufacture innovative safety medical devices, as well as the automated assembly systems used to produce them.
In August 2008, Unilife commenced the second stage of its global expansion with the relocation of key commercial and operational functions from Australia to the FDA-registered facilities of IBS in the U.S. Commonwealth of Pennsylvania. Unilife will continue to appoint additional staff to support the industrialisation of the Unilife Ready-to-Fill Syringe, the production and sale of the Unitract 1mL Syringes and the pursuit of other additional business expansion opportunities.
In April 2009, Unilife announced the name change of IBS to Unilife Medical Solutions, Inc in anticipation of the proposed redomiciliation of the Company from Australia to the U.S. At the same time as this name change, Unilife announced that it would receive funding from the Commonwealth of Pennsylvania to create additional jobs and investment within the state.
In July 2009, Unilife also announced that it had completed a review of manufacturing opportunities within Europe and had instead decided to centralise international production activities within Central Pennsylvania. The current 50,000 square foot facility Unilife inherited from its U.S. subsidiary isnotsufficientinsizeorindustrialcapabilitytosupportthecompletion of key projects such as the industrialisation of the Unilife Ready-to-Fill Syringe.
Unilife has reviewed a number of options for the establishment of a major new facility within Central Pennsylvania. The new facility, which is expected to serve as Unilife’s long-term global headquarters, is expected to be completed during 2010.
Unilife commenced the third stage of its business expansion strategy in September 2009, with a proposed redomicilation of the Company to the U.S. To support this transition of Unilife from an Australian to a U.S. business, the Company has also announced its intention to complete a proposed listing on NASDAQ. The Board considers that a NASDAQ listing is likely to provide increased liquidity for Unilife securities and has the potential to attract new U.S. investors to the Company. The completion of this proposed redomiciliation to the U.S. and subsequent NASDAQ listing is intended to enhance Unilife’s ability to manage and grow its business in key markets.
Business Expansion – Corporate
+ An architectural conceptual design of Unilife’s new global headquarters and production facility in Central Pennsylvania
For
per
sona
l use
onl
y

Annual REPORT 2009 +27
Corporate Governance
Unilife has developed its corporate governance policy to help ensure that all aspects of the Company are managed in an ethical manner to promote the creation of shareholder value and balance the need for innovation with internal controls and accountability structures appropriate to risk. In fulfilling our obligations and responsibilities to stakeholders, the Board of Unilife has developed its governance framework with due regard not only to the ASX Corporate Governance Council’s Principles of Good Corporate Governance and Best Practice Recommendations but also, the size and available resources of the Company. This statement outlines the principal corporate governance procedures of Unilife. Further information on Unilife’s corporate governance policy is available on its website at www.unilife.com.
ASX Corporate Governance Council Recommendations Except as disclosed in the following paragraph, Unilife’s current corporate governance practices meet the ASX requirements. The Board will continue to adopt best practice principles and adapt its corporate governance framework as the Company grows and its requirements change. Recommendation 2.1 requires that a majority of the Board be independent, and Recommendation 2.2 requires that the chairperson be independent. Under the Company’s definition of “independence” (see section titled “Board Composition”), the Company does not comply with the requirements of Recommendation 2.1. The Board is comprised of two independent Directors and two Directors that are not considered independent under the Company’s definition of “independence”.
Recommendation 2.4 requires listed entities to establish a Nomination Committee. Given the current size of the Board and the Company’s requirements, the Board considers this function is efficiently achieved at Board level and is carried out in accordance with the Boards’ charter.
Role of the Board
The Board’s primary responsibility is to plan for the sustainable growth and profitability of the Company. In setting the strategic direction of the Company, the Board is responsible for determining its policies, monitoring the performance of senior management, controlling its business affairs and ensuring statutory compliance. The Board monitors the Company’s performance (both operationally and financially), including the oversight and approval of major capital expenditures, acquisitions and divestments. It institutes policies, practices and procedures to ensure that the systems of risk management (including determining acceptable risk), internal control and reporting that are in place are both appropriate and effective. The Board, having assumed the responsibilities of the Nomination Committee, is accountable for determining the necessary skills and competencies of Board members; evaluating the performance of the Board and its individual members; and recommending the appointment and removal of Directors.
The Board is responsible for appointing and monitoring the performance of the Chief Executive Officer and other members of the executive management team. The Board establishes the key performance indicators (KPIs) for the executive management group and monitors the achievement of these KPIs over time. The Board also ensures that appropriate resources are available to executive management so they can perform their role effectively.
Board Processes
The full Board holds regular meetings each year, plus strategy meetings and extraordinary meetings at such other times as may be necessary to address any specific significant matters that may arise. The agenda for meetings is prepared in conjunction with the Chairman and Chief Executive Officer. Standing items include the Chief Executive Officers’ report, financial reports, strategic matters, governance and compliance. Board papers are circulated in advance of the meeting to allow sufficient time for review. Executives are regularly involved in Board discussions, and Directors have other opportunities to liaise with a wider group of employees as deemed appropriate. The Board has established a framework for the management of the economic entity including a system of internal control, a business risk management process and appropriate ethical standards. This includes various operational and financial approval thresholds, which are underpinned by regular financial and management reporting to the Board. The Board believes that the Company’s business risk management process, risk management policy and internal compliance and control system are sufficient for the present needs of the organisation given its size and resources.
Board Composition
The skills, experience and expertise relevant to the position of each Director who is in the office at the date of the annual report and their term of office are detailed in the Directors’ Report. The Non-executive Director and Chairman of the Board at the date of this report is Mr Jim Bosnjak. The composition of the Board is determined using the following principles:
(a) the Board should comprise a minimum of three Directors;(b) the Chairman of the Board should be an independent Non-executive Director; and(c) the Board comprise a majority of Non-executive Directors with at least 50% of the Board being independent Non-executive Directors.
For
per
sona
l use
onl
y

+28 Annual REPORT 2009
When determining whether a Non-executive Director is independent, the Director must not fail any of the following materiality thresholds:(a) not a member of management;(b) free from any interest and any business or other relationship which could, or could reasonably be perceived to, materially interfere with the
Director’s ability to act in the best interests of the Company;(c) within the last three years, the Director must not have been employed in an executive capacity by the Company or other controlled entity;(d) less than 5% of the Company shares are held by the Director and any entity or individual directly or indirectly associated with the Director; (e) no sales are made to, or purchases made from, and entity or individual directly or indirectly associated with the Director; and (f) none of the Directors’ income or the income of an individual or entity directly or indirectly associated with the Director or derived from a
contract with any member of the economic entity other than income derived as a Director of the entity.
The composition of the Board is reviewed on an annual basis by the Directors to ensure the Board has the appropriate mix of expertise and experience. The terms and conditions of the appointment and retirements of Non-executive Directors are set out in a letter of appointment. Given limited resources and other relevant factors such as the current size of the Board of Directors, an individual performance evaluation of each Director was undertaken by the Chairman (i.e. Non-executive Director). An individual performance evaluation of the Chairman was undertaken by each Executive Director.
Independent Professional Advice and Access to Company Information
Each Director has the right of access to all relevant Company information and the Company’s executives and, subject to prior consultation with the Chairman, may seek independent professional advice at the Company’s expense. A copy of any advice received by the Director is made available to all other members of the Board.
Directors’ Dealings in Company Shares
Under the Company’s share trading policy, the Directors and executives of the Company are prohibited from trading in the Company’s shares or other securities if they are in possession of “inside information”. Subject to this condition, ASX Listing Rules, the Corporations Act and ASX continuous disclosure requirements, trading can occur at any time excluding periods prior to the publication of financial results and disclosure documents. In addition, in order to trade, Directors of the Company must advise the Chairman of their intention to trade and must also have been advised that there is no know reason to preclude them trading in the Company’s shares or other securities.
Audit and Compliance Review Committee
The role of the Audit and Compliance review Committee (“Audit Committee”) is documented in a charter which is approved by the Board of Directors (“Charter”). The functions of the Audit Committee were performed by the full Board of Directors for the current year. The role of the Audit Committee is to advise of the establishment and maintenance of a framework of internal control and appropriate ethical standards for the management of the Company. The Board met with and received reports from the External Auditors concerning any matters which arise in connection with the performance of their respective roles, including the adequacy of internal controls.
Remuneration Committee
Due to the small size of the Board, a separate Remuneration Committee has not been established. At present, the Chief Executive Officer, in consultation with the Chairman of the Board, determines the appropriate remuneration of Senior Management. The Company’s remuneration policy has been designed to align Director’s and Executive’s objectives with shareholder and business objectives by providing a fixed remuneration component and offering specific short-term and long-term incentives based on key performance areas affecting the Company’s financial results. The Board believes the remuneration policy to be appropriate and effective in its ability to attract and retain the best Executives and Directors to run and manage the Company, as well as create goal congruence between Directors, Executives and Shareholders. The amount of the remuneration is set out in the Director’s Report. All remuneration, except options, is valued at cost and is expensed by the Company. Options are valued using the Black-Scholes methodology and the Barrier Pricing model.
Corporate GovernanceF
or p
erso
nal u
se o
nly

Annual REPORT 2009 +29
Ethical Standards
The Company has a Code of Conduct that sets out principals to guide each Director, Executive and Employee of the Company in the course of their business dealings. It requires Directors, Executives and Employees to act with the utmost integrity and objectivity, striving at all times to enhance the reputation and performance of the Company.
Communications with Shareholders
The Board aims to ensure that Shareholders are kept informed of all major developments affecting the Company. Information is communicated to Shareholders through the distribution of annual reports and newsletters and by presentation to Shareholders at the Annual General Meeting. Throughout the year, all releases to the ASX and reports (including quarterly, half yearly and annual reports) with respect to the Company’s activities are posted on the Company’s website located at www.unilife.com. Shareholders and other interested parties can subscribe to receive Company updates via email through the investor relations section of the website.
Corporate GovernanceF
or p
erso
nal u
se o
nly

+30 Annual REPORT 2009
Your Directors present their report on the Company and its Controlled Entities for the financial year ended 30 June 2009.
DIRECTORSThe names of the Directors in office and at any time during, or since the end of the year are: Jim Bosnjak OAM Alan Shortall Jeff Carter William Galle Directors have been in office since the start of the financial year to the date of this report unless otherwise stated.
INFORMATION ON DIRECTORS
Jim Bosnjak OAM Chairman (Non-executive) – Age 61
Experience Mr Bosnjak is a prominent Australian businessman with solid government experience and broad investments across Australia, Asia and Europe. He was appointed Chairman of Unilife on 21 April 2006 and has served as a member of Unilife’s Board of Directors since 4 February 2003. Mr Bosnjak has been involved in numerous commercial enterprises related to transport, manufacturing, funds management, advertising, hospitality and tourism. Mr Bosnjak is a co-owner of the Le Meridien Lav hotel in Split, Croatia, a $150 million resort and casino that opened in 2007 and was named Europe’s Leading Conference Hotel in 2008. He was formerly the director and chairman of one of Australia’s largest closely held bus companies, Westbus Pty Ltd, and has held positions on Commonwealth and New South Wales (NSW) advisory bodies, including the Greater Western Sydney Economic Development Board and the GROW Employment Council. Mr Bosnjak has been awarded an honorary doctorate from the University of Western Sydney for services toward employment growth and economic development, the Medal of the Order of Australia for his services to road transport and the community, and an Order of Merit from the NSW Olympic Council.
Interest in Shares and Options:1,810,000 ordinary shares (77,000 direct and 1,733,000 indirect) in Unilife Medical Solutions Limited and 2,000,000 unlisted options (indirect).
Other current Directorships held in other listed entities:None
Former Directorships held in other Listed entities in the past 3 years:None
AlanShortall ExecutiveDirectorandChiefExecutiveOfficer–Age55
Experience: Board member since 20 September 2002. Alan has been involved in the commercialisation of the Company’s safety syringe technology for more than seven years and has an intimate understanding of the characteristics and advantages of the Company’s products. Alan also has substantial marketing and commercial experience having been involved in the successful operation of a number of businesses in a variety of fields. Interest in Shares and Options:14,623,332 ordinary shares (direct) in Unilife Medical Solutions Limited and 7,500,000 unlisted options.
Other current Directorships held in other listed entities: None
Former Directorships held in other Listed entities in the past 3 years:None
Directors’ ReportF
or p
erso
nal u
se o
nly

Annual REPORT 2009 +31
Jeff Carter Non-executive Director and Company Secretary – Age 51
Qualifications: Bachelor of Financial Administration Masters in Applied Finance Chartered Accountant
Experience:Board member since 21 April 2006. Jeff has over 28 years experience in various financial and senior management roles, with a strong background in the healthcare industry where he held the roles of CFO and Chief Operating Officer. In January 2009 Jeff became a Non-executive Director and agreed to provide advisory, company secretarial and accounting services to the Company during its redomiciliation to the USA.
Interest in Shares and Options:37,036 ordinary shares (indirect/beneficial interest) in Unilife Medical Solutions Limited and 2,500,000 options (indirect)
Other current Directorships held in other listed entities:None
Former Directorships held in other Listed entities in the past 3 years:None
William Galle Non-executive Director – Age 70
Qualifications: Graduate of Columbia University, Rutgers University and the New York Institute of Finance.
Experience:Board member since 23 June 2008.
Interest in Shares and Options:Nil. 550,000 unlisted options.
Other current Directorships held in other listed entities: None
Former Directorships held in other Listed entities in the past 3 years:None
Interest in Shares and Options Held by Key Management Personnel at the Date of this Report
Ordinary Fully Paid Shares Unlisted Options
Directors
Mr J Bosnjak 1,810,000 2,000,000
Mr A Shortall 14,623,332 7,500,000
Mr J Carter 37,036 2,500,000
Mr W Galle - 550,000
Key Management Personnel
Mr B Opitz - 1,500,000
Mr D Calvert - 1,500,000
Mr S Allan - 1,555,000
Mr E Shortall - 750,000
Mr M Iampietro - 600,000
Total 16,470,368 18,455,000
Directors’ ReportF
or p
erso
nal u
se o
nly

+32 Annual REPORT 2009
COMPANY SECRETARYMr Jeff Carter was appointed Company Secretary on 9 March 2007 and held this position at the end of the financial year (refer to page 31 for qualification details).
PRINCIPAL ACTIVITIESThe principal activities of Unilife Medical Solutions Limited are the development and commercialisation of its safety syringe technology.
OPERATING RESULTSGroup Revenue for Unilife Medical Solutions Limited (“Unilife”) increased by 869% from $4,170,166 (2008) to $40,413,706 (2009). The increase in revenue was primarily due to payments received from the pharmaceutical partner.
The consolidated profit of the Economic Entity for the financial year after providing for income tax was $12,806,494.
The result reflects the Company’s development, commercialisation and marketing activities associated with its Unitract™ portfolio of safety syringe products.
DIVIDENDS PAID OR RECOMMENDEDThe Directors recommend that no dividend be paid for the year ended 30 June 2009, nor have any amounts been paid or declared by way of dividend since the end of the previous year.
REVIEW OF ACTIVITIES
Agreements with Major Pharmaceutical Partner
On 1 July 2008, Unilife entered into a Global Agreement with its major pharmaceutical partner under which the partner paid Unilife a non-refundable fee of $16.4 million (€10 million) for the exclusive right to negotiate for the purchase of the Unilife Ready-to-Fill Syringe. On 30 June 2009, Unilife signed an Industrialisation Agreement with its pharmaceutical partner for the Unilife Ready-to-Fill Syringe under which its partner committed to complete the funding of the $30.4 million (€17 million) industrialisation program.
Combined with the $16.4 million (€10m) non-refundable Exclusivity Fee paid to Unilife in 2008, this commitment to fund the industrialisation program will represent a total expenditure by the pharmaceutical partner of approximately $47 million between July 2008 and the end of 2010. Between now and the end of 2009, both parties will negotiate therapeutic drug class areas where the pharmaceutical partner would have the exclusive right to use the Unilife Ready-to-Fill Syringe. Under the Industrialisation Agreement, Unilife has also retained the right to enter into agreements with other pharmaceutical companies which may seek to use the Unilife Ready-to-Fill Syringe with injectable drug products marketed in other therapeutic drug classes.
Industrialisation Program for the Unilife Ready-to-Fill Syringe
The Industrialisation Program for the Unilife Ready-to-Fill Syringe commenced on 1 July 2008. The original project plan targeted the scheduled completion of the Industrialisation Program in the fourth quarter of 2011. As the program is approximately one-year ahead of schedule, both parties recognise that it is now expected to be completed by the end of 2010. Unilife has now completed due diligence on potential qualified international suppliers for the development and supply of the high-volume automated assembly system to be used in the production of the Unilife Ready-to-Fill Syringe. A final selection of the supplier will be made during the current quarter.
FDA Clearance of Unitract 1mL Syringes
Unilife secured U.S. Food and Drug Administration (“FDA”) clearance of the Unitract 1mL Insulin Syringe in October 2008. FDA clearance of the 510(k) submission for the Unitract 1mL Insulin Syringe gave Unilife permission to market the Unitract 1mL Insulin Syringe within the U.S.
Directors’ ReportF
or p
erso
nal u
se o
nly

Annual REPORT 2009 +33
U.S. Production of Unitract 1mL Syringes
In August 2009, Unilife commenced U.S. production of the Unitract™ 1mL Insulin Syringe (“Unitract 1mL Syringes”) at its FDA-registered manufacturing facility in Pennsylvania. Prior to the successful transfer of the automated assembly system for the Unitract 1mL Syringes into its designated clean room in June 2009, Unilife had completed a series of key activities and operational tests. Prior to final installation in the clean room, Unilife had also successfully tested other related manufacturing systems including an automated barrel printer and an automated packaging system. The automated assembly system has been rated at up to 90% of efficiency, with Unilife now continuing to work towards achieving the optimum productivity rate for this assembly system of approximately 40 million units per annum. Commercial release of the Unitract 1mL Syringes is expected to occur during the fourth quarter of 2009 upon completion of product ageing studies, which are a standard requirement for the qualification of manufacturing processes at a new production site. A video of the automated assembly system developed by Unilife to manufacture the Unitract 1mL Syringes is available for viewing at www.unilife.com.
Transition of Key Commercial and Operational Functions to U.S. Facility
During the period, Unilife transitioned key commercial and operational functions from Australia to its FDA-registered U.S. manufacturing facility. In the period from September 2008 to now, Unilife has recruited or relocated more than 35 management and senior professional staff that are now situated at this facility. These U.S.-based roles include the appointment of a Chief Financial Officer, a Senior Vice-President of Operations, a Vice-President of Quality Systems and Regulatory Affairs and Director-level positions for Manufacturing, Supply Chain, Engineering, Product Development and Sales and Marketing.
The current Unilife management team has on average more than 20 years’ experience. The majority of the members of this management team have a strong background in the medical device and pharmaceutical markets, having worked for multinational companies such as Baxter, Medtronic, Teva, Safety Syringes, Resmed, MEDRAD, Biotronik, Tyco, Dentsply, Boston Scientific and Kimberley Clark. In April 2009, Unilife announced the change of name of its U.S. subsidiary from Integrated BioSciences Inc to Unilife Medical Solutions Inc.
During the period, Unilife also completed a review of opportunities within Europe for the establishment of a manufacturing facility suitable for the high-volume production of the Unilife Ready-to-Fill Syringe. Following a review of these potential European sites and the necessary operational and supply-chain resources required to support key projects such as the Unilife Ready-to-Fill Syringe, the Company elected to centralise its manufacturing activities within Pennsylvania. Unilife has subsequently commenced a review of facility options within Pennsylvania.
Agreement with the Commonwealth of Pennsylvania
In April 2009, the Office of the Governor of the Commonwealth of Pennsylvania announced that Unilife would be provided with a $2.174 million (US$1.795 million) funding program which included a $736,000 (US$600,000) Infrastructure and Facilities Improvement Grant, a $146,000 (US$120,000) Opportunity Grant, a $1.2 million (US$1 million) loan from the Machinery and Equipment Loan Fund and a $92,000 (US$75,000) grant for Job Training Assistance.
Preparations for Listing on U.S. Exchange
During the period, Unilife declared its intention to seek a listing on a recognised U.S. stock exchange as part of its strategy to consolidate commercial and operational activities within the U.S. The Company has made significant progress in regards to its schedule for listing on a U.S. exchange. To support awareness of Unilife and its business activities within U.S. financial markets, an Executive Informational Overview® report on the Company was released by U.S.-based research group Crystal Research Associates, LLC in January 2009.
In August 2009, U.S. investment banking firm Griffin Securities Inc initiated independent research coverage on the Company. A copy of this report is available for viewing at www.unilife.com or www.griffinsecurities.com.
This independent report was prepared by Keith Markey, Scientific Director of Griffin Securities. Mr Markey has been an equities analyst for more than 20 years, specializing in the biotechnology, pharmaceutical, and medical device sectors. Much of his career has been with Value Line, Inc, where he held various managerial positions in the Research Department for the world’s leading investment advisory newsletter, the Value Line Investment Survey. He was responsible for initiating coverage of stocks in all industries and created Value Line Select, a premium advisory publication. Keith began his career as a biochemist, working in the fields of endocrinology and neuroscience at New York University Medical School and Cornell Medical College. His research, which resulted in more than 30 scientific publications, contributed to our understanding of regulatory biochemistry and stem cell plasticity. Keith has lectured on scientific and financial subjects, and is a contributing editor to HUM-MOLGEN, a news service for the scientific research community. He is also a member of the New York Academy of Sciences and the National Association of Science Writers. Keith earned a Ph.D. in Neurochemistry from the University of Connecticut and an M.B.A. in Finance from the Leonard N. Stern School of Business at New York University.
Directors’ ReportF
or p
erso
nal u
se o
nly

+34 Annual REPORT 2009
FINANCIAL POSITIONThe net assets of the Economic Entity increased from $17,877,101 to $36,277,965. This movement was primarily due to the net profit for the year of $12,806,494, the raising of equity of $834,795 and the purchase of plant and equipment of $3,572,645.
SIGNIFICANT CHANGES IN STATE OF AFFAIRSThe following significant changes in the state of affairs of the Parent Entity occurred during the financial year, other than those referred to elsewhere in this report, were:
Issued capital increased to $75,458,648 from $72,254,862. The movement was primarily the result of:
(i) the conversion of convertible notes into 3,120,000 shares from July 2008 to May 2009;
(ii) the exercise of options into 585,189 shares from July 2008 to December 2008;
(iii) the issue of 10,000,000 shares to the CEO; and
(iv) the issue of 275,310 shares to employees.
As at 30 June 2009 the Company had 219,754,809 shares on issue.
AFTER BALANCE DATE EVENTSIn 2002 the Company acquired Unitract Syringe Pty Ltd (Unitract). Under this acquisition agreement (Agreement) and as further approved by the shareholders on 28 November 2008, the Company agreed to issue 10 million shares to certain former shareholders of Unitract if the Company earned net profit after tax of $6.5 million (as confirmed by its auditors) in any financial year in the years following completion of the Agreement and a further 10 million shares if the Company earned net profit after tax (as confirmed by its auditors) of $12 million in any financial year in the years following the Agreement. It is noted that the net profit after tax for the year ended 30 June 2009 exceeded $12 million and accordingly 20 million shares, subject to shareholder approval (if required) and confirmation by the Auditors, will be issued to former shareholders of Unitract. A provision for the issue of these shares of $6.3 million has been raised as at 30 June 2009 and a corresponding increase in the goodwill on acquisition of Unitract has been recorded for the year ended 30 June 2009.
On 1 July 2009, the Company announced that it entered into an Industrialisation Agreement with a pharmaceutical partner for the commercialisation of the Unilife Ready-To-Fill Syringe.
FUTURE DEVELOPMENTS, PROSPECTS AND BUSINESS STRATEGIESIn the opinion of the Directors it may prejudice the interests of the Company to provide additional information (except as reported in this Directors’ Report), in relation to future developments and business strategies of the operations of the Company and the expected results of those operations in subsequent financial years.
ENVIRONMENTAL ISSUESThe Economic Entity’s operations are not regulated by any significant environmental regulation under a law of the Commonwealth or of a State or Territory.
The Economic Entity is not subject to the reporting requirements of either the Energy Efficiency Opportunities Act 2006 or the National Greenhouse and Energy Reporting Act 2007.
Directors’ ReportF
or p
erso
nal u
se o
nly

Annual REPORT 2009 +35
REMUNERATION REPORT (AUDITED)
This report details the nature and amount of remuneration for each Director of Unilife Medical Solutions Limited, and for the executives receiving the highest remuneration.
Remuneration Committee
Due to the small size of the Board the Economic Entity had not established a separate Remuneration Committee. At present, the Chief Executive Officer, in consultation with the Chairman of the Board, determines the appropriate remuneration of Senior Management.
A. Remuneration Policy (Audited)
The information provided in the remuneration report has been audited as required by Section 308(3C) of the Corporations Act 2001.
The remuneration policy of Unilife Medical Solutions Limited has been designed to align Directors’ and Executives’ objectives with shareholder and business objectives by providing a fixed remuneration component and offering specific short-term and long-term incentives based on key performance areas affecting the Economic Entity’s financial results. The Board of Unilife Medical Solutions Limited believes the remuneration policy to be appropriate and effective in its ability to attract and retain the best Executives and Directors to run and manage the Economic Entity, as well as create goal congruence between Directors, Executives and shareholders.
Remuneration packages are reviewed annually by reference to the Company’s performance, Executive performance and comparable information from industry sectors and other listed companies in similar industries.
The performance of Executives is measured against criteria agreed with each Executive. All bonuses and incentives must be linked to predetermined performance criteria. The Board may, however, exercise its discretion in relation to approving incentives, bonuses and options. Executives are also entitled to participate in the employee share and option arrangements.
All Australian Directors and Australian Executives receive a superannuation guarantee contribution required by the government, which is currently 9%, and do not receive any other retirement benefits. Some individuals, however, have chosen to sacrifice part of their salary to increase payments toward superannuation.
All remuneration paid to Directors and Executives is valued at cost to the Company and expensed over the vesting period of the options. Options are valued using the Black-Scholes methodology and the Barrier Pricing model where appropriate.
The Board believes that it has implemented suitable practices and procedures that are appropriate for an organisation of this size and maturity. Given limited resources and other relevant factors such as the size of the Board of Directors during the financial year ended 30 June 2009, an individual performance evaluation of each Director was not undertaken. Remuneration of Non-executive Directors is determined by the Board within the maximum amount approved by the shareholders from time to time. This maximum currently stands at $300,000 per annum.
Non-executive Director Remuneration (Audited)
ObjectiveThe Board seeks to set aggregate remuneration at a level which provides the Economic Entity with the ability to attract and retain Directors of the highest calibre, whilst incurring a cost which is acceptable to shareholders.
StructureThe Board policy is to remunerate Non-executive Directors at market rates for comparable companies for time, commitment and responsibilities. The remuneration of Non-executive Directors is reviewed annually, based on market practice, duties and accountability. Independent external advice is sought when required. The maximum aggregate amount of fees that can be paid to Non-executive Directors has been subject to approval by shareholders. Fees for Non-executive Directors are not linked to the performance of the Economic Entity. However, to align Director’s interests with shareholders interests, the Directors are encouraged to hold shares in the Company.
Non-executive Australian Directors receive a base salary and superannuation.
Directors’ ReportF
or p
erso
nal u
se o
nly

+36 Annual REPORT 2009
Executive Director Remuneration and Key Management Personnel (Audited) ObjectiveThe Company aims to reward executives with a level and mix of remuneration commensurate with their position and responsibilities within the Company and so as to:
• RewardexecutivesforCompanyandindividualperformanceagainsttargetssetbyreferencetoappropriatebenchmarks;• Aligntheinterestsof executiveswiththoseof shareholders;• Linkrewardwiththestrategicgoalsandperformanceof theCompany;and• Ensuretotalremunerationiscompetitivebymarketstandards
StructureThe Executive Director and Key Management Personnel receive a base salary (which is based on factors such as length of service and experience), which is calculated on a total cost basis and includes any FBT charges related to employee benefits including motor vehicles, as well as employer contributions to superannuation funds.
Company Performance, Shareholder Wealth, Directors and Key Management Personnel Remuneration (Audited)
No link exists (except for the CEO’s options), at this stage in the Company’s development, between financial performance, shareholder wealth and the remuneration of Directors and Key Management Personnel. The CEO options have specific share price vesting criteria which were approved by shareholders at the AGM held on 28 November 2008.
B. Details of Remuneration for the Year Ended 30 June 2009 (Audited)
The remuneration for each Director and each of the five Key Management Personnel of the Economic Entity receiving the highest remuneration during the year was as follows:
Directors
Jim Bosnjak Chairman
Alan Shortall Chief Executive Officer
Jeff Carter Non-executive Director and Company Secretary
William Galle Non-executive Director
Key Management Personnel of Economic Entity
Bernhard Opitz Senior Vice President, Operations (appointed 2 December 2008)
Dan Calvert Chief Financial Officer (appointed 2 December 2008)
Stephen Allan Vice President, Marketing and Communications
Eugene Shortall Senior Vice President, RTFS
Mark Iampietro Vice President, Quality Systems and Regulatory Affairs (appointed 17 October 2008)
Directors’ ReportF
or p
erso
nal u
se o
nly

Annual REPORT 2009 +37
(i) Non-executive Director fees from 1 February 2009 of $18,930. Company Secretarial services from 1 February 2009 of $123,811.(ii) Executive for period to 31 January 2009. Includes payment of accrued annual leave on redundancy. Redundancy terms were approved by
shareholders at the AGM held on 28 November 2008.
Performance Income as a Proportion of Total Remuneration (Audited)
Executive Directors and Key Management Personnel may be paid performance based bonuses based on set monetary figures, rather than proportions of their salary. This has led to the proportions of remuneration related to performance varying between individuals. The Board has set these bonuses to encourage achievement of specific goals that have been given a high level of importance in relation to the future growth and profitability of the Economic Entity. The Board will review the performance bonuses to gauge their effectiveness against achievement of the set goals, and adjust future years’ incentives as they see fit to ensure use of the most cost effective and efficient methods.
Mr Alan Shortall’s performance income was as a result of the successful management of the Company, including building an executive team and negotiating agreements with key business partners, including the negotiation and completion of the Industrialisation Agreement with the Pharmaceutical Partner.
Mr Jeff Carter’s performance income was as a result of the undertaking and successfully managing corporate advisory, company secretarial and ASX reporting requirements in Australia, including strategic potential reverse merger negotiations.
Mr Bernhard Opitz’s performance income was a result of the successful expansion of the Company’s operational capabilities and production personnel.
Mr Dan Calvert’s performance income was a result of the successful management of the Company’s financial affairs, the development of business plan models and corporate strategy.
Mr Stephen Allan’s performance income was a result of the successful management of the Company’s marketing activities and liaison with government, investors, media, and stakeholders.
Post- employmentbenefits
Share-basedPaymentShort-termBenefits
NameCash
Salary & Fees
Cash Bonus
Non-monetary Benefits
Redun-dancy
Super- annuation
Options & Shares Total
Performance Related
(Cash Bonus)$ $ $ $ $ $ $ %
DirectorsNon-executive
Mr J Bosnjak 120,000 - - - 10,800 76,939 207,739 -
Mr J Carter (i) 142,741 - 12,503 - 2,025 67,280 224,549 -
Mr W Galle 64,709 - - - - 44,945 109,654 -
Executive
Mr A Shortall 433,579 378,205 189,324 - - 2,798,166 3,799,274 10.0%
Mr J Carter (ii) 152,890 107,500 17,505 274,800 14,025 94,191 660,911 16.2%
913,919 485,705 219,332 274,800 26,850 3,081,521 5,002,127 -
Key Management Personnel
Mr B Opitz 161,964 49,129 29,911 - 11,848 112,782 365,634 13.4%
Mr D Calvert 115,175 49,908 10,323 - 8,694 112,782 296,882 16.8%
Mr S Allan 246,601 50,000 16,493 - 13,670 102,922 429,686 11.6%
Mr E Shortall 248,333 56,068 11,197 - - 87,337 402,935 13.9%
Mr M Iampietro 162,658 43,795 54,865 - 13,429 49,033 323,780 13.5%
934,731 248,900 122,789 - 47,641 464,856 1,818,917 -
Directors’ ReportF
or p
erso
nal u
se o
nly

+38 Annual REPORT 2009
Mr Eugene Shortall’s performance income was a result of the successful management of the Unilife Ready-to-Fill Syringe project and the completion of key project milestones.
Mr Mark Iampietro’s performance income was a result of the successful conversion and improvement of the Company’s quality systems and the successful completion of independent audits.
C. Service Agreements (Audited)
Remuneration and other terms of employment for the Executive Directors and Key Management Personnel are formalised in contracts of employment. The major provisions of the agreement relating to remuneration are set out below.
Non-executive Directors
Total remuneration for all Non-executive Directors is determined by the Board within the maximum amount approved by the shareholders. This maximum currently stands at $300,000 per annum. Given the limited resources and other relevant factors such as the current size of the Board of Directors during the financial year ended 30 June 2009, a performance evaluation of the Directors was not undertaken during the reporting period.
Mr Jim Bosnjak, Chairman• Termof agreement–unspecified• Basesalary,inclusiveof superannuation,asatdateof thisreport,$130,800,tobereviewedannuallybytheBoard• Noticeperiodof onemonth• Noshortorlongtermincentivesspecified
Mr Jeff Carter, Company Secretary• Termof agreement–unspecified• BasesalaryasaNon-executiveDirector,inclusiveof superannuationasatthedateof thisreportis$4,905permonthtobereviewedannually• Employedasaconsultantasatthedateof thisreport,$20,000permonth• Noticeperiodof twomonthsasaconsultant• Noshortorlongtermincentivesspecified
Mr William Galle, Non-executive Director• Termof agreement–unspecified• Basesalary,inclusiveof superannuation,asatthedateof thisreport,US$36,000plusaBoardattendanceperdiemonacasebycasebasis,
to be reviewed annually by the Board• Noticeperiodof onemonth• Noshortorlongtermincentivesspecified
Executive Director
Mr Alan Shortall, ChiefExecutiveOfficer• Termof agreement–unspecified• Basesalary,inclusiveof superannuation,asatthedateof thisreport,US$420,000,tobereviewedannuallybytheBoard• Noticeperiodof threemonths• Shorttermincentiveof US$200,000–Boarddiscretion• LongtermincentivesspecifiedincontractandapprovedbyshareholdersattheAGMon28November2008• If terminatedanytimebetweenthedateof theExecutive’srelocationtotheUSAandthefirstanniversaryof thatdate,anamountequalto15
months of the Executive’s total package will be paid.
Directors’ ReportF
or p
erso
nal u
se o
nly

Annual REPORT 2009 +39
Key Management Personnel
Mr Bernhard Opitz, Senior Vice President, Operations• Termof agreement–unspecified• Basesalaryasatthedateof thisreport,US$210,000,tobereviewedannuallybytheBoard• Noticeperiodisunspecified,severanceof ninemonths• Shorttermincentiveis30%of basesalary–Boarddiscretion;nolongtermincentiveotherthanEmployeeOptions
Mr Daniel Calvert, ChiefFinancialOfficer• Termof agreement–unspecified• Basesalaryasatthedateof thisreport,US$160,000,tobereviewedannuallybytheBoard• Noticeperiodisunspecified,severanceof sixmonths• Shorttermincentiveis40%of basesalary–Boarddiscretion;nolongtermincentiveotherthanEmployeeOptions
Mr Stephen Allan, Vice President, Marketing and Communications• Termof agreement–3years• Basesalary,inclusiveof superannuation,asatthedateof thisreport,US$130,000,tobereviewedannuallybytheBoard• Noticeperiodisunspecified• Shorttermincentiveof US$25,000-Boarddiscretion;nolongtermincentiveotherthanEmployeeOptions
Mr Eugene Shortall, RTFS Project Director• Termof agreement–ends31December2009;6monthrenewalsthereafter• Employedasaconsultant(viaMedicalMiddleEast),asatthedateof thisreport,$240,000,tobereviewedannuallybytheBoard• Noticeperiodof 30days• Shorttermincentive–Boarddiscretion;nolongtermincentiveotherthanEmployeeOptions
Mr Mark Iampietro, Vice President, Quality Systems and Regulatory Affairs• Termof agreement–unspecified• Basesalary,inclusiveof superannuation,asatthedateof thisreport,US$185,000,tobereviewedannuallybytheBoard• Noticeperiodisunspecified,severancepayof sixmonths• Shorttermincentiveis25%of basesalary–Boarddiscretion;nolongtermincentiveotherthanEmployeeOptions
Directors’ ReportF
or p
erso
nal u
se o
nly

+40 Annual REPORT 2009
Details of Remuneration for the Year Ended 30 June 2008 (Audited)
The remuneration for each Director and each of the Key Management Personnel of the Economic Entity receiving the highest remuneration during the year was as follows:
Details of Remuneration Fixed and Performance
The relative proportions of remuneration that are linked to performance and those that are fixed as follows:
Name Fixed Remuneration At Risk STI At Risk LTI
2009 2008 2009 2008 2009 2008
DirectorsNon-executive
Mr J Bosnjak 63.0% 64.0% - - 37.0% 36.0%
Mr J Carter 69.6% 66.6% 16.2% 12.4% 14.3% 21.0%
Mr W Galle 59.0% 100.0% - - 41.0% -
Executive
Mr A Shortall 16.4% 100.0% 10.0% - 73.6% -
Key Management Personnel
Mr B Opitz 55.7% - 13.4% - 30.9% -
Mr D Calvert 45.2% - 16.8% - 38.0% -
Mr S Allan 64.4% 100.0% 11.6% - 24.0% -
Mr E Shortall 64.4% 55.6% 13.9% 26.3% 21.7% 18.1%
Mr M Iampietro 71.3% - 13.5% - 15.2% -
Directors’ Report
Post- employment
BenefitsShare-based
PaymentShort-term Benefits
NameCash
Salary & Fees
Cash Bonus
Non-monetary Benefits
Super- annuation Options Total Performance
Related
$ $ $ $ $ $ %
DirectorsNon-executive
Mr J Bosnjak 52,000 - - 4,680 31,821 88,501 -
Mr W Galle 5,221 - - - - 5,221 -
Executive
Mr A Shortall 360,000 - 54,153 - - 414,153 -
Mr J Carter 222,043 50,100 24,951 21,473 84,858 403,425 12.4%
639,264 50,100 79,104 26,153 116,679 911,300 -
Key Management Personnel
Mr E Paukovits 167,325 - 13,386 - - 180,711 -
Mr J Kelly 200,000 91,770 25,873 18,000 95,737 431,380 21.3%
Mr M Gow 158,667 - 7,528 14,010 32,081 212,286 -
Mr C Thorley 100,000 75,000 26,227 9,000 - 210,227 35.7%
Mr J Kaal 100,000 75,000 23,002 9,000 - 207,002 36.2%
Mr E Shortall 105,500 50,000 - - 34,299 189,799 26.3%
831,492 291,770 96,016 50,010 162,117 1,431,405 -
For
per
sona
l use
onl
y

Annual REPORT 2009 +41
Directors’ Report
Details of Remuneration Cash Bonuses and Options
For each bonus and grant of options included in the tables in the Remuneration Report the percentage of the available bonus or grant that was paid or that vested in the financial year is set out below. No cash bonus or options granted was forfeited because the person did not meet the performance criteria. No part of the bonuses is payable in future years. The options only vest if the person is still employed by the company on vesting date. The maximum value of the options yet to vest has been determined as the amount of the grant date fair value of the options that are yet to be expensed.
Options
Cash Bonuses Paid Year Granted Vested
Financial years in which Options
may vestTotal value of Grant
yet to vest
Name % % $
DirectorsNon-executive
Mr J Bosnjak - 2007 100.0% - -2008 83.0% 2010 15,6502009 58.0% 2011 32,5952009 29.0% 2010 29,837
Mr W Galle - 2009 52.0% 2010 19,652
Executive
Mr A Shortall 100.0% 2009 - 2010 1,033,500Mr J Carter 100.0% 2007 80.0% 2010 9,277
Key Management Personnel
Mr B Opitz 100.0% 2009 58.0% 2010 25,06329.0% 2011 30,025
Mr D Calvert 100.0% 2009 58.0% 2010 60,15029.0% 2011 25,063
Mr S Allan 100.0% 2009 83.0% 2010 8,46942.0% 2011 55,87427.0% 2012 66,473
Mr E Shortall 100.0% 2008 80.0% 2010 47,303Mr M Iampietro 100.0% 2009 75.0% 2010 5,769
37.0% 2011 14,421
For
per
sona
l use
onl
y

+42 Annual REPORT 2009
No cash bonuses or options issued as part of any Director’s and key management personnel’s remuneration were forfeited during the year.
Further details relating to options are set out below:
Remuneration Options for the Year Ended 30 June 2009 (Audited)
Directors’ Report
Vested Number
Granted Number Grant Date
Value per Option at
Grant Date
Exercise Price per
Share
First Exercise
Date
Last Exercise
DateDirectors ($) ($)
Mr J Bosnjak (i) - 1,000,000 28 Nov 08 $0.12 $0.35 21 Dec 09 31 Dec 12
Mr A Shortall (ii) - 7,500,000 28 Nov 08 $0.14 $0.33 - 30 Sep 13
Mr J Carter - - - - - - -
Mr W Galle (iii) 100,000 550,000 28 Nov 08 $0.12 $0.35 28 Nov 08 31 Dec 12
Key Management Personnel
Mr B Opitz (iv) 500,000 1,500,000 2 Dec 08 $0.12 $0.33 2 Dec 08 30 Jun 12
Mr D Calvert (v) 500,000 1,500,000 2 Dec 08 $0.12 $0.33 2 Dec 08 30 Jun 12
Mr S Allan (vi) 300,000 1,000,000 1 Sep 08 $0.17 $0.33 1 Sep 08 30 Jun 12
Mr M Iampietro (vii) 200,000 600,000 17 Oct 08 $0.12 $0.33 17 Oct 08 30 Jun 12
Mr E Shortall - - - - - - -
Total 1,600,000 13,650,000
Terms and Conditions for each Grant
A Remuneration
consisting of Options
B Value at
Grant Date
C Value at
Exercise Date
D Value at
Lapse DateName % $ $ $
Directors Non-executive
Mr J Bosnjak 37.0% 120,350 - -
Mr W Galle 41.0% 64,598 - -
Executive
Mr A Shortall 14.4% 1,033,500 - -
Mr J Carter 18.2% - - -
Key Management Personnel
Mr B Opitz 30.8% 180,450 - -
Mr D Calvert 38.0% 180,450 - -
Mr S Allan 24.0% 169,370 - -
Mr E Shortall 21.7% - - -
Mr M Iampietro 15.1% 69,222 - -
For
per
sona
l use
onl
y

Annual REPORT 2009 +43
(i) Mr J Bosnjak was granted 1,000,000 ($57,918) options (approved by Shareholders on 28 November 2008) as part of remuneration. Total remuneration represented by these options is 36%. The options were granted under the Employee Share Option Plan. 350,000 will vest on 21 December 2009, 350,000 will vest on 21 December 2010 and 300,000 will vest upon the listing of the Company on a worldwide recognised stock exchange.
(ii) Mr A Shortall was granted 7,500,000 ($548,166) options (approved by Shareholders on 28 November 2008) as part of remuneration. Total remuneration represented by these options is 14%. The options were granted under the Employee Share Option Plan.
a. 1,000,000 options will vest upon the closing price of the Shares on the ASX being $0.48 or higher on 20 out of any 30 consecutive trading days between the date of issue of the options and the expiry date of the options;
b. 1,000,000 options will vest on the later of the six month anniversary of the date of issue of the options and the date on which the closing price of the Shares on the ASX has reached $0.58 or higher on 20 out of any 30 consecutive trading days between the date of issue of the options and the expiry date of the options;
c. 1,000,000 options will vest on the later of the twelve month anniversary of the date of issue of the options and the date on which the closing price of the Shares on the ASX has reached $0.70 or higher on 20 out of any 30 consecutive trading days between the date of issue of the options and the expiry date of the options;
d. 2,000,000 options will vest on the later of the eighteen month anniversary of the date of issue of the options and the date on which the closing price of the Shares on the ASX has reached $0.84 or higher on 20 out of any 30 consecutive trading days between the date of issue of the options and the expiry date of the options; and
e. 2,500,000 options will vest on the later of the thirty month anniversary of the date of issue of the options and the date on which the closing price of the Shares on the ASX has reached $1.01 or higher on 20 out of any 30 consecutive trading days between the date of issue of the options and the expiry date of the options.
(iii) Mr W Galle was granted 550,000 ($44,945) options (approved by Shareholders on 28 November 2008) as part of remuneration. Total remuneration represented by these options is 41%. The options were granted under the Employee Share Option Plan. 100,000 options vested 28 November 2008, 100,000 vested on 1 July 2009 and 100,000 options will vest on 1 July 2010. 250,000 options will vest upon the listing of the Company on a worldwide recognised stock exchange.
(iv) Mr B Opitz was granted 1,500,000 ($112,782) options as part of remuneration. Total remuneration represented by these options is 31%. The options were granted under the Employee Share Option Plan. The 1,500,000 options are vested over two years. 500,000 options vested 2 December 2008, 500,000 options will vest on 2 December 2009 and 500,000 options will vest on 2 December 2010. Vesting of options is contingent upon continuing employment.
(v) Mr D Calvert was granted 1,500,000 ($112,782) options as part of remuneration. Total remuneration represented by these options is 38%. The options were granted under the Employee Share Option Plan. The 1,500,000 options are vested over two years. 500,000 options vested 2 December 2008, 500,000 options will vest on 2 December 2009 and 500,000 options will vest on 2 December 2010. Vesting of options is contingent upon continuing employment.
(vi) Mr S Allan was granted 1,000,000 ($82,333) options as part of remuneration. Total remuneration represented by these options is 24%. The options were granted under the Employee Share Option Plan. The 1,000,000 options are vested over three years. 300,000 options will vest 1 September 2009, 300,000 options will vest 1 September 2010 and 400,000 options will vest 1 September 2011. Vesting of options is contingent upon continuing employment.
(vii) Mr M Iampietro was granted 600,000 ($49,033) options as part of remuneration. Total remuneration represented by these options is 15%. The options were granted under the Employee Share Option Plan. The 600,000 options are vested over two years. 200,000 options vested 17 October 2008, 200,000 options will vest 17 October 2009 and 200,000 options will vest 17 October 2010. Vesting of options is contingent upon continuing employment.
Directors’ ReportF
or p
erso
nal u
se o
nly

+44 Annual REPORT 2009
Remuneration Options for the Year Ended 30 June 2008 (Audited)
i) Mr J Bosnjak was granted 1,000,000 ($31,821) options as part of remuneration. Total remuneration represented by these options is 36.0%. The options were granted under the Employee Share Option Plan. 1,000,000 options are vested over three years (from date of announcement i.e., 21 December 2006). 333,333 vested upon Shareholder approval (30 November 2007), 333,333 vested 21 December 2007 and 333,334 vested 21 December 2008. Note: The “Grant Date” of 30 November 2007 is when Shareholder approval was granted at the AGM. The “Value per Option at Grant Date” has been calculated from the date of the announcement i.e., 21 December 2006. Vesting of options is contingent upon continuing employment.
ii) Mr J Carter was granted 2,500,000 ($178,821) options as part of remuneration. Total remuneration represented by these options is 44.3%. The options were granted under the Employee Share Option Plan. 2,500,000 options are vested over three years. 500,000 options vested 30 November 2007, 500,000 vested on 4 October 2008 and 500,000 will vest on 4 October 2009. 1,000,000 vested upon the signing of the Agreement with the Pharmaceutical Partner on 1 July 2008. Note: The “Grant Date” of 30 November 2007 is when Shareholder approval was granted at the AGM. The “Value per Option at Grant Date” has been calculated from the date of the announcement i.e., 5 October 2007. Vesting of options is contingent upon continuing employment.
iii) Mr J Kelly was granted 2,500,000 ($178,821) options as part of remuneration. Total remuneration represented by these options is 41.5%. The options were granted under the Employee Share Option Plan. 2,500,000 options are vested over three years. 500,000 options vested 5 October 2007 and 1,000,000 vested upon the signing of the Agreement with the Pharmaceutical Partner on 1 July 2008. Mr Kelly left the Company in July 2008 and the remaining unvested 1,000,000 options were relinquished at that date. Vesting of options is contingent upon continuing employment.
iv) Mr E Shortall was granted 750,000 ($34,299) options as part of remuneration. Total remuneration represented by these options is 18.1%. 750,000 options are vested over two and a half years. 150,000 options vested 30 June 2008, 150,000 options vested on 30 September 2008, 150,000 options will vest on 30 September 2009 and 300,000 options vested upon the signing of the Agreement with the Pharmaceutical Partner on 1 July 2008. Vesting of options is contingent upon continuing employment.
This is the end of the audited remuneration report.
Directors’ Report
Vested Number
Granted Number Grant Date
Value per Option at
Grant Date
Exercise Price per
Share
First Exercise
Date
Last Exercise
DateDirectors ($) ($)
Mr J Bosnjak (i) 666,666 1,000,000 30 Nov 07 $0.10 $0.25 30 Nov 07 31 Dec 09
Mr A Shortall - - - - - - -
Mr J Carter (ii) 500,000 2,500,000 30 Nov 07 $0.14 $0.25 30 Nov 07 31 Dec 10
Mr W Galle - - - - - - -
Key Management Personnel
Mr E Paukovits - - - - - - -
Mr J Kelly (iii) 500,000 2,500,000 5 Oct 07 $0.14 $0.25 5 Oct 07 31 Dec 10
Ms M Gow - - - - - - -
Mr C Thorley - - - - - - -
Mr J Kaal - - - - - - -
Mr E Shortall (iv) 150,00 750,000 30 Jun 08 $0.23 $0.35 30 Jun 08 31 Dec 10
Total 1,816,666 6,750,000
Terms and Conditions for each Grant
For
per
sona
l use
onl
y

Annual REPORT 2009 +45
MEETINGS OF DIRECTORSDuring the financial year, twelve meetings of Directors were held. Attendances by each Director during the year were as follows:
A–NumberofmeetingsheldduringthetimetheDirectorheldofficeduringthereportingperiod.B–Numberofmeetingsattended.
During the financial year, there were no meetings of the Audit Committee or Remuneration Committee.
INDEMNIFYING DIRECTORS AND EXECUTIVE OFFICERSThe Company has agreed to indemnify the present Directors against all liabilities to another person (other than the Company or a related body corporate) that may arise from their position as Directors, except where the liability arises out of conduct involving a lack of good faith. Under the arrangement, the Company will meet the full amount of any such liabilities, including costs and expenses.
The Company has also agreed to indemnify the Directors of its Controlled Entities for all liabilities to another person (other than the Company or a related body corporate) that may arise from their position, except where the liability arises out of conduct involving a lack of good faith. This arrangement stipulates that the Company will meet the full amount of any such liabilities, including costs and expenses.
The Company has agreed to indemnify Executive Officers for all liabilities to another person (other than the Company or a related body corporate) that may arise from their position in the Company and its Controlled Entities, except where the liability arises out of conduct involving a lack of good faith. This arrangement stipulates that the Company will meet the full amount of any such liabilities, including costs and expenses.
INSURANCE PREMIUMSThe Directors have not included details of the nature of the liabilities covered or the amount of the premium paid in respect of the Directors’ and Officers’ liability insurance contracts because disclosure is prohibited under the terms of the contract.
Directors’ Report
Director Board Meetings
A B
J Bosnjak 12 12
A Shortall 12 12
J Carter 12 12
W Galle 12 12
For
per
sona
l use
onl
y

+46 Annual REPORT 2009
OPTIONSAt the date of this report, the unissued ordinary shares of Unilife Medical Solutions Limited under option are as follows:
During the year ended 30 June 2009, the Company issued 585,189 ordinary shares as a result of the exercise of options (500,000 options at $0.0001 each, 55,189 options at $0.45 each and 30,000 options at $0.50 each).
No person entitled to exercise the option had or has any right by virtue of the option to participate in any share issue of any other body corporate.
Each option entitles the holder to be issued with one ordinary share in the capital of the Company subject to payment of the relevant issue price and satisfaction of applicable conditions (if any).
PROCEEDINGS ON BEHALF OF COMPANY No person has applied for leave of Court to bring proceedings on behalf of the Company or intervene in any proceedings to which the Company is a party for the purpose of taking responsibility on behalf of the Company for all or any part of those proceedings.
The Company was not a party to any proceedings during the year.
Directors’ Report
Date of Expiry Exercise Price Number Under-Option
31.12.2009 $1.90 235,000
31.12.2009 $0.25 2,900,000
31.12.2010 $0.25 3,040,000
30.12.2010 $0.35 750,000
30.06.2010 $0.45 700,000
31.12.2010 $0.33 2,600,000
31.08.2011 $0.45 250,000
30.09.2011 $0.25 3,000,000
30.06.2012 $0.30 1,000,000
30.06.2012 $0.33 3,900,000
30.06.2012 $0.35 2,000,000
01.10.2012 $0.33 500,000
31.12.2012 $0.33 1,000,000
31.12.2012 $0.35 550,000
30.09.2013 $0.33 10,500,000
28.02.2014 $0.50 600,000
33,525,000
For
per
sona
l use
onl
y

Annual REPORT 2009 +47
NON-AUDIT SERVICES The Company may decide to employ the auditor on assignments additional to their statutory audit duties where the auditor’s expertise and experience with the Company and/or the Group are important. Details of the amounts paid or payable to the auditor BDO Kendalls Audit & Assurance (WA) for audit and non-audit services provided during the year are set out below.
The Board of Directors, in accordance with advice from the Audit Committee, is satisfied that the provision of non-audit services during the year is compatible with the general standard of independence for auditors imposed by the Corporations Act 2001. The Directors are satisfied that the services disclosed below did not compromise the external auditor’s independence for the following reasons:
• allnon-auditservicesarereviewedandapprovedbytheauditcommitteepriortocommencementtoensuretheydonotadverselyaffecttheintegrity and objectivity of the auditor; and
• thenatureof the servicesprovideddonot compromise thegeneral principles relating to auditor independenceas set out in the Instituteof Chartered Accountants in Australia and CPA Australia’s Professional Statement APES 110: Code of Ethical Behaviour for Professional Accountants.
The following fees for non-audit services were paid to the external auditors during the year ended 30 June 2009:
BDO Kendalls (WA)
BDO Kendalls (WA) Corporate Tax Pty Ltd (Tax Compliance) $ 24,285 BDO Kendalls (WA) Corporate Finance Pty Ltd $ 21,557 $ 45,842
AUDITOR’S INDEPENDENCE DECLARATIONThe lead auditor’s independence declaration for the year ended 30 June 2009 as required under Section 307C of the Corporations Act can be found on page 48 of the Directors’ Report.
Signed in accordance with a resolution of the Board of Directors.
Jim BosnjakChairmanSydney, New South Wales30 September 2009
Directors’ ReportF
or p
erso
nal u
se o
nly

+48 Annual REPORT 2009
30 September 2009
The DirectorsUnilife Medical Solutions Limited Suite 3,Level 11,1 Chifley Square,SYDNEY 2000
Dear Sirs
DECLARATION OF INDEPENDENCE BY CHRIS BURTON TO THE DIRECTORS OF UNILIFE MEDICAL SOLUTIONS LIMITED
As lead auditor of Unilife Medical Solutions Limited for the year ended 30 June 2009, I declare that, to the best of my knowledge and belief, there have been no contraventions of:
• theauditorindependencerequirementsof theCorporationsAct2001inrelationtotheaudit;and
• anyapplicablecodeof professionalconductinrelationtotheaudit.
This declaration is in respect of Unilife Medical Solutions Limited and the entities it controlled during the year.
Chris BurtonDirector
BDO Kendalls Audit & Assurance (WA) Pty LtdPerth, Western Australia
Auditor’s Independence DeclarationUnder Section 307C of the Corporations Act 2001 to the Directors of Unilife Medical Solutions Limited
For
per
sona
l use
onl
y

Annual REPORT 2009 +49
We have audited the accompanying financial report of Unilife Medical Solutions Limited, which comprises the balance sheet as at 30 June 2009, and the income statement, statement of changes in equity and cash flow statement for the year ended on that date, a summary of significant accounting policies, other explanatory notes and the directors’ declaration of the entity comprising the company and the entities it controlled at the year’s end or from time to time during the financial year.
Directors’ Responsibility for the Financial Report
The directors of the company are responsible for the preparation and fair presentation of the financial report in accordance with Australian Accounting Standards (including the Australian Accounting Interpretations) and the Corporations Act 2001. This responsibility includes establishing and maintaining internal controls relevant to the preparation and fair presentation of the financial report that is free from material misstatement, whether due to fraud or error; selecting and applying appropriate accounting policies; and making accounting estimates that are reasonable in the circumstances. In Note 1, the directors also state, in accordance with Accounting Standard AASB101 Presentation of Financial Statements, that compliance with the Australian equivalents to International Financial Reporting Standards ensures that the financial report, comprising the financial statements and notes, complies with International Financial Reporting Standards.
Auditor’s Responsibility
Our responsibility is to express an opinion on the financial report based on our audit. We conducted our audit in accordance with Australian Auditing Standards. These Auditing Standards require that we comply with relevant ethical requirements relating to audit engagements and plan and perform the audit to obtain reasonable assurance whether the financial report is free from material misstatement.
An audit involves performing procedures to obtain audit evidence about the amounts and disclosures in the financial report. The procedures selected depend on the auditor’s judgement, including the assessment of the risks of material misstatement of the financial report, whether due to fraud or error. In making those risk assessments, the auditor considers internal control relevant to the entity’s preparation and fair presentation of the financial report in order to design audit procedures that are appropriate in the circumstances, but not for the purpose of expressing an opinion on the effectiveness of the entity’s internal control. An audit also includes evaluating the appropriateness of accounting policies used and the reasonableness of accounting estimates made by the directors, as well as evaluating the overall presentation of the financial report.
We believe that the audit evidence we have obtained is sufficient and appropriate to provide a basis for our audit opinions.
Independent Audit Reportto the Members of Unilife Medical Solutions Limited
For
per
sona
l use
onl
y

+50 Annual REPORT 2009
Independence
In conducting our audit, we have complied with the independence requirements of the Corporations Act 2001. We confirm that the independence declaration required by the Corporations Act 2001 would be in the same terms if it had been given to the directors at exactly the same time that this auditor’s report was made.
Auditor’s Opinion
In our opinion:
(a) the financial report of Unilife Medical Solutions Limited is in accordance with the Corporations Act 2001, including:
(i) giving a true and fair view of the company’s and consolidated entity’s financial position as at 30 June 2009 and of their performance for the year ended on that date; and
(ii) complying with Australian Accounting Standards (including the Australian Accounting Interpretations) and the Corporations Regulations 2001; and
(b) the financial report also complies with International Financial Reporting Standards as disclosed in Note 1.
Report on the Remuneration Report
We have audited the Remuneration Report included within the Directors’ Report for the year ended 30 June 2009. The directors of the company are responsible for the preparation and presentation of the Remuneration Report in accordance with section 300A of the Corporations Act 2001. Our responsibility is to express an opinion on the Remuneration Report, based on our audit conducted in accordance with Australian Auditing Standards.
In our opinion, the Remuneration Report of Unilife Medical Solutions Limited for the year ended 30 June 2009, complies with section 300A of the Corporations Act 2001.
BDO Kendalls Audit and Assurance (WA) Pty Ltd
Chris BurtonDirector
Dated this 30th day of September 2009Perth, Western Australia
Independent Audit Reportto the Members of Unilife Medical Solutions Limited
For
per
sona
l use
onl
y

Annual REPORT 2009 +51
The Directors of the Company declare that:
1. the financial report and notes, as set out on pages 52-98, are in accordance with the Corporations Act 2001, and:
a. comply with Accounting Standards and the Corporations Regulations 2001; and
b. give a true and fair view of the financial position as at 30 June 2009 and of the performance for the year ended on that date of the Company and Economic Entity;
c. the audited remuneration disclosures set out on pages 35 to 44 of the Directors’ Report for the year ended 30 June 2009, comply with section 300A of the Corporations Act 2001.
2. the Chief Executive Officer and Chief Finance Officer have each declared that:
a) the financial records of the Company for the financial year have been properly maintained in accordance with section 286 of the Corporations Act 2001;
b) the financial statements and notes for the financial year comply with the Accounting Standards; and
c) the financial statements and notes for the financial year give a true and fair view.
3. in the Director’s opinion there are reasonable grounds to believe that the Company will be able to pay its debts as and when they become due and payable.
The Company and a wholly-owned subsidiary, Unitract Syringe Pty Ltd, have entered into a deed of cross guarantee under which the Company and its subsidiary guarantee the debts of each other.
At the date of this declaration, there are reasonable grounds to believe that the Companies which are party to this deed of cross guarantee will be able to meet any obligations or liabilities to which they are, or may become subject to, by virtue of the deed.
This declaration is made in accordance with a resolution of the Directors.
Director
Jim Bosnjak (Chairman)
Dated 30 September 2009
Director’s DeclarationF
or p
erso
nal u
se o
nly

+52 Annual REPORT 2009
The Income Statements are to be read in conjunction with the accompanying Notes to the Financial Statements.
Note Economic Entity Parent Entity
2009 2008 2009 2008
$ $ $ $
Revenue from continuing operations 3 4,637,112 3,708,655 484,573 436,379
Other income 3 35,776,594 461,511 35,622,156 333,072
Cost of goods sold (5,732,353) (3,098,651) - -
Employee expense 4 (5,844,643) (3,250,097) (1,567,140) (668,104)
Depreciation and amortisation expenses 4 (1,210,022) (803,881) (553,953) (417,017)
Other expenses 4 (10,503,988) (4,485,808) (3,691,599) (1,958,450)
Loss on sale of non-current assets (6,692) - - -
Finance costs 4 (245,220) (387,065) (71,628) (146,838)
Expense associated with issue of convertible note (87,148) (124,300) (87,148) (124,300)
Share based payments 22 (4,957,187) (681,217) (4,957,187) (681,217)
Provision for loan non-recovery - - (12,045,942) (6,077,503)
Profit /(loss) before income tax expense 11,826,453 (8,660,853) 13,132,132 (9,303,978)
Income tax benefit 6 980,041 43,615 - -
Profit /(loss) attributable to members of the Company 12,806,494 (8,617,238) 13,132,132 (9,303,978)
Cents Cents
Basic earnings/(loss) per share (cents per share) 7 6.2 (4.4)
Diluted earnings/(loss) per share (cents per share 7 6.2 n/a
Income Statements For the Year Ended 30 June 2009
For
per
sona
l use
onl
y

Annual REPORT 2009 +53
The Balance Sheets are to be read in conjunction with the accompanying Notes to the Financial Statements.
Balance SheetsFor the Year Ended 30 June 2009
Note Economic Entity Parent Entity
2009 2008 2009 2008
ASSETS $ $ $ $
CURRENT ASSETSCash and cash equivalents 9 4,506,684 3,002,277 3,462,410 2,930,957
Trade and other receivables 10 9,771,104 1,069,942 16,009,846 6,423,852
Inventories 11 1,362,851 1,107,515 - -
Other current assets 12 182,591 36,286 4,941 4,564
TOTAL CURRENT ASSETS 15,823,230 5,216,020 19,477,197 9,359,373
NON-CURRENT ASSETSOther financial assets 13 - - 19,164,430 7,464,595
Property, plant and equipment 15 11,352,786 8,111,437 1,529,983 2,093,283
Intangible assets 16 13,627,986 6,849,797 - -
Other non-current assets 17(a) 6,761,668 6,515,002 - -
Deferred tax assets 17(b) 1,847,664 593,864 - -
TOTAL NON-CURRENT ASSETS 33,590,104 22,070,100 20,694,413 9,557,878
TOTAL ASSETS 49,413,334 27,286,120 40,171,610 18,917,251
CURRENT LIABILITIESTrade and other payables 18 8,945,418 1,854,916 6,762,996 672,261
Borrowings 19 503,361 4,333,621 - 4,234,490
TOTAL CURRENT LIABILITIES 9,448,779 6,188,537 6,762,996 4,906,751
NON-CURRENT LIABILITIESBorrowings 19 3,390,133 3,162,656 - -
Deferred tax liabilities 20 296,457 57,826 - -
TOTAL NON-CURRENT LIABILITIES 3,686,590 3,220,482 - -
TOTAL LIABILITIES 13,135,369 9,409,019 6,762,996 4,906,751
NET ASSETS 36,277,965 17,877,101 33,408,614 14,010,500
EQUITYIssued capital 21 75,458,648 72,254,862 75,458,648 72,254,862
Reserves 26 4,994,881 2,604,297 5,619,139 2,556,943
Accumulated losses 26 (44,175,564) (56,982,058) (47,669,173) (60,801,305)
TOTAL EQUITY 36,277,965 17,877,101 33,408,614 14,010,500
For
per
sona
l use
onl
y

+54 Annual REPORT 2009
Share Capital
OrdinaryAccumulated
LossesShare Based
Payment Reserve
Foreign Exchange Unrealised
ReserveTotal
$ $ $ $ $
Economic Entity Balance at 1 July 2007 66,783,726 (48,364,820) 1,748,972 5,489 20,173,367
Shares issued during the year 5,751,991 - - - 5,751,991
Transaction costs (280,855) - - - (280,855)
Profit/(loss) attributable to members of parent entity - (8,617,238) - - (8,617,238)
- foreign exchange unrealised reserve - - - 41,865 41,865
Total recognised income and expense for the year - (8,617,238) - 41,865 (8,575,373)
Transfer to and from reserve - equity compensation reserve - - 807,971 - 807,971
Balance at 30 June 2008 72,254,862 (56,982,058) 2,556,943 47,354 17,877,101
Shares issued during the year 3,203,786 - - - 3,203,786
Transaction costs - - - - -
Profit/(loss) attributable to members of parent entity - 12,806,494 - - 12,806,494
- foreign exchange unrealised re serve - - - (671,612) (671,612)
Total recognised income and expense for the year - 12,806,494 - (671,612) 12,134,882
Transfer to and from reserve - equity compensation reserve - - 3,062,196 - 3,062,196
Balance at 30 June 2009 75,458,648 (44,175,564) 5,619,139 (624,258) 36,277,965
Parent Entity Balance at 1 July 2007 66,783,726 (51,497,327) 1,748,972 - 17,035,371
Shares issued during the year 5,751,991 - - - 5,751,991
Transaction costs (280,855) - - - (280,855)
Profit/(loss) attributable to members of parent entity - (9,303,978) - - (9,303,978)
Total recognised income and expense for the year - (9,303,978) - - (9,303,978)
Transfer to and from reserve - equity compensation reserve - - 807,971 - 807,971
Balance at 30 June 2008 72,254,862 (60,801,305) 2,556,943 - 14,010,500
Shares issued during the year 3,203,786 - - - 3,203,786
Transaction costs - - - - -
Profit/(loss) attributable to members of parent entity - 13,132,132 - - 13,132,132
Total recognised income and expense for the year - 13,132,132 - - 13,132,132
Transfer to and from reserve - equity compensation reserve - - 3,062,196 - 3,062,196
Balance at 30 June 2009 75,458,648 (47,669,173) 5,619,139 - 33,408,614
The Statements of Changes in Equity are to be read in conjunction with the accompanying Notes to the Financial Statements.
Statements of Changes in EquityAs at 30 June 2009
For
per
sona
l use
onl
y
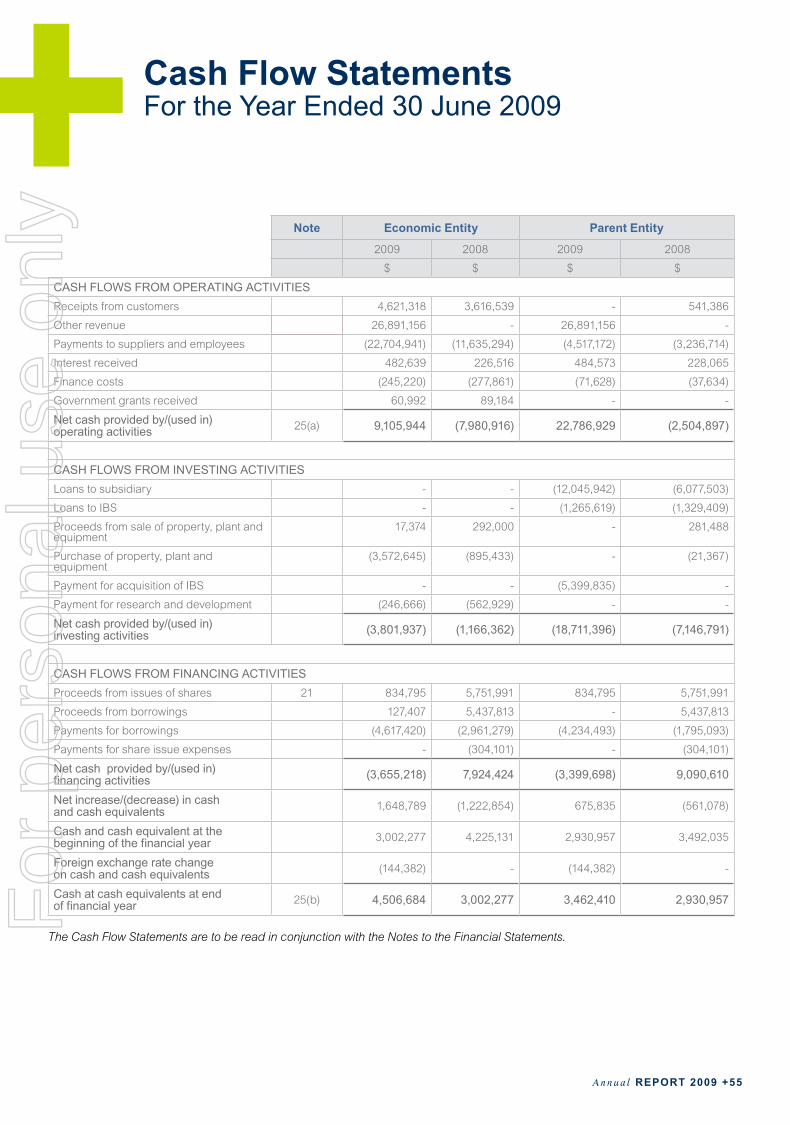
Annual REPORT 2009 +55
The Cash Flow Statements are to be read in conjunction with the Notes to the Financial Statements.
Cash Flow StatementsFor the Year Ended 30 June 2009
Note Economic Entity Parent Entity
2009 2008 2009 2008
$ $ $ $
CASH FLOWS FROM OPERATING ACTIVITIESReceipts from customers 4,621,318 3,616,539 - 541,386
Other revenue 26,891,156 - 26,891,156 -
Payments to suppliers and employees (22,704,941) (11,635,294) (4,517,172) (3,236,714)
Interest received 482,639 226,516 484,573 228,065
Finance costs (245,220) (277,861) (71,628) (37,634)
Government grants received 60,992 89,184 - -
Net cash provided by/(used in) operating activities 25(a) 9,105,944 (7,980,916) 22,786,929 (2,504,897)
CASH FLOWS FROM INVESTING ACTIVITIESLoans to subsidiary - - (12,045,942) (6,077,503)
Loans to IBS - - (1,265,619) (1,329,409)
Proceeds from sale of property, plant and equipment
17,374 292,000 - 281,488
Purchase of property, plant and equipment
(3,572,645) (895,433) - (21,367)
Payment for acquisition of IBS - - (5,399,835) -
Payment for research and development (246,666) (562,929) - -
Net cash provided by/(used in) investing activities (3,801,937) (1,166,362) (18,711,396) (7,146,791)
CASH FLOWS FROM FINANCING ACTIVITIESProceeds from issues of shares 21 834,795 5,751,991 834,795 5,751,991
Proceeds from borrowings 127,407 5,437,813 - 5,437,813
Payments for borrowings (4,617,420) (2,961,279) (4,234,493) (1,795,093)
Payments for share issue expenses - (304,101) - (304,101)
Net cash provided by/(used in) financing activities (3,655,218) 7,924,424 (3,399,698) 9,090,610
Net increase/(decrease) in cash and cash equivalents 1,648,789 (1,222,854) 675,835 (561,078)
Cash and cash equivalent at the beginning of the financial year 3,002,277 4,225,131 2,930,957 3,492,035
Foreign exchange rate change on cash and cash equivalents (144,382) - (144,382) -
Cash at cash equivalents at end of financial year 25(b) 4,506,684 3,002,277 3,462,410 2,930,957F
or p
erso
nal u
se o
nly

+56 Annual REPORT 2009
1 STATEMENT OF SIGNIFICANT ACCOUNTING POLICIES
The financial report is a general purpose financial report that has been prepared in accordance with Australian Accounting Standards, other authoritative pronouncements of the Australian Accounting Standards Board, Australian Accounting Interpretations and the Corporations Act 2001.
The financial report covers the Economic Entity of Unilife Medical Solutions Limited and Controlled Entities, and Unilife Medical Solutions Limited as an individual Parent Entity. Unilife Medical Solutions Limited is a listed public company, incorporated and domiciled in Australia.
The financial report of Unilife Medical Solutions Limited and Controlled Entities, and Unilife Medical Solutions Limited as an individual Parent Entity comply with all Australian equivalents to International Financial Reporting Standards (AIFRS) in their entirety.
The following is a summary of the material accounting policies adopted by the Economic Entity in the preparation of the financial report. The accounting policies have been consistently applied, unless otherwise stated.
Basis of Preparation Compliance with IFRS
Australian Accounting Standards include AIFRS. Compliance with AIFRS ensures that the consolidated financial statements and notes of Unilife Medical Solutions Limited AIFRS comply with International Reporting Standards (IFRS).
Reporting Basis and Conventions
The financial report has been prepared on an accruals basis and is based on historical costs.
Accounting Policies(a) Principles of Consolidation
A Controlled Entity is any entity Unilife Medical Solutions Limited has the power to control the financial and operating policies so as to obtain benefits from its activities. A list of Controlled Entities is contained in Note 13 to the financial statements.
All inter-company balances and transactions between entities in the Economic Entity, including any unrealised profits or losses, have been eliminated on consolidation. Accounting policies of subsidiaries have been changed where necessary to ensure consistencies with those policies applied by the Parent Entity.
Investments in subsidiaries are accounted for at cost in the individual financial statements of Unilife Medical Solutions Limited.
(b) Income Tax
The charge for current income tax expense is based on the profit for the year adjusted for any non-assessable or disallowed items. It is calculated using tax rates that have been enacted or are substantively enacted by the balance sheet date.
Deferred tax is accounted for using the balance sheet liability method in respect of temporary differences arising between the tax bases of assets and liabilities and their carrying amounts in the financial statements. No deferred income tax will be recognised from the initial recognition of an asset or liability, excluding a business combination, where there is no effect on accounting or taxable profit or loss.
Deferred tax is calculated at the tax rates that are expected to apply to the period when the asset is realised or liability is settled. Deferred tax is credited in the Income Statements except where it relates to items that may be credited directly to equity, in which case the deferred tax is adjusted directly against equity.
Deferred income tax assets are recognised to the extent that it is probable that future tax profits will be available against which deductible temporary differences can be utilised.
Notes to the Financial StatementsFor the Year Ended 30 June 2009
For
per
sona
l use
onl
y

Annual REPORT 2009 +57
The amount of benefits brought to account or which may be realised in the future is based on the assumption that no adverse change will occur in income taxation legislation and the anticipation that the Economic Entity will derive sufficient future assessable income to enable the benefit to be realised and comply with the conditions of deductibility imposed by the law.
Unilife Medical Solutions Limited and its wholly-owned Australian subsidiary have formed an income tax consolidated group under the Tax Consolidation Regime. Unilife Medical Solutions Limited is responsible for recognising the current and deferred tax assets and liabilities for the tax consolidated group. The group notified the Australian Taxation Office on 2 June 2004 that it formed an income tax consolidated group to apply from 1 July 2003. The tax consolidated group has entered a tax sharing agreement whereby each company in the group contributes to the income tax payable in proportion to their contribution to the net profit before tax of the tax consolidated group.
(c) Inventories
Inventories are measured at the lower of cost and net realisable value. The cost of manufactured products includes direct materials, direct labour and an appropriate portion of variable and fixed overheads. Overheads are applied on the basis of normal operating capacity. Costs are assigned on the basis of weighted average costs.
(d) Plant and Equipment
Each class of plant and equipment is carried at cost or fair value less, where applicable, any accumulated depreciation and impairment losses.
Plant and equipment are measured on the cost basis less depreciation and impairment losses.
The carrying amount of plant and equipment is reviewed annually by Directors to ensure it is not in excess of the recoverable amount from these assets. The recoverable amount is assessed on the basis of the expected net cash flows which will be received from the assets’ employment and subsequent disposal. The expected net cash flows have been discounted to their present values in determining recoverable amounts.
Subsequent costs are included in the asset’s carrying amount or recognised as a separate asset, as appropriate, only when it is probable that future economic benefits associated with the item will flow to the group and the cost of the item can be measured reliably. All other repairs and maintenance are charged to the Income Statements during the financial period in which they are incurred.
Depreciation
The depreciable amount of all fixed assets including capitalised lease assets is depreciated on a straight-line basis over their useful lives to the Economic Entity commencing from the time the asset is held ready for use. Leasehold improvements are depreciated over the shorter of either the unexpired period of the lease or the estimated useful lives of the improvements.
The depreciation rates used for each class of depreciable asset are:
The assets’ residual values and useful lives are reviewed, and adjusted if appropriate, at each balance sheet date. Work in progress is not being depreciated.
An asset’s carrying amount is written down immediately to its recoverable amount if the asset’s carrying amount is greater than its estimated recoverable amount.
Gains and losses on disposals are determined by comparing proceeds with the carrying amount. These gains or losses are included in the Income Statements. When revalued assets are sold, amounts included in the revaluation reserve relating to that asset are transferred to retained earnings.
Notes to the Financial StatementsFor the Year Ended 30 June 2009
Class of Fixed Asset Depreciation Rate
Leasehold improvements 14.3% - 20%
Plant and equipment 7.5%–40%
Leased plant and equipment 27.5%
For
per
sona
l use
onl
y

+58 Annual REPORT 2009
(e) Leases
Leases of fixed assets where substantially all the risks and benefits incidental to the ownership of the asset, but not the legal ownership that are transferred to entities in the Economic Entity are classified as finance leases.
Finance leases are capitalised by recording an asset and a liability at the lower of the amounts equal to the fair value of the leased property or the present value of the minimum lease payments, including any guaranteed residual values. Lease payments are allocated between the reduction of the lease liability and the lease interest expense for the period.
Leased assets are depreciated on a straight-line basis over their estimated useful lives.
Lease payments for operating leases, where substantially all the risks and benefits remain with the lessor, are charged as expenses in the periods in which they are incurred.
Lease incentives under operating leases are recognised as a liability and amortised on a straight-line basis over the life of the least term.
(f) Business Combinations
The purchase method of accounting is used to account for all business combinations, including business combinations involving entities or businesses under common control, regardless of whether equity instruments or other assets are acquired. Cost is measured as the fair value of the assets given, equity instruments issued or liabilities incurred or assumed at the date of exchange plus costs directly attributable to the acquisition. Where equity instruments are issued in an acquisition, the fair value of the instruments is their published market price as at the date of exchange unless, in rare circumstance, it can be demonstrated that the published price at the date of exchange is an unreliable indicator of fair value and that other evidence and valuation methods provide a more reliable measure of fair value. Transaction costs arising on the issue of equity instruments are recognised directly in equity.
Identifiable assets acquired and liabilities and contingent liabilities assumed in a business combination are measured initially at their fair values at the acquisition date, irrespective of the extent of any minority interest. The excess of the cost of acquisition over the fair value of the Group’s share of the identifiable net assets acquired is recorded as goodwill (refer to note 1(h)). If the cost of acquisition is less than the Group’s share of the fair value of the identifiable net assets of the subsidiary acquired, the difference is recognised directly in the income statement, but only after a reassessment of the identification and measurement of the net assets acquired.
Where settlement of any part of cash consideration is deferred, the amounts payable in the future are discounted to their present value as at the date of exchange. The discount rate used is the entity’s incremental borrowing rate, being the rate at which a similar borrowing could be obtained from an independent financier under comparable terms and conditions.
(g) Investments & Other Financial Assets
Classification
The Group classifies its investments in the following categories: financial assets at fair value though profit or loss, loans and receivables, held-to-maturity investments and available-for-sale financial assets. The classification depends on the purpose for which the investments were acquired. Management determines the classification of it an investments at initial recognition.
Loans and receivables
Loans and receivables are non-derivative financial assets with fixed or determinable payments that are not quoted in an active market and are stated at amortised cost using the effective interest rate method. They are included in current assets, except for those with maturities greater than 12 months after the balance sheet date which are classified as non-current assets. Loans and receivables are included in trade and other receivables in the balance sheet (note 10).
Recognition
Financial instruments are initially measured at cost on trade date, which includes transaction costs, when the related contractual rights or obligations exist. Subsequent to initial recognition these instruments are measured as set out below.
Notes to the Financial StatementsFor the Year Ended 30 June 2009
For
per
sona
l use
onl
y

Annual REPORT 2009 +59
Financial liabilities
Non-derivative financial liabilities are recognised at amortised cost, comprising original debt less principal payments and amortisation.
Fair value
Fair value is determined based on current bid prices for all quoted investments. Valuation techniques are applied to determine the fair value for all unlisted securities, including recent arm’s length transactions, reference to similar instruments and option pricing models.
Impairment
At each reporting date, the group assesses whether there is objective evidence that a financial instrument has been impaired.
(g) Impairment of Assets
At each reporting date, the group reviews the carrying values of its tangible and intangible assets to determine whether there is any indication that those assets have been impaired. If such an indication exists, the recoverable amount of the asset, being the higher of the asset’s fair value less costs to sell and value in use, is compared to the assets carrying value. Any excess of the assets carrying value over its recoverable amount is expensed to the Income Statements.
Impairment testing is performed at least annually for goodwill and intangible assets with indefinite lives.
Where it is not possible to estimate the recoverable amount of an individual asset, the group estimates the recoverable amount of the cash-generating unit to which the asset belongs.
(h) Intangibles
Goodwill
Goodwill and goodwill on consolidation are initially recorded at the amount by which the purchase price for a business or for an ownership interest in a Controlled Entity exceeds the fair value attributed to its net assets at date of acquisition. Goodwill on acquisition of subsidiaries is included in intangible assets. Goodwill on acquisition of associates is included in investments in associates. Goodwill is tested annually for impairment and carried at cost less accumulated impairment losses. Gains and losses on the disposal of an entity include the carrying amount of goodwill relating to the entity sold.
Patents and trademarks
Patents and trademarks are recognised at cost of acquisition. Patents and trademarks have a finite life and are carried at cost less any accumulated amortisation and any impairment losses. Patents and trademarks are amortised over their useful life ranging from 3 to 15 years.
Research and development
Expenditure during the research phase of a project is recognised as an expense when incurred. Development costs are capitalised only when technically feasibility studies identify that the project will deliver future economic benefits and these benefits can be measured reliably.
Development costs have a finite life and are amortised on a systematic basis matched to the future economic benefits over the useful life of the project.
(i) Foreign Currency Transactions and Balances
Functional and presentation currency
The functional currency of each of the Group’s entities is measured using the currency of the primary economic environment in which that entity operates. The consolidated financial statements are presented in Australian dollars which is the Parent Entity’s functional and presentation currency.
Notes to the Financial StatementsFor the Year Ended 30 June 2009
For
per
sona
l use
onl
y

+60 Annual REPORT 2009
Transaction and balances
Foreign currency transactions are translated into functional currency using the exchange rates prevailing at the date of the transaction. Foreign currency monetary items are translated at the year-end exchange rate. Non-monetary items measured at historical cost continue to be carried at the exchange rate at the date of the transaction. Non-monetary items measured at fair value are reported at the exchange rate at the date when fair values were determined.
Exchange differences arising on the translation of monetary items are recognised in the Income Statements, except where deferred in equity as a qualifying cash flow or net investment hedge.
Exchange differences arising on the translation of non-monetary items are recognised directly in equity to the extent that the gain or loss is directly recognised in equity; otherwise the exchange difference is recognised in the Income Statements.
Group Companies
The results and financial position of all the Group entities (none of which has the currency of a hyperinflationary economy) that have a functional currency different from the presentation currency are translated into the presentation currency as follows:
• assetsandliabilitiesforeachbalancesheetpresentedaretranslatedattheclosingrateatthedateof thatbalancesheet;
• incomeandexpensesforeachincomestatementaretranslatedataverageexchangerates(unlessthisisnotareasonableapproximationof the cumulative effect of the rates prevailing on the transaction dates, in which case income and expenses are translated at the dates of the transactions), and
• allresultingexchangedifferencesarerecognisedasaseparatecomponentof equity.
(j) EmployeeBenefits
Provision is made for the Company’s liability for employee benefits arising from services rendered by employees to balance date. Employee benefits that are expected to be settled within one year have been measured at the amounts expected to be paid when the liability is settled, plus related on-costs. Employee benefits payable later than one year have been measured at the present value of the estimated future cash outflows to be made for those benefits.
Equity-settled compensation
The group operates an employee share option plan. The bonus element over the exercise price of the employee services rendered in exchange for the grant of options is recognised as an expense in the Income Statements. The total amount to be expensed over the vesting period is determined by reference to the fair value of the options granted. The fair value is determined using the Black-Scholes methodology and the Barrier Pricing model where appropriate.
(k) Provisions
Provisions are recognised when the group has a legal or constructive obligation, as a result of past events, for which it is probable that an outflow of economic benefits will result and that outflow can be reliably measured.
(l) Cash and Cash Equivalents
Cash and cash equivalents include cash on hand, deposits held at call with banks, other short-term highly liquid investments with original maturities of three months or less, and bank overdrafts. Bank overdrafts are shown within short-term borrowings in current liabilities on the Balance Sheets.
Notes to the Financial StatementsFor the Year Ended 30 June 2009
For
per
sona
l use
onl
y

Annual REPORT 2009 +61
(m) Trade Receivables
Trade receivables are recognised initially at fair value and subsequently measured at amortised cost. Trade receivables are generally due for settlement within 30 days.
Collectively of trade receivables is reviewed on an ongoing basis. Debts which are known to be uncollectible are written off. An allowance account is used when there is objective evidence that the Group will not be able to collect all amounts due according to the original terms of the receivables.
The amount of the impairment loss is recognised in the Income Statement within other expenses. When a trade receivable for which an impairment allowance has been recognised becomes uncollectable in a subsequent period, it is written off against the allowance account. Subsequent recoveries of amounts previously written off are credited against other expenses in the Income Statement.
(n) Trade and Other Payables
These amounts represent liabilities for goods and services provided to the Group prior to the end of the financial year which are unpaid. The amounts are unsecured and are usually paid within 30 days of recognition. Payables are recognised initially at fair value and subsequently at amortised cost.
(o) Revenue
Revenue from the sale of goods is recognised upon delivery of goods to customers.
Interest revenue is recognised on a proportional basis taking into account the interest rates applicable to the financial assets.
Dividend revenue is recognised when the right to receive a dividend has been established. Dividends received from associates are accounted for in accordance with the equity method of accounting.
Revenue from the rendering of a service is recognised upon the delivery of the service to the customers.
All revenue is stated net of the amount of goods and services tax (GST).
(p) Borrowings
Borrowings are initially recognised at fair value, net of transaction costs incurred. Borrowings are subsequently measured at amortised cost. Any difference between the proceeds (net of transaction costs) and the redemption amount is recognised in the Income Statement over the period of the borrowings using the effective interest method. Fees paid on the establishment of loan facilities are recognised as transaction costs of the loan to the extent that is probable that some or all of the facility will be drawn down. In this case, the fee is deferred until the draw down occurs. To the extent there is no evidence that it is probable that some or all of the facility will be drawn down, the fee is capitalised as a prepayment for liquidity services and amortised over the period of the facility to which it relates.
The fair value of the liability portion of a convertible bond is determined using market interest rate for an equivalent non-convertible bond. This amount is recorded as a liability on an amortised cost basis until extinguished on conversion or maturity of the bonds. The remainder of the proceeds is allocated to the conversion option. This is recognised and included in shareholder’s equity, net of income tax effects.
(q) Borrowing Costs
Borrowing costs directly attributable to the acquisition, construction or production of assets that necessarily take a substantial period of time to prepare for their intended use or sale, are added to the costs of those assets, until such time as the assets are substantially ready for their intended use or sale.
All other borrowing costs are recognised in Income Statements in the period in which they are incurred.
Notes to the Financial StatementsFor the Year Ended 30 June 2009
For
per
sona
l use
onl
y

+62 Annual REPORT 2009
(r) Goods and Services Tax (GST)
Revenues, expenses and assets are recognised net of the amount of GST, except where the amount of GST incurred is not recoverable from the Australian Tax Office. In these circumstances the GST is recognised as part of the cost of acquisition of the asset or as part of an item of the expense. Receivables and payables in the Balance Sheets are shown inclusive of GST.
Cash flows are presented in the Cash Flow Statements on a gross basis, except for the GST component of investing and financing activities, which are disclosed as operating cash flows.
(s) Government Grants
Government grants are recognised at fair value where there is reasonable assurance that the grant will be received and all grant conditions will be met. Grants relating to expense items are recognised as income over the periods necessary to match the grant to the costs they are compensating. Grants relating to assets are credited to deferred income at fair value and are credited to income over the expected useful life of the asset on a straight-line basis.
(t) Comparative Figures
When required by Accounting Standards, comparative figures have been adjusted to conform to changes in presentation for the current financial year.
(u) Segment Reporting
A business segment is a group of assets and operations engaged in providing products or services that are subject to risks and returns that are different to those of other business segments. A geographical segment is engaged in providing product or services within a particular economic environment and subject to risks and returns that are different from those of segments operating in other economic environments.
(v) Issued Capital
Ordinary shares are classified as equity. Incremental costs directly attributable to the issue of new shares or options are shown in equity as a deduction, net of tax, from the proceeds. Incremental costs directly attributable to the issue of new shares or options for the acquisition of a business are included in the cost of the acquisition as part of the purchase consideration.
(w) Earnings Per Share
Basic earnings per share is determined by dividing the operating result after income tax by the weighted average number of ordinary shares during the financial period.
Diluted earnings per share adjusts the figures used in the determination of basic earnings per share by taking into account amounts unpaid on ordinary shares and any reduction in earnings per share that will probably arise from the exercise of options outstanding during the financial period.
(x) New Accounting Standards and Interpretations
Certain new accounting standards and interpretations have been published that are not mandatory for 30 June 2009 reporting periods. The Group and the parent entity’s assessment of the impact of these new accounting standards and interpretation is set out in note 30.
Notes to the Financial StatementsFor the Year Ended 30 June 2009
For
per
sona
l use
onl
y

Annual REPORT 2009 +63
2 CRITICAL ACCOUNTING ESTIMATES AND JUDGEMENTS
The Directors evaluate estimates and judgements incorporated into the financial report based on historical knowledge and best available current information. Estimates assume a reasonable expectation of future events and are based on current trends and economic data, obtained both externally and within the Group.
Key Estimates – Impairment
The Group assesses impairment at each reporting date by evaluating conditions specific to the Group that may lead to impairment of assets. Where an impairment trigger exists, the recoverable amount of the asset is determined. Value-in-use calculations performed in assessing recoverable amounts incorporate a number of key estimates.
No impairment has been recognised in respect of intangible assets (including Goodwill and Research and Development) for the year ended 30 June 2009. The recoverable amount of the Group’s cash-generating units is determined based on value-in-use calculations. These calculations use cash flow projections based on financial budgets approved by management covering a five-year period. The growth rate used for the projections is consistent for the five year period.
The Company commenced production of its 1ml Safety Syringe during 2009. The Company has entered into a number of supplier agreements that can be fulfilled as a result of commencing production.
The recoverability of capitalised Research and Development costs amounting to $6,761,668 is dependent on the Company being able to successfully exploit the Company’s products and technologies in excess of the carrying value of its Research and Development costs. This exploitation may require further working capital and investment. See further details in note 17.
Key Judgements – Non-recovery of Loans
The recovery of debt was assessed at 30 June 2009. A provision has been made ($12,045,942) in the Parent Entity for the non-recovery of loans to the wholly owned Australian Subsidiary. The provision was determined primarily on the basis of cash funding provided to the Controlled Entity.
Deferred Tax Assets
Deferred tax assets by way of carried forward tax losses ($1,847,664) from Unilife Medical Solutions Inc. (formerly Integrated BioSciences Inc.) was recognised as at 30 June 2009. The deferred tax assets have been brought to account as their recoverability has been assessed as probable, based on future earnings. This will be reassessed on an on going basis.
Share Based Payment
The Black-Scholes methodology and the Barrier Pricing models are used to calculate the fair value of the options issued by Unilife Medical Solutions Limited. Refer to Note 22 for the underlying assumptions used in the fair value calculations.
Notes to the Financial StatementsFor the Year Ended 30 June 2009
For
per
sona
l use
onl
y

+64 Annual REPORT 2009
3 REVENUE
Notes to the Financial StatementsFor the Year Ended 30 June 2009
Economic Entity Parent Entity
2009 2008 2009 2008
$ $ $ $
–Saleofgoodsrevenue 4,154,474 3,482,139 - 208,314
–Interestreceivedfromotherpersons/corporations 482,638 226,516 484,573 228,065
4,637,112 3,708,655 484,573 436,379
OTHER INCOME–Realisedgainonforeignexchangetransactions - - - -
–Governmentgrantsreceived 60,992 89,184 - -
–Revenuefromsaleofnon-currentassets - - - -
–Exclusivityfee 16,414,970 372,327 16,414,970 333,072
–FeesundertheIndustrialisationAgreement 18,182,861 - 18,182,861 -
–Otherincome 1,117,771 - 1,024,325 -
35,776,594 461,511 35,622,156 333,072
For
per
sona
l use
onl
y

Annual REPORT 2009 +65
4 PROFIT FOR THE YEAR
5 AUDITORS’ REMUNERATION
Notes to the Financial StatementsFor the Year Ended 30 June 2009
Economic Entity Parent Entity2009 2008 2009 2008
$ $ $ $
(a) ExpensesDepreciation and amortisation:
Depreciation of plant and equipment 1,049,985 749,545 515,445 365,493
Amortisation of leasehold improvements 160,037 54,336 38,508 51,524
Total depreciation and amortisation 1,210,022 803,881 553,953 417,017
Finance costs:
Interest expense 245,220 387,065 71,628 146,838
Net loss on disposal of non-current assets:
Plant and equipment 6,692 - - -
(b) Employee expenses Wages & salaries 5,323,214 2,870,710 1,441,155 623,323
Superannuation 246,669 153,260 95,550 26,153
Other 274,760 226,127 30,435 18,628
5,844,643 3,250,097 1,567,140 668,104
(c) Other expensesThe following expense items are the major items in this category:
Corporate, regulatory and related advisory expenses 2,804,774 868,277 789,606 404,840
Legal fees 1,172,006 192,025 966,244 178,505
Occupancy expenses 917,093 650,333 286,200 329,853
Travel costs 1,458,787 912,850 648,132 456,394
Marketing and public relations 189,235 91,154 58,267 4,315
Foreign exchange (gains)/losses 461,549 (21,059) 365,755 (21,059)
Economic Entity Parent Entity
2009 2008 2009 2008
$ $ $ $
Amounts paid or payable to the auditor of the Parent Entity, its related practices and non-related audit firms:
–auditingorreviewingthefinancialreport 78,828 48,497 78,828 48,497
–non-assuranceservices 45,842 38,597 45,842 38,597
–Non-BDOKendallsauditfirmsfortheauditorreview of financial reports of any Entity in the Group 123,652 88,122 - 52,725
248,322 175,216 124,670 139,819
For
per
sona
l use
onl
y

+66 Annual REPORT 2009
6 INCOME TAX BENEFIT
Notes to the Financial StatementsFor the Year Ended 30 June 2009
Economic Entity Parent Entity
2009 2008 2009 2008
$ $ $ $
a.Thecomponentsoftaxbenefitcomprise: Current tax - - - -
Deferred tax 980,041 43,615 - -
980,041 43,615 - -
b. The prima facie tax on profit/(loss) from continuing operations before income tax is reconciled to the income tax as follows:
12,806,494 (8,660,853) 13,132,132 (9,303,978)
Prima facie tax benefit on loss from continuing operations before income tax at 30% (2008: 30%)
–EconomicEntity 3,841,948 (2,598,256) - -
–ParentEntity - - 3,939,640 (2,791,193)
3,841,948 (2,598,256) 3,939,640 (2,791,193) Add:
Tax effect of:
–impairmentofintercompanyloans - - 3,613,783 -
–sharebasedpayments 1,487,156 204,365 1,487,156 204,365
–othernon-allowableitems 108,807 57,608 4,452 57,608
5,437,911 (2,336,283) 9,045,031 (2,529,220)
Adjustment for permanent differences in subsidiary companies - - (3,369,253) 825,028
Less:
Deferred tax asset on losses not previously recognised, now brought to account (6,495,735) - (5,515,694) -
Deferred tax asset on timing differences not previously recognised, now brought to account (188,539) - (160,084) -
Deferred tax asset in relation to tax losses not recognised 266,322 2,292,668 - 1,704,192
Income tax benefit/(expense) attributable to entity 980,041 43,615 - -
c.Deferredtaxliabilities: Timing differences 2,021 - 2,021 -
2,021 - 2,021 -
Off-set of deferred tax assets (2,021) - (2,021) -
Net deferred tax liabilities recognised - - - -For
per
sona
l use
onl
y

Annual REPORT 2009 +67
Notes to the Financial StatementsFor the Year Ended 30 June 2009
Economic Entity Parent Entity2009 2008 2009 2008
$ $ $ $
d. Unused tax losses and other timing differences not brought to account, the benefits of which will only be realised if the conditions for deductibility occur
–Taxlosses(Australia) 6,680,516 11,353,130 6,680,516 11,353,130
–Taxlosses(Foreigncountry) 1,050,823 588,476 - -
–Expensestakentoequity 134,337 243,005 134,337 243,005
–Othertemporarydifferences 552,868 124,280 378,550 124,280
8,418,544 12,308,891 7,193,403 11,720,415 Off-set of deferred tax liabilities (2,021) - (2,021) -
Net deferred tax assets not brought to account 8,416,523 12,308,891 7,191,382 11,720,415
Unilife Medical Solutions Limited and its wholly owned Australian Controlled Entities have decided to form a consolidated tax group with effect from 1 July 2003. The Australian Taxation Office has been notified of this decision. The accounting policy on implementation is set out in Note 1. The impact on the income tax benefit/(expense) for the year is disclosed in the tax reconciliation above.
The potential Deferred Tax Assets will only be obtained if:
(i) the relevant company derives future assessable income of a nature and an amount sufficient to enable the benefit to be realised, or the benefit can be utilised by another company in the Consolidated Entity in accordance with Division 170 of the Income Tax Assessment Act 1997;
(ii) the relevant company and/or the Consolidated Entity continues to comply with the conditions for deductibility imposed by the law; and
(iii) no changes in tax legislation adversely affect the relevant company and/or the Consolidated Entity in realising the benefit.
7 EARNINGS PER SHARE Economic Entity
2009 2008$ $
(a) Earnings used to calculate basic EPS 12,806,494 (8,617,238)
No. No.
(b) Weighted average number of ordinary shares outstanding during the year used in calculating basic earnings per share (EPS) 206,558,116 197,630,860
(c) Weighted average number of ordinary shares outstanding and potential ordinary shares outstanding during the year used in calculating diluted earnings per share (DEPS) 207,129,219 -F
or p
erso
nal u
se o
nly

+68 Annual REPORT 2009
8 SEGMENT INFORMATION
(a) Description of segments
Although the Consolidated Entity’s divisions are managed on a global basis they operate in two main areas:
Australia
The home country of the parent entity which is also the main operating entity. The areas of operation are principally the design, development, manufacture and supply of world-class sharps safety devices.
USA
Comprises operations carried on in the USA. The medical device manufacturing business unit operates in this country.
Notes to the Financial StatementsFor the Year Ended 30 June 2009
For
per
sona
l use
onl
y

Annual REPORT 2009 +69
Notes to the Financial StatementsFor the Year Ended 30 June 2009
2009 Australia USATotal
Continuing Operations
Consolidated
$ $ $ $
Segment revenueSales to external customers - 4,152,034 4,152,034 4,152,034
Inter segment sales - 3,347,692 3,347,692 3,347,692
Total sales revenue - 7,499,726 7,499,726 7,499,726
Other revenue 36,168,226 93,446 36,261,672 36,261,672
Total segment revenue 36,168,226 7,593,171 43,761,398 43,761,398
Inter segment elimination (3,347,692) (3,347,692)
Consolidated revenue 40,413,706 40,413,706
Segment result 17,379,090 (1,935,155) 15,443,935 15,443,935
Inter segment elimination (3,617,482) (3,617,482)
Profit before income tax 11,826,453 11,826,453
Income tax benefit 980,041 980,041
Profit for the year 12,806,494 12,806,494
Segment assets and liabilitiesSegment assets 45,705,877 13,087,983 58,793,860 58,793,860
Inter segment elimination (9,380,526) (9,380,526)
Total assets 49,413,334 49,413,334
Segment liabilities (7,104,266) (9,907,423) (17,011,689) (17,011,689)
Inter segment elimination 3,876,320 3,876,320
Total liabilities 13,135,369 13,135,369
Other segment informationAcquisition of property, plant and equipment, intangibles and other non-current segment asset
264,114 3,308,531 3,572,645 3,572,645
Total acquisitions 3,572,645 3,572,645
Total depreciation and amortisation expense 873,695 336,327 1,210,022 1,210,022
Cash flow informationNet cash flow from operating activities 10,157,414 (1,051,470) 9,105,944 9,105,944
Total cash flow from operating activities 9,105,944 9,105,944
Net cash (outflow) from investing activities (493,406) (3,308,531) (3,801,937) (3,801,937)
Total cash (outflow) from investing activities (3,801,937) (3,801,937)
Net cash inflow from financing activities (3,272,287) (382,931) (3,655,218) (3,655,218)
Total cash inflows from investing activities (3,655,218) (3,655,218)
For
per
sona
l use
onl
y

+70 Annual REPORT 2009
Notes to the Financial StatementsFor the Year Ended 30 June 2009
2008 Australia USATotal
Continuing Operations
Consolidated
$ $ $ $
Segment revenueSales to external customers - 3,271,185 3,271,185 3,271,185
Inter segment sales - 1,204,620 1,204,620 1,204,620
Total sales revenue - 4,475,805 4,475,805 4,475,805
Other revenue 859,726 39,255 898,981 898,981
Total segment revenue 859,726 4,515,060 5,374,786 5,374,786
Inter segment elimination (1,204,620) (1,204,620)
Consolidated revenue 4,170,166 4,170,166
Segment result (5,707,703) (1,539,424) (7,247,127) (7,247,127)
Inter segment elimination (1,413,726) (1,413,726)
Profit before income tax (8,660,853) (8,660,853)
Income tax benefit 43,615 43,615
Profit for the year (8,617,238) (8,617,238)
Segment assets and liabilitiesSegment assets 23,793,895 6,547,255 30,341,150 30,341,150
Inter segment elimination (3,055,029) (3,055,029)
Total assets 27,286,121 27,286,121
Segment liabilities (5,333,803) (6,990,137) (12,323,940) (12,323,940)
Inter segment elimination 2,914,922 2,914,922
Total liabilities (9,409,018) (9,409,018)
Other segment informationAcquisition of property, plant and equipment, intangibles and other non-current segment assets 629,860 794,901 1,424,761 1,424,761
Total acquisitions 1,424,761 1,424,761
Total depreciation and amortisation expense 603,721 200,160 803,881 803,881
Cash flow informationNet cash flow from operating activities (7,608,917) (371,999) (7,980,916) (7,980,916)
Total cash flow from operating activities (7,980,916) (7,980,916)
Net cash (outflow) from investing activities (371,461) (794,901) (1,166,362) (1,166,362)
Total cash (outflow) from investing activities (1,166,362) (1,166,362)
Net cash inflow from financing activities 8,283,742 (359,318) 7,924,424 7,924,424
Total cash inflows from investing activities 7,924,424 7,924,424
For
per
sona
l use
onl
y

Annual REPORT 2009 +71
9 CASH AND CASH EqUIVALENTS
(i) The Group’s and the Parent entity’s exposure to interest rate risk is discussed in Note 23.
10 TRADE AND OTHER RECEIVABLES
Further information relating to loans to key management personnel are set out in note 27 (e).
(a) Impaired Loan to Subsidiary
As at 30 June 2009, loan to the subsidiary with a nominal value of $12,045,941 (2008: $6,077,503) was impaired. The amount of the provision is $35,086,618 (2008: $23,040,677).
Movements in the provision for impairment of receivables (through the allowance account) are as follows:
Notes to the Financial StatementsFor the Year Ended 30 June 2009
Economic Entity Parent Entity
2009 2008 2009 2008
$ $ $ $
Cash at bank and in hand 3,939,441 2,670,336 3,160,753 2,599,132
Short-term bank deposits(i) 567,243 331,941 301,657 331,825
4,506,684 3,002,277 3,462,410 2,930,957
Economic Entity Parent Entity
2009 2008 2009 2008
$ $ $ $
At 1 July - - 23,040,677 16,963,174
Provision for impairment recognised during the year - - 12,045,941 6,077,503
- - 35,086,618 23,040,677
CURRENT
Trade receivables 9,009,586 503,462 8,731,000 164,480
Other receivables 97,504 266,222 - 250,000
Goods and services tax receivable 94,954 74,759 42,904 46,687
Interest receivable 6,737 7,281 6,737 7,281
Other deposits 562,323 218,218 8,182 -
Amount receivable from Controlled Entities - - 42,307,641 28,996,081
Less: Provision for impairment - - (35,086,618) (23,040,677)
9,771,104 1,069,942 16,009,846 6,423,852
For
per
sona
l use
onl
y

+72 Annual REPORT 2009
(b) Past Due but not impaired As of 30 June 2009, trade receivable of $55,457 (2008: $123,908 ) were past due but not impaired. These related to a number of independent customers for whom there is no recent history of default. The aging analysis of these trade receivables is as follows:
The other classes within trade and other receivables do not contain impaired assets and are not past due. Based on the credit history of these other classes, it is expected that these amounts will be received when due.
(c) Other receivables
These amounts generally arise from transactions outside the usual operating activities of the Group. Interest may be charged at commercial rates where the term of repayment exceeds six months. Collateral is not normally obtained.
(d) Foreign exchange and interest rate risk Information about the Group’s and the parent entity’s exposure to foreign currency risk and interest rate. Risk in relation to trade and other receivables is provided in note 23.
(e) Fair value and credit risk
Due to the short term nature of these receivables, their carrying amount is assumed to approximate their fair value.
The maximum exposure to credit risk at the reporting date is the carrying amount of each class of receivables mentioned above. The fair value of securities held for certain trade receivables is insignificant as is the fair value of any collateral sold or repledged. Refer to note 23 for more information on the risk management policy of the Group and the credit quality of the entity’s trade receivables.
11 INVENTORIES
Notes to the Financial StatementsFor the Year Ended 30 June 2009
Economic Entity Parent Entity
2009 2008 2009 2008
$ $ $ $
Up to 3 months 25,636 15,952 - -
More than 3 months 29,821 107,956 - -
55,457 123,908 - -
Economic Entity Parent Entity
2009 2008 2009 2008
$ $ $ $
CURRENTAt cost
Raw materials and stores 704,564 475,666 - -
Work in progress 658,287 631,849 - -1,362,851 1,107,515 - -
For
per
sona
l use
onl
y

Annual REPORT 2009 +73
12 OTHER – CURRENT ASSETS
13 OTHER FINANCIAL ASSETS
The increase in carrying value for Unilife Medical Solutions Inc is due to the capitalisation of intercompany loans ($4,925,835) as well as the payment of contingent consideration of $474,000. For further details of the amount related to the contingent consideration refer to note 14.
14 BUSINESS COMBINATION
(a) Summary of acquisition
On 1 January 2007 the parent entity acquired 100% of the issued share capital of Integrated BioSciences, Inc.
Details of the fair value of the assets and liabilities acquired and adjustment of goodwill are as follows:
Purchase consideration: $Ordinary shares issued 2,475,000Fair value of net identifiable assets acquired (1,133,957)Goodwill 3,608,957Contingent consideration 474,000 5,424,000
As part of the agreement to acquire Integrated BioSciences, Inc additional consideration was payable if milestones set in the amended agreement were met. The milestone of the signing of an agreement with the Pharmaceutical Partner was met during the year. As a result of meeting the requirements, additional consideration was required to be paid. The fair value of the options issued was $474,000 and has increased goodwill.
Notes to the Financial StatementsFor the Year Ended 30 June 2009
Economic Entity Parent Entity
2009 2008 2009 2008
$ $ $ $
NON-CURRENTShares in Controlled Entities:
Unlisted shares at cost - - 19,164,430 7,464,595
- - 19,164,430 7,464,595
Economic Entity Parent Entity
2009 2008 2009 2008
$ $ $ $
CURRENTPrepayments 182,591 36,286 4,941 4,564
182,591 36,286 4,941 4,564
Name of Entity Country of Incorporation
Class of Shares Equity Holding Carrying Value
2009 2008 2009 2008
% % $ $
Unitract Syringe Pty Ltd Australia Ordinary 100 100 10,370,460 4,070,460
Unilife Medical Solutions Inc (i) USA Ordinary 100 100 8,793,970 3,394,135
(i) Formerly Integrated BioSciences Inc. 19,164,430 7,464,595
For
per
sona
l use
onl
y

+74 Annual REPORT 2009
15 PROPERTY, PLANT AND EqUIPMENT
(a) Assets is the course of construction
The construction of assets disclosed above includes the following expenditures recognised in relation to property, plant and equipment which is in the course of construction.
Notes to the Financial StatementsFor the Year Ended 30 June 2009
Economic Entity Parent Entity
2009 2008 2009 2008
$ $ $ $
Plantandequipment: At cost 8,316,994 5,648,247 2,294,065 2,759,139
Accumulated depreciation (1,894,365) (1,372,589) (764,082) (704,364)
Work in progress 3,778,289 3,351,309 - -
10,200,918 7,626,967 1,529,983 2,054,775Leaseholdimprovements: At cost 1,326,323 767,434 - 257,619
Accumulated depreciation (174,455) (282,964) - (219,111)
1,151,868 484,470 - 38,508Total property, plant and equipment 11,352,786 8,111,437 1,529,983 2,093,283
Reconciliations of the carrying amounts for each class of plant and equipment are set out below.
Plant and equipmentCarrying amount at beginning of the year 7,626,967 7,747,633 2,054,775 2,359,639
Foreign Exchange Adjustment on opening balance 764,977 - - -
Additions 1,651,372 329,384 33,725 60,629
Additions–Workinprogress 1,257,350 268,761 - -
Disposals (622,667) - (498,798) -
Depreciation (477,081) (718,811) (59,719) (365,493)
Impairment - - - -
Carrying amount at end of year 10,200,918 7,626,967 1,529,983 2,054,775
Leasehold ImprovementsCarrying amount at beginning of the year 484,470 272,251 38,508 90,032
Foreign Exchange Adjustment on opening balance 93,397 - - -
Additions 734,039 297,289 - -
Disposals (271,677) - (257,619) -
Depreciation 111,639 (85,070) 219,111 (51,524)
Carrying amount at end of year 1,151,868 484,470 - 38,508
Economic Entity
2009 2008
$ $
Additions – WIP 1mL Line1mLline–plant 3,778,289 3,351,309
3,778,289 3,351,309
For
per
sona
l use
onl
y

Annual REPORT 2009 +75
16 INTANGIBLES
The Group assesses impairment at each reporting date by evaluating conditions specific to the Group that may lead to impairment of assets. Where an impairment trigger exists, the recoverable amount of the asset is determined. Value-in-use calculations performed in assessing recoverable amounts incorporate a number of key estimates.
No impairment has been recognised in respect of intangible assets (including goodwill, research and development and intellectual property) for the year ended 30 June 2009. The recoverable amount of the Group’s cash-generating units is determined based on value-in-use calculations. These calculations use cash flow projections based on financial budgets approved by management covering a five-year period. The growth rate used for the projections is consistent for the five year period and the DCF valuation used an after tax discount rate of 10%.
Notes to the Financial StatementsFor the Year Ended 30 June 2009
Economic Entity Parent Entity
2009 2008 2009 2008
$ $ $ $
Goodwill – at costOpening net book amount 5,404,215 5,404,215 - -Acquisitionofsubsidiary–Note14(a) 474,000 - - -Founder Shares 6,300,000 - - -Accumulated impaired losses - - - -Net carrying value 12,178,215 5,404,215 - -
Intellectual propertyCost 1,271,765 1,271,765 - -Accumulated impaired losses - - - -Net carrying value 1,271,765 1,271,765 - -
Patents and trademarksCost 99,233 99,233 - -
Accumulated impaired losses - - - -
Net carrying value 99,233 99,233 - -
Preliminary expensesCost 18,764 15,860 - -
Accumulated amortisation (17,819) (13,216) - -
Accumulated impaired losses - - - -
Net carrying value 945 2,644
Financing Fees 103,349 86,506 - -
Accumulated amortisation (25,521) (14,566) - -
Accumulated impaired losses - - - -
Net carrying value 77,828 71,940 - -
13,627,986 6,849,797 - -
For
per
sona
l use
onl
y

+76 Annual REPORT 2009
17 OTHER NON-CURRENT ASSETS
Refer Note 16 for DCF valuation principles which were applied to determine the recoverable amount of intangibles (including research and development).
18 TRADE AND OTHER PAYABLES
(a) Risk Exposure
Information about the Group’s and the parent entity’s exposure to foreign exchange risk is provided in Note 23.
Economic Entity Parent Entity
2009 2008 2009 2008
$ $ $ $
(a) Research and Development Costs capitalised at the beginning of the year 6,515,002 5,921,854 - -
Costs capitalised during the year and deferred 246,666 593,148 - -
6,761,668 6,515,002 - -
(b) Deferred Tax Benefit 1 July 593,864 560,354 - -
Foreign exchange adjustment on opening balance 115,629 - - -
Movement during the year 1,138,171 33,510 - -
1,847,664 593,864 - -
8,609,332 7,108,866 - -
Notes to the Financial StatementsFor the Year Ended 30 June 2009
Economic Entity Parent Entity2009 2008 2009 2008
$ $ $ $
CURRENTTrade payables 1,370,367 574,620 197,884 187,068
Sundry payables and accrued expenses 513,584 582,732 256,790 446,999
Provision for founder shares (refer note 21c) 6,300,000 - 6,300,000 -
Employee benefits 709,421 312,151 8,322 38,194
Other current liabilities - 33,931 - -
Customer deposits 52,046 351,482 - -
8,945,418 1,854,916 6,762,996 672,261
For
per
sona
l use
onl
y

Annual REPORT 2009 +77
19 BORROWINGS
(i) Hire purchase liabilities During the financial year the Consolidated Entity did not acquire any plant and equipment (2008: $Nil) by means of hire purchase.
(ii) Convertible notesAll convertible notes were converted during the year.
(iii) LoansThe loans are secured against assets of Unilife Medical Solutions Inc. The term of these loans range from 5 to 15 years. The interest rates range from 2.75% to 7.50% and are both variable and fixed. Principle and interest repayments are made monthly.
20 DEFERRED TAX BENEFIT
Notes to the Financial StatementsFor the Year Ended 30 June 2009
Economic Entity Parent Entity
2009 2008 2009 2008
$ $ $ $
CURRENT
Hire purchase liabilities (i) - 22,004 - 16,677
Convertible note (ii) - 780,000 - 780,000
Loans (iii) 503,361 3,531,617 - 3,437,813
503,361 4,333,621 - 4,234,490
NON-CURRENTHire purchase liabilities(i) - - - -
Loans (iii) 3,390,133 3,162,656 - -
3,390,133 3,162,656 - -
Economic Entity Parent Entity
2009 2008 2009 2008
$ $ $ $
1 July 57,826 - - -
Foreign exchange adjustment on opening balance 11,259 - - -
Movement during the year 227,372 57,826 - -
296,457 57,826 - -
For
per
sona
l use
onl
y

+78 Annual REPORT 2009
21 ISSUED CAPITAL
Effective 1 July 1998, the Corporation Legislation in place abolished the concepts of authorised capital and per value shares. Accordingly, the Company does not have authorised capital or per value in respect of its issued shares.
(a) Ordinary shares
Economic Entity Parent Entity
2009 2008 2009 2008
$ $ $ $
219,754,809 (2008: 205,774,310) fully paid ordinary shares 75,458,648 72,254,862 75,458,648 72,254,862
75,458,648 72,254,862 75,458,648 72,254,862
Notes to the Financial StatementsFor the Year Ended 30 June 2009
Date Description Issue Price $
2009 Number of Shares $ 2008 Number
of Shares $
Beginning of the reporting period 205,774,310 72,254,862 182,226,860 66,783,726
09-07-2007 Exercise of options 0.3500 1,250 437
20-07-2007 Rights issue 0.2500 14,000,000 3,500,000
22-10-2007 to 17-12-2007
Conversion of notes 0.2000 2,775,000 555,000
14-12-2007 Exercise of options 0.2000 500,000 100,000
31-12-2007 IBS SOP monies - - 124,754
28-04-2008 to 07-05-2008
Exercise of options 0.2000 1,259,000 251,800
19-06-2008 to 30-06-2008
Conversion of notes 0.2500 4,880,000 1,220,000
27-06-2008 Exempt employee share plan 2008 0.3782 132,200 -
03-07-2008 Exercise of options 0.4500 53,689 24,160
03-07- 2008 Exercise of options 0.5000 30,000 15,000
04-07-2008 Exercise of options 0.4500 1,500 675
07-07-2008 to 22-09-2008
Conversion of notes 0.2500 320,000 80,000
24-12-2008 Exercise of options 0.0001 500,000 50
29-12-2008 Shares issued to CEO 0.2250 10,000,000 2,250,000
01-02-2009 Exempt employee share plan 2009 0.2506 275,310 68,993
29-05-2009 Conversion of notes 0.2500 2,800,000 700,000
30-06-2009 IBS SOP monies - - 14,911
30-06-2009 Exempt employee share plan 2008 0.3782 - 49,997
13,980,499 3,203,786 23,547,450 5,751,991
Less: Transaction costs - (280,855)
Total 219,754,809 75,458,648 205,774,310 72,254,862
For
per
sona
l use
onl
y

Annual REPORT 2009 +79
(b) Share options
During the year 23,100,000 (2008: 14,250,000) options were issued and 585,189 (2008: 1,760,250) options were exercised. During the year 41,213,787 (2008: 6,407,000) options were cancelled or expired. At 30 June 2009 there were 37,935,000 (2008: 46,991,119) unlisted options on issue and nil (2008: 9,642,857) listed options on issue.
(c) Future issue of incentive shares
Under the acquisition agreement for Unitract Syringe Pty Ltd (Agreement), as approved by shareholders on 4 October 2002, the Company agreed to issue 10 million shares to certain former shareholders of Unitract Syringe Pty Ltd if the Company earned net profit after tax of $6.5 million (as confirmed by its auditors) in any financial year in the 5 years following completion of the Agreement and a further 10 million shares if the Company earned net profit after tax (as confirmed by its auditors) of $12 million in any financial year in the 5 years following completion of the Agreement. Those shareholders have disputed that the Agreement was subject to any time limitation. The Company has been informed that the relevant shareholders are prepared to settle the dispute by agreeing to a time limitation of 31 October 2014 (during which the hurdles must be met, subject to the right to be immediately issued all of the shares if a takeover of the Company occurs in that period). This was approved by the shareholders at the annual general meeting of the Company on 28 November 2008.
As at 30 June 2009 the profit has been achieved and a provision for the issue of 20 million shares ($6,300,000) has been provided for (refer note 18).
Pursuant to the terms of the IBS Acquisition Agreement (as amended on 11 October 2007), future equity consideration will be issued to the former shareholders of IBS by the Company on the following terms:
(i) 11 million shares will be issued in the event that the EBITDA of the IBS business for the 12 months ending 30 September 2007 exceeds US$1,250,000 (Tranche 2). In the event that the 2007 EBITDA is less than US$1,250,000, the number of shares issued under Tranche 2 will be reduced pro rata, proportional to any EBITDA shortfall; and
(ii) 11 million shares were to be issued in the event that the EBITDA of the IBS business for the 12 months ended 30 September 2008 exceeds US$1,250,000 (Tranche 3). This was reduced to 1,769,900 shares under the amendment. In the event that the 2008 EBITDA is less than US$1,250,000, the number of shares issued under Tranche 3 will be reduced pro rata, proportional to any EBITDA shortfall. In the event that the 2008 EBITDA exceeds US$1,250,000 and less than 11,000,000 shares were issued under Tranche 2, then the number of shares issued under Tranche 3 will be increased pro rata in excess of 1,769,900, provided always that the aggregate number of shares issued under Tranches 2 and 3 may not exceed 12,769,900.
As at 30 June 2009, the EBITDA’s for the above items (i) and (ii) have not been achieved. Therefore, there is no contingent liability to issue the shares regarding Tranche 2 (11 million shares) and Tranche 3 (11 million shares).
However, under the amendment approved by shareholders at the annual general meeting on 28 November 2007, the Company issued 7,000,000 Options on the following key terms and conditions:
(a) the exercise price of each Option is $0.25;
(b) the Options are exercisable on or before 30 September 2011 and will vest as follows:
(i) 3,000,000 Options will vest upon execution on or before 31 March 2009 of an industrialisation/development agreement;(ii) 2,000,000 Options will vest upon satisfaction prior to 30 September 2008 of certain performance milestones; and(iii) 2,000,000 Options will vest upon the Company exceeding specified market capitalisation benchmarks prior to 30 March 2009.
As at 30 June 2009 only the 3,000,000 options mentioned above in item (i) vested. The 4,000,000 options as per items (ii) and (iii) were cancelled.
d) Terms and conditions of contributed equity
Holders of ordinary shares are entitled to receive dividends as declared from time to time and are entitled to one vote per share at shareholders’ meetings.
In the event of the winding up of the Company, ordinary shareholders rank after all creditors and are fully entitled to any proceeds of liquidation (if any).
Notes to the Financial StatementsFor the Year Ended 30 June 2009
For
per
sona
l use
onl
y

+80 Annual REPORT 2009
22 SHARE BASED PAYMENTSThe following share based payment arrangements existed as at 30 June 2009:
Notes to the Financial StatementsFor the Year Ended 30 June 2009
Grant Date Expiry Date
Exercise Price
Balance at Start
of the year
Granted during the
year
Exercised during the
year
Forfeited during the
year
Balance at the end of the year
Vested and exercisable at the end of the year
Number Number Number Number Number Number
Economic and parent entity – 200910-May-04 31-Dec-09 $1.90 235,000 - - - 235,000 235,000
21-Dec-06 31-Dec-09 $0.25 3,250,000 - - - 3,250,000 3,250,000
21-Dec-06 30-Jun-09 $0.35 350,000 - - - 350,000 -
21-Dec-06 30-Jun-09 $0.45 1,500,000 - - - 1,500,000 -
05-Oct-07 31-Dec-10 $0.25 2,500,000 - - (1,000,000) 1,500,000 1,500,000
30-Nov-07 31-Dec-10 $0.25 1,000,000 - - - 1,000,000 1,000,000
30-Nov-07 31-Dec-10 $0.25 2,500,000 - - - 2,500,000 2,000,000
30-June-08 31-Dec-10 $0.35 750,000 - - - 750,000 600,000
01-Sep-08 30-Jun-12 $0.30 - 1,000,000 - - 1,000,000 300,000
08-Sep-08 30-Jun-12 $0.35 - 500,000 - - 500,000 100,000
17-Oct-08 30-Jun-12 $0.33 - 600,000 - - 600,000 200,000
03-Nov-08 30-Jun-12 $0.35 - 500,000 - - 500,000 100,000
28-Nov-08 31-Dec-12 $0.35 - 550,000 - - 550,000 100,000
28-Nov-08 31-Dec-12 $0.33 - 1,000,000 - - 1,000,000 350,000
28-Nov-08 30-Sep-13 $0.33 - 7,500,000 - - 7,500,000 -
02-Dec-08 30-Jun-12 $0.33 - 3,000,000 - - 3,000,000 1,000,000
19-Jan-09 30-Jun-12 $0.35 - 500,000 - - 500,000 100,000
26-Mar-09 30-Jun-12 $0.33 - 300,000 - - 300,000 100,000
18-May-09 30-Jun-12 $0.35 - 500,000 - - 500,000 100,000
Total 12,085,000 15,950,000 - (1,000,000) 27,035,000 11,035,000
Weighted Average Exercise Price $0.32 $0.33 - $0.25 $0.33 $0.31
Economic and parent entity – 200810-May-04 31-Dec-09 $1.90 235,000 - - - 235,000 235,000
18-Aug-05 31-Dec-10 $0.60 2,150,000 - - (2,150,000) - -
21-Dec-06 31-Dec-09 $0.25 3,250,000 - - - 3,250,000 2,166,668
21-Dec-06 30-Jun-09 $0.35 350,000 - - - 350,000 -
21-Dec-06 30-Jun-09 $0.45 1,500,000 - - - 1,500,000 -
5-Oct-07 31-Dec-10 $0.25 - 2,500,000 - - 2,500,000 500,000
30-Nov-07 31-Dec-10 $0.25 - 1,000,000 - - 1,000,000 666,666
30-Nov-07 31-Dec-07 $0.25 - 2,500,000 - - 2,500,000 500,000
30-Jun-08 31-Dec-10 $0.35 - 750,000 - - 750,000 150,000
Total 7,485,000 6,750,000 - (2,150,000) 12,085,000 4,218,334
Weighted Average Exercise Price $0.45 $0.26 - $0.60 $0.32 $0.35
For
per
sona
l use
onl
y

Annual REPORT 2009 +81
There were no options exercised during the year ended 30 June 2009 (nil 2008).
The options outstanding at 30 June 2009 have an exercise price in the range of 25 cents to $1.90 and a weighted average contractual life of 5 years.
The fair value of share options granted is measured by reference to the fair value of such share options. The estimate of the fair value of the services received is measured based on the Black-Scholes and Barrier Pricing models. The contractual life of the option is used as an input into this model.
The following factors and assumptions were used in determining the fair value of options on grant date:
Employee expenses
Included under share based payments in the Income Statements is $4,957,187 (2008: $681,217) and relates, in full, to equity-settled share based payment transactions.
Notes to the Financial StatementsFor the Year Ended 30 June 2009
Grant Date Expiry Date Fair Value Per Option
Exercise Price
Price of Shares on Grant Date
Expected Volatility
AnnualisedRisk Free
Interest RateDividend
Yield
10 May 2004 31 Dec 2009 $1.30 $1.90 $2.040 64.78% 5.92% -
18 Aug 2005 31 Dec 2010 $0.27 $0.60 $0.465 67.55% 5.92% -
21 Dec 2006 31 Dec 2009 $0.10 $0.25 $0.215 66.51% 6.05% -
21 Dec 2006 30 Jun 2009 $0.07 $0.35 $0.215 66.51% 6.05% -
21 Dec 2006 30 Jun 2009 $0.05 $0.45 $0.215 66.51% 6.05% -
5 Oct 2007 31 Dec 2010 $0.14 $0.25 $0.280 58.54% 6.42% -
30 Nov 2007 31 Dec 2009 $0.10 $0.25 $0.215 66.51% 6.05% -
30 Nov 2007 31 Dec 2010 $0.14 $0.25 $0.280 58.54% 6.42% -
30 Jun 2008 31 Dec 2010 $0.23 $0.35 $0.460 84.87% 6.72% -
1 Sep 2008 30 Jun 2012 $0.17 $0.30 $0.285 80.00% 4.76% -
8 Sep 2008 30 Jun 2012 $0.16 $0.35 $0.285 80.00% 4.76% -
17 Oct 2008 30 Jun 2012 $0.12 $0.33 $0.225 80.00% 4.76% -
3 Nov 2008 30 Jun 2012 $0.13 $0.35 $0.245 80.00% 4.76% -
28 Nov 2008 31 Dec 2012 $0.12 $0.35 $0.235 80.00% 4.76% -
28 Nov 2008 31 Dec 2012 $0.12 $0.33 $0.235 80.00% 4.76% -
28 Nov 2008 30 Sep 2013 $0.14 $0.33 $0.235 80.00% 4.76% -
2 Dec 2008 30 Jun 2012 $0.12 $0.33 $0.235 80.00% 4.76% -
19 Jan 2009 30 Jun 2012 $0.13 $0.35 $0.250 80.00% 4.76% -
26 Mar 2009 30 Jun 2012 $0.13 $0.33 $0.255 80.00% 4.76% -
18 May 2009 30 Jun 2012 $0.13 $0.35 $0.270 80.00% 4.76% -
Economic Entity Parent Entity
2009 2008 2009 2008
$ $ $ $
Options issued under employee option plan 2,588,196 681,217 2,588,196 681,217
Shares issued to CEO 2,250,000 - 2,250,000 -
Shares issued under employee share scheme 118,991 - 118,991 -
4,957,187 681,217 4,957,187 681,217
For
per
sona
l use
onl
y

+82 Annual REPORT 2009
23 FINANCIAL INSTRUMENTS
Financial risk management
The Group’s financial instruments consist mainly of deposits with banks, local money market instruments, short-term investments, accounts receivable and payable, loans and leases.
The Group and the Parent Entity hold the following financial instruments:
The main risks the Group is exposed to through its financial instruments are credit risk, liquidity risk and market risk (interest rates and exchange rates). This note presents information about the Company’s and Group’s exposure to each of the above risks, their objectives, policies and processes for measuring and managing risk, and the management of capital.
The Board of Directors has overall responsibility for the establishment and oversight of the risk management framework. Management monitors and manages the financial risk relating to the operations of the Group through regular reviews of the risks.
1. Credit risk
The maximum exposure to credit risk, excluding the value of any collateral or other security, at balance date to recognised financial assets, is the carrying amount, net of any provisions for impairment of those assets, as disclosed in the Balance Sheets and notes to the financial statements. Refer to Note 10.
The Economic Entity has a concentration of credit risk in that it depends on the pharmaceutical partner for a majority of other income. The risk of this concentration is mitigated by the Agreement between the Economic Entity and the pharmaceutical partner. The Economic Entity has policies in place to ensure that sales of products are made to customers with an appropriate credit history and that the pharmaceutical partner is seen to be a low risk customer.
Cash transactions are restricted to high credit quality financial institutions with a minimum rating of ‘A’.
Notes to the Financial StatementsFor the Year Ended 30 June 2009
Economic Entity Parent Entity
2009 2008 2009 2008
$ $ $ $
FINANCIAL ASSETS
Cash and cash equivalents 4,506,684 3,002,277 3,462,410 2,930,957
Trade and other receivables 9,771,104 769,684 8,731,000 414,480
Loan receivables - - 7,221,023 5,955,404
Other financial assets - - 19,164,430 7,464,595
14,277,788 3,771,961 38,578,863 16,765,436
FINANCIAL LIABILITIESTrade and other payables 2,142,155 1,912,742 419,427 672,261
Borrowings 3,893,492 6,716,277 - 3,454,490
Convertible notes - 780,000 - 780,000
6,035,647 9,409,019 419,427 4,906,751
For
per
sona
l use
onl
y

Annual REPORT 2009 +83
The at risk amounts are as follows:
No analysis of trade and other receivables are past due or impaired for either 30 June 2009 or 2008.
2. Liquidity risk
Liquidity risk is the risk that the Group will not be able to meet its financial liabilities as they fall due. The Group’s approach to managing liquidity risk is to ensure, as far as possible, that it will always have sufficient liquidity to meet its liabilities when due, under both normal and stressed conditions, without incurring unacceptable losses or risking damage to the Group’s reputation. The Board monitors liquidity levels on an ongoing basis.
Liquidity and interest risk tables
The following table details the Company’s and the Group’s remaining contractual maturity for its non-derivative financial liabilities. The tables are based on the undiscounted cash flows of financial liabilities based on the earliest date on which the Group can be required to pay. Amounts below equate to the carrying amount of the liability.
Notes to the Financial StatementsFor the Year Ended 30 June 2009
Economic Entity Parent Entity
2009 2008 2009 2008
$ $ $ $
Cash 4,506,684 3,002,277 3,462,410 2,930,957
Trade and other receivables 9,771,104 769,684 8,731,000 414,480
Loan receivables - - 7,221,023 5,955,404
Opening balance loan receivables - - 5,955,404 4,625,995
Movement - - 1,265,619 1,329,409
Closing balance loan receivables - - 7,221,023 5,955,404
For
per
sona
l use
onl
y

+84 Annual REPORT 2009
Notes to the Financial StatementsFor the Year Ended 30 June 2009
Less than 6 months 6-12 months 1 to 5 years More than 5 years Total
Economic Entity2009Trade and other payables 2,142,155 - - - 2,142,155
Hire Purchase liabilities - - - - -
Convertible Notes - - - - -
Loans 290,742 212,619 1,730,700 1,659,431 3,893,492
2,432,897 212,619 1,730,700 1,659,431 6,035,6472008Trade and other payables 1,249,109 - - - 1,249,109
Hire Purchase liabilities 22,004 - - - 22,004
Convertible Notes - 780,000 - - 780,000
Loans 3,616,524 183,756 1,606,018 1,793,455 7,199,753
4,887,637 963,756 1,606,018 1,793,455 9,250,866Parent2009Trade and other payables 419,427 - - - 419,427
Hire Purchase liabilities - - - - -
Convertible Notes - - - - -
Loans - - - - -
419,427 - - - 419,4272008Trade and other payables 634,067 - - - 634,067
Hire Purchase liabilities 16,677 - - - 16,677
Convertible Notes - 780,000 - - 780,000
Loans 3,437,813 - - - 3,437,813
4,088,557 780,000 - - 4,868,557
For
per
sona
l use
onl
y

Annual REPORT 2009 +85
3. Market risk
a. Interest rate risk
The Group’s exposure to interest rate risk, which is the risk that a financial instrument’s value will fluctuate as a result of changes in market interest rates, and the effective weighted average interest rates on classes of financial assets and liabilities, is as follows:
Notes to the Financial StatementsFor the Year Ended 30 June 2009
Fixed Interest Rate MaturingWeighted Average
Effective Interest Rate
Within Year $
1 to 5 Years $
Non-interest Bearing
$Total
$
Financial Assets: 2009 2008 2009 2008 2009 2008 2009 2008 2009 2008
Cash 0.80% 4.14% 3,939,441 3,002,277 - - - - 3,939,441 3,002,277
Receivables - - - - - - 769,684 - 769,684
Total Financial Assets 3,939,441 3,002,277 - - - 769,684 3,939,441 3,771,961
FinancialLiabilities:Trade and sundry creditors - - - - - - - - -
Lease liabilities - 7.75% - 22,004 - - - - - 22,004
Convertible Notes - 12.00% - 780,000 - - - - - 780,000
Loans 4.62% 6.40% 503,361 3,531,617 3,390,131 3,162,656 - - 3,893,492 6,694,273
Total Financial Liabilities 503,361 4,333,621 3,390,131 3,162,656 - - 3,893,492 7,496,277
Weighted Average Effective Interest Rate Floating Interest Total Floating Interest
Parent Financial Assets 2009 2008 2009 2008 2009 2008
Cash and cash equivalents 1.04% 4.17% 3,160,753 2,930,957 3,160,753 2,930,957
Trade and other receivables - - - -
3,160,753 2,930,957 3,160,753 2,930,957
FinancialLiabilities:Trade and other Payables - - - - - -
Borrowings - - - - - -
- - - -
Weighted Average Effective Interest Rate Floating Interest Total Floating Interest
Economic Entity Financial Assets 2009 2008 2009 2008 2009 2008
Cash and cash equivalents 0.80% 4.12% 4,506,684 3,002,277 4,506,684 3,002,277
Trade and other receivables - - - - - -
4,506,684 3,002,277 4,506,684 3,002,277
FinancialLiabilities:Trade and other Payables - - - - - -
Borrowings - - - 3,268,250 - 3,268,250
- 3,268,250 - 3,268,250
For
per
sona
l use
onl
y

+86 Annual REPORT 2009
The carrying amount of the Group’s monetary assets and monetary liabilities denominated in Euros at the reporting date is as follows:
Notes to the Financial StatementsFor the Year Ended 30 June 2009
Economic Entity Parent
2009 2008 2009 2008
$ $ $ $
AUDCash and cash equivalents 2,888,042 11,768 2,115,670 -
Trade receivables 278,586 338,982 - -
Trade payables 1,163,949 331,691 - -
Borrowings 3,893,492 6,694,271 - 3,120,125
AUDCash and cash equivalents 40,178 - 40,178 -
Trade receivables 8,731,000 - 8,731,000 -
Interest rate sensitivity analysis
The sensitivity analysis below has been determined based on the exposure to interest rates at the reporting date and the stipulated change taking place at the beginning of the financial year and held constant throughout the reporting period. A 100 basis point increase or decrease is used when reporting interest rate risk internally to key management personnel and represents management’s assessment of the possible change in interest rates.
At reporting date, if the interest rates had been 100 basis points higher or lower and all other variables were held constant, the Group’s net profit would increase/decrease by $38,935 (2008: increase/decrease by $2,660). This is mainly due to the Group’s exposure to interest rates on its cash and cash equivalents and borrowings. The Group’s sensitivity to interest rates has decreased during the current period due to the decrease in its cash and cash equivalents and borrowings that are exposed to a variable interest rate.
b. Foreign exchange risk
Foreign exchange risk arises when future commercial transactions and recognised assets and liabilities are denominated in a currency that is not the entity’s functional currency. The carrying amount of the Group’s monetary assets and monetary liabilities denominated in USD at the reporting date is as follows:
For
per
sona
l use
onl
y

Annual REPORT 2009 +87
Notes to the Financial StatementsFor the Year Ended 30 June 2009
Foreign currency sensitivity analysis
The following table details the Group’s sensitivity to movement in the AUD against the USD and Euros. Sensitivity analysis is calculated using a reasonable possible change of 15% in the foreign rate in both directions based on the exposure period of the cash and cash equivalents, trade receivables and borrowings.
Net fair values of financial assets and liabilities
Valuation approach
The net fair value of cash and cash equivalents and non-interest bearing liabilities of the Economic Entity approximates their carrying value. Net fair values of monetary financial assets and liabilities are based upon market prices where a market exists or by discounting the expected future cash flows by the current interest rate for assets and liabilities with similar risk.
The fair values of the financial instruments held approximates the carrying amounts.
Impact on Profit (Net on Tax) – USD Economic Entity Parent
2009 2008 2009 2008
$ $ $ $
Cash and cash equivalents 433,206 590 317,351 -
Trade receivables 41,788 16,991 - -
Trade payables 174,592 16,626 - -
Borrowings 584,024 335,549 - 156,396
Impact on Profit (Net of Tax) - EUROS
Cash and cash equivalents 6,027 - 6,027 -
Trade receivables 1,309,650 - 1,309,650 -
For
per
sona
l use
onl
y

+88 Annual REPORT 2009
24 EXPENDITURE COMMITMENTS AND CONTINGENT LIABILITIES
(a) Capital expenditure commitments
Estimated capital expenditure contracted for at reporting date, but not provided for, payable:
(b) Non-cancellable operating lease commitments
Future operating lease rentals not providedfor in the Financial Statements and payable:
The Economic Entity leases property under non-cancellable operating leases expiring within one year. Leases generally provide the Consolidated Entity with a right of renewal at which time all terms are renegotiated. Lease payments comprise a base amount plus an incremental contingent rental. Contingent rentals are based on either movements in the Consumer Price Index or operating criteria.
(c) Remuneration commitments
There are no commitments for the payment of salaries and other remunerations under long-term employment contracts that exist at reporting date.
Other than the items listed above, the Company is not aware of any other contingent liabilities at the date of this Report.
Notes to the Financial StatementsFor the Year Ended 30 June 2009
Economic Entity Parent Entity
2009 2008 2009 2008
$ $ $ $
Within one year 518,885 - - -
One year or later but not later than five years - - - -
Later than five years - - - -
518,885 - - -
Economic Entity Parent Entity
2009 2008 2009 2008
$ $ $ $
Within one year 540,597 601,877 45,240 286,762
One year or later but not later than five years 776,634 1,022,926 - -
Later than five years - - - -
1,317,231 1,624,803 45,240 286,762
For
per
sona
l use
onl
y

Annual REPORT 2009 +89
25 NOTES TO THE STATEMENTS OF CASH FLOWS
(a)Reconciliationofprofit/(loss)from ordinary activities after income tax to net cash used in operating activities
(b) Reconciliation of cash
For the purposes of the Statements of Cash Flows, cash includes cash on hand and at bank and short term deposits at call. Cash as at the end of the financial year as shown in the Statements of Cash Flows is reconciled to the related items in the Statements of Financial Position as follows:
The Company has provided guarantees and indemnities totalling $301,657 to its bankers in respect to banking facilities provided to the Company (2008: $328,657). During the year the Consolidated Entity did not acquire any plant and equipment by means of hire purchase (2008: Nil).
Notes to the Financial StatementsFor the Year Ended 30 June 2009
Economic Entity Parent Entity
2009 2008 2009 2008
$ $ $ $
Profit/(loss) for the year 12,806,494 (8,617,238) 13,132,132 (9,303,978)
Depreciation 1,049,985 749,545 515,445 365,493
Amortisation 160,037 54,336 38,508 51,524
Loss on sale of plant and equipment 6,692 - - -
Provision for non-recovery of inter-entity loan - - 12,045,942 6,077,503
Expense associated with issue of convertible note - - - -
Share based payment 4,957,187 681,217 4,957,187 681,217
Goodwill adjustment - - - -
Changes in assets and liabilities, net of effects of purchase and disposal of subsidiaries:
Increase/(decrease) in accrued expenses/employee entitlements 397,270 46,197 (29,870) 4,270
Increase/(decrease) in trade creditors 795,747 (510,744) 10,816 104,018
Increase/(decrease) in rent in advance - - - -
Increase/(decrease) in other creditors (181,832) 156,231 (88,645) (188,226)
(Increase)/decrease in accounts receivable (8,337,407) 83,510 (8,316,520) (254,202)
(Increase)/decrease in other debtors (20,195) (29,438) 3,783 (40,385)
(Increase)/decrease in interest receivable (544) (1,158) (544) (1,158)
(Increase)/decrease in prepaid expenses (490,408) 61,032 8,558 (973)
(Increase)/decrease in inventories (255,336) (620,896) - -
(Increase)/decrease in deferred tax benefit (1,254,516) (33,510) - -
(Increase)/decrease in unrealised foreign exchange (527,230) - 510,137 -
Cash inflow/(outflow) from operations 9,105,944 (7,980,916) 22,786,929 (2,504,897)
Economic Entity Parent Entity
2009 2008 2009 2008
$ $ $ $
Cash–refertoNote9 3,939,441 2,670,336 3,160,753 2,599,132
Shorttermbankdeposits–refertoNote9 567,243 331,941 301,657 331,825
4,506,684 3,002,277 3,462,410 2,930,957
For
per
sona
l use
onl
y

+90 Annual REPORT 2009
(c) Non-cashfinancingandinvestingactivities
Refer to business combination note 14.
26 RESERVES AND ACCUMULATED LOSSES
(a) Reserves
Movements
(b) Accumulated losses
Movements in accumulated losses were as follows:
(c) Nature and purpose of reserves
(i) Share-based payment reserves
The share-based payment reserve is used to recognise:
• Thefairvalueof optionsissuedtoemployeesbutnotexercised.• Thefairvalueof sharesissuedtoemployees.
(ii) Foreign currency translation reserve
Exchange differences arising on translation of the foreign controlled entity are taken to the foreign currency translation reserve, as described in Note 1 (i). The reserve is recognised in profit and loss when the net investment is disposed of.
Notes to the Financial StatementsFor the Year Ended 30 June 2009
Economic Entity Parent Entity
2009 2008 2009 2008
$ $ $ $
Share based payment reserve 5,619,139 2,556,943 5,619,139 2,556,943
Foreign currency translation reserve (624,258) 47,354 - -
4,994,881 2,604,297 5,619,139 2,556,943
Foreign currency translation reserve
Balance 1 July 47,354 5,489 - -
Currency translation differences (671,612) 41,865 - -
Balance 30 June (624,258) 47,354 - -
Share based payment reservesBalance 1 July 2,556,943 1,748,972 2,556,943 1,748,972
Option expense 3,062,196 807,971 3,062,196 807,971
Balance 30 June 5,619,139 2,556,943 5,619,139 2,556,943
Economic Entity Parent Entity2009 2008 2009 2008
$ $ $ $
Balance 1 July (56,982,058) (48,364,820) (60,801,305) (51,497,327)
Net profit/(loss) for the year 12,806,494 (8,617,238) 13,132,132 (9,303,978)
Balance 30 June (44,175,564) (56,982,058) (47,669,173) (60,801,305)
For
per
sona
l use
onl
y

Annual REPORT 2009 +91
27 KEY MANAGEMENT PERSONNEL DISCLOSURE
(a) Directors The following persons were Directors of Unilife Medical Solutions Limited during the financial year:
(i) Chairman–JimBosnjak(Non–executiveDirector)(ii) Chief ExecutiveOfficer–AlanShortall(ExecutiveDirector)(iii) CompanySecretary–JeffCarter(Non-executiveDirector)(iv) Director–WilliamGalle(Non-executiveDirector)
(b) Other key management personnel
The following persons also had authority and responsibility for planning, directing and controlling the activities of the Group, directly or indirectly during the financial year:
Changes in key management personnel for the year ending 30 June 2009 relate to staff restructuring and management changes.
(c) Key management personnel com pensation
(d) Equity instrument disclosures relating to key management personnel
(i) Options provided as remuneration and shares used on exercise of such options
Details of options provided as remuneration and shares issued on exercise of such option, together with the terms and conditions of the options, can be found in the Director’s Report.
(ii) Options holdings
The number of options over ordinary shares in the Company held during the financial year by each Director of Unilife Medical Solutions Limited and other key management personnel of the Group, including their personally related parties, are set out below:
Notes to the Financial StatementsFor the Year Ended 30 June 2009
Name Position EmployerBernhard Opitz Senior Vice President, Operations Unilife Medical Solutions, Inc.
Daniel Calvert Chief Financial Officer Unilife Medical Solutions, Inc.
Stephen Allan Vice President, Marketing & Communications Unilife Medical Solutions, Inc.
Mark Iampietro Vice President, Quality Systems & Regulatory Affairs
Unilife Medical Solutions, Inc.
Eugene Shortall RTFS Project Director Unitract Syringe Pty Ltd
Economic Entity Parent Entity
2009 2008 2009 2008
$ $ $ $
Short-term employee benefits 3,131,477 1,987,746 1,825,056 768,468
Post-employment benefits 143,191 76,163 95,550 26,153
Share-based payments 3,546,377 278,796 3,081,521 116,679
6,821,045 2,342,705 5,002,127 911,300
For
per
sona
l use
onl
y

+92 Annual REPORT 2009
Option Holdings of Directors and Key Management Personnel as at 30 June 2009 (Audited)
Option Holdings of Directors and Key Management Personnel as at 30 June 2008 (Audited)
(i) 1,150,000 options were cancelled(ii) 1,000,000 options were cancelled
Notes to the Financial StatementsFor the Year Ended 30 June 2009
Vested 30 June 2009
Balance 1 July 2008
Granted as Remun-
erationNet
ChangeOptions
ExercisedBalance 30 June
2009Total Exercised Not
Exercised
DirectorsMr J Bosnjak 1,000,000 1,000,000 - - 2,000,000 1,000,000 - 1,000,000
Mr A Shortall - 7,500,000 - - 7,500,000 - - -
Mr J Carter 2,500,000 - - - 2,500,000 2,000,000 - 2,000,000
Mr W Galle - 550,000 - - 550,000 100,000 - 100,000
Key Management Personnel
Mr B Opitz - 1,500,000 - - 1,500,000 500,000 - 500,000
Mr D Calvert - 1,500,000 - - 1,500,000 500,000 - 500,000
Mr S Allan 555,000 1,000,000 - - 1,555,000 555,000 - 555,000
Mr M Iampietro - 600,000 - - 600,000 200,000 - 200,000
Mr E Shortall 750,000 - - - 750,000 600,000 - 600,000
Total 4,805,000 13,650,000 - - 18,455,000 5,455,000 - 5,455,000
Vested 30 June 2008
Balance 1 July 2007
Granted as Remun-
erationNet
ChangeOptions
ExercisedBalance 30 June
2008Total Exercised Not
Exercised
DirectorsMr J Bosnjak 1,500,000 1,000,000 (1,500,000) - 1,000,000 666,666 - 666,666
Mr A Shortall 7,000,000 - (7,000,000) - - - - -
Mr J Carter (i) 1,191,072 2,500,000 (1,191,072) - 2,500,000 500,000 - 500,000
Mr W Galle - - - - - - - -
Key Management Personnel
Mr E Paukovits - - - - - - - -
Mr J Kelly (ii) 1,125,000 2,500,000 (1,125,000) - 2,500,000 500,000 - 500,000
Ms M Gow 808,750 - (25,000) - 783,750 533,750 - 533,750
Mr C Thorley 120,000 - - (120,000) - - - -
Mr J Kaal 500,000 - - (500,000) - - - -
Mr E Shortall - 750,000 - - 750,000 150,000 - 150,000
Total 12,244,822 6,750,000 (10,841,072) (620,000) 7,533,750 2,350,416 - 2,350,416
For
per
sona
l use
onl
y

Annual REPORT 2009 +93
(iii) Share holdings
The numbers of shares in the Company held during the financial year by each Director of Unilife Medical Solutions Limited and other key management personnel of the Group, including their personally related parties, are set out below.
Shareholdings of Directors and Key Management Personnel as at 30 June 2009 (Audited)
(i) Beneficial interest of 167,036 shares.
Shareholdings of Directors and Key Management Personnel as at 30 June 2008 (Audited)
(i) Beneficial interest of 167,036 shares.
Notes to the Financial StatementsFor the Year Ended 30 June 2009
Shareholdings of Directors and Key Management Personnel
Balance 1 July 2008
Granted as Remuneration
On Exercise of Options
Net Change Other
Balance 30 June 2009
DirectorsMr J Bosnjak 1,810,000 - - - 1,810,000
Mr A Shortall 5,425,185 10,000,000 - (801,853) 14,623,332
Mr J Carter (i) 334,072 - - - 334,072
Mr W Galle - - - - -
Key Management Personnel
Mr B Opitz - - - - -
Mr D Calvert - - - - -
Mr S Allan - - - - -
Mr M Iampietro - - - - -
Mr E Shortall - - - - -
Total 7,569,257 10,000,000 - (801,853) 16,767,404
Shareholdings of Directors and Key Management Personnel
Balance 1 July 2007
Granted as Remuneration
On Exercise of Options
Net Change Other
Balance 30 June 2008
DirectorsMr J Bosnjak 1,570,000 - - 240,000 1,810,000
Mr A Shortall 6,500,000 - - (1,074,815) 5,425,185
Mr J Carter (i) 314,072 - 20,000 - 334,072
Mr W Galle - - - - -
Key Management Personnel
Mr E Paukovits 2,945,800 - 878,032 (878,032) 2,945,800
Mr J Kelly 5,000 - - (5,000) -
Ms M Gow 25,000 - - - 25,000
Mr C Thorley 5,105,450 - 120,000 (120,000) 5,105,450
Mr J Kaal 7,016,553 - 500,000 (636,982) 6,879,571
Mr E Shortall - - - - -
Total 23,481,875 - 1,518,032 (2,474,829) 22,525,078
For
per
sona
l use
onl
y

+94 Annual REPORT 2009
(e) Loans to key management personnel
The company ATP Incorporated which Ed Paukovits is a director, has a loan from Integrated BioSciences, Inc. “IBS” for the amount of US$60,000. This loan was in place before Unilife Medical Solutions Limited acquired IBS. The loan is to be fully repaid by 31 December 2009. No interest is payable on this loan.
Other than the loan disclosed above, there are no loans made to key management personnel of the Company or the Group during the year.
28 RELATED PARTIES
Non-director related parties
Wholly owned group
Unilife Medical Solutions Limited (Company) is the parent of the group. The wholly owned group consists of the Company and its wholly owned entities as detailed in Note 13. During the year, the Company provided loan funds to Unitract Syringe Pty Ltd of $12,045,942 (2008: $6,077,503). A provision has been made to the extent that a deficiency exists in the net assets. Refer to Note 10 (a).
Up until 30 April 2009 the services of Mr Alan Shortall as Chief Executive Officer were provided by Underline International Pty Limited.
The services of Mr Eugene Shortall (RTFS Project Director) are provided by Medical Middle East Ltd.
From 1 February 2009 the services of Mr Jeff Carter as Company Secretary are provided by Joblak Pty Ltd.
Loans to subsidiaries are as follows:
29 EVENTS SUBSEqUENT TO BALANCE DATE
In 2002 the Company acquired Unitract Syringe Pty Ltd (Unitract). Under this acquisition agreement (Agreement) and as further approved by the shareholders on 28 November 2008, the Company agreed to issue 10 million shares to certain former shareholders of Unitract if the Company earned net profit after tax of $6.5 million (as confirmed by its auditors) in any financial year in the years following completion of the Agreement and a further 10 million shares if the Company earned net profit after tax (as confirmed by its auditors) of $12 million in any financial year in the years following the Agreement. It is noted that the net profit after tax for the year ended 30 June 2009 exceeded $12 million and accordingly 20 million shares, subject to shareholder approval (if required) and confirmation by the Auditors, will be issued to former shareholders of Unitract. A provision for the issue of these shares of $6.3 million has been raised as at 30 June 2009 and a corresponding increase in the goodwill on acquisition of Unitract has been recorded for the year ended 30 June 2009.
On 1 July 2009, the Company announced that it entered into an Industrialisation Agreement with a pharmaceutical partner for the commercialisation of the Unilife Ready-To-Fill Syringe.
Subsequent to balance date 2,310,000 ordinary shares have been issued due to the exercise of 2,310,000 options ($577,500). This resulted in the raising of an additional $577,500 in cash and an issued capital of 222,064,809 ordinary shares.
No other matters or circumstances have arisen since the end of the financial year which significantly affected or may significantly affect the operations of the Economic Entity, the results of those operations, or the state of affairs of the Economic Entity in future financial years.
Notes to the Financial StatementsFor the Year Ended 30 June 2009
Economic Entity
2009 2008
$ $
Balance 1 July 28,996,081 21,589,169
Loans advanced to Unitract Syringe Pty Ltd 12,045,942 6,077,503
Loans advanced to Unilife Medical Solutions Inc. 1,265,618 1,329,409
Balance 30 June 42,307,641 28,996,081
For
per
sona
l use
onl
y

Annual REPORT 2009 +95
Reference Title SummaryApplication
date of standard
Impact on Group Financial Report
Application date for Group
AASB 2007-3 Amendments to Australian Accounting Standards arising from AASB 8 [AASB 5, AASB 6, AASB 102, AASB 107, AASB 119, AASB 127, AASB 134, AASB 136, AASB 1023 and AASB 1038]
Amendments arise from release of AASB 8 Operating Segments
1 January 2009
AASB 8 is a disclosure standard so will have no direct impact on the amounts included in the Group’s Financial Statements. However, the amendments will result in changes to the segment disclosures included in the Group’s financial report.
1 July 2009
AASB 8 Operating Segments New standard replacing disclosure requirements of AASB 114
1 January 2009
As above. 1 July 2009
AASB 2007-6 Amendments to Australian Accounting Standards arising from AASB 123 [AASB 1, AASB 101, AASB 107, AASB 111, AASB 116 and AASB 138 and Interpretations 1 and 12]
Amendments arise from the issuance in June 200 of a revised AASB 123 Borrowing Costs
1 January 2009
As it is the Group’s current policy to capitalise interest on qualifying assets, there will be no impact on the Group’s Financial Statements.
1 July 2009
AASB 123 Borrowing Costs Revised standard requiring the capitalisation of all borrowing costs directly attributable to the acquisition, construction or production of a qualifying asset.
1 January 2009
As above. 1 July 2009
Revised AASB 101
Presentation of Financial Statements and AASB 2007-8 Amendments to Australian Accounting Standards arising from AASB 101
A revised AASB 101 was issued in September 2007 and is applicable for annual reporting periods beginning on or after 1 January 2009. It requires the presentation of a statement of comprehensive income and makes changes to the statement of changes in equity, but will not affect any of the amounts recognised in the Financial Statements. If an Entity has made a prior period adjustment or has reclassified items in the Financial Statements, it will need to disclose a third balance sheet (statement of financial position), this one being as at the beginning of the comparative period.
1 January 2009
As above. 1 July 2009
Revised AASB 3 Business Combinations
The revised AASB 3 is applicable to annual reporting periods commencing on or after 1 July 2009. The revised standard introduces more detailed guidance on accounting for step acquisitions, adjustments to contingent consideration assets acquired that the purchaser does not intend to use, reacquired rights and share based payments as part of purchase consideration. Also, all acquisition costs will have to be expensed instead of being recognised as part of goodwill. Unilife has not yet decided when to adopt the revised AASB 3. At this stage, it is not expected to affect any of the amounts recognised in the financial statements.
1 July 2009 As above. 1 July 2009
30 CHANGES IN ACCOUNTING POLICYThe following Australian Accounting Standards have been issued or amended and are applicable to the Parent and Economic Entity but are not yet effective. They have been adopted in preparation of the Financial Statements at reporting date.
Notes to the Financial StatementsFor the Year Ended 30 June 2009
For
per
sona
l use
onl
y

+96 Annual REPORT 2009
Reference Title SummaryApplication
date of standard
Impact on Group Financial Report
Application date for Group
AASB 2008-1 Amend-ments to AASB 2
Sharebasedpayments–vesting conditions and cancellations
AASB 2008-1 is applicable for periods commencing on or after 1 January 2009. The definition of vesting conditions has changed and the accounting treatment clarified for cancellations to share based payment arrangements by the counterparty.This is to ensure that conditions other than performance conditions do not result in a “true up” of the share based payment expense and are treated in a manner similar to market conditions. To date the Company has not issued any options to employees that include non-vesting conditions and as such there will be no impact on the financial statements when this revised standard is adopted for the first time.
1 January 2009
As above. 1 January 2009
AASB 2009-2 (Issued April 2009)
Amendments to Australian AccountingStandards–Improving Disclosures about Financial Instruments
Requires additional disclosures about financial instrument fair values and liquidity risk.
Periods commenc-ing on or after 1 January 2009
As this is a disclosure standard only, there will be no impact on amounts recognised in the Financial Statements. However, various additional disclosures will be required about fair values of financial instruments and the Entity’s liquidity risk. No comparative disclosures are required in the first year that these amendments are applied.
AASB 136 Impairment of Assets Additional disclosure requirements about discounted cash flow assumptions used for the fair value less costs to sell method.
Periods commenc-ing on or after 1 January 2009
There will be no financial impact when these amendments are first adopted because these amendments relate to additional disclosure requirements only.
AASB 107 Cash Flow Statements Clarifies that only expenditures that result in a recognised asset in the balance sheet are eligible for classification as cash flows from investing activities.
Periods commenc-ing on or after 1 January 2010
Initial adoption of this amendment will have no impact as the Entity only recognises cash flows from investing activities for expenditures that result in a recognised asset in the Balance Sheet.
Notes to the Financial StatementsFor the Year Ended 30 June 2009
For
per
sona
l use
onl
y

Annual REPORT 2009 +97
Additional information required by the Australian Stock Exchange Limited Listing Rules and not disclosed elsewhere in this Annual Report is set out below.
Shareholder information set out below was applicable as at 25 September 2009.(a) Distribution of equity security holders
There were no shareholders holding an unmarketable parcel of ordinary shares.
(b) Twenty largest shareholders
* Promoters of Unitract Syringe Pty Ltd which are entitled to the incentive shares. See Note 21 (c) in the Notes to the Financial Statements.
Notes to the Financial StatementsFor the Year Ended 30 June 2009
Ordinary Shares
Number of Holders Number of Shares
1–1,000 1,292 661,653
1,001–5,000 2,315 6,602,016
5,001–10,000 1,097 8,844,618
10,001–100,000 1,833 59,313,106
100,001–andover 349 145,865,906
6,886 221,287,299
Number of Ordinary Shares Held
Percentage of Capital Held %
1. Alan Shortall* 14,623,332 6.61
2. ANZ Nominees Limited 7,555,796 3.41
3. Joseph Kaal* 5,699,552 2.58
4. National Nominees Limited 4,816,399 2.18
5. Craig Thorley* 4,500,000 2.03
6. UBS Nominees Pty Ltd 4,455,300 2.01
7. Citicorp Nominees Pty Ltd 3,800,369 1.72
8. Bradley Downes 2,669,902 1.21
9. Admark Investments Pty Ltd 2,350,000 1.06
10. Merkaba Limited* 2,833,985 1.28
11. Omah Nominees Pty Ltd 2,000,000 0.90
12. Francis James Reidy 1,967,283 0.89
13. Torsby Pty Ltd 1,733,000 0.78
14. Fristino Investments Pty Ltd 1,550,000 0.70
15. Charles Patrick Reagan 1,212,765 0.55
16. Lewis Securities Ltd 1,195,800 0.54
17. Steve & Amy Witkowski 1,164,900 0.53
18. Dennis John Banks + Janine Anne Banks 1,100,000 0.50
19. J P Morgan Nominees Australia Limited 1,041,883 0.47
20. Victor John Plumber 1,000,000 0.45
TOTAL 67,270,266 30.40For
per
sona
l use
onl
y

+98 Annual REPORT 2009
(c) Substantial shareholders
Alan Shortall was the only substantial shareholder as at reporting date with 14,623,332 ordinary shares representing 6.61% of capital held.
(d) Voting rights
Ordinary shares
The voting rights set out in the Company’s Constitution are:
Subject to any rights or restrictions for the time being attached to any class or classes of shares.
(a) at meetings of members or classes of members each member entitled to vote may vote in person or by proxy or attorney; and
(b) on a show of hands every person who is a member has one vote and on a poll every person present in person or by proxy or attorney has one vote for each ordinary share held.
(e) Statement on use of cash and assets in a form readily convertible to cash
Since admission to the Australian Stock Exchange Limited on 31 October 2002, the Company has used the cash and assets in a form readily convertible to cash that it had at the time of admission in a manner consistent with its business objectives.
Notes to the Financial StatementsFor the Year Ended 30 June 2009
For
per
sona
l use
onl
y

Unilife Medical Solutions Limited
UNITED STATES:633 Lowther RoadLewisberry, PA 17339United States of America
Tel: +1 717 938 9323Toll-free in US: +1 800 324 7674 Fax: +1 717 938 9364Email: [email protected]
AUSTRALIASuite 3, Level 11,1 Chifley Square,Sydney 2000 NSWAustralia
Tel: +612 8346 6500Fax: +612 8346 6511Email: [email protected]
99-6971
For
per
sona
l use
onl
y