odour survey to assess the influence of the mogden stw
TRANSCRIPT
Odour survey to assess the influence of the Mogden STW Extension Scheme
TWUL13C_20_draft, December 2013
Odournet UK Ltd
page 1 of 44
2430
title: Odour survey to assess the influence of the Mogden STW Extension Scheme
report number: TWUL13C_20_draft
project code: TWUL13C
key words:
client: Thames Water Utilities Ltd
Mogden Lane
MIDDLESEX
44 734 591159 phone
44 734 593699 fax
contact: Mr. Z Espi-Castillo
contractor: Odournet UK Ltd
5, St. Margaret’s Street
Bradford on Avon
Wiltshire BA15 1DA
01225 868869 phone 01225 865969 fax Companies House Cardiff 2900894
authors: Andrew Meacham
approved: on behalf of Odournet UK Ltd by
Mr. Nick Jones, director
date: 19 December 2013
copyright: ©2013, Odournet UK Ltd
Copyright and Non-Disclosure Notice The contents and layout of this report are subject to copyright owned by Odournet UK Ltd (©Odournet UK Limited 2012) save to the extent that
copyright has been legally assigned by us to another party or issued by Odournet UK Ltd under licence. To the extent that we own the copyright in this
report it may not be copied or used without our prior written agreement for any purpose other than the purpose indicated in this report.
The methodology (if any) contained in this report is provided to you in confidence and must not be disclosed or copied to third parties without the prior
written agreement of Odournet UK Ltd. Disclosure of that information may constitute an actionable breach of confidence or may otherwise prejudice
our commercial interests.
page 2 of 44
Executive Summary
This report presents the findings of an odour assessment study relating to the wastewater treatment
operations conducted at Mogden Sewage Treatment Works (STW), Isleworth, London. The odour survey
was undertaken by Odournet UK Ltd under instruction from Thames Water Utilities Limited (TWUL).
The study was commissioned to assess the effect of the recently completed extension in terms of its
influence on total emissions from the site. Emissions following completion of the Extension Scheme are
investigated and compared against those presented during the planning phase of the Mogden STW
Extension.
The following specific objectives were addressed during the course of the survey:
To measure the rate of odour release of each aspect of the sewage treatment and sludge
handling processes and evaluate the effectiveness of the odour treatment units serving these
areas.
To quantify the overall odorous emissions currently generated from the works.
To compare the current site emissions to previous datasets obtained prior to the completion of
the extension scheme and to compare Realised Extension site emissions to the Planning Scenario
site emissions.
The assessment was conducted using reference odour emission data measured onsite alongside data from
the Odournet reference library (collected ‘at source’ in accordance with the British Standard for
Olfactometry EN13725 from sites across the UK). Emission estimates for the site were defined on the
basis of odour emission data an odour survey conducted in September 2013 and where relevant, previous
studies at Mogden STW conducted by Odournet UK in 2005, 2008 and 2012, as well as data contained
within the Odournet UK Ltd odour emission library.
To assess the influence of the Extension Scheme and to compare odour levels against data presented at
planning, the following operational scenarios are considered within this report:
Planning Baseline – the pre-extension baseline presented at planning.
Planning Extension – the predicted emissions levels generated from the site following the
Extension Scheme.
Realised Extension – the calculated emission levels generated from measurements following
construction of the Extension Scheme.
The key findings of the survey are as follows:
The survey indicated that the odour emissions rates measured from the majority of open
elements of the works were broadly comparable to those measured during the previous survey
and estimated during the planning application, within the variance expected for an operational
sewage works. The survey also indicates that the new odour control systems installed as part of
the extension are all performing well, with measured emission rates below that specified during
their design.
However, elevated emission rates above that predicted during the planning application were
measured from a number of the existing odour control systems (Eastside OCU, Westside OCU,
Inlet PS OCU and the Sludge thickening OCU); from the storm water handling operations, and the
new Bank E aeration plant. As a result, the total emissions estimated from the Realised
Extension Scenario are 213,000 ouE/s expressed as a summer time weighted average. This
page 3 of 44
represents a 57% increase in emissions compared to those presented at planning. The cause of
these increases in emissions are explained below:
o The concentration of residual odours released from the Eastside OCU, Westside OCU,
Inlet PS OCU and Sludge Thickening OCU are currently above that predicted at planning.
The elevation in emission rates measured from the East Side, West Side OCU, and Sludge
Thickening OCU are likely to be due to reduced performance of the carbon stage of the
treatment systems which is likely to be coming to the end of its life.
o The performance of the Inlet PS OCU appears to have reduced significantly since the
previous survey. This correlates with elevated hydrogen sulphide levels measured from
Thames Water's in-stack monitors during the time of the survey. However, ongoing
monitoring undertaken by Thames Water indicates that the hydrogen sulphide
abatement efficiency of the system has improved to levels previously monitored since
the odour monitoring was undertaken.
o Emissions from the channels serving the storm tanks are higher than anticipated as a
result of retention of storm water in the channels in between storm events.
o Emissions from the anoxic zones of ASP Bank E are higher than anticipated due to the
accumulation of odorous scum.
o Emissions from the aerobic section of ASP Bank E are marginally higher than predicted at
planning and on the basis of relatively limited hedonic tone data do not appear to
demonstrate the same characteristics in terms of reduced offensiveness of the existing
AS plant.
The study highlights that a number of improvements are recommended in order to reduce
odour emission levels from the works. The recommended improvements are summarised as
follows:
o Replace the carbon in the East Side, West Side and Sludge Thickening OCU.
o Confirm that the current odour abatement performance of the Inlet PS OCU has
improved to levels indicated by recent hydrogen sulphide monitoring data.
o Install a scum suppression system in the anoxic zone of Bank E to eliminate scum
formation.
o Review the operational procedures around the storm channels to reduce retention of
storm water in between storm events.
o If these improvements are implemented then total odour emissions from the site are
likely to be reduced to levels comparable to those predicted during the planning
application.

page 4 of 44
Table of Contents
Executive Summary 2
Table of Contents 4
1 Introduction and scope 6
1.1 Introduction 6
1.2 Scope 6
1.3 Structure of report 6
1.4 Quality Control and Assurance 6
2 Description of approach 8
2.1 Odour measurement programme 8
2.2 Estimation of site emissions 9
3 Overview of works operations 10
3.1 Location of works 10
3.2 Overview of pre and post extension works layout 10
3.3 Baseline operating conditions (pre-extension) 11
3.4 Changes to operations following extension 13
4 Identification of odour sources 14
4.1 Overview of the mechanisms for odour generation from sewage treatment operations 14
4.2 Identification of sources of odour emission 14
5 Review of 2013 survey results 16
5.1 Review of odour emission data 16
5.2 Review of odour control unit performance 17
5.3 Hedonic tone measurements 18
6 Estimation of odour emission rates 20
6.1 Operational scenarios considered 20
6.2 Estimation of odour emissions 20
6.3 Review of emission estimates applied 21
7 Quantification of site emissions 23
7.1 Emission heirachy for Planning Scenarios and Realised Extension Scenario 23
8 Summary of findings 25
Annex A Odour sampling programme 27
Annex B Odour measurements data 29
page 5 of 44
B.1 Odour measurement data from 2013 30
B.2 Odour measurement data from 2012 33
B.3 Odour measurement data from 2008 35
B.4 Odour measurement data from 2005 37
Annex C Assumptions applied to derive emission estimates 39
C.1 Realised Extension Scenario 40
C.2 Planning Scenarios 42

page 6 of 44
1 Introduction and scope
1.1 Introduction
This report presents the findings of an odour assessment study relating to the wastewater treatment
operations conducted at Mogden Sewage Treatment Works (STW), Isleworth, London. The odour survey
was undertaken by Odournet UK Ltd under instruction from Thames Water Utilities Limited (TWUL).
The study was commissioned to assess the effect of the recently completed extension in terms of its
influence on total emissions from the site. Emissions following completion of the Extension Scheme are
investigated and compared against those presented during the planning phase of the Mogden STW
Extension in order to assess whether the extension has resulted in any significant changes to odorous
emission levels generated by the site.
1.2 Scope
The following specific objectives were addressed during the course of the survey:
To measure the rate of odour release of each aspect of the sewage treatment and sludge
handling processes and evaluate the effectiveness of the odour treatment units serving these
areas.
To quantify the overall odorous emissions currently generated from the works.
To compare the current site emissions to previous data obtained prior to the completion of the
extension scheme and to compare current site emissions to those presented during the planning
phase of the Extension Scheme.
1.3 Structure of report
The report is structured as follows:
Section 2 of the report describes the approach undertaken during the study.
Section 3 presents an overview of operations at the site.
Section 4 summarises the odour sources that are present onsite.
Section 5 details the results of the odour measurement programme.
Section 6 describes the emission rates applied to define total site emissions.
Section 7 presents an analysis of the current site emissions to previous datasets.
Section 8 summarises the findings of the study.
Supporting information is presented in the Annexes.
1.4 Quality Control and Assurance
Odournet’s odour measurement, assessment and consultancy services are conducted to the highest
possible quality criteria by highly trained and experienced specialist staff. All activities are conducted in
accordance with quality management procedures that are certified to ISO 9001 (Certificate No. A13725).
All sensory odour analysis and odour sampling services are undertaken using UKAS accredited procedures
(UKAS Testing Laboratory No. 2430) which comply fully with the requirements of the international
quality standard ISO 17025: 2005 and the European standard for olfactometry EN13725: 2003. Where
required, Odournet are accredited to conduct odour sampling from stacks and ducts in accordance to ISO

page 7 of 44
17025: 2005 and EN13725: 2003 under the MCERTS scheme. Odournet is the only company in the UK to
have secured UKAS accreditation for all elements of the odour measurement and analysis procedure.
The Odournet laboratory is recognised as one of the foremost laboratories in Europe, consistently out
performing the requirements of the British Standard for Olfactometry in terms of accuracy and
repeatability of analysis results.

page 8 of 44
2 Description of approach
2.1 Odour measurement programme
The 2013 survey involved an odour measurement exercise which was conducted between the
23rdSeptember and 3rd October 2013.
The odour measurement programme involved the following:
Measurement of emission rates from the key processing activities in terms of odour units and
hydrogen sulphide.
Measurement of the odour abatement efficiency of the existing odour control units.
Assessment of the Hedonic tone (relative offensiveness) of odorous emissions from the various
aspects of the process.
The techniques applied for each of these approaches are described below:
2.1.1 Measurement of odour, hydrogen sulphide and ammonia emissions
The odour emission measurement exercise was conducted between 23rd September and 3rd October 2013.
The specific aspects of the treatment process from which samples were collected, and the number of
samples collected at each location, are summarised in Annex A.
At each location, samples of air were collected using the sampling techniques described in Annex A. The
collected samples were then transported back to the Odournet UK Ltd UKAS accredited olfactometry
laboratorya where the following analyses were conducted, within 30 hours from the time of collection:
Determination of the odour concentration in terms of European odour units in accordance with
the British Standard for Olfactometry BSEN13725: 2003b. The analysis was conducted using
Odournet’s internal quality management procedure which is accredited by the UK accreditation
services (UKAS) under certificate No. 2430.
Measurement of the hydrogen sulphide concentration using either Gastec tubes (for
concentrations >20ppm), or a calibrated Jerome gold film analyser (for concentrations less than
20 ppm).
In order to ensure that the odour emission data were representative of conditions that pose the greatest
risk of odour impact to nearby sensitive receptors, the qualifying criteria outlined in the survey protocol
were as follows:
3 days with less than 5 mm of rain were recorded at Heathrow Airport (for all open liquid odour
sources or odour sources which are likely to be affected by changes in the quality of the influent
over the short-term).
Sludge levels within the primary settlement tanks were at typical operating levels.
2.1.2 Analysis of the relative offensiveness of odours
Analysis of the relative offensiveness (hedonic tone) of the odours generated from each stage of the
treatment process was conducted using an in-house analysis method based on VDI 3882:1997, Part 2;
Determination of Hedonic Tone, Düsseldorf, Germany. The objective of this analysis was to identify any
differences between the offensiveness of odours generated from each stage of the treatment process, by
identifying the concentration at which each odour is considered to be ‘mildly’ offensive by a panel of
a United Kingdom Accreditation Services (UKAS) laboratory number 2430. b BSEN 13725:2003, Air quality - Determination of odour concentration by dynamic olfactometry.

page 9 of 44
observers with a defined acuity to odour. Presentation of the odour samples and determination of the
hedonic tone were conducted under controlled conditions using the Odournet UK Ltd olfactometry
laboratory.
The sample programme for hedonic tone measurements is presented in Annex A.
2.1.3 Assessment of the efficiency of odour control plant
The efficiency of the odour control plant currently in place at Mogden STW was calculated from the
emission measurement results from the untreated (crude) and treated (clean) air streams for each odour
control unit, using the equation below in accordance with Annex H of British Standard for Olfactometry
BS13725:2003.
od = qod, crude – qod,clean
qod, crude
Where: qod, crude =odour emission of the gas stream presented to the abatement plant.
qod, clean =odour emission of the gas stream after treatment by the abatement plant.
2.2 Estimation of site emissions
The odour emissions from each stage of the processing operations were derived from the emission
measurements collected during the sampling programme, in combination with relevant operational data
and site plans provided by TWUL.
Emission estimates (expressed in terms of European odour units) for each source were then defined from
the site specific data collected during the measurement survey alongside data from the Odournet odour
emission database, which contains emission data from a wide range of sewage treatment facilities in the
Thames catchments area, and across the UK. To allow for expected natural variations in influent quality
the emission rates defined for this study have been derived from the results of the full site odour surveys
conducted at Mogden STW by Odournet UK Ltd in 2005 and 2008 and the odour control monitoring study
in 2012 as individual datasets offer a snapshot of emissions at a single point in time.
All of the data utilised was collected using sampling and analysis techniques compliant with the British
Standard for Olfactometry BSEN13725: 2003.
In defining emissions, the following factors were considered:
The dimensions of each odour source.
The frequency of use of each aspect of the plant.
The potential effects of sludge/sewage turbulence.
The potential influence of seasonal differences in terms of temperature and rainfall.

page 10 of 44
3 Overview of works operations
3.1 Location of works
Mogden Sewage Treatment Works is located in an urban area to the north of Twickenham, Greater
London, as displayed in Figure below.
Figure 1: Map of the area surrounding Mogden STW
3.2 Overview of pre and post extension works layout
The layout of the current, post extension treatment assets at Mogden STW is shown in Figure 2 below.
Plant which were unaffected by the Extension Scheme are displayed in blue. Aspects of the works that
were constructed as part of the Extension Scheme are displayed in purple, and areas where operational
changes have been implemented as part of the Extension Scheme are displayed in green.
The locations of odour control plant outlet stacks are displayed as numbered circles. Blue circles
indicate odour control plant (OCUs) unaffected by the Extension Scheme, purple circles represent new

page 11 of 44
odour control plant constructed as part of the Extension Scheme and green circles show the location of
odour control plant whose operations are either modified or eliminated under the Extension Scheme.
Figure 2: Layout of treatment assets at Mogden STW
Section 3.3 presents an overview of the treatment stream that was in place prior to the construction of
the Extension Scheme, referred to as the Baseline Condition in this report.
In general terms, the majority of plant operates in a comparable manner in both Baseline and Extension
Scheme Conditions, although additional treatment plant have been incorporated into the Extension
Scheme.
A description of post extension operations in plant that exhibit changes as a result of the Extension
Scheme and are relevant from an odour perspective are detailed in Section 3.4
3.3 Baseline operating conditions (pre-extension)
3.3.1 Sewage handling and treatment
The preliminary, primary and secondary treatment phases of the works were divided into separate
process streams, the West Side, and the East Side works.

page 12 of 44
3.3.1.1 West Side works
The ‘West Side’ inlet works, comprises screening and grit removal plant. Screenings are directed to
Washpactors (screenings washing and dewatering units) prior to being compacted into enclosed
containers. Grit is washed in classifiers prior to deposition in enclosed skips. The screenings containers
and grit skips are regularly removed for disposal off-site to a licensed waste disposal facility.
The sewage flow is then pumped via Archimedean Screws to a flow splitting chamber. All aspects of the
West Side works upstream of the flow splitting chamber are enclosed with emissions extracted and
treated through the West Side OCU. The West Side OCU comprises of a biological scrubber followed by
carbon filter. Treated emissions are discharged through a 15 m stack.
Approximately half the flow is directed, via a pre-aeration zone, to 4 No. rectangular Primary
Settlement Tanks (PSTs), whilst the other half of the flow is directed through a set of open pre-aeration
lanes to 4 No. circular open radial flow Primary Settlement Tanks.
Following settlement, the sewage from both sets of tanks are directed to 8 No. diffused aerated
activated sludge tanks where it undergoes secondary (biological) treatment, followed by final settlement
3.3.1.2 East Side works
The incoming gravity low level sewer flow passes to a main pumping station (which is enclosed and
extracted to the Inlet PS OCU) and is then pumped to the ‘East Side’ inlet works where it is combined
with the high level culvert gravity flows. This then passes through the East Side inlet screening plant
followed by grit removal plant. Screening material extracted from the sewage flow is transferred to
Washpactors prior to compaction into enclosed containers. Grit is dewatered in classifiers and deposited
into skips within an enclosed building. The screenings containers and grit skips are regularly removed for
disposal offsite to a licensed waste disposal facility.
Flows are then passed through 4 No rectangular Primary Settlement Tanks. The settled sewage is then
directed to 12 No. diffused aerated activated sludge plant and onto Final Settlement Tanks. Following
final settlement, the flow is combined with the effluent from the West Side works and discharged to the
River Thames.
Emissions generated from the preliminary and primary treatment aspects of the East Side works are
extracted and treated through the East Side OCU. The East Side OCU is made of two treatment streams,
each of which consists of a chemical scrubber followed by carbon filter. Treated emissions are released
through a 15 m stack.
3.3.2 Storm water storage
In the event that the incoming flow exceeds the maximum flow to treatment of the works, the excess
flow is directed through the screens and grit channels on the East side of the works and into one of 8 No.
Storm tanks via a storm overflow weir located immediately upstream of the Primary Settlement Tanks.
The 2 No. ‘first fill’ storm tanks are covered with odorous air extracted to the Easy Side OCU. After
cessation of storm conditions, flows are returned to the East inlet works via storm return pumps to a
point located downstream of the storm weir.
3.3.3 Sludge handling and treatment operations
The sludge handling operations involve the collection and treatment of primary sludge (extracted from
the primary settlement tanks), surplus activated sludge (extracted from the final settlement tanks) and
imported sludge delivered to the site by road tankers.
Primary sludge is pumped via sealed pipe work from the primary/secondary settlement tanks to the raw
Sludge Holding Tanks (RSHT). The sludge was then pumped to drum thickeners within a sludge thickening
building and transferred to a Thickened Sludge Balancing Tank (TSBT). The thickeners also process
imported sludges that are delivered to the site by road.

page 13 of 44
Surplus Activated Sludge (SAS) is thickened in 2 No. covered picket fence thickeners and then passed
through centrifuges located within the sludge thickening building, prior to being blended with raw sludge
in the TSBT. The mixed thickened sludge from the TSBT is then directed to the pasteurisation plant.
Following pasteurisation the sludge passes through a heat exchanger before being pumped to the
digesters. After digestion, sludge is collected in the Digested Sludge Transfer Tank (DSTT) prior to being
pumped offsite to the Iver South Sludge Treatment Centre.
Liquors generated by the sludge thickening operations are directed to a covered sump, from where they
are pumped back to the East Side inlet works (after the storm weir).
The following odour control systems serve the sludge handling treatment operations of the site:
The Sludge Import OCU, which treats odours from the import facility.
The Sludge Thickening OCU, which treats odours from the sludge thickening building and the
headspaces of the TSBT and RSHTs.
The Pasteurisation OCU, which treats odours from the pasteurisation tanks.
The Sludge Transfer OCU which treats odours from the liquor sump, and the DSTT and associated
pumping stations.
3.4 Changes to operations following extension
The extension scheme has resulted in a number of changes to the way in which Mogden operates.
An additional effluent treatment scheme has been constructed as part of the Extension Scheme,
alongside modifications to the sludge treatment process.
The Extension Scheme was designed to be ‘odour neutral’, i.e. there would be no increase in offsite
odour exposure levels as a result of the additional plant. New plant have been constructed to increase
the capacity of the works and due to the nature of the processes involved some of these plant will
generate odorous emissions. A number of odour reduction measures have been incorporated into the
design, both to reduce emissions from existing plant and to minimise emissions from new plant.
Table 1 below summarises the changes that have been implemented at the site that have the potential
to influence odorous emissions from the works.
Table 1: Summary of changes to operations that are relevant from an odour persceptive
Aspect of works Change to operations
New inlet works Construction of new works. Covered and extracted to OCU 11
New Bank E PSTs Construction of 4 No. new rectangular PSTs. Covered and extracted to OCU 11
Bank D PSTs and pre aeration lane Installation of covers to existing plant. Extracted to OCU 11
New Bank E ASP Construction of new open plant comprising annoxic and aerobic lanes.
Additional pasteurisation tanks Construction of new enclosed plant. Extracted to OCU 12
Relocation of raw sludge hold tanks Relocation of 2 No. Tanks. Covered and extratced to OCU 12 instead of Sludge Thickening OCU
New sludge screening building Construction of sludge screening building. Extracted to Sludge Thickening OCU
Sludge reception plant Emissions from the sludge import operations are now extracted to OCU 12
page 14 of 44
4 Identification of odour sources
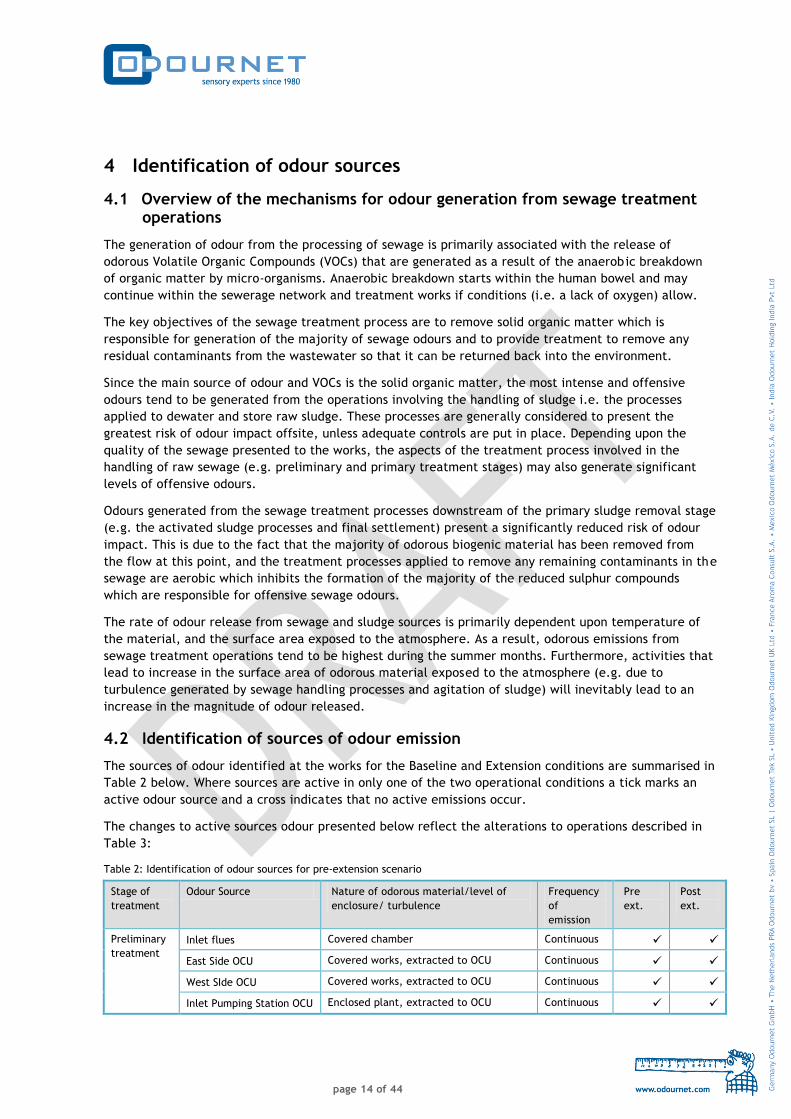
4.1 Overview of the mechanisms for odour generation from sewage treatment operations
The generation of odour from the processing of sewage is primarily associated with the release of
odorous Volatile Organic Compounds (VOCs) that are generated as a result of the anaerobic breakdown
of organic matter by micro-organisms. Anaerobic breakdown starts within the human bowel and may
continue within the sewerage network and treatment works if conditions (i.e. a lack of oxygen) allow.
The key objectives of the sewage treatment process are to remove solid organic matter which is
responsible for generation of the majority of sewage odours and to provide treatment to remove any
residual contaminants from the wastewater so that it can be returned back into the environment.
Since the main source of odour and VOCs is the solid organic matter, the most intense and offensive
odours tend to be generated from the operations involving the handling of sludge i.e. the processes
applied to dewater and store raw sludge. These processes are generally considered to present the
greatest risk of odour impact offsite, unless adequate controls are put in place. Depending upon the
quality of the sewage presented to the works, the aspects of the treatment process involved in the
handling of raw sewage (e.g. preliminary and primary treatment stages) may also generate significant
levels of offensive odours.
Odours generated from the sewage treatment processes downstream of the primary sludge removal stage
(e.g. the activated sludge processes and final settlement) present a significantly reduced risk of odour
impact. This is due to the fact that the majority of odorous biogenic material has been removed from
the flow at this point, and the treatment processes applied to remove any remaining contaminants in the
sewage are aerobic which inhibits the formation of the majority of the reduced sulphur compounds
which are responsible for offensive sewage odours.
The rate of odour release from sewage and sludge sources is primarily dependent upon temperature of
the material, and the surface area exposed to the atmosphere. As a result, odorous emissions from
sewage treatment operations tend to be highest during the summer months. Furthermore, activities that
lead to increase in the surface area of odorous material exposed to the atmosphere (e.g. due to
turbulence generated by sewage handling processes and agitation of sludge) will inevitably lead to an
increase in the magnitude of odour released.
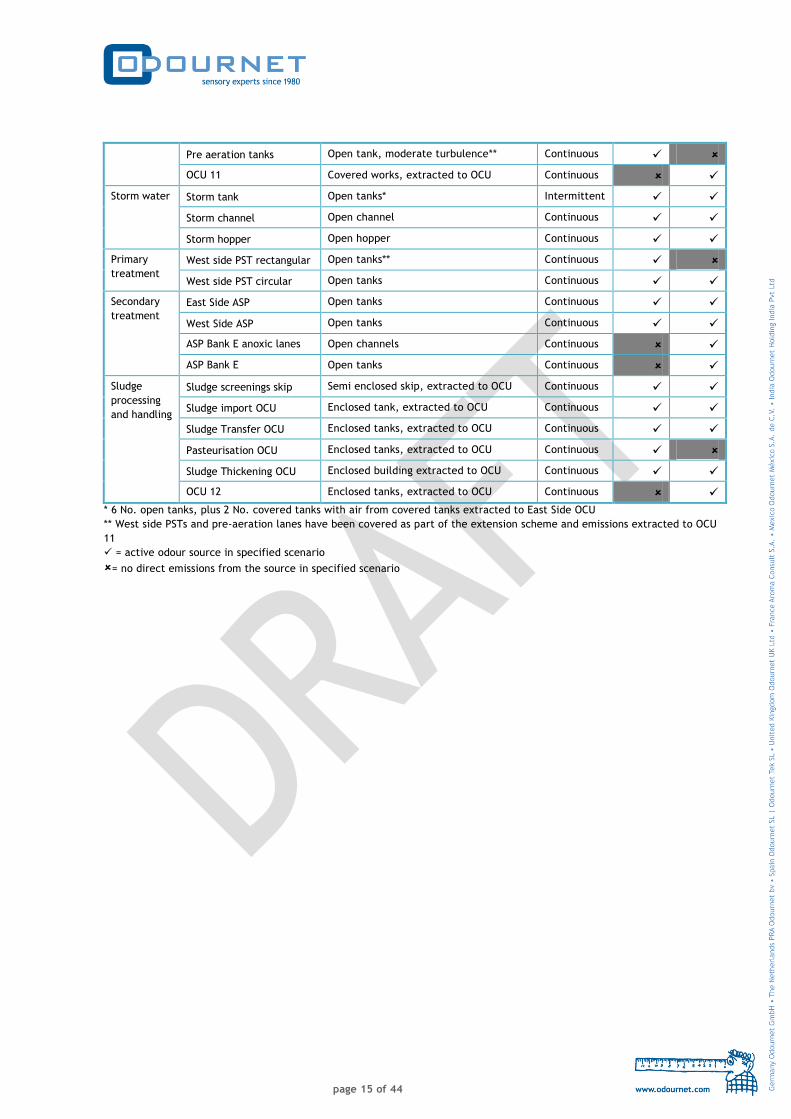
4.2 Identification of sources of odour emission
The sources of odour identified at the works for the Baseline and Extension conditions are summarised in
Table 2 below. Where sources are active in only one of the two operational conditions a tick marks an
active odour source and a cross indicates that no active emissions occur.
The changes to active sources odour presented below reflect the alterations to operations described in
Table 3:
Table 2: Identification of odour sources for pre-extension scenario
Stage of
treatment
Odour Source Nature of odorous material/level of
enclosure/ turbulence
Frequency
of
emission
Pre
ext.
Post
ext.
Preliminary
treatment
Inlet flues Covered chamber Continuous
East Side OCU Covered works, extracted to OCU Continuous
West SIde OCU Covered works, extracted to OCU Continuous
Inlet Pumping Station OCU Enclosed plant, extracted to OCU Continuous
page 15 of 44
Pre aeration tanks Open tank, moderate turbulence** Continuous
OCU 11 Covered works, extracted to OCU Continuous
Storm water Storm tank Open tanks* Intermittent
Storm channel Open channel Continuous
Storm hopper Open hopper Continuous
Primary
treatment
West side PST rectangular Open tanks** Continuous
West side PST circular Open tanks Continuous
Secondary
treatment
East Side ASP Open tanks Continuous
West Side ASP Open tanks Continuous
ASP Bank E anoxic lanes Open channels Continuous
ASP Bank E Open tanks Continuous
Sludge
processing
and handling
Sludge screenings skip Semi enclosed skip, extracted to OCU Continuous
Sludge import OCU Enclosed tank, extracted to OCU Continuous
Sludge Transfer OCU Enclosed tanks, extracted to OCU Continuous
Pasteurisation OCU Enclosed tanks, extracted to OCU Continuous
Sludge Thickening OCU Enclosed building extracted to OCU Continuous
OCU 12 Enclosed tanks, extracted to OCU Continuous
* 6 No. open tanks, plus 2 No. covered tanks with air from covered tanks extracted to East Side OCU
** West side PSTs and pre-aeration lanes have been covered as part of the extension scheme and emissions extracted to OCU
11
= active odour source in specified scenario
= no direct emissions from the source in specified scenario
page 16 of 44
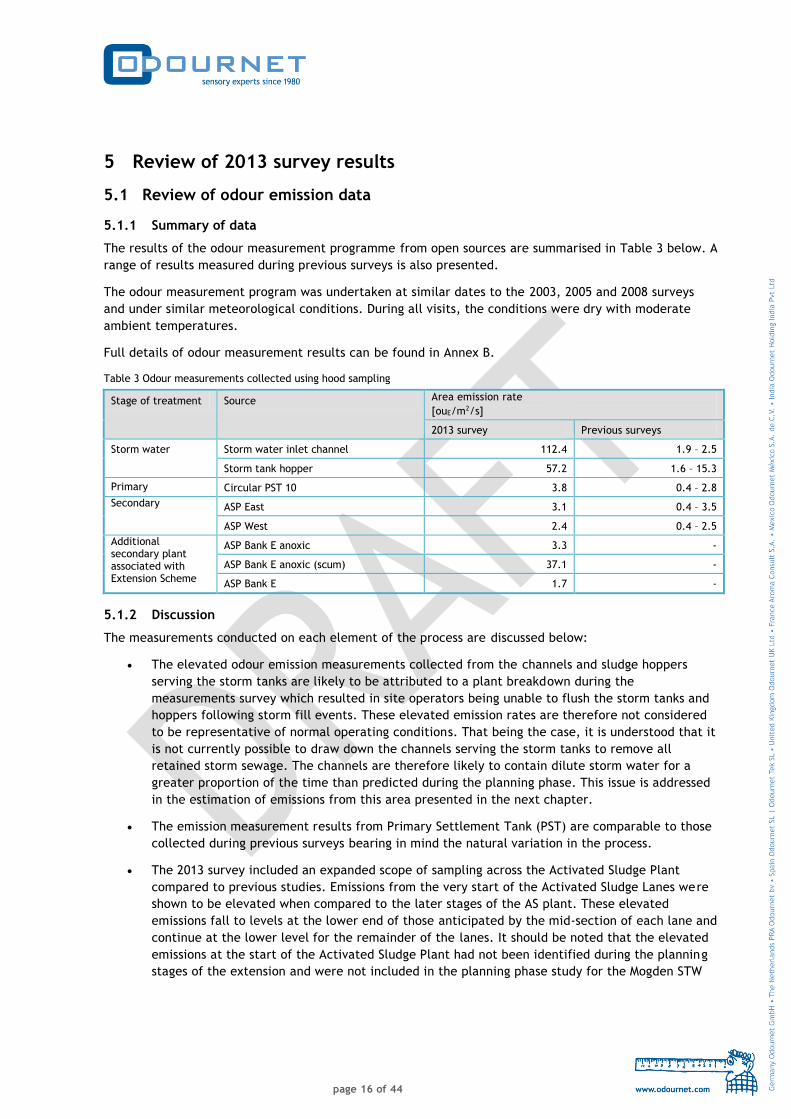
5 Review of 2013 survey results
5.1 Review of odour emission data
5.1.1 Summary of data
The results of the odour measurement programme from open sources are summarised in Table 3 below. A
range of results measured during previous surveys is also presented.
The odour measurement program was undertaken at similar dates to the 2003, 2005 and 2008 surveys
and under similar meteorological conditions. During all visits, the conditions were dry with moderate
ambient temperatures.
Full details of odour measurement results can be found in Annex B.
Table 3 Odour measurements collected using hood sampling
Stage of treatment Source Area emission rate
[ouE/m2/s]
2013 survey Previous surveys
Storm water Storm water inlet channel 112.4 1.9 – 2.5
Storm tank hopper 57.2 1.6 – 15.3
Primary Circular PST 10 3.8 0.4 – 2.8
Secondary ASP East 3.1 0.4 – 3.5
ASP West 2.4 0.4 – 2.5
Additional secondary plant associated with Extension Scheme
ASP Bank E anoxic 3.3 -
ASP Bank E anoxic (scum) 37.1 -
ASP Bank E 1.7 -
5.1.2 Discussion
The measurements conducted on each element of the process are discussed below:
The elevated odour emission measurements collected from the channels and sludge hoppers
serving the storm tanks are likely to be attributed to a plant breakdown during the
measurements survey which resulted in site operators being unable to flush the storm tanks and
hoppers following storm fill events. These elevated emission rates are therefore not considered
to be representative of normal operating conditions. That being the case, it is understood that it
is not currently possible to draw down the channels serving the storm tanks to remove all
retained storm sewage. The channels are therefore likely to contain dilute storm water for a
greater proportion of the time than predicted during the planning phase. This issue is addressed
in the estimation of emissions from this area presented in the next chapter.
The emission measurement results from Primary Settlement Tank (PST) are comparable to those
collected during previous surveys bearing in mind the natural variation in the process.
The 2013 survey included an expanded scope of sampling across the Activated Sludge Plant
compared to previous studies. Emissions from the very start of the Activated Sludge Lanes were
shown to be elevated when compared to the later stages of the AS plant. These elevated
emissions fall to levels at the lower end of those anticipated by the mid-section of each lane and
continue at the lower level for the remainder of the lanes. It should be noted that the elevated
emissions at the start of the Activated Sludge Plant had not been identified during the planning
stages of the extension and were not included in the planning phase study for the Mogden STW
page 17 of 44
Extension Schemec. When averaged across the lane, the data indicates a similar odour emission
rate for the whole ASP as that indicated during previous studies at the works.
Measurements from the new Bank E ASP show that odour emissions from areas of the anoxic
lanes that are covered in scum are approximately an order of magnitude higher than non-scum
covered areas. The elevated emissions appear to be due to the accumulation of odorous scum.
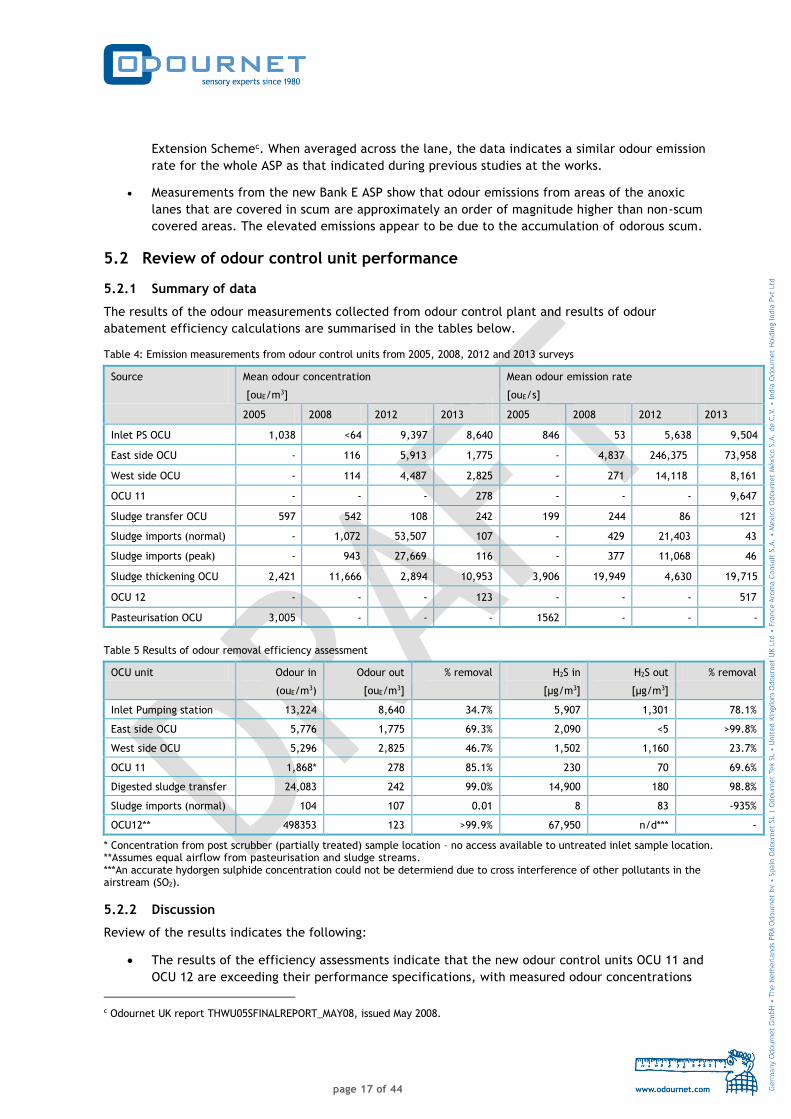
5.2 Review of odour control unit performance
5.2.1 Summary of data
The results of the odour measurements collected from odour control plant and results of odour
abatement efficiency calculations are summarised in the tables below.
Table 4: Emission measurements from odour control units from 2005, 2008, 2012 and 2013 surveys
Source
Mean odour concentration
[ouE/m3]
Mean odour emission rate
[ouE/s]
2005 2008 2012 2013 2005 2008 2012 2013
Inlet PS OCU 1,038 <64 9,397 8,640 846 53 5,638 9,504
East side OCU - 116 5,913 1,775 - 4,837 246,375 73,958
West side OCU - 114 4,487 2,825 - 271 14,118 8,161
OCU 11 - - - 278 - - - 9,647
Sludge transfer OCU 597 542 108 242 199 244 86 121
Sludge imports (normal) - 1,072 53,507 107 - 429 21,403 43
Sludge imports (peak) - 943 27,669 116 - 377 11,068 46
Sludge thickening OCU 2,421 11,666 2,894 10,953 3,906 19,949 4,630 19,715
OCU 12 - - - 123 - - - 517
Pasteurisation OCU 3,005 - - - 1562 - - -
Table 5 Results of odour removal efficiency assessment
OCU unit Odour in
(ouE/m3)
Odour out
[ouE/m3]
% removal H2S in
[µg/m3]
H2S out
[µg/m3]
% removal
Inlet Pumping station 13,224 8,640 34.7% 5,907 1,301 78.1%
East side OCU 5,776 1,775 69.3% 2,090 <5 >99.8%
West side OCU 5,296 2,825 46.7% 1,502 1,160 23.7%
OCU 11 1,868* 278 85.1% 230 70 69.6%
Digested sludge transfer 24,083 242 99.0% 14,900 180 98.8%
Sludge imports (normal) 104 107 0.01 8 83 -935%
OCU12** 498353 123 >99.9% 67,950 n/d*** -
* Concentration from post scrubber (partially treated) sample location – no access available to untreated inlet sample location. **Assumes equal airflow from pasteurisation and sludge streams. ***An accurate hydorgen sulphide concentration could not be determiend due to cross interference of other pollutants in the airstream (SO2).
5.2.2 Discussion
Review of the results indicates the following:
The results of the efficiency assessments indicate that the new odour control units OCU 11 and
OCU 12 are exceeding their performance specifications, with measured odour concentrations
c Odournet UK report THWU05SFINALREPORT_MAY08, issued May 2008.
page 18 of 44
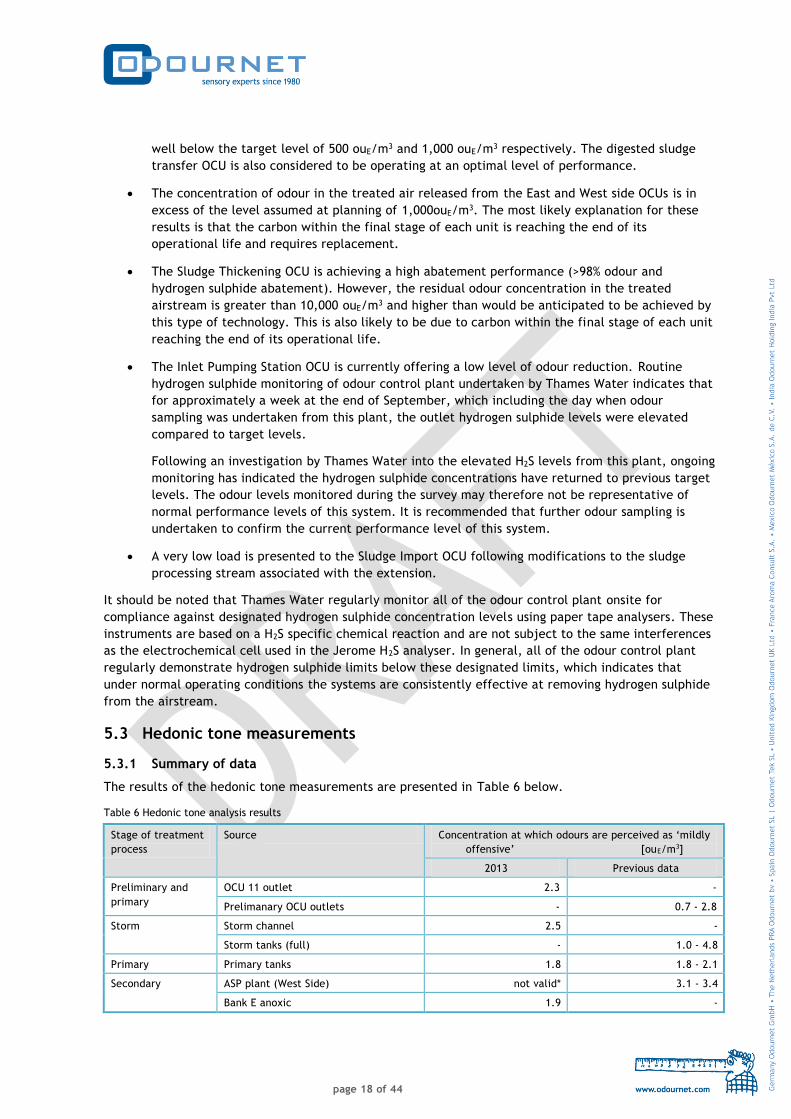
well below the target level of 500 ouE/m3 and 1,000 ouE/m3 respectively. The digested sludge
transfer OCU is also considered to be operating at an optimal level of performance.
The concentration of odour in the treated air released from the East and West side OCUs is in
excess of the level assumed at planning of 1,000ouE/m3. The most likely explanation for these
results is that the carbon within the final stage of each unit is reaching the end of its
operational life and requires replacement.
The Sludge Thickening OCU is achieving a high abatement performance (>98% odour and
hydrogen sulphide abatement). However, the residual odour concentration in the treated
airstream is greater than 10,000 ouE/m3 and higher than would be anticipated to be achieved by
this type of technology. This is also likely to be due to carbon within the final stage of each unit
reaching the end of its operational life.
The Inlet Pumping Station OCU is currently offering a low level of odour reduction. Routine
hydrogen sulphide monitoring of odour control plant undertaken by Thames Water indicates that
for approximately a week at the end of September, which including the day when odour
sampling was undertaken from this plant, the outlet hydrogen sulphide levels were elevated
compared to target levels.
Following an investigation by Thames Water into the elevated H2S levels from this plant, ongoing
monitoring has indicated the hydrogen sulphide concentrations have returned to previous target
levels. The odour levels monitored during the survey may therefore not be representative of
normal performance levels of this system. It is recommended that further odour sampling is
undertaken to confirm the current performance level of this system.
A very low load is presented to the Sludge Import OCU following modifications to the sludge
processing stream associated with the extension.
It should be noted that Thames Water regularly monitor all of the odour control plant onsite for
compliance against designated hydrogen sulphide concentration levels using paper tape analysers. These
instruments are based on a H2S specific chemical reaction and are not subject to the same interferences
as the electrochemical cell used in the Jerome H2S analyser. In general, all of the odour control plant
regularly demonstrate hydrogen sulphide limits below these designated limits, which indicates that
under normal operating conditions the systems are consistently effective at removing hydrogen sulphide
from the airstream.
5.3 Hedonic tone measurements
5.3.1 Summary of data
The results of the hedonic tone measurements are presented in Table 6 below.
Table 6 Hedonic tone analysis results
Stage of treatment
process
Source Concentration at which odours are perceived as ‘mildly
offensive’ [ouE/m3]
2013 Previous data
Preliminary and
primary
OCU 11 outlet 2.3 -
Prelimanary OCU outlets - 0.7 - 2.8
Storm Storm channel 2.5 -
Storm tanks (full) - 1.0 - 4.8
Primary Primary tanks 1.8 1.8 - 2.1
Secondary ASP plant (West Side) not valid* 3.1 - 3.4
Bank E anoxic 1.9 -

page 19 of 44
Bank E aerobic 1.4 -
Sludge Sludge thickening OCU outlet 1.5 0.8
*The concentration of the sample was too low to allow a valid assessment of hedonic tone
5.3.2 Discussion
Measurements of hedonic tone are broadly comparable to previous studies with the exception of results
from the ASP process. Previous studies have highlighted that emissions form these plant are considered
to be less offensive than other aspects of the works.
During the 2013 survey the concentration of the air sample collected from the West side activated sludge
plant sample was too low to allow a valid hedonic tone analysis. As a result, it is assumed that the
offensiveness of the emissions from this plant is likely to remain similar to that determined during all of
the previous surveys.
Results from the new Bank E ASP demonstrate that odours became offensive at similar concentration
levels to other treatment processes monitored during the 2013 survey.

page 20 of 44
6 Estimation of odour emission rates
6.1 Operational scenarios considered
The odour measurement survey identified changes in emissions to a number of sources that are not
considered to be the result of the extension scheme. In order to determine the effect of the extension
scheme on site emissions, the results of the 2013 study have been compared to the emission data
presented during planning. Emissions from the following scenarios have therefore been investigated:
Planning Baseline – the pre-extension baseline presented at planning.
Planning Extension – the predicted emissions levels generated from the site following the
Extension Scheme.
Realised Extension – the calculated emission levels generated from measurements following
construction of the Extension Scheme.
6.2 Estimation of odour emissions
6.2.1 Assumptions applied to define emission estimates
For sources where emissions have not been directly influenced by the extension scheme emission rates
have been calculated as an average across all relevant survey data. The nature of olfactometry analysis
requires a spot sample to be collected that represents a snap shot of emissions at a particular time.
Experience demonstrates that measurements will vary from day to day and that a more realistic picture
of emissions from a specific source can be achieved by looking at measured emissions over a number of
measurement surveys, rather than an individual data set in isolation.
The approach in defining emission estimates was similar for the planning and realised scenarios.
The main exception relates to how the emission estimates from the AS plant were defined. In 2013, the
odour measurements conducted on the AS plant were expanded to determine emission rates at the start,
middle and end of the lane compared to the collection of samples from the middle of the lanes only
conducted in previous surveys. The emission rates from the Realised Extension have therefore been
calculated from the geometric mean value of all of these data collected in 2013 rather than just the
mid-point.
A full break down of assumptions used to derive emission estimates can be found in Annex C. The main
assumptions applied emission rates for the scenarios have been defined as follows:
Planning Scenarios:
Emission rates for open odour sources during summer conditions for the Planning Scenarios were
defined through the use of geometric mean area odour emission rates measured during collected
during the 2005 odour survey.
Emission rates from the OCU plant in the Planning Scenarios were defined through measurements
conducted in 2005, or design emission rates where plant were not yet constructed or were due
to be modified (Sludge Import OCU, East Side OCU and West Side OCU; Sludge Thickening OCU
post extension).

page 21 of 44
Realised Extension:
Emission rates for open sources during summer conditions in the Realised Extension have been defined
through the use geometric mean area odour emission rates measured during the 2003, 2005, 2008, and
2013 odour measurement surveys.
Emissions form the AS plant have been calculated as a geometric average across all data
collected during the 2013 survey. On the basis that there is no reason for the any change in
offensiveness from existing ASP, emissions from the Banks A to D have been reduced by 50% to
reflect hedonic tone measurement data collected during previous surveys.
Emission rates from the OCU plant are derived from measurements during the 2013 measurement
survey.
6.3 Review of emission estimates applied
6.3.1 Emission estimates for open sources
A comparison of emission estimates used for the Planning and Updated Scenarios for open sources are
presented in Table 8 below:
Table 7: Estimated emission rates from open odour sources
Stage of treatment Source Estimated odour emission rate
(ouE/m2/s)
Planning Baseline Planning Extension Realised Extension
Preliminary treatment Inlet flues 15 15 15
Pre aeration tanks 13 - -
Storm water handling
Storm tank 1 1 2.2
Storm channel 8 8 10
Storm hopper 7 7 11
Primary settlement Circular PST dist. chambers 88 88 88
PST rectangular 3 - -
PST circular 4 4 1.7
Secondary treatment East ASP 1.4* 1.4* 1.6*
West ASP 1.2* 1.2* 1.2*
SAS channels 16 16 16
Bank E ASP Anoxic zones - 5 11
Bank E ASP Aerated zones - 1.2 1.7
* Includes a 50% reduction factor applied to the emission factor for the activated sludge plant to account for hedonic tone adjustment.
Table 8 shows that estimated emissions from the majority of area sources are broadly comparable
between the 2005 data used in the planning phase and the broader data set used in the Realised
Extension Scenario. In the main the changes observed are reflective of data collected across a wider
range of samples and are considered to be more representative of average conditions onsite.
The emission rate from Bank E anoxic zones in the Realised Extension demonstrate an increase compared
to those predicted in the planning scenarios. This increase is associated with the scum covered section of
the anoxic zones, which demonstrated higher emission rates than the parts of the anoxic zones which did
not contain scum. During the 2013 survey emission rates from the non-scum covered section of the
anoxic zones were comparable to those predicted at planning.

page 22 of 44
6.3.2 Emission rates from Odour Control Units
A comparison of emission estimates used for the Planning and Realised Extension Scenarios for the Odour
Control Units are presented in Table 9 below:
Table 8: Estimated emission rates from stack odour sources
Stage of
treatment Odour source Emission Rate (ouE/s)
Planning Baseline Planning Extension Realised Extension
Preliminary and
primarty
treatment
Inlet pumping station OCU 846 846 9,504
New East Side inlet OCU 41,667 41,667 73,958
New West Side inlet OCU 2,889 2,889 8,161
OCU 11 - 11,258 9,647
Sludge
processing Sludge import OCU 662 - 44
Sludge transfer OCU 199 199 121
Pasteurisation OCU 1,562 1,562 -
Sludge thickening OCU 3,906 4,418 20,044
OCU 12 - 2,823 517
Review of the table indicates that the two new odour control plant, OCU11 and OCU12 are currently
achieving a level of treatment that exceeds their design parameters. Emissions that were anticipated to
be treated by the Pasteurisation OCU have been directed to OCU12 and therefore eliminated. The Sludge
Import OCU was due to be decommissioned but this now serves the sludge screening skips and continues
to be active, albeit with a very low emission rate.
However, the odour emission rates of treated air from the majority of OCUs are seen to increase
compared to the estimates defined during the planning application. In the case of the East Side and West
Side OCU’s, and the Sludge Thickening OCU, the increase in emissions is likely to be due to the
performance of the carbon contained in the units, which is understood to be nearing in the end of its
operational life. The current odour reduction performance of the Inlet PS OCU requires confirmation
following recent hydrogen sulphide monitoring observations that may be indicative of an improvement
its performance.
page 23 of 44
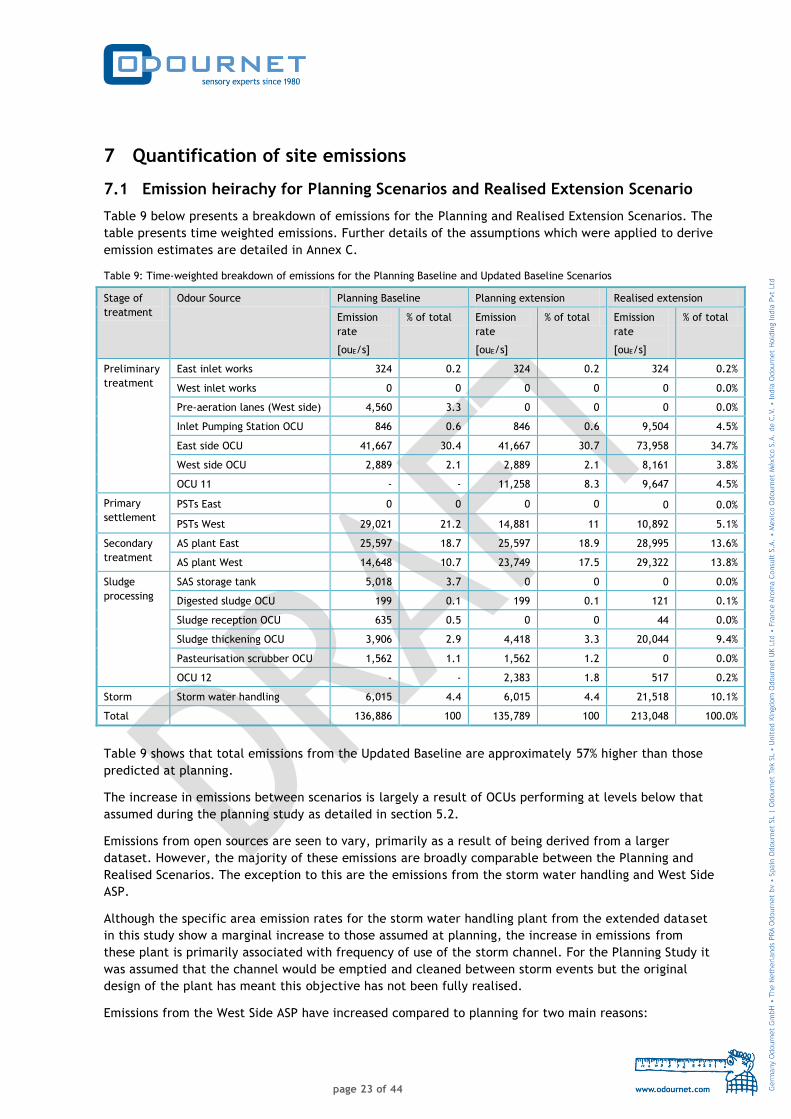
7 Quantification of site emissions
7.1 Emission heirachy for Planning Scenarios and Realised Extension Scenario
Table 9 below presents a breakdown of emissions for the Planning and Realised Extension Scenarios. The
table presents time weighted emissions. Further details of the assumptions which were applied to derive
emission estimates are detailed in Annex C.
Table 9: Time-weighted breakdown of emissions for the Planning Baseline and Updated Baseline Scenarios
Stage of
treatment
Odour Source Planning Baseline Planning extension Realised extension
Emission
rate
[ouE/s]
% of total Emission
rate
[ouE/s]
% of total Emission
rate
[ouE/s]
% of total
Preliminary
treatment
East inlet works 324 0.2 324 0.2 324 0.2%
West inlet works 0 0 0 0 0 0.0%
Pre-aeration lanes (West side) 4,560 3.3 0 0 0 0.0%
Inlet Pumping Station OCU 846 0.6 846 0.6 9,504 4.5%
East side OCU 41,667 30.4 41,667 30.7 73,958 34.7%
West side OCU 2,889 2.1 2,889 2.1 8,161 3.8%
OCU 11 - - 11,258 8.3 9,647 4.5%
Primary
settlement
PSTs East 0 0 0 0 0 0.0%
PSTs West 29,021 21.2 14,881 11 10,892 5.1%
Secondary
treatment
AS plant East 25,597 18.7 25,597 18.9 28,995 13.6%
AS plant West 14,648 10.7 23,749 17.5 29,322 13.8%
Sludge
processing
SAS storage tank 5,018 3.7 0 0 0 0.0%
Digested sludge OCU 199 0.1 199 0.1 121 0.1%
Sludge reception OCU 635 0.5 0 0 44 0.0%
Sludge thickening OCU 3,906 2.9 4,418 3.3 20,044 9.4%
Pasteurisation scrubber OCU 1,562 1.1 1,562 1.2 0 0.0%
OCU 12 - - 2,383 1.8 517 0.2%
Storm Storm water handling 6,015 4.4 6,015 4.4 21,518 10.1%
Total 136,886 100 135,789 100 213,048 100.0%
Table 9 shows that total emissions from the Updated Baseline are approximately 57% higher than those
predicted at planning.
The increase in emissions between scenarios is largely a result of OCUs performing at levels below that
assumed during the planning study as detailed in section 5.2.
Emissions from open sources are seen to vary, primarily as a result of being derived from a larger
dataset. However, the majority of these emissions are broadly comparable between the Planning and
Realised Scenarios. The exception to this are the emissions from the storm water handling and West Side
ASP.
Although the specific area emission rates for the storm water handling plant from the extended dataset
in this study show a marginal increase to those assumed at planning, the increase in emissions from
these plant is primarily associated with frequency of use of the storm channel. For the Planning Study it
was assumed that the channel would be emptied and cleaned between storm events but the original
design of the plant has meant this objective has not been fully realised.
Emissions from the West Side ASP have increased compared to planning for two main reasons:

page 24 of 44
Emissions from the anoxic zones of ASP Bank E are elevated when compared to those predicted
at planning. This increase is associated with the elevated emissions monitored from the scum
covered sections of the plant. It is understood that a spray based scum suppression system is
planned to be installed and this is anticipated to result in emissions from this aspect of the
works reducing to levels similar to those predicted for the Planning Scenario.
Emissions from the aerobic section of ASP Bank E are marginally higher than those predicted at
planning, but within the range expected for this type of plant. Hedonic tone analysis of the
emissions demonstrated that odour generated from this process were comparable in
offensiveness to other plant onsite. This is an unexpected result and based on a relatively small
dataset.
The study highlights that a number of improvements are required at the works if the odour emissions
from the site are to be reduced to the level predicted during the planning application. The
recommended improvements are summarised as follows:
Replace the carbon in the East Side, West Side and Sludge Thickening OCUs.
Confirm if the odour reduction performance of the Inlet PS OCU has improved to previous levels,
as inferred by the improvement demonstrated by routine hydrogen sulphide monitoring.
Install a scum suppression system in the anoxic zone of Bank E to eliminate scum formation.
Review the operational procedures around the storm channels to reduce retention of storm
water in between storm events.

page 25 of 44
8 Summary of findings
The key findings of the survey are as follows:
1. The survey indicated that the odour emissions rates measured from the majority of open
elements of the works were broadly comparable to those measured during the previous survey
and estimated during the planning application, within the variance expected for an operational
sewage works. The survey also indicates that the new odour control systems installed as part of
the extension are all performing well, with measured emission rates below that specified during
their design.
2. However, elevated emission rates above that predicted during the planning application were
measured from a number of the existing odour control systems (Eastside OCU, Westside OCU,
Inlet PS OCU and the Sludge thickening OCU); from the storm water handling operations, and the
new Bank E aeration plant. As a result, the total emissions estimated from the Realised
Extension Scenario are 213,000 ouE/s expressed as a summer time weighted average. This
represents a 57% increase in emissions compared to those presented at planning. The cause of
these increases in emissions are explained below:
The concentration of residual odours released from the Eastside OCU, Westside OCU,
Inlet PS OCU and Sludge Thickening OCU are currently above that predicted at planning.
The elevation in emission rates measured from the East Side, West Side OCU, and Sludge
Thickening OCU are likely to be due to reduced performance of the carbon stage of the
treatment systems which is likely to be coming to the end of its life.
The performance of the Inlet PS OCU appears to have reduced significantly since the
previous survey. This correlates with elevated hydrogen sulphide levels measured from
Thames Water's in-stack monitors during the time of the survey. However, ongoing
monitoring undertaken by Thames Water indicates that the hydrogen sulphide
abatement efficiency of the system improved to levels previously monitored since the
odour monitoring was undertaken.
Emissions from the channels serving the storm tanks are higher than anticipated as a
result of retention of storm water in the channels in between storm events.
Emissions from the anoxic zones of ASP Bank E are higher than anticipated due to the
accumulation of odorous scum.
Emissions from the aerobic section of ASP Bank E are marginally higher than predicted at
planning and on the basis of relatively limited hedonic tone data do not appear to
demonstrate the same characteristics in terms of reduced offensiveness of the existing
AS plant.
3. The study highlights that a number of improvements are recommended to reduce odour emission
levels from the works. The recommended improvements are summarised as follows:
Replace the carbon in the East Side, West Side and Sludge Thickening OCU.
Confirm that the current odour abatement performance of the Inlet PS OCU has
improved to levels indicated by recent hydrogen sulphide monitoring data.
Install a scum suppression system in the anoxic zone of Bank E to eliminate scum
formation.
Review the operational procedures around the storm channels to reduce retention of
storm water in between storm events.

page 26 of 44
If these improvements are implemented then total odour emissions from the site are
likely to be reduced to levels comparable to those predicted during the planning
application.

page 27 of 44
Annex A Odour sampling programme
Table 10: Sample locations and number for olfactometry and trace gas testing
Stage of treatment
process
Process/odour source Sample location Number of sample
sets (based on
triplicate samples
per set)
Preliminary treatment Pumping station OCU Inlet (untreated) air stream 1
Outlet (treated) air stream 1
West-side OCU Inlet (untreated) airstream 1
Intermediate stage airstream 1
Outlet (treated) airstream 1
East-side OCU Inlet (untreated) airstream 2
Intermediate stage airstream 2
Outlet (treated) airstream 1
OCU 11 Inlet (untreated) airstream 1&2 Not accessible
Intermediate airstream1&2 1
Outlet (treated) airstream 1
Storm Storm tanks Storm water inlet channel 1
Storm tank hopper 1
Storm tank (retained sediment) 1
Primary treatment Primary settlement tanks (West) Surface of circular PST 1
Secondary treatment New activated sludge plant Surface of anoxic zone scum present 1
Surface of anoxic zone no scum 1
Surface of activated sludge tank 3
Activated sludge plant
(beginning, middle, end)
Surface of tank (East side) 3
Surface of tank (West side) 3
Mixed liquor channel 1
Sludge handling
treatment
RSHT/Sludge thickening building
OCU
Inlet (untreated) airstream 1
Intermediate stage airstream 1
Outlet (treated) airstream 1
Imported sludge reception OCU
(ambient conditions)
Inlet (untreated) airstream 1
Outlet (treated) airstream 1
Imported sludge reception OCU
(during sludge import)
Inlet (untreated) airstream 1
Outlet (treated) airstream 1
OCU12 Inlet (untreated) airstream 2
Intermediate stage airstream 3
Outlet *treated) airstream 1
Sludge transfer area OCU Inlet (untreated) air stream 1
Intermediate stage airstream 1
Outlet (treated) air stream 1
Digesters Biogas 1
Total 50

page 28 of 44
Table 11: Sample locations and number for hedonic tone analysis
Stage of treatment
process
Process/odour source Sample location Number of sample
sets
Storm storage Storm channel Surface of tank 1
Preliminary treatment Preliminary OCU outlet OCU 11 outlet 1
Primary treatment Primary tanks Surface of tank 1
Secondary treatment ASP plant Surface of aerobic stage of tank 1
Extension ASP plant Surface of aerobic stage of tank 1
Surface anoxic zone 1
Sludge processing Sludge processing OCU outlet Sludge Thickening OCU outlet 1
Total 7

page 29 of 44
Annex B Odour measurements data

page 30 of 44
B.1 Odour measurement data from 2013
Table 12: Odour measuremt data from open area sources 2013
Odour source
Date
Area odour emission rate [ouE/m2/s]
Mean Sample 1 Sample 2 Sample 3
Empty storm tank hopper 02/10/2013 112.4 108 104.5 125.8
Surface of circular PST (WS) 25/09/2013 18.8 21.6 17.9 17.2
Surface of circular PST (WS) 25/09/2013 3.8 6.2 3.3 2.7
Surface of AS plant (ES) 26/09/2013 66.4 70.5 73.9 56.3
Surface of AS plant (ES) 26/09/2013 0.5 0.6 0.5 0.5
Surface of AS plant (ES) 26/09/2013 0.9 1.4 0.7 0.7
Anoxic zone lane 25 (no scum) 23/09/2013 3.3 5.5 2.5 2.6
ASP bank E lane 24 middle 23/09/2013 0.5 0.5 0.6 0.6
ASP Bank E Anoxic Lane 23 - scum covered 23/09/2013 37.1 29.2 44.7 39.1
ASP bank E lane 24 start 23/09/2013 15.2 9.6 22.3 16.5
ASP bank E lane 24 end 23/09/2013 0.6 0.7 0.5 0.5
ASP bank D lane 20 middle 24/09/2013 0.6 0.7 0.6 0.6
ASP bank D lane 20 start 24/09/2013 37.9 31.9 36.4 47.1
ASP bank D lane 20 end 24/09/2013 0.6 0.5 0.6 0.7
Bank D Mixed liquors 24/09/2013 31.4 23.9 37.8 34.4
Storm sediment 02/10/2013 0.03 <0.03 0.03 0.05
Table 13: Hydrogen sulphide measuremt data from open area sources 2013
Odour Source Date Area hydrogen sulphide emission rate [µg/m2/s]
Geomean Sample 1 Sample 2 Sample 3
Storm channel 02/10/2013 55.6 61.5 59.8 45.6
Storm hopper 02/10/2013 40.0 55.5 30.9 33.9
Surface of circular PST (WS) 25/09/2013 10.5 12.5 11.0 9.0
Surface of circular PST (WS) 25/09/2013 1.5 1.9 1.3 1.3
ASP lane 1 bank A start 26/09/2013 2.4 2.5 2.4 2.4
ASP lane 1 bank A end 26/09/2013 0.02 0.02 0.02 0.02
ASP lane 1 bank A middle 26/09/2013 0.01 0.01 0.01 0.01
Anoxic zone lane 25 (no scum) 23/09/2013 0.08 0.08 0.08 0.08
ASP bank E lane 24 middle 23/09/2013 0.02 0.02 0.02 0.01
ASP bank E anoxic lane 23 - scum covered 23/09/2013 1.7 1.7 2.0 1.6
ASP bank E lane 24 start 23/09/2013 0.3 0.4 0.4 0.2
ASP bank E lane 24 end 23/09/2013 0.02 0.021 0.021 0.02
ASP bank D lane 20 middle 24/09/2013 0.04 0.030 0.048 0.04
ASP bank D lane 20 start 24/09/2013 1.3 1.2 1.4 1.4
ASP bank D lane 20 end 24/09/2013 0.04 0.04 0.04 0.04
Bank D mixed liquors 24/09/2013 2.7 2.4 2.8 2.8
Storm sediment 02/10/2013 0.03 <0.03 0.03 0.05
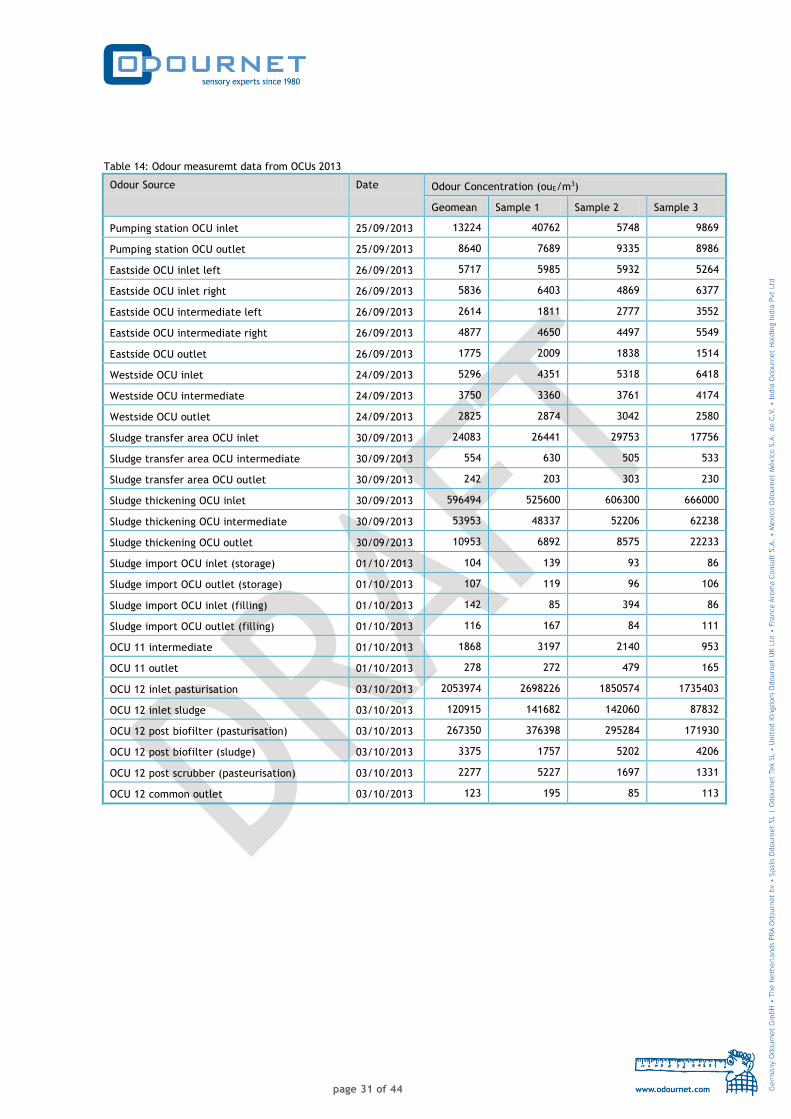
page 31 of 44
Table 14: Odour measuremt data from OCUs 2013
Odour Source Date Odour Concentration (ouE/m3)
Geomean Sample 1 Sample 2 Sample 3
Pumping station OCU inlet 25/09/2013 13224 40762 5748 9869
Pumping station OCU outlet 25/09/2013 8640 7689 9335 8986
Eastside OCU inlet left 26/09/2013 5717 5985 5932 5264
Eastside OCU inlet right 26/09/2013 5836 6403 4869 6377
Eastside OCU intermediate left 26/09/2013 2614 1811 2777 3552
Eastside OCU intermediate right 26/09/2013 4877 4650 4497 5549
Eastside OCU outlet 26/09/2013 1775 2009 1838 1514
Westside OCU inlet 24/09/2013 5296 4351 5318 6418
Westside OCU intermediate 24/09/2013 3750 3360 3761 4174
Westside OCU outlet 24/09/2013 2825 2874 3042 2580
Sludge transfer area OCU inlet 30/09/2013 24083 26441 29753 17756
Sludge transfer area OCU intermediate 30/09/2013 554 630 505 533
Sludge transfer area OCU outlet 30/09/2013 242 203 303 230
Sludge thickening OCU inlet 30/09/2013 596494 525600 606300 666000
Sludge thickening OCU intermediate 30/09/2013 53953 48337 52206 62238
Sludge thickening OCU outlet 30/09/2013 10953 6892 8575 22233
Sludge import OCU inlet (storage) 01/10/2013 104 139 93 86
Sludge import OCU outlet (storage) 01/10/2013 107 119 96 106
Sludge import OCU inlet (filling) 01/10/2013 142 85 394 86
Sludge import OCU outlet (filling) 01/10/2013 116 167 84 111
OCU 11 intermediate 01/10/2013 1868 3197 2140 953
OCU 11 outlet 01/10/2013 278 272 479 165
OCU 12 inlet pasturisation 03/10/2013 2053974 2698226 1850574 1735403
OCU 12 inlet sludge 03/10/2013 120915 141682 142060 87832
OCU 12 post biofilter (pasturisation) 03/10/2013 267350 376398 295284 171930
OCU 12 post biofilter (sludge) 03/10/2013 3375 1757 5202 4206
OCU 12 post scrubber (pasteurisation) 03/10/2013 2277 5227 1697 1331
OCU 12 common outlet 03/10/2013 123 195 85 113

page 32 of 44
Table 15: Hydrogen sulphide measuremt data from from OCUs 2013
Odour Source Date
H2S concentration [µg/m3]
Mean Sample 1 Sample 2 Sample 3
Pumping station OCU inlet 25/09/2013 5907 6070 5620 6202
Pumping station OCU outlet 25/09/2013 1310 1370 1340 1240
Eastside OCU inlet left 26/09/2013 2020 1802 1900 2350
Eastside OCU inlet right 26/09/2013 2150 1820 2130 2500
Eastside OCU intermediate left 26/09/2013 470 430 410 580
Eastside OCU intermediate right 26/09/2013 1370 1050 1380 1670
Eastside OCU outlet 26/09/2013 <5 <5 <5 <5
Westside OCU inlet 24/09/2013 1520 1310 1750 1500
Westside OCU intermediate 24/09/2013 2200 1970 2280 2350
Westside OCU outlet 24/09/2013 1160 1050 1260 1150
Sludge transfer area OCU Inlet 30/09/2013 14900 14700 15600 14300
Sludge transfer area OCU Intermediate 30/09/2013 40 40 40 50
Sludge transfer area OCU Outlet 30/09/2013 180 180 180 170
Sludge thickening OCU Inlet 30/09/2013 342000 304000 304000 417000
Sludge thickening OCU Intermediate 30/09/2013 35700 28900 31900 46300
Sludge thickening OCU Outlet 30/09/2013 4500 3040 3790 6680
Sludge import OCU inlet (storage) 01/10/2013 8 7 14 5
Sludge import OCU outlet (storage) 01/10/2013 83 76 61 114
Sludge import OCU inlet (filling) 01/10/2013 27 14 55 12
Sludge import OCU outlet (filling) 01/10/2013 54 47 112 <5
OCU 11 Intermediate 01/10/2013 226 304 243 131
OCU 11 Outlet 01/10/2013 72 67 59 90
OCU 12 Inlet Pasturisation 03/10/2013 67300 88000 60700 53100
OCU 12 Inlet Sludge 03/10/2013 68600 61800 75800 68200
OCU 12 Post Biofilter (Pasturisation) 03/10/2013 16200 22800 18100 7590
OCU 12 Post Biofilter (Sludge) 03/10/2013 559 653 577 448
OCU 12 Post Scrubber (Pasteurisation) 03/10/2013 2270 4330 1280 1210
OCU 12 Common Outlet 03/10/2013 -* -* -* -*
*An accurate hydorgen sulphide concentration could not be determiend due to cross interference of other pollutants in the airstream (SO2).
page 33 of 44
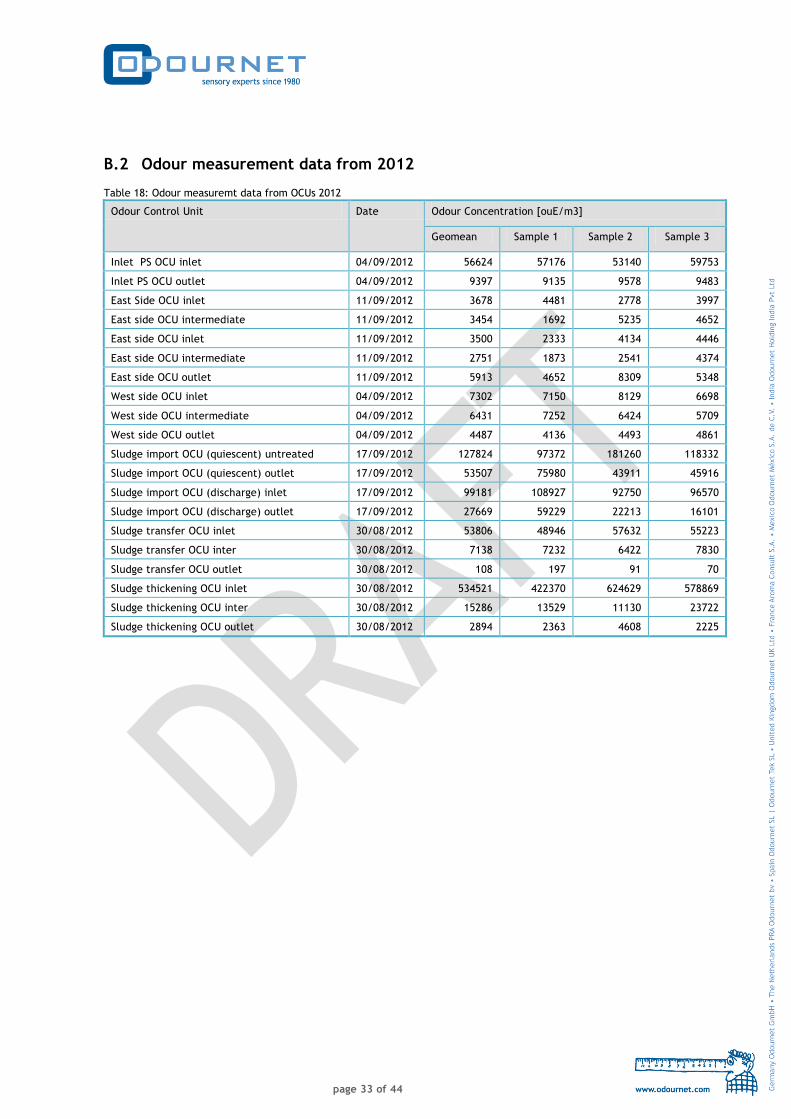
B.2 Odour measurement data from 2012
Table 18: Odour measuremt data from OCUs 2012
Odour Control Unit Date Odour Concentration [ouE/m3]
Geomean Sample 1 Sample 2 Sample 3
Inlet PS OCU inlet 04/09/2012 56624 57176 53140 59753
Inlet PS OCU outlet 04/09/2012 9397 9135 9578 9483
East Side OCU inlet 11/09/2012 3678 4481 2778 3997
East side OCU intermediate 11/09/2012 3454 1692 5235 4652
East side OCU inlet 11/09/2012 3500 2333 4134 4446
East side OCU intermediate 11/09/2012 2751 1873 2541 4374
East side OCU outlet 11/09/2012 5913 4652 8309 5348
West side OCU inlet 04/09/2012 7302 7150 8129 6698
West side OCU intermediate 04/09/2012 6431 7252 6424 5709
West side OCU outlet 04/09/2012 4487 4136 4493 4861
Sludge import OCU (quiescent) untreated 17/09/2012 127824 97372 181260 118332
Sludge import OCU (quiescent) outlet 17/09/2012 53507 75980 43911 45916
Sludge import OCU (discharge) inlet 17/09/2012 99181 108927 92750 96570
Sludge import OCU (discharge) outlet 17/09/2012 27669 59229 22213 16101
Sludge transfer OCU inlet 30/08/2012 53806 48946 57632 55223
Sludge transfer OCU inter 30/08/2012 7138 7232 6422 7830
Sludge transfer OCU outlet 30/08/2012 108 197 91 70
Sludge thickening OCU inlet 30/08/2012 534521 422370 624629 578869
Sludge thickening OCU inter 30/08/2012 15286 13529 11130 23722
Sludge thickening OCU outlet 30/08/2012 2894 2363 4608 2225

page 34 of 44
Table 19: Hydrogen sulphide measuremt data from from OCUs 2012
Odour Control Unit Date Hydrogen sulphide concentration [µg/m3]
Mean Sample 1 Sample 2 Sample 3
Inlet PS OCU inlet 04/09/2012 3190 3040 3190 3490
Inlet PS OCU outlet 04/09/2012 410 410 410 440
East Side OCU inlet 11/09/2012 30 30 15 30
East side OCU intermediate 11/09/2012 30 15 30 30
East side OCU inlet 11/09/2012 76 30 30 167
East side OCU intermediate 11/09/2012 46 30 30 61
East side OCU outlet 11/09/2012 30 30 30 30
West side OCU inlet 04/09/2012 3950 4250 3640 4250
West side OCU intermediate 04/09/2012 3640 3190 3640 3950
West side OCU outlet 04/09/2012 1460 1380 1440 1520
Sludge import OCU (quiescent) untreated 17/09/2012 5010 6530 4710 3950
Sludge import OCU (quiescent) outlet 17/09/2012 15 30 15 15
Sludge import OCU (discharge) inlet 17/09/2012 4860 4860 - -
Sludge import OCU (discharge) outlet 17/09/2012 15 15 - -
Sludge transfer OCU inlet 30/08/2012 15200 15200 15200 15200
Sludge transfer OCU inter 30/08/2012 455 516 455 410
Sludge transfer OCU outlet 30/08/2012 <8 <8 9 <8
Sludge thickening OCU inlet 30/08/2012 164000 152000 167000 175000
Sludge thickening OCU inter 30/08/2012 5160 6830 6450 2130
Sludge thickening OCU outlet 30/08/2012 46 46 30 61
page 35 of 44
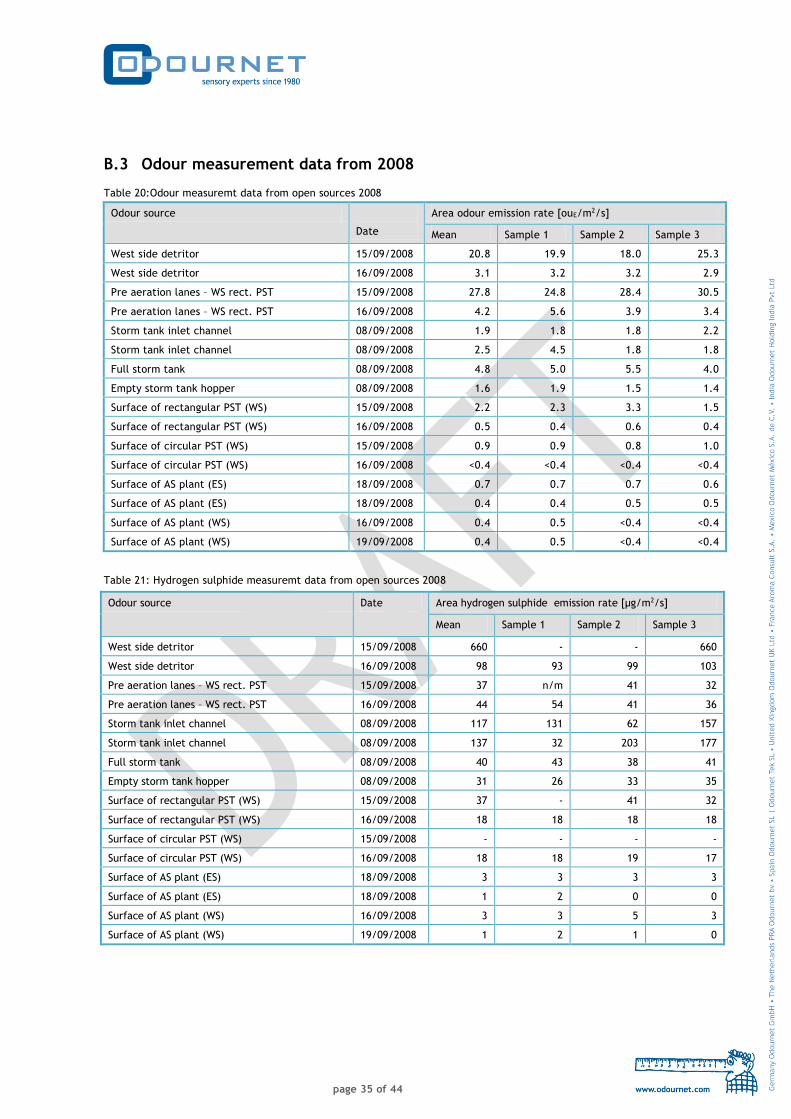
B.3 Odour measurement data from 2008
Table 20:Odour measuremt data from open sources 2008
Odour source
Date
Area odour emission rate [ouE/m2/s]
Mean Sample 1 Sample 2 Sample 3
West side detritor 15/09/2008 20.8 19.9 18.0 25.3
West side detritor 16/09/2008 3.1 3.2 3.2 2.9
Pre aeration lanes – WS rect. PST 15/09/2008 27.8 24.8 28.4 30.5
Pre aeration lanes – WS rect. PST 16/09/2008 4.2 5.6 3.9 3.4
Storm tank inlet channel 08/09/2008 1.9 1.8 1.8 2.2
Storm tank inlet channel 08/09/2008 2.5 4.5 1.8 1.8
Full storm tank 08/09/2008 4.8 5.0 5.5 4.0
Empty storm tank hopper 08/09/2008 1.6 1.9 1.5 1.4
Surface of rectangular PST (WS) 15/09/2008 2.2 2.3 3.3 1.5
Surface of rectangular PST (WS) 16/09/2008 0.5 0.4 0.6 0.4
Surface of circular PST (WS) 15/09/2008 0.9 0.9 0.8 1.0
Surface of circular PST (WS) 16/09/2008 <0.4 <0.4 <0.4 <0.4
Surface of AS plant (ES) 18/09/2008 0.7 0.7 0.7 0.6
Surface of AS plant (ES) 18/09/2008 0.4 0.4 0.5 0.5
Surface of AS plant (WS) 16/09/2008 0.4 0.5 <0.4 <0.4
Surface of AS plant (WS) 19/09/2008 0.4 0.5 <0.4 <0.4
Table 21: Hydrogen sulphide measuremt data from open sources 2008
Odour source Date Area hydrogen sulphide emission rate [µg/m2/s]
Mean Sample 1 Sample 2 Sample 3
West side detritor 15/09/2008 660 - - 660
West side detritor 16/09/2008 98 93 99 103
Pre aeration lanes – WS rect. PST 15/09/2008 37 n/m 41 32
Pre aeration lanes – WS rect. PST 16/09/2008 44 54 41 36
Storm tank inlet channel 08/09/2008 117 131 62 157
Storm tank inlet channel 08/09/2008 137 32 203 177
Full storm tank 08/09/2008 40 43 38 41
Empty storm tank hopper 08/09/2008 31 26 33 35
Surface of rectangular PST (WS) 15/09/2008 37 - 41 32
Surface of rectangular PST (WS) 16/09/2008 18 18 18 18
Surface of circular PST (WS) 15/09/2008 - - - -
Surface of circular PST (WS) 16/09/2008 18 18 19 17
Surface of AS plant (ES) 18/09/2008 3 3 3 3
Surface of AS plant (ES) 18/09/2008 1 2 0 0
Surface of AS plant (WS) 16/09/2008 3 3 5 3
Surface of AS plant (WS) 19/09/2008 1 2 1 0

page 36 of 44
Table 22: Odour measuremt data from OCUs 2008
Control unit Date Odour concentration [ouE/m3]
Mean Sample 1 Sample 2 Sample 3
Digested sludge transfer OCU inlet 09/09/2008 8107 7961 7592 8817
Digested sludge transfer OCU intermediate 09/09/2008 727 940 724 564
Digested sludge transfer OCU outlet 09/09/2008 542 559 698 409
Main inlet pumping station OCU (ES) inlet 15/09/2008 7451 7193 6170 9320
Main inlet pumping station OCU (ES) outlet 15/09/2008 <64 <64 <64 <64
Sludge reception OCU (normal operations) inlet 09/09/2008 29078 41345 27708 21461
Sludge reception OCU (normal operations) outlet 09/09/2008 1072 1031 1729 691
Sludge reception OCU (sludge delivery ops) inlet 09/09/2008 133121 133285 117425 150731
Sludge reception OCU (sludge delivery ops) outlet 09/09/2008 943 632 985 1348
Sludge thickening OCU inlet 30/09/2008 387143 333848 320359 542535
Sludge thickening OCU intermediate 30/09/2008 7425 8748 6507 7191
Sludge thickening OCU outlet 30/09/2008 11666 12686 9358 13375
East side OCU inlet stream 1 18/09/2008 2503 2457 2345 2722
East side OCU intermediate stream 1 18/09/2008 295 132 257 758
East side OCU combined outlet 18/09/2008 194 191 154 247
East side OCU inlet stream 2 18/09/2008 3578 3013 6170 2464
East side OCU intermediate stream 2 18/09/2008 197 541 91 155
Table 23: Hydrogen sulphide measuremt data from OCUs 2008
Control unit Date Hydrogen sulphide concentration [µg/m3]
Mean Sample 1 Sample 2 Sample 3
Digested sludge transfer OCU inlet 09/09/2008 1090 923 1190 1190
Digested sludge transfer OCU intermediate 09/09/2008 15 12 20 13
Digested sludge transfer OCU outlet 09/09/2008 9 8 9 9
Main Inlet Pumping station OCU (ES) inlet 15/09/2008 - - - -
Main Inlet Pumping station OCU (ES) outlet 15/09/2008 - - - -
Sludge reception OCU (normal operations) inlet 09/09/2008 6310 7070 6150 5700
Sludge reception OCU (normal operations) outlet 09/09/2008 137 32 203 177
Sludge reception OCU (sludge delivery ops) inlet 09/09/2008 28400 15700 32700 36700
Sludge reception OCU (sludge delivery ops) outlet 09/09/2008 139 62 100 255
Sludge thickening OCU inlet 30/09/2008 89500 85100 91700 91700
Sludge thickening OCU intermediate 30/09/2008 720 674 707 779
Sludge thickening OCU outlet 30/09/2008 556 576 570 524
East side OCU inlet stream 1 18/09/2008 279 275 301 262
East side OCU intermediate stream 1 18/09/2008 24 29 18 25
East side OCU combined outlet 18/09/2008 - - - -
East side OCU inlet stream 2 18/09/2008 773 871 831 615
East side OCU intermediate stream 2 18/09/2008 31 34 31 29

page 37 of 44
B.4 Odour measurement data from 2005
Table 24: Odour measuremt data from open sources 2005
Odour source Date Area odour emission rate [ouE/m2/s]
Mean Sample 1 Sample 2 Sample 3
East Side grit channels 15/09/2005 6.9 8.5 4.3 9.1
East Side grit channels 20/09/2005 14.6 11.1 15.7 17.8
West Side detritors 14/09/2005 10.5 10.0 11.2 10.2
West Side detritors 21/09/2005 20.5 13.2 31.7 20.7
Pre aeration lane - WS circular PST 14/09/2005 7.7 6.3 8.9 8.1
Pre aeration lanes – WS rect. PST 14/09/2005 12.5 11.6 15.2 11.0
Grit collection skip 13/09/2005 34.0 41.2 30.2 31.5
Storm water inlet channel 12/09/2005 7.7 11.8 7.4 5.3
Storm tank hopper 12/09/2005 7.0 7.3 10.2 4.6
Storm tank when full 20/10/2005 1.0 1.0 1.0 1.1
Surface of PST (ES) 15/09/2005 7.8 7.1 9.5 7.1
Surface of PST (ES) 20/09/2005 4.1 5.5 3.3 3.8
Secondary settlement tank (ES) 15/09/2005 15.8 14.8 15.9 16.7
Secondary settlement tank (ES) 20/09/2005 4.8 5.2 4.1 5.2
Surface of rectangular PST (WS) 14/09/2005 3.9 6.4 1.7 5.5
Surface of rectangular PST (WS) 21/09/2005 2.8 2.6 4.3 2.1
Surface of circular PST (WS) 14/09/2005 2.8 3.1 2.6 2.8
Surface of circular PST (WS) 21/09/2005 4.4 5.3 4.5 3.5
Surface of AS plant (ES) 15/09/2005 2.8 3.8 2.3 2.5
Surface of AS plant (WS) 14/09/2005 2.5 2.3 2.3 2.9
SAS storage tank 12/09/2005 16.3 15.1 16.2 17.6
Table 25: Hydrogen sulphide measuremt data from open sources 2005
Odour source Date Area hydrogen sulphide emission rate [µg/m2/s]
Mean Sample 1 Sample 2 Sample 3
East Side grit channels 15/09/2005 0.3 0.1 0.2 0.6
East Side grit channels 20/09/2005 0.6 1.4 0.2 0.2
West Side detritors 14/09/2005 0.2 0.2 0.1 0.2
West Side detritors 21/09/2005 0.2 0.3 0.2 0.2
Pre aeration lane - WS circular PST 14/09/2005 0 0 0 0
Pre aeration lanes – WS rect. PST 14/09/2005 0.1 0.1 0.1 0.2
Grit collection skip 13/09/2005 0.1 0.1 0.1 0
Storm water inlet channel 12/09/2005 2.1 2.4 2.4 1.5
Storm tank hopper 12/09/2005 0.4 0.6 0.3 0.3
Storm tank when full 20/10/2005 0 0 0 0
Surface of PST (ES) 15/09/2005 0.6 0.1 0.6 0.9
Surface of PST (ES) 20/09/2005 0.1 0.1 0.1 0
Secondary settlement tank (ES) 15/09/2005 0.3 0.3 0.3 0.2
Secondary settlement tank (ES) 20/09/2005 0.4 0.5 0.3 0.4
Surface of rectangular PST (WS) 14/09/2005 0.4 0.4 0.4 0.4

page 38 of 44
Surface of rectangular PST (WS) 21/09/2005 0.1 0.1 0.2 0.1
Surface of circular PST (WS) 14/09/2005 0.4 0.5 0.4 0.4
Surface of circular PST (WS) 21/09/2005 0.0001 0.0001 0.0001 0.0001
Surface of AS plant (ES) 15/09/2005 0.0002 0.0002 0.0001 0.0002
Surface of AS plant (WS) 14/09/2005 0.0000 0.0000 0.0000 0.0000
SAS storage tank 12/09/2005 0.0002 0.0002 0.0002 0.0002
Table 26: Odour measuremt data from OCUs 2005
Control unit Date Odour concentration [ouE/m3]
Mean Sample 1 Sample 2 Sample 3
Digested sludge transfer OCU inlet 12/09/2005 57648 64163 54627 54660
Digested sludge transfer OCU outlet 12/09/2005 597 797 436 613
Main Inlet Pumping station OCU (ES) inlet 13/09/2005 37955 42970 40427 31476
Main Inlet Pumping station OCU (ES) outlet 13/09/2005 1038 2321 629 766
Sludge reception OCU (normal ops) inlet 20/09/2005 921355 259007 752148 4014828
Sludge reception OCU (normal ops) outlet 20/09/2005 159889 107136 210143 181554
Sludge reception OCU (sludge delivery) inlet 20/09/2005 2482181 2135008 3371988 2124294
Sludge reception OCU (sludge delivery) outlet 20/09/2005 151128 125528 139731 196789
Sludge thickening OCU inlet 21/09/2005 1254265 2217798 883418 1007116
Sludge thickening OCU outlet 21/09/2005 2421 2289 2410 2573
Pasteurisation chemical scrubber inlet 21/09/2005 14656408 19823140 12917188 12295386
Pasteurisation chemical scrubber outlet 21/09/2005 3005 6643 1983 2060
Table 27: Hydrogen sulphide measuremt data from OCUs 2005
Control unit Date Hydrogen sulphide concentration [µg/m3]
Mean Sample 1 Sample 2 Sample 3
Digested sludge transfer OCU inlet 12/09/2005 2420 3010 2880 1960
Digested sludge transfer OCU outlet 12/09/2005 3 5 1 3
Main inlet pumping station OCU (ES) inlet 13/09/2005 236 196 275 236
Main inlet pumping station OCU (ES) outlet 13/09/2005 1 1 1 1
Sludge reception OCU (normal ops) inlet 20/09/2005 8860 2750 12400 11400
Sludge reception OCU (normal ops) outlet 20/09/2005 476 262 654 510
Sludge reception OCU (sludge delivery) inlet 20/09/2005 8860 9550 8380 8640
Sludge reception OCU (sludge delivery) outlet 20/09/2005 336 380 301 327
Sludge thickening OCU inlet 21/09/2005 50200 53700 48400 48400
Sludge thickening OCU outlet 21/09/2005 336 380 301 327
Pasteurisation chemical scrubber inlet 21/09/2005 292000 328000 328000 219000
Pasteurisation chemical scrubber outlet 21/09/2005 52 52 39 65

page 39 of 44
Annex C Assumptions applied to derive emission estimates
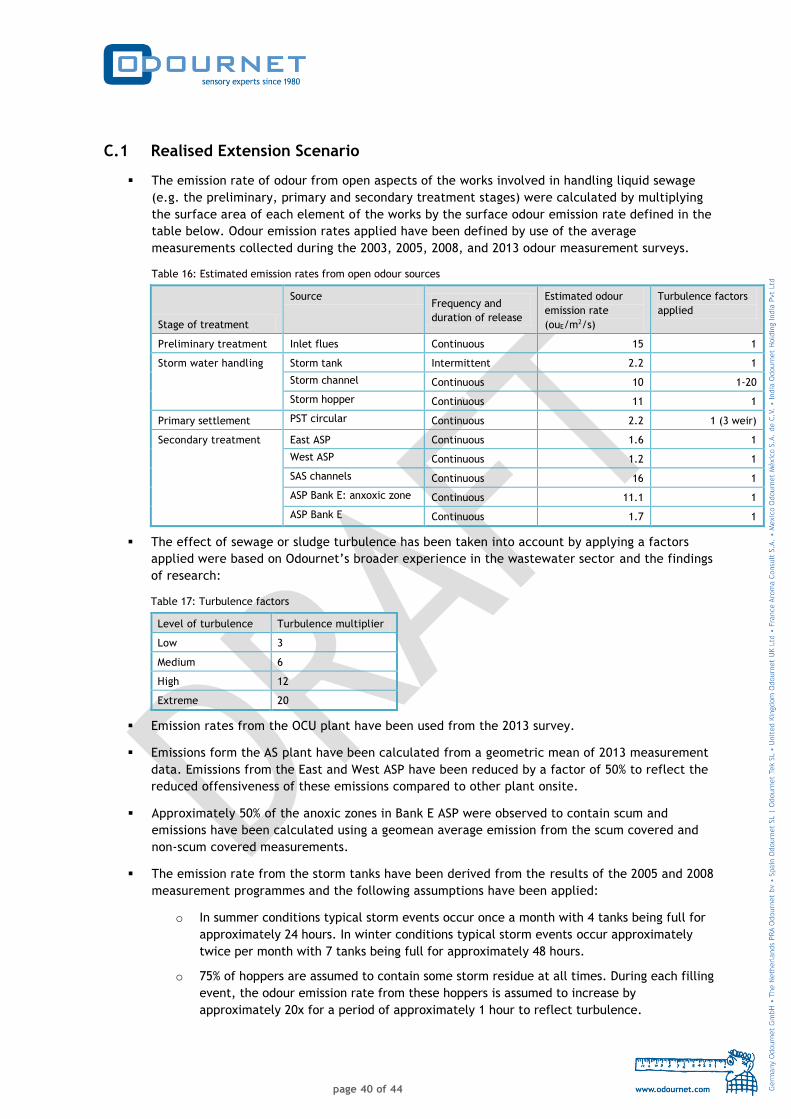
page 40 of 44
C.1 Realised Extension Scenario
The emission rate of odour from open aspects of the works involved in handling liquid sewage
(e.g. the preliminary, primary and secondary treatment stages) were calculated by multiplying
the surface area of each element of the works by the surface odour emission rate defined in the
table below. Odour emission rates applied have been defined by use of the average
measurements collected during the 2003, 2005, 2008, and 2013 odour measurement surveys.
Table 16: Estimated emission rates from open odour sources
Stage of treatment
Source Frequency and
duration of release
Estimated odour
emission rate
(ouE/m2/s)
Turbulence factors
applied
Preliminary treatment Inlet flues Continuous 15 1
Storm water handling
Storm tank Intermittent 2.2 1
Storm channel Continuous 10 1-20
Storm hopper Continuous 11 1
Primary settlement PST circular Continuous 2.2 1 (3 weir)
Secondary treatment East ASP Continuous 1.6 1
West ASP Continuous 1.2 1
SAS channels Continuous 16 1
ASP Bank E: anxoxic zone Continuous 11.1 1
ASP Bank E Continuous 1.7 1
The effect of sewage or sludge turbulence has been taken into account by applying a factors
applied were based on Odournet’s broader experience in the wastewater sector and the findings
of research:
Table 17: Turbulence factors
Level of turbulence Turbulence multiplier
Low 3
Medium 6
High 12
Extreme 20
Emission rates from the OCU plant have been used from the 2013 survey.
Emissions form the AS plant have been calculated from a geometric mean of 2013 measurement
data. Emissions from the East and West ASP have been reduced by a factor of 50% to reflect the
reduced offensiveness of these emissions compared to other plant onsite.
Approximately 50% of the anoxic zones in Bank E ASP were observed to contain scum and
emissions have been calculated using a geomean average emission from the scum covered and
non-scum covered measurements.
The emission rate from the storm tanks have been derived from the results of the 2005 and 2008
measurement programmes and the following assumptions have been applied:
o In summer conditions typical storm events occur once a month with 4 tanks being full for
approximately 24 hours. In winter conditions typical storm events occur approximately
twice per month with 7 tanks being full for approximately 48 hours.
o 75% of hoppers are assumed to contain some storm residue at all times. During each filling
event, the odour emission rate from these hoppers is assumed to increase by
approximately 20x for a period of approximately 1 hour to reflect turbulence.

page 41 of 44
o Storm channels are assumed to contain residual liquors at all times.
The emission rate of odour from enclosed/covered aspects of the operations (inlet lanes of east
side works) were estimated by applying an abatement factor of 50%.
The emission rate of odour from all aspects of the works involved in handling liquid sewage (e.g.
the preliminary and primary treatment stages) were reduced by a factor 5 during autumn/winter
to reflect the reduction in emissions due to lower sewage/ambient temperature and dilution
effects of rainwater. Emissions from odour control units and aspects of the operations involving
handling of sludge, screenings or grit material were assumed to remain constant during summer
and winter conditions.
Emissions from the Final Settlement Tanks (FSTs) have not been considered in the model for any
scenario. Based on Odournet’s experience with odours from STW’s, emissions from such areas
are very unlikely to contribute significantly to off-site impact.

page 42 of 44
C.2 Planning Scenarios
The emission rate of odour from open aspects of the works involved in handling liquid sewage
(e.g. the preliminary, primary and secondary treatment stages) were calculated by multiplying
the surface area of each element of the works by the surface odour emission rate defined in the
table below. Odour emission rates applied have been defined by use of the average
measurements collected during the 2005 odour measurement survey.
Table 18: Estimated emission rates from open odour sources
Stage of treatment
Source Frequency and
duration of release
Estimated odour
emission rate
(ouE/m2/s)
Turbulence factors
applied
Preliminary treatment Inlet flues Continuous 15 1
Storm water handling
Storm tank Intermittent 1 1
Storm channel Continuous 8 1-20
Storm hopper Continuous 7 1
Primary settlement PST circular Continuous 4 1 (3 weir)
Secondary treatment East ASP Continuous 1.4 1
West ASP Continuous 1.2 1
SAS channels Continuous 16 1
ASP Bank E: anxoxic zone Continuous 5 1
ASP Bank E Continuous 1.2 1
The effect of sewage or sludge turbulence has been taken into account by applying a factors
applied were based on Odournet’s broader experience in the wastewater sector and the findings
of research:
Table 19: Turbulence factors
Level of turbulence Turbulence multiplier
Low 3
Medium 6
High 12
Extreme 20
The emission rate from the storm tanks have been derived from the results of the 2005
measurement programme and the following assumptions have been applied:
o In summer conditions typical storm events occur once a month with 4 tanks being full for
approximately 24 hours. In winter conditions typical storm events occur approximately
twice per month with 7 tanks being full for approximately 48 hours.
o 75% of hoppers are assumed to contain some storm residue at all times. During each filling
event, the odour emission rate from these hoppers is assumed to increase by
approximately 20x for a period of approximately 1 hour to reflect turbulence.
o Storm channels are assumed to contain residual liquors at all times.
The emission rate of odour from enclosed/covered aspects of the operations (inlet lanes of east
side works) were estimated by applying an abatement factor of 50%.
The emission rate of odour from all aspects of the works involved in handling liquid sewage (e.g.
the preliminary and primary treatment stages) were reduced by a factor 5 during autumn/winter
to reflect the reduction in emissions due to lower sewage/ambient temperature and dilution

page 43 of 44
effects of rainwater. Emissions from odour control units and aspects of the operations involving
handling of sludge, screenings or grit material were assumed to remain constant during summer
and winter conditions.
Emissions from the Final Settlement Tanks (FSTs) have not been considered in the model for any
scenario. Based on Odournet’s experience with odours from STW’s, emissions from such areas
are very unlikely to contribute significantly to off-site impact.
The emissions from the new odour control system serving the East Side Works were estimated
assuming a design flow rate of 150000 m3/hr and a maximum odour concentration at the point of
release of 1000 ouE/m3.
Emissions from the first fill storm tanks have been reduced to zero to reflect the covering and
odour controlling of this source. Emissions from storm inlet channels have also been reduced to
zero during non-storm events to reflect the reduced emissions resulting from modifications to
allow drain down between events.
The emissions from the new odour control system serving the West Side Works were estimated
assuming a design flow rates of 10400 m3/hr and would achieve a maximum odour concentration
at the point of release of 1000 ouE/m3.
The emissions from the odour control plant serving the sludge reception area were based on
measured flow rates of 2266 and 2384 m3/hr for normal and peak loading conditions
respectively, and a residual odour concentration of 1000 ouE/m3 to reflect optimal performance.
The flow rate from the existing sludge thickening biofilter odour control unit was increased from
5808 to 6570 m3/hr to reflect the increase in extraction to the unit from the new sludge
screens, which is offset by the removal of extraction from the relocated Raw Sludge Holding
Tanks.
The emissions from the new odour control plant serving the West Side were estimated assuming
a design flow rates of 81058 m3/hr (comprising extraction of air from the new west side inlet
works, existing battery D rectangular PSTs including pre-aeration and new rectangular PSTs
including intermediate pumping station and aeration lane mixing chamber) and a residual odour
concentration of 500 ouE/m3.
The use of the SAS storage tank (converted FST) will cease. The emissions from the new sludge
stream odour control unit were estimated assuming a design flow rates of 8580 m 3/hr
(comprising extraction air from the relocated raw sludge holding tanks, pasteurisation plant,
imported sludge holding tank and screens and pasteurised sludge holding tanks) and a residual
odour concentration of 1000 ouE/m3.

Odournet UK LtdTWUL13C_20_draft19 December 2013 page 44 of 44