· letter of transmittal 1: organizational chart 5: roster of officials 6: consultants and...
TRANSCRIPT

BASS RIVER TOWNSHIP SCHOOL DISTRICT
New Gretna, New JerseyCounty of Burlington
COMPREHENSIVE ANNUAL FINANCIAL REPORTFOR THE FISCAL YEAR ENDED JUNE 30, 2017


Bass River Township School DistrictBusiness Administrator's Office
COMPREHENSIVE ANNUAL FINANCIAL REPORT
OF THE
BASS RIVER TOWNSHIP SCHOOL DISTRICT
NEW GRETNA, NEW JERSEY
FOR THE FISCAL YEAR ENDED JUNE 30, 2017
Prepared by


PAGE
Letter of Transmittal 1Organizational Chart 5Roster of Officials 6Consultants and Advisors 7
Independent Auditors' Report 11
Management's Discussion & Analysis 17
BASIC FINANCIAL STATEMENTS
A. Government-Wide Financial Statements:A-1 Statement of Net Position 29A-2 Statement of Activities 30
B. Fund Financial Statements:Governmental Funds:
B-1 Balance Sheet 35B-2 Statement of Revenues, Expenditures & Changes in Fund Balance 36B-3 Reconciliation of the Statement of Revenues, Expenditures & Changes in Fund
Balance of Governmental Funds to the Statement of Activities 37Proprietary Funds:
B-4 Statement of Net Position N/AB-5 Statement of Revenues, Expenditures & Changes in Fund Net Position N/AB-6 Statement of Cash Flows N/A
Fiduciary Funds:B-7 Statement of Fiduciary Net Position 43B-8 Statement of Changes in Fiduciary Net Position 44
Notes to Financial Statements 47
C. Budgetary Comparison Schedules:C-1 Budgetary Comparison Schedule - General Fund 83C-2 Budgetary Comparison Schedule - Special Revenue Fund 89
Notes to the Required Supplementary Information:C-3 Budget-to-GAAP Reconciliation 93
INTRODUCTORY SECTION
FINANCIAL SECTION
TABLE OF CONTENTS
REQUIRED SUPPLEMENTARY INFORMATION - PART I
REQUIRED SUPPLEMENTARY INFORMATION - PART II

PAGE
TABLE OF CONTENTS
L. Schedules Related to Accounting and Reporting for Pensions (GASB 68):L-1 Schedule of the District's Proportionate Share of the Net Pension Liability - PERS 97L-2 Schedule of District's Contributions - Public Employees' Retirement System 98L-3 Schedule of the State's Proportionate Share of the Net Pension Liability - TPAF 99L-4 Schedule of District's Contributions - Teachers Pension Annuity Fund 100
Notes to the Required Supplementary Information 103
D. School Based Budget Schedules Fund:D-1 Combining Balance Sheet N/AD-2 Blended Resource Fund - Schedule of Expenditures Allocated by Resource
Type - Actual N/AD-3 Blended Resource Fund - Schedule of Blended Expenditures - Budget & Actual N/A
E. Special Revenue Fund:E-1 Combining Schedule of Revenues & Expenditures - Special Revenue Fund -
Budgetary Basis 111E-2 Preschool Education Aid Schedule(s) of Expenditures - Budgetary Basis N/A
F. Capital Projects Fund:F-1 Summary Statement of Project Expenditures 115F-2 Summary Schedule of Revenues, Expenditures and Changes in Fund Balance -
Budgetary Basis 116F-2a Schedule of Revenues, Expenditures, Project Balance & Project Status -
Budgetary Basis 117
G. Proprietary Funds:Enterprise Funds:
G-1 Combining Statement of Net Position N/AG-2 Combining Statement of Revenues, Expenses & Changes in Fund Net Position N/AG-3 Combining Statement of Cash Flows N/A
Internal Service Funds:G-4 Combining Statement of Net Position N/AG-5 Combining Statement of Revenues, Expenses & Changes in Fund Net Position N/AG-6 Combining Statement of Cash Flows N/A
H. Fiduciary Funds:H-1 Combining Statement of Fiduciary Net Position 127H-2 Combining Statement of Changes in Fiduciary Net Position 128H-3 Student Activity Agency Fund Schedule of Receipts & Disbursements 129H-4 Payroll & Payroll Agency Fund Schedule of Receipts & Disbursements 129
I. Long-Term Debt:I-1 Schedule of Serial Bonds N/AI-2 Schedule of Obligations Under Capital Leases 133I-3 Debt Service Fund Budgetary Comparison Schedule N/A
REQUIRED SUPPLEMENTARY INFORMATION - PART III
OTHER SUPPLEMENTARY INFORMATION

PAGE
TABLE OF CONTENTS
Financial Trends:J-1 Net Position by Component 139J-2 Changes in Net Position 140J-3 Fund Balances - Governmental Funds 142J-4 Changes in Fund Balance - Governmental Funds 143J-5 Other Local Revenue by Source - General Fund 144
Revenue Capacity:J-6 Assessed Value & Estimated Actual Value of Taxable Property 147J-7 Direct & Overlapping Property Tax Rates 148J-8 Principal Property Taxpayers 149J-9 Property Tax Levies & Collections 150
Debt Capacity:J-10 Ratios of Outstanding Debt by Type 153J-11 Ratios of General Bonded Debt Outstanding 154J-12 Direct & Overlapping Governmental Activities Debt 155J-13 Legal Debt Margin Information 156
Demographic & Economic Information:J-14 Demographic & Economic Statistics 159J-15 Principal Employers 159
Operating Information:J-16 Full-Time Equivalent District Employees by Function/Program 163J-17 Operating Statistics 164J-18 School Building Information 165J-19 Schedule of Required Maintenance 166J-20 Insurance Schedule 167
K-1 Independent Auditors' Report on Compliance and on Internal Control Over Financial Reporting and Other Matters Based on an Audit of Financial Statements Performed in Accordance with Government Auditing Standards 171
K-2 Independent Auditors' Report on Compliance for Each Major Program and on InternalControl Over Compliance Required by the Uniform Guidance and New Jersey OMBCircular 15-08 173
K-3 Schedule of Expenditures of Federal Awards, Schedule A 177K-4 Schedule of Expenditures of State Financial Assistance, Schedule B 178K-5 Notes to Schedules of Expenditures of Federal Awards and State Financial Assistance 179K-6 Schedule of Findings & Questioned Costs - Section I - Summary of Auditor's Results 181K-7 Schedule of Findings & Questioned Costs - Section II - Financial Statement Findings 183 Section III - State Financial Assistance Findings and Questioned Costs 184K-8 Summary Schedule of Prior Audit Findingsand Questioned Costs as Prepared by Management 186
SINGLE AUDIT SECTION
STATISTICAL SECTION (unaudited)

This page intentionally left blank.

INTRODUCTORY SECTION

This page intentionally left blank.

1

2

3

4

SCHOOL BUSINESS
ADMINISTRATOR/
BOARD SECRETARY
INSTRUCTIONAL
STAFF
SUPPORT
STAFF
CHIEF
SCHOOL
ADMINISTRATOR
BOARD OF EDUCATION
BASS RIVER SCHOOL DISTRICT
ORGANIZATIONAL CHART
5

MEMBERS OF THE BOARD OF EDUCATION TERM EXPIRES
Mrs. Jacqueline Heinrichs, President 2018
Mrs. Bonnie Adams 2019
Mrs. Heather Duym 2017
Ms. Anastasia McGeoch 2018
Ms. Cindy Ruffo 2019
OTHER OFFICIALS
Dr. Detlef Kern, Interim Superintendent of Schools
Mr. Stephen J. Brennan, MBA, CPA, Business Administrator/Board Secretary
Ms. Kimberly Sprague, CPA, Treasurer of School Monies
BASS RIVER TOWNSHIP SCHOOL DISTRICT11 North Maple Avenue
New Gretna, New Jersey 08224
ROSTER OF OFFICIALS
JUNE 30, 2017
6

AUDIT FIRM
BASS RIVER TOWNSHIP SCHOOL DISTRICT11 North Maple Avenue
New Gretna, New Jersey 08224
CONSULTANTS AND ADVISORS
ATTORNEY
Paul KalacSchwartz Simon Edelstein & Celso, LLC
100 South Jefferson RoadSuite 200
Whippany, New Jersey 07981
Ocean First Bank975 Hooper Avenue
Toms River, New Jersey 08753
Rodney R. Haines, CPA, PSAHolman Frenia Allison, P.C.
680 Hooper AvenueBuilding B, Suite 201
Toms River, New Jersey 08753
OFFICIAL DEPOSITORY
7

This page intentionally left blank.
8

FINANCIAL SECTION
9

This page intentionally left blank.
10

INDEPENDENT AUDITOR’S REPORT
Honorable President and Members of the Board of Education Bass River Township School District County of Burlington New Gretna, New Jersey
Report on the Financial Statements
We have audited the accompanying financial statements of the governmental activities, the business-type activities, each major fund and the aggregate remaining fund information of the Bass River Township School District, County of Burlington, State of New Jersey, as of and for the fiscal year ended June 30, 2017, and the related notes to the financial statements, which collectively comprise the School District’s basic financial statements as listed in the table of contents.
Management’s Responsibility for the Financial Statements
Management is responsible for the preparation and fair presentation of these financial statements in accordance with accounting principles generally accepted in the United States of America; this includes the design, implementation, and maintenance of internal control relevant to the preparation and fair presentation of financial statements that are free from material misstatement, whether due to fraud or error.
Auditor’s Responsibility
Our responsibility is to express opinions on these financial statements based on our audit. We conducted our audit in accordance with auditing standards generally accepted in the United States of America; the standards applicable to financial audits contained in Governmental Auditing Standards, issued by the Comptroller General of the United States; and audit requirements as prescribed by the, Office of School Finance, Department of Education, State of New Jersey. Those standards require that we plan and perform the audit to obtain reasonable assurance about whether the financial statements are free from material misstatement.
An audit involves performing procedures to obtain audit evidence about the amounts and disclosures in the financial statements. The procedures selected depend on the auditor’s judgment, including the assessment of the risks of material misstatement of the financial statements, whether due to fraud or error. In making those risk assessments, the auditor considers internal control relevant to the District’s preparation and fair presentation of the financial statements in order to design audit procedures that are appropriate in the circumstances, but not for the purpose of expressing an opinion on the effectiveness of the District’s internal control. Accordingly, we express no such opinion. An audit also includes evaluating the appropriateness of accounting policies used and the reasonableness of significant accounting estimates made by management, as well as evaluating the overall presentation of the financial
11

statements. We believe that the audit evidence we have obtained is sufficient and appropriate to provide a basis for our audit opinions. Opinions In our opinion, the financial statements referred to above present fairly, in all material respects, the respective financial position of the governmental activities, the business-type activities, each major fund and the aggregate remaining fund information of the Bass River Township School District, County of Burlington, State of New Jersey, as of June 30, 2017, and the respective changes in financial position and, where applicable, cash flows thereof for the year then ended in accordance with accounting principles generally accepted in the United States of America. Other Matters Required Supplementary Information Accounting principles generally accepted in the United States of America require that the management’s discussion and analysis, budgetary comparison information, and the schedules related to accounting and reporting for pensions, as listed in the table of contents be presented to supplement the basic financial statements. Such information, although not a part of the basic financial statements, is required by the Governmental Accounting Standards Board who considers it to be an essential part of financial reporting for placing the basic financial statements in an appropriate operational, economic, or historical context. We have applied certain limited procedures to the required supplementary information in accordance with auditing standards generally accepted in the United States of America, which consisted of inquiries of management about the methods of preparing the information and comparing the information for consistency with management’s responses to our inquiries, the basic financial statements, and other knowledge we obtained during our audit of the basic financial statements. We do not express an opinion or provide any assurance on the information because the limited procedures do not provide us with sufficient evidence to express an opinion or provide any assurance. Other Information Our audit was conducted for the purpose of forming opinions on the financial statements that collectively comprise the Bass River Township School District’s basic financial statements. The introductory section, combining statements and related major fund supporting statements and schedules, statistical section and schedule of expenditures of federal awards are presented for purposes of additional analysis, as required by the Division of Administration and Finance, Department of Education, State of New Jersey, and are not a required part of the basic financial statements. The accompanying schedule of expenditures of state financial assistance, as required by New Jersey OMB’s Circular 15-08, Single Audit Policy for Recipients of Federal Grants, State Grants and State Aid, is also presented for purposes of additional analysis and is not a required part of the basic financial statements. The accompanying combining statements and related major fund supporting statements and schedules, and the schedules of expenditures of federal awards and state financial assistance are the responsibility of management and were derived from and relates directly to the underlying accounting and other records used to prepare the basic financial statements. Such information has been subjected to the auditing procedures applied in the audit of the basic financial statements and certain additional procedures, including comparing and reconciling such information directly to the underlying accounting other records used to prepare the basic financial statements or to the basic financial statements themselves, and other
12

additional procedures in accordance with auditing standards generally accepted in the United States of America. In our opinion, the accompanying combining statements and related major fund supporting statements and schedules and schedules of expenditures of federal awards and state financial assistance are fairly stated, in all material respects, in relation to the basic financial statements as a whole. The introductory section and statistical section listed in the table of contents have not been subjected to the auditing procedures applied in the audit of the basic financial statements and, accordingly, we do not express an opinion or provide any assurance on them. Other Reporting Required by Government Auditing Standards In accordance with Government Auditing Standards, we have also issued our report dated October 18, 2017 on our consideration of the School District’s internal control over financial reporting and on our tests of its compliance with certain provisions of laws, regulations, contracts, and grant agreements and other matters. The purpose of that report is to describe the scope of our testing of internal control over financial reporting and compliance and the results of that testing, and not to provide an opinion on internal control over financial reporting or on compliance. That report is an integral part of an audit performed in accordance with Government Auditing Standards in considering the School District’s internal control over financial reporting and compliance.
Respectfully Submitted,
HOLMAN FRENIA ALLISON, P.C.
Rodney R. Haines Certified Public Accountant Public School Accountant, No. 2198
Toms River, New Jersey October 18, 2017
13

This page intentionally left blank.
14

REQUIRED SUPPLEMENTARY INFORMATION - PART I
Management's Discussion and Analysis
15

This page intentionally left blank.
16

BASS RIVER TOWNSHIP SCHOOL DISTRICT Management’s Discussion and Analysis
For the Fiscal Year Ended June 30, 2017 (Unaudited)
As management of the Bass River Township School District, New Jersey (School District), we offer readers of the School District’s financial statements this narrative overview and analysis of the School District for the fiscal year ended June 30, 2017. We encourage readers to consider the information presented in conjunction with additional information that we have furnished in our letter of transmittal, which can be found in the introductory section of this report.
Overview of the Basic Financial Statements
This discussion and analysis is intended to serve as an introduction to the School District’s basic financial statements. Comparison to the prior year’s activity is provided in this document. The basic financial statements are comprised of three components:
1) Government-Wide financial statements, 2) Fund financial statements, and 3) Notes to the basicfinancial statements. This report also contains other supplementary information in addition to thebasic financial statements themselves.
Government-Wide Financial Statements
The government-wide financial statements are designed to provide the reader with a broad overview of the financial activities in a manner similar to a private-sector business. The government-wide financial statements include the statement of net position and the statement of net activities.
The statement of net position presents information about all of the School District’s assets and liabilities. The difference between the assets plus deferred outflows or resources and liabilities plus deferred inflows of resources is reported as net position. Over time, changes in net position may serve as a useful indicator of whether the financial position of the School District is improving or deteriorating.
The statement of activities presents information showing how the net position of the School District changed during the current fiscal year. Changes in net position are recorded in the statement of activities when the underlying event occurs, regardless of the timing of related cash flows. Thus, revenues and expenditures are reported in this statement even though the resulting cash flows may be recorded in a future period.
Both of the government-wide financial statements distinguish functions of the School District that are supported from taxes and intergovernmental revenues (governmental activities). Governmental activities consolidate governmental funds including the General Fund, Special Revenue Fund and Capital Projects Fund.
Fund Financial Statements
Fund financial statements are designed to demonstrate compliance with financial-related requirements. A fund is a grouping of related accounts that is used to maintain control over resources that have been segregated for specific objectives. All of the funds of the School District are divided into three categories: governmental funds, proprietary funds and fiduciary funds.
17

BASS RIVER TOWNSHIP SCHOOL DISTRICT Management’s Discussion and Analysis (continued)
For the Fiscal Year Ended June 30, 2017 (Unaudited)
Overview of the Basic Financial Statements (continued) Fund Financial Statements (continued) Governmental funds account for essentially the same information reported in the governmental activities of the government-wide financial statements. However, unlike the government-wide financial statements, the governmental fund financial statements focus on near-term financial resources and fund balances. Such information may be useful in evaluating the financial requirements in the near term. Since the governmental funds and the governmental activities report information using the same functions, it is useful to compare the information presented. Because the focus of each report differs, a reconciliation is provided on the fund financial statements to assist the reader in comparing the near-term requirements with the long-term needs. The School District maintains three individual governmental funds. The major funds are the General Fund, the Special Revenue Fund and the Capital Projects Fund. They are presented separately in the fund financial statements. The School District adopts an annual appropriated budget for the General Fund and Special Revenue Fund. A budgetary comparison statement has been provided for each of these funds to demonstrate compliance with budgetary requirements. Fiduciary funds are used to account for resources held for the benefit of parties outside the government. Fiduciary funds are not reflected in the government-wide financial statements because the resources of those funds are not available to support the School District’s programs. Notes to the Basic Financial Statements The notes to the basic financial statements provide additional information that is essential to a full understanding of the data provided in the basic financial statements. Financial Analysis of the School District as a Whole Table 1 provides a summary of the School Districts net position for the fiscal years 2017 compared to fiscal year 2016.
18

BASS RIVER TOWNSHIP SCHOOL DISTRICT Management’s Discussion and Analysis (continued)
For the Fiscal Year Ended June 30, 2017 (Unaudited)
Financial Analysis of the School District as a Whole (continued)
Table 2 shows the changes in net position for fiscal year 2017 compared to fiscal year 2016.
June 30, June 30, Increase/ Percentage2017 2016 (Decrease) Change
Current & Other Assets 588,209$ 160,033$ 428,176$ 267.6%Capital Assets, Net 540,118 560,063 (19,945) -3.6% Total Assets 1,128,327 720,096 408,231 56.7%
Deferred Outflow of Resources 209,345 104,329 105,016 100.7%
Current & Other Liabilities 238,889 195,228 43,661 22.4%Noncurrent Liabilities 1,195,739 810,709 385,030 47.5% Total Liabilities 1,434,628 1,005,937 428,691 42.6%
Deferred Inflow of Resources 94,852 40,014 54,838 137.0%
Net Position:Net Investment in Capital Asset 318,704 318,673 31 0.0%Unrestricted (Deficit) (510,512) (540,199) 29,687 -5.5%
Total Net Position (191,808)$ (221,526)$ 29,718$ -13.4%
Summary of Net PositionTable 1
19

BASS RIVER TOWNSHIP SCHOOL DISTRICT Management’s Discussion and Analysis (continued)
For the Fiscal Year Ended June 30, 2017 (Unaudited)
Financial Analysis of the School District as a Whole (continued)
Governmental Activities During the fiscal year 2017, the net position of governmental activities increased by $29,718 or 13.42%. The primary reason for the increase was the elimination of a Basic Skills instructor and the corresponding decreased reliance on appropriated fund balance.
June 30, June 30, Increase/ Percentage2017 2016 (Decrease) Change
Revenues:Program Revenues:
Operating Grants & Contributions 423,169$ 708,862$ (285,693)$ -40.3%General Revenues:
Property Taxes 1,455,596 1,427,055 28,541 2.0%Federal & State Aid 869,142 852,404 16,738 2.0%Other General Revenues 29,735 36,738 (7,003) -19.1%
Total Revenues 2,777,642 3,025,059 (247,417) -8.2%
Function/Program Expenses:Regular Instruction 800,406 862,319 (61,913) -7.2%Special Education Instruction 346,163 339,631 6,532 1.9%Other Instruction 21,867 23,746 (1,879) -7.9%Tuition 45,402 2,822 42,580 1508.9%Student & Instruction Related Services 273,761 304,051 (30,290) -10.0%General Administrative 146,548 145,591 957 0.7%School Administrative Services 68,108 66,317 1,791 2.7%Plant Operations & Maintenance 165,777 169,992 (4,215) -2.5%Pupil Transportation 90,283 84,454 5,829 6.9%Unallocated Benefits 741,463 1,020,818 (279,355) -27.4%Interest & Other Charges 9,374 3,870 5,504 142.2%Unallocated Depreciation 38,772 49,602 (10,830) -21.8%
Total Expenses 2,747,924 3,073,213 (325,289) -10.6%
Change In Net Position 29,718 (48,154) 77,872 -161.7%Net Position - Beginning (221,526) (173,372) (48,154) 27.8%Net Position - Ending (191,808)$ (221,526)$ 29,718$ -13.4%
Table 2Summary of Changes in Net Position
20

BASS RIVER TOWNSHIP SCHOOL DISTRICT Management’s Discussion and Analysis (continued)
For the Fiscal Year Ended June 30, 2017 (Unaudited)
Governmental Activities (continued) The liabilities and deferred inflows of the primary government activities exceeded assets and deferred outflows by $191,808, with an unrestricted deficit balance of $879,512. The deficit in unrestricted net position is primarily due to accounting treatment for compensated absences payable, GASB 68 net pension liability, and the last 2 state aid payments. In addition, state statutes prohibit school districts from maintaining more than 2% of its adopted budget as unassigned fund balance. The School District’s governmental activities unrestricted net positon had GASB 68 pension not been implemented would have been as follows:
General Fund Budgeting Highlights Final budgeted revenues was $2,342,295, which was equal to the original budget. Excluding nonbudgeted revenues, the School District’s actual revenues exceeded budgeted revenues by $12,556. Final budgeted appropriations was $2,397,963, which was an increase of $8,114 from the original budget. The increase is primarily due to prior year reserve for encumbrances, which increase the budget appropriations in the subsequent fiscal year’s budget. Excluding nonbudgeted revenues, the School District’s budget appropriations exceeded actual expenditures by $88,719. The School District’s general fund balance – budgetary basis (Exhibit C-1) was $186,027 at June 30, 2017, an increase of $45,607 from the prior year. Governmental Funds At the end of the current fiscal year, the School District’s governmental funds reported a combined ending fund balance of $466,358, an increase of $414,229 from the prior year. General fund - During the current fiscal year, the fund balance of the School District’s general fund increased by $45,229. The primary factor(s) affecting the change in fund balance of the general fund is as follows:
• Elimination of a Basic Skills Instructor • Decreased reliance on appropriated fund balance
Unrestricted Net Position (With GASB 68) (191,808)$
Add back: PERS Pension Liability 632,125 Less: Deferred Outflows related to pensions (209,345) Add back: Deferred Inflows related to pensions 94,852
Unrestricted Net Position (Without GASB 68) 325,824$
Table 3GASB 68 Effect on Unrestricted Net Position
21

BASS RIVER TOWNSHIP SCHOOL DISTRICT Management’s Discussion and Analysis (continued)
For the Fiscal Year Ended June 30, 2017 (Unaudited)
Governmental Funds (continued) Special revenue fund – There was no change in the fund balance for the special revenue fund. Capital projects fund - During the current fiscal year, the fund balance of the School District’s capital projects fund increased by $369,000. The primary factor affecting the change in fund balance of the capital projects fund is as follows:
• Approval and issuance of a capital lease to fund the School District’s energy savings improvement plan.
Capital Assets The School District’s capital assets for its governmental and business-type activities as of June 30, 2017, totaled $540,118 (net of accumulated depreciation). This investment in capital assets includes land, land improvements, buildings and improvements and equipment. There was a net decrease in the School District’s investment in capital assets for the current fiscal year in the amount of $19,945. This decrease is primarily due to the current year depreciation expense. Table 3 shows fiscal 2017 balances compared to 2016.
Depreciation expense for the year was $38,772. Additional information on the School District’s capital assets can be found in the notes to the basic financial statements (Note 4) of this report. Debt Administration Long-term debt – At the end of the current fiscal year, the School District had total capital leases outstanding of $590,414, which is an increase of $349,024 from the prior year. Additional information on the School District’s long-term obligations can be found in the notes to the basic financial statements (Note 6) of this report.
June 30, June 30, Increase/ PercentageCapital Assest (Net of Depreciation): 2017 2016 (Decrease) Change
Land Improvements 43,651$ 48,362$ (4,711)$ -9.7%Building and Improvements 473,586 501,993 (28,407) -5.7%Equipment 22,881 9,708 13,173 135.7%
540,118$ 560,063$ (19,945)$ -3.6%
Table 4Summary of Capital Assets
22

BASS RIVER TOWNSHIP SCHOOL DISTRICT Management’s Discussion and Analysis (continued)
For the Fiscal Year Ended June 30, 2017 (Unaudited)
Factors on the School District’s Future A significant reliance on State Aid funding drives education in the Bass River Township School District. Unexpected decrease in state aid for fiscal year 2018 and another decrease anticipated for fiscal year 2019 will tax the District’s already strained resources. Due to the limited resources of a small school district, out of district placements present another difficult challenge. Contacting the School Districts Financial Management
This financial report is designed to provide a general overview of the School District’s finances for all those with an interest in the School District. Questions concerning any of the information provided in this report or requests for additional financial information should be addressed to Mr. Stephen Brennan, Business Administrator/Board Secretary at the Bass River Township School District, 520 Nugentown Road, P.O. Box 248, Little Egg Harbor, NJ 08087-0248. Readers can also visit the School District’s website at www.bassriverschools.org.
23

This page intentionally left blank.
24

BASIC FINANCIAL STATEMENTS
25

This page intentionally left blank.
26

A. Government-Wide Financial Statements
27

This page intentionally left blank
28

The accompanying Notes to Financial Statements are an integral part of this statement.
EXHIBIT A-1
GOVERNMENTAL JUNE 30,ASSETS ACTIVITIES 2017
Cash & Cash Equivalents 197,884$ 197,884$ Cash on Hand with Fiscal Agent 369,000 369,000 Receivables, Net (Note 3) 21,325 21,325 Capital Assets, Net (Note 4):
Depreciable 540,118 540,118
Total Assets 1,128,327 1,128,327
DEFERRED OUTFLOW OF RESOURCES
Deferred Outflows Related to Pensions (Note 7) 209,345 209,345
Total Deferred Outflow of Resources 209,345 209,345
Total Assets and Deferred Outflow of Resources 1,337,672 1,337,672
LIABILITIES
Accounts Payable 98,851 98,851 Accrued Interest Payable 6,729 6,729 Payable to Other Governments 20,000 20,000 Unearned Revenue 23,000 23,000 Noncurrent Liabilities (Note 6): Due Within One Year 90,309 90,309 Due Beyond One Year 1,195,739 1,195,739
Total Liabilities 1,434,628 2,440,565
DEFERRED INFLOW OF RESOURCES
Deferred Inflows Related to Pensions (Note 7) 94,852 94,852
Total Deferred Inflow of Resources 94,852 94,852
Total Liabilities and Deferred Inflows of Resources 1,529,480 1,529,480
NET POSITION
Net Investment in Capital Assets 318,704 318,704 Unrestricted (510,512) (510,512)
Total Net Position (191,808)$ (191,808)$
TOTAL
BASS RIVER TOWNSHIP SCHOOL DISTRICTSTATEMENT OF NET POSITION
JUNE 30, 2017
29

The accompanying Notes to Financial Statements are an integral part of this statement.
EXHIBIT A-2
CHARGES OPERATINGFOR GRANTS & GOVERNMENTAL JUNE 30,
FUNCTIONS/PROGRAMS EXPENSES SERVICES CONTRIBUTIONS ACTIVITIES 2017
Governmental Activities: Instruction:
Regular Instruction 800,406$ -$ -$ (800,406)$ (800,406)$ Special Education Instruction 306,383 - 104,799 (201,584) (201,584) Other Special Instruction 39,780 - - (39,780) (39,780) Other Instruction 21,867 - - (21,867) (21,867)
Support Services & Undistributed Costs: Tuition Charges 45,402 - - (45,402) (45,402) Student & Instruction Related Services 273,761 - 13,376 (260,385) (260,385) School Administrative Services 68,108 - - (68,108) (68,108) General Administrative Services 146,548 - - (146,548) (146,548) Plant Operations & Maintenance 165,777 - - (165,777) (165,777) Pupil Transportation 90,283 - - (90,283) (90,283) Unallocated Employee Benefits 741,463 - 304,994 (436,469) (436,469)
Interest & Other Charges 9,374 - - (9,374) (9,374) Unallocated Depreciation 38,772 - - (38,772) (38,772)
Total Governmental Activities 2,747,924 - 423,169 (2,324,755) (2,324,755)
Total Primary Government 2,747,924$ -$ 423,169$ (2,324,755) (2,324,755)
General Revenues: Taxes: Property Taxes, Levied for General Purposes, Net 1,455,596 1,455,596 Federal & State Aid Not Restricted 869,142 869,142 Miscellaneous Income 29,735 29,735
Total General Revenues 2,354,473 2,354,473
Change In Net Position 29,718 29,718 Net Position, Beginning (221,526) (221,526)
Net Position - Ending (191,808)$ (191,808)$
TOTALPROGRAM REVENUES
BASS RIVER TOWNSHIP SCHOOL DISTRICTSTATEMENT OF ACTIVITIES
FOR THE YEAR ENDED JUNE 30, 2017
AND CHANGES IN NET POSITIONNET (EXPENSES) REVENUE
30

B. Fund Financial Statements
31

This page intentionally left blank
32

Governmental Funds
33

This page intentionally left blank
34

The accompanying Notes to Financial Statements are an integral part of this statement.
EXHIBIT B-1
TOTALSPECIAL CAPITAL
GENERAL REVENUE PROJECTS JUNE 30,ASSETS FUND FUND FUND 2017
Cash & Cash Equivalents 199,983$ -$ -$ 199,983$ Cash on Hand with Fiscal Agent - - 369,000 369,000 Intergovernmental Receivable:
State 13,191 - - 13,191 Other - 2,099 - 2,099
Interfunds Receivable 6,035 - - 6,035
Total Assets 219,209$ 2,099$ 369,000$ 590,308$
LIABILITIES & FUND BALANCES
Liabilities: Cash Deficit -$ 2,099$ -$ 2,099$ Accounts Payable 98,851 - - 98,851 Unearned Revenue 23,000 - - 23,000
Total Liabilities 121,851 2,099 - 123,950
Fund Balances: Restricted for:
Capital Projects - - 369,000 369,000 Assigned Fund Balance:
Designated for Subsequent Year's Expenditures 57,734 - - 57,734 Other Purposes 18,240 - 18,240
Unassigned Fund Balance 21,384 - - 21,384
Total Fund Balances 97,358 - 369,000 466,358
Total Liabilities & Fund Balances 219,209$ 2,099$ 369,000$
Amounts reported for governmental activities in the statement of net position (A-1) are different because:
Capital assets used in governmental activities are not financial resources and, therefore, are not reported in the funds. The cost of the assets is $1,784,293 and the accumulated depreciation is $1,244,175. 540,118
Deferred outflows and inflows of resources related to pensions are applicable to future reporting periods and, therefore, are not reported in the funds. 114,493
Accrued interest on long-term debt is not due and payable in the current period and therefore is not reported as a liability in the funds. (6,729)
Accrued pension contributions for the June 30, 2017 plan year are not paid with currenteconomic resources and are therefore not reported as a liability in the funds, but are included in accounts payable in the government-wide statement of net position. (20,000)
Long-term liabilities, including net pension liability, compensated absences payableand capital leases are not due and payable in the current period and therefore are not reported as liabilities in the funds. (1,286,048)
Net position of Governmental Activities (191,808)$
BASS RIVER TOWNSHIP SCHOOL DISTRICTGOVERNMENTAL FUNDS
BALANCE SHEETJUNE 30, 2017
35

The accompanying Notes to Financial Statements are an integral part of this statement.
EXHIBIT B-2
SPECIAL CAPITALGENERAL REVENUE PROJECTS JUNE 30,
FUND FUND FUND 2017Revenues: Local Sources: Local Tax Levy 1,455,596$ -$ -$ 1,455,596$ Miscellaneous 6,334 23,401 - 29,735
Total Local Sources 1,461,930 23,401 - 1,485,331
State Sources 1,197,537 - - 1,197,537 Federal Sources - 94,774 - 94,774
Total Revenues 2,659,467 118,175 - 2,777,642
Expenditures: Current Expense: Regular Instruction 800,406 - - 800,406 Special Education Instruction 201,584 104,799 - 306,383 Other Special Instruction 39,780 - - 39,780 Other Instruction 21,867 - - 21,867 Support Services: Tuition 45,402 - - 45,402 Student & Instruction Related Services 260,385 13,376 - 273,761 School Administrative Services 68,108 - - 68,108 General Administrative 146,548 - - 146,548 Plant Operations & Maintenance 211,093 - - 211,093 Pupil Transportation 90,283 - - 90,283 Employee Benefits 728,782 - - 728,782 Capital Outlay 80,000 - - 80,000
Total Expenditures 2,694,238 118,175 - 2,812,413
Excess/(Deficiency) of Revenues Over/ (Under) Expenditures (34,771) - - (34,771)
Other Financing Sources/(Uses): Capital Leases Proceeds 80,000 - 369,000 449,000
Total Other Financing Sources/(Uses) 80,000 - 369,000 449,000
Excess/(Deficiency) of Revenues & Other Financing Sources Over/(Under) Expenditures & Other Financing Uses 45,229 - 369,000 414,229 Fund Balances, July 1 52,129 - - 52,129
Fund Balances June 30 97,358$ -$ 369,000$ 466,358$
TOTAL
BASS RIVER TOWNSHIP SCHOOL DISTRICTGOVERNMENTAL FUNDS
STATEMENT OF REVENUES, EXPENDITURES AND CHANGES IN FUND BALANCEFOR THE YEAR ENDED JUNE 30, 2017
36

The accompanying Notes to Financial Statements are an integral part of this statement.
EXHIBIT B-3
Total Net Change in Fund Balances - Governmental Funds (From B-2) 414,229$
Amounts reported for governmental activities in the statement of activities (A-2)are different because:
Capital outlays are reported in governmental funds as expenditures. However, inthe statement of activities, the cost of those assets is allocated over their estimateduseful lives as depreciation expense. This is the amount by which capital outlaysexceeded depreciation in the period:
Depreciation Expense (38,772) Non-Capitalizable Items Included with Lease Expenditures (61,173) Capital Outlays 80,000 (19,945)
District pension contributions are reported as expenditures in the governmental funds when made. However, they are reported as deferred outflows of resources in the statement of net position because the reported net pension liability is measured a year before the District's report date. Pension expense, which is the change in net pension adjusted for changes in deferred outflows and inflows of resources related to pensions,is reported in the Statement of Activities.
District Pension Contributions 18,961 Pension Expense (43,943) (24,982)
In the statement of activities, interest on long-term debt in the statement of activities is accrued, regardless of when due. In the governmental funds, interest is reported when due. The accrued interest is an reduction in the reconciliation (-). (2,861)
Proceeds from debt issues are a financing source in the governmental funds. Theyare not revenue in the statement of activities; issuing debt increases long-termliabilities in the statement of net position:
Capital Lease Proceeds (449,000)
Repayment of capital lease principal is an expenditure in the governmental funds, butthe repayment reduces long-term liabilities in the statement of net position and is notreported in the statement of activities. 99,976
Repayment of compensated absences is an expenditure in the governmental funds, but the repayment reduces long-term liabilities in the statement of net position and isnot reported in the statement of activities.
Prior Year 75,810 Current Year (63,509) 12,301
Change in Net Position of Governmental Activities 29,718$
FOR THE YEAR ENDED JUNE 30, 2017
BASS RIVER TOWNSHIP SCHOOL DISTRICTRECONCILIATION OF THE STATEMENT OF REVENUES, EXPENDITURES,
AND CHANGES IN FUND BALANCES OF GOVERNMENTAL FUNDSTO THE STATEMENT OF ACTIVITIES
37

This page intentionally left blank
38

Proprietary Fund
Not Applicable
39

This page intentionally left blank
40

Fiduciary Fund
41

This page intentionally left blank
42

The accompanying Notes to Financial Statements are an integral part of this statement.
EXHIBIT B-7
UNEMPLOYMENT STUDENT JUNE 30, ASSETS TRUST ACTIVITY PAYROLL 2017
Cash & Cash Equivalents 26,099$ 6,908$ 6,035$ 39,042$
Total Assets 26,099 6,908 6,035 39,042
LIABILITIES
Interfund Payable - - 6,035 6,035 Payable to Student Groups - 6,908 - 6,908
Total Liabilities - 6,908 6,035 12,943
NET POSITION
Held in Trust for Unemployment & Other Purposes 26,099 - - 26,099
Total Net Position 26,099$ -$ -$ 26,099$
AGENCYPRIVATE PURPOSE
BASS RIVER TOWNSHIP SCHOOL DISTRICT
TOTAL
FIDUCIARY FUNDSSTATEMENT OF FIDUCIARY NET POSITION
FOR THE YEAR ENDED JUNE 30, 2017
43

The accompanying Notes to Financial Statements are an integral part of this statement.
EXHIBIT B-8
UNEMPLOYMENT JUNE 30,ADDITIONS FUND 2017
Contributions: Plan Member -$ -$
Total Contributions - -
Investment Earnings: Interest 34 34
Net Investment Earnings 34 34
Total Additions 34 34
DEDUCTIONS
Claims Paid 99 99
Total Deductions 99 99
Change in Net Position (65) (65) Net Position - Beginning of the Year 26,164 26,164
Net Position - End of the Year 26,099$ 26,099$
PRIVATE PURPOSE
BASS RIVER TOWNSHIP SCHOOL DISTRICTFIDUCIARY FUNDS
COMBINING STATEMENT OF CHANGES IN FIDUCIARY NET POSITIONFOR THE YEAR ENDED JUNE 30, 2017
44

BASS RIVER TOWNSHIP SCHOOL DISTRICT
NOTES TO THE FINANCIAL STATEMENTSJUNE 30, 2017
45

This page intentionally left blank
46

BASS RIVER TOWNSHIP SCHOOL DISTRICT
NOTES TO THE FINANCIAL STATEMENTS YEAR ENDED JUNE 30, 2017
Note 1. Summary of Significant Accounting Policies Basis of Presentation The financial statements of the Bass River Township School District (hereafter referred to as the “School District”) have been prepared in conformity with generally accepted accounting principles (GAAP) as prescribed by the Governmental Accounting Standards Board (GASB). The Governmental Accounting Standards Board (GASB) is responsible for establishing GAAP for state and local governments through its pronouncements (Statements and Interpretations). Reporting Entity The Bass River School School District is a Type II School District located in the County of Burlington, State of New Jersey. As a Type II School District, the School District functions independently through a Board of Education. The Board is comprised of five members elected to three-year terms. These terms are staggered so that selected members’ terms expire each year. The purpose of the School District is to educate students in grades pre-kindergarten through sixth at its one school. The School District has an approximate enrollment at June 30, 2017 of 102 students. The primary criterion for including activities within the School District’s reporting entity, as set forth in Section 2100 of the GASB Codification of Governmental Accounting and Financial Reporting Standards, is whether:
♦ the organization is legally separate (can sue or be sued in their own name); ♦ the School District holds the corporate powers of the organization; ♦ the School District appoints a voting majority of the organization’s board ♦ the School District is able to impose its will on the organization; ♦ the organization has the potential to impose a financial benefit/burden on the School
District ♦ there is a fiscal dependency by the organization on the School District.
There were no additional entities required to be included in the reporting entity under the criteria as described above. Furthermore, the School District is not includable in any other reporting entity on the basis of such criteria. Component Units GASB Statement No.14. The Financial Reporting Entity, provides guidance that all entities associated with a primary government are potential component units and should be evaluated for inclusion in the financial reporting entity. A primary government is financially accountable not only for the organizations that make up its legal entity but also for legally separate organizations that meet the criteria established by GASB Statement No. 14, as amended by GASB Statement No. 39, Determining Whether Certain Organizations are Component Units, and GASB 61, The Financial Reporting Entity: Omnis – an Amendment of GASB Statements No. 14 and No. 34. The School District had no component units as of for the year ended June 30, 2017.
47

BASS RIVER TOWNSHIP SCHOOL DISTRICT
NOTES TO THE FINANCIAL STATEMENTS (continued) YEAR ENDED JUNE 30, 2017
Note 1. Summary of Significant Accounting Policies (continued) Basis of Accounting, Measurement Focus and Financial Statement Presentation The accounts of the School District are organized on the basis of funds, each of which is considered a separate accounting entity. The operations of each fund are accounted for with a separate set of self-balancing accounts that comprise its assets, deferred outflows of resources, liabilities, deferred inflows of resources, fund equity, revenues, and expenditures or expenses, as appropriate. Governmental resources are allocated to and accounted for in individual funds based upon the purposes for which they are to be spent and the means by which spending activities are controlled.
A. Government-Wide Financial Statements The School District’s Government-Wide Financial Statements include a Statement of Net Position and a Statement of Activities. These statements present summaries of Governmental and Business-Type Activities for the School District accompanied by a total column. Fiduciary activities of the School District are not included in these statements. These statements are presented on an “economic resources” measurement focus and the accrual basis of accounting. Accordingly, all of the School District’s assets, deferred outflows of resources, liabilities, and deferred inflows of resources, including capital assets and long-term liabilities, are included in the Statement of Net Position. The Statement of Activities presents changes in net position. Under the accrual basis of accounting, revenues are recognized in the period in which they are earned while expenses are recognized in the period in which the liability is incurred, regardless of the timing of related cash flows. The types of transactions reported as program revenues for the School District are reported in three categories: 1) charges for services, 2) operating grants and contributions, and 3) capital grants and contributions. Internally dedicated resources are reported as general revenues rather than as program revenues. Likewise, general revenues include all property taxes. Certain eliminations have been made to interfund activities, payables, and receivables. All internal balances in the Statement of Net Position have been eliminated except those representing balances between the governmental activities and the business-type activities, which are presented as internal balances and eliminated in the total primary government column. In the Statement of Activities, internal service fund transactions have been eliminated; however, those transactions between governmental and business-type activities have not been eliminated. B. Governmental Fund Financial Statements Governmental fund financial statements include a Balance Sheet and a Statement of Revenues, Expenditures and Changes in Fund Balances for all major governmental funds and non-major funds aggregated. The School District has presented all major funds that met those qualifications. All governmental funds are accounted for on a spending or “current financial resources” measurement focus and the modified accrual basis of accounting. Accordingly, only current assets and current liabilities are included on the Balance Sheets. (The School District’s deferred outflows of resources and deferred inflows of resources are noncurrent.) The Statement of Revenues, Expenditures and Changes in Fund Balances present increases (revenues and other financing sources) and decreases (expenditures and other financing uses) in net current assets. Under the modified accrual basis of accounting, revenues are recognized in the accounting period in which they become both measurable and available to finance expenditures of the current period. Accordingly, revenues are recorded when received in
48

BASS RIVER TOWNSHIP SCHOOL DISTRICT
NOTES TO THE FINANCIAL STATEMENTS (continued) YEAR ENDED JUNE 30, 2017
Note 1. Summary of Significant Accounting Policies (continued) Basis of Accounting, Measurement Focus and Financial Statement Presentation (continued)
B. Governmental Fund Financial Statements (continued) cash, except that revenues subject to accrual (generally 60 days after year-end) are recognized when due. The primary revenue sources, which have been treated as susceptible to accrual by the School District, are property tax and intergovernmental revenues. Expenditures are recorded in the accounting period in which the related fund liability is incurred. However, debt service expenditures, as well as expenditures related to compensated absences and claims and judgments, are recorded only when payment is due. General capital asset acquisitions are reported as expenditures in governmental funds. Issuance of long-term debt and acquisitions under capital leases are reported as other financing sources. Interest on invested funds is recognized when earned. Intergovernmental revenues that are reimbursements for specific purposes or projects are recognized in the period in which the expenditures are recorded. All other revenue items are considered to be measurable and available only when cash is received by the School District. Transfers between governmental funds are recorded when the related liability is incurred. These transfers do not represent revenues (expenditures) to the School District and are, therefore, reported as other financing sources (uses) in the governmental fund financial statements. Since the fund level statements are presented using a different measurement focus and basis of accounting than the government-wide statements, a reconciliation is presented on the page following each fund level statement that summarizes the adjustments necessary to convert the fund level statements into the government-wide presentations. The School District funds outlays for a particular purpose from both restricted and unrestricted resources. In order to calculate the amounts to report as restricted net position and unrestricted net position in the government-wide financial statements, a flow assumption must be made about the order in which the resources are considered to be applied. When both restricted and unrestricted resources are available for use, it is the School District’s policy to use restricted resources first, then unrestricted resources as they are needed. In order to calculate the amounts to report as restricted, committed, assigned and unassigned fund balance in the governmental fund financial statements a flow assumption must be made about the order in which the resources are considered to be applied. It is the School District’s policy to consider restricted fund balance to have been depleted before any of the components of unrestricted fund balance. Further, when the components of unrestricted fund balance can be used for the same purpose, committed fund balance is depleted first, followed by assigned fund balance. Unassigned fund balance is applied last. The School District reports the following major governmental funds:
General Fund - The general fund is the general operating fund of the School District and is used to account for all financial resources except those required to be accounted for in another fund. Included are certain expenditures for vehicles and movable instructional or noninstructional equipment which are classified in the capital outlay sub-fund.
49

BASS RIVER TOWNSHIP SCHOOL DISTRICT
NOTES TO THE FINANCIAL STATEMENTS (continued) YEAR ENDED JUNE 30, 2017
Note 1. Summary of Significant Accounting Policies (continued) Basis of Accounting, Measurement Focus and Financial Statement Presentation (continued)
B. Governmental Fund Financial Statements (continued)
As required by the New Jersey Department of Education the School District includes budgeted capital outlay in this fund. Generally accepted accounting principles as they pertain to governmental entities state that general fund resources may be used to directly finance capital outlays for long-lived improvements as long as the resources in such cases are derived exclusively from unrestricted revenues. Resources for budgeted capital outlay purposes are normally derived from State of New Jersey Aid, interest earnings and appropriated fund balance. Expenditures are those that result in the acquisition of or additions to capital assets for land, existing buildings, improvements of grounds, construction of buildings, additions to or remodeling of buildings and the purchase of built-in equipment. Special Revenue Fund - The special revenue fund is used to account for the proceeds of specific revenue from state and federal government, other than major capital projects, debt service or proprietary funds, and local appropriations that are restricted or committed to expenditures for specified purposes. Capital Projects Fund - The capital projects fund is used to account for and report financial resources that are restricted, committed, or assigned to expenditures for the acquisition of construction of major capital facilities, other than those financed by proprietary funds. The financial resources are derived from New Jersey School Development Authority grants, temporary notes, capital leases, or serial bonds that are specially authorized by the voters as a separate question on the ballot either during the annual election or at a special election.
C. Fiduciary Fund Financial Statements Fiduciary fund financial statements include a Statement of Net Position. The School District’s fiduciary funds include Agency and Private-Purpose Trust Funds and, which are custodial in nature (assets equal liabilities) and do not involve measurement of results of operations. The Agency funds are accounted for on a spending or “economic resources” measurement focus and the accrual basis of accounting as are the proprietary funds explained above. The School District reports the following fiduciary funds:
Private Purpose Trust Funds - Private-purpose trust funds are used to account for the principal and income for trust arrangements that benefit individuals, private organizations, or other governments. The School District currently maintains the following private purpose trust fund:
Unemployment Trust Fund – Revenues consist of employee payroll withholdings, interest income, and contributions through the annual budget process of the School District. Expenditures consist of unemployment reimbursement claims.
50

BASS RIVER TOWNSHIP SCHOOL DISTRICT
NOTES TO THE FINANCIAL STATEMENTS (continued) YEAR ENDED JUNE 30, 2017
Note 1. Summary of Significant Accounting Policies (continued) Basis of Accounting, Measurement Focus and Financial Statement Presentation (continued)
C. Fiduciary Fund Financial Statements (continued) Agency Funds - Agency funds (payroll and student activity funds) are assets held by a governmental entity either as trustee or as an agent for other parties and cannot be used to finance the governmental entities own operating programs.
Budgets/Budgetary Control Annual appropriated budgets are prepared in the spring of each year for the general, special revenue and debt service funds. The budgets are submitted to the county office. In accordance with P.L.2011 c.202, which became effective January 17, 2012, the School District eliminated the April annual voter referendum on budgets which met the statutory tax levy cap limitations and the board of education members are elected at the November general election. Budgets are prepared using the modified accrual basis of accounting. The legal level of budgetary control is established at line item accounts within each fund. Line item accounts are defined as the lowest (most specific) level of detail as established pursuant to the minimum chart of accounts referenced in N.J.A.C. 6A:23-2-2(f)1. Transfers of appropriations may be made by School Board resolution at any time during the fiscal year in accordance with N.J.A.C. 6A:23-2-11. Formal budgetary integration into the accounting system is employed as a management control device during the year. For governmental funds there are no substantial differences between the budgetary basis of accounting and generally accepted accounting principles with the exception of the legally mandated revenue recognition of the one or more June state aid payment for budgetary purposes only and the special revenue fund as noted below. Encumbrance accounting is also employed as an extension of formal budgetary integration in the governmental fund types. Unencumbered appropriations lapse at fiscal year-end. The accounting records of the special revenue fund are maintained on the grant accounting budgetary basis. The grant accounting budgetary basis differs from GAAP in that the grant accounting budgetary basis recognizes encumbrances as expenditures and also recognizes the related revenues, whereas the GAAP basis does not. Sufficient supplemental records are maintained to allow for the presentation of GAAP basis financial reports. The budget, as detailed on Exhibit C-1, Exhibit C-2, and Exhibit I-3, includes all amendments to the adopted budget, if any. Exhibit C-3 presents a reconciliation of the general fund revenues and special revenue fund revenues and expenditures from the budgetary basis of accounts as presented in the general fund budgetary comparison schedules and the special revenue fund budgetary comparison schedule to the GAAP basis of accounting as presented in the Statement of Revenues, Expenditures and Changes in Fund Balance – Governmental Funds. Note that the School District does not report encumbrances outstanding at fiscal year-end as expenditures in the general fund since the general fund budget follows modified accrual basis with the exception of the revenue recognition policy for the last state aid payments.
51

BASS RIVER TOWNSHIP SCHOOL DISTRICT
NOTES TO THE FINANCIAL STATEMENTS (continued) YEAR ENDED JUNE 30, 2017
Note 1. Summary of Significant Accounting Policies (continued) Encumbrances Under encumbrance accounting purchase orders, contracts and other commitments for the expenditure of resources are recorded to reserve a portion of the applicable appropriation. Open encumbrances in governmental funds other than the special revenue fund are reported as assigned fund balances at fiscal year-end as they do not constitute expenditures or liabilities but rather commitments related to unperformed contracts for goods and services. Open encumbrances in the special revenue fund for which the School District has received advances are reflected in the balance sheet as a reduction of the accounts receivables or as unearned revenue at fiscal year-end. The encumbered appropriation authority carries over into the next fiscal year. An entry will be made at the beginning of the next fiscal year to increase the appropriation reflected in the certified budget by the outstanding encumbrance amount as of the current fiscal year-end. Cash, Cash Equivalents and Investments Cash and Cash equivalents include petty cash, change funds, cash in banks and all highly liquid investments with a maturity of three months or less at the time of purchase and are stated at cost plus accrued interest. U.S. Treasury and agency obligations and certificates of deposit with maturities of one year or less when purchased are considered cash equivalents and stated at cost. Investments are stated at fair value in accordance with Governmental Accounting Standards Board (GASB). New Jersey school districts are limited as to the types of investments and types of financial institutions they may invest in. N.J.S.18A:20-37 provides a list of permissible investments that may be purchased by New Jersey school districts. N.J.S.A.17:9-41 et. Seq. establishes the requirements for the security of deposits of governmental units. The statute requires that no governmental unit shall deposit public funds in a public depository unless such funds are secured in accordance with the Governmental Unit Deposit Protection Act (“GUDPA”). GUDPA was enacted in 1970 to protect governmental units from loss of funds on deposit with a failed banking institution in New Jersey. Public depositories include Savings and Loan institutions, banks (both state and national banks) and savings banks the deposits of which are federally insured. All public depositories must pledge collateral, having a market value at least equal to five percent of the average daily balance of collected public funds, to secure the deposits of governmental units. If a public depository fails, the collateral it has pledged, plus the collateral of all other public depositories, is available to pay the full amount of their deposits to the governmental units. For purposes of the statement of cash flows, the School District considers all highly liquid investments (including restricted assets) with a maturity when purchased of twelve months or less and all local government investment pools to be cash equivalents
52

BASS RIVER TOWNSHIP SCHOOL DISTRICT
NOTES TO THE FINANCIAL STATEMENTS (continued) YEAR ENDED JUNE 30, 2017
Note 1. Summary of Significant Accounting Policies (continued) Tuition Receivable/Payable Tuition rates were established by the receiving School District based on estimated costs. The charges are subject to adjustment when the actual costs are determined. Interfund Receivables/Payables Interfund receivables/payables represent amounts that are owed, other than charges for goods or services rendered to/from a particular fund in the School District and that are due within one year. As previously mentioned, these amounts are eliminated in the governmental and business-type columns of the Statement of Net Position, except for the net residual amounts due between governmental and business-type activities, which are presented as Internal Balances in the Statement of Net Position. Capital Assets Capital assets are reported in the applicable governmental or business-type activities column in the government-wide financial statements. Purchased or constructed assets are recorded at actual cost or estimated historical cost if actual cost is unavailable. Donated capital assets are recorded at estimated fair market value at the date of donation. All reported capital assets except land and construction in progress are depreciated. The costs of normal maintenance and repairs that do not add to the value of the asset or materially extend asset lives are not capitalized. The School District does not possess any infrastructure. The School District has established a threshold of $2,000 for capitalization of depreciable assets. Capital assets of the School District are depreciated or amortized using the straight-line method over the following estimated useful lives:
Compensated Absences Compensated absences are those absences for which employees will be paid, such as vacation, sick leave and sabbatical leave. A liability for compensated absences that are attributable to services already rendered, and that are not contingent on a specific event that is outside the control of the School District and its employees, is accrued as the employees earn the rights to the benefits. Compensated absences that relate to future services, or that are contingent on a specific event that is outside the control of the School District and its employees, are accounted for in the period in which such services are rendered or in which such events take place.
Governmental Business-TypeActivities Activities
Description Estimated Lives Estimated Lives
Land Improvements 10-20 Years N/ABuildings and Improvements 10-50 Years N/AFurniture and Equipment 5-20 Years 5-12 YearsVehicles 5-10 Years 4-6 Years
53

BASS RIVER TOWNSHIP SCHOOL DISTRICT
NOTES TO THE FINANCIAL STATEMENTS (continued) YEAR ENDED JUNE 30, 2017
Note 1. Summary of Significant Accounting Policies (continued) Compensated Absences (continued) The entire compensated absences liability is reported on the government-wide financial statements and proprietary fund financial statements. Compensated absences liability is not recorded in the governmental funds. Instead expenditures are recognized in the governmental funds as payments come due each period, for example, as a result of resignations or retirements. Unearned Revenue Unearned revenue arises when assets are recognized before revenue recognition criteria have been satisfied and is recorded as a liability until the revenue is both measureable and the School District is eligible to realize the revenue. Accrued Liabilities and Long-Term Obligations All payables, accrued liabilities, and long-term obligations are reported in the government-wide financial statements, and all payables, accrued liabilities and long-term obligations payable from proprietary funds are reported on the proprietary fund financial statements. In general, government fund payables and accrued liabilities that, once incurred, are paid in a timely manner and in full from current financial resources, are reported as obligations of the funds. However, claims and judgments, compensated absences, special termination benefits and contractually required pension contributions that will be paid from governmental funds, are reported as a liability in the fund financial statements only to the extent that they are normally expected to be paid with expendable available financial resources. Accounting Estimates The preparation of financial statements in conformity with accounting principles generally accepted in the United States of America requires management to make estimates and assumption that affect certain reported amounts reported in the financial statements and accompanying note disclosures. Actual results could differ from those estimates. Interfund Activity Transfers between governmental and business-type activities on the government-wide statements are reported in the same manner as general revenues. Exchange transactions between funds are reported as revenues in the seller funds and as expenditures/expenses in the purchaser funds. Flows of cash or goods from one fund to another without a requirement for repayment are reported as interfund transfers. Interfund transfers are reported as other financing sources/uses in governmental funds and after non-operating revenues/expenses in proprietary funds. Reimbursements from funds responsible for particular expenditures/expenses to the funds that initially paid for them are not presented on the financial statements. As a general rule the effect of interfund activity has been eliminated from the government-wide financial statements.
54

BASS RIVER TOWNSHIP SCHOOL DISTRICT
NOTES TO THE FINANCIAL STATEMENTS (continued) YEAR ENDED JUNE 30, 2017
Note 1. Summary of Significant Accounting Policies (continued) Deferred Outflows and Deferred Inflows of Resources In addition to assets, the Statement of Net Position will sometimes report a separate section for deferred outflows of resources. This separate financial statement element, deferred outflows of resources, represents a consumption of net position that applies to a future period(s) and so will not be recognized as an outflow of resources (expense/expenditure) until then. In addition to liabilities, the statement of net position will sometimes report a separate section for deferred inflows of resources. This separate financial statement element, deferred inflows of resources, represents an acquisition of net position that applies to a future periods and so will not be recognized as an inflow of resources (revenue) until that time. Pensions For purposes of measuring the net pension liability, deferred outflows of resources and deferred inflows of resources related to pensions, and pension expense, information about the pension plan’s fiduciary net position of the Public Employees’ Retirement System (PERS) and Teacher’s Pension and Annuity Fund (TPAF) and additions to/deductions from the PERS’s and TPAF’s fiduciary net position have been determined on the same basis as they are reported by the plans. For this purpose, benefit payments (including refunds of employee contributions) are recognized when due and payable in accordance with the benefit terms. Investments are reported at fair value. Fund Balance In accordance with Government Accounting Standards Board 54, Fund Balance Reporting and Governmental Fund Type Definitions, fund balances in the governmental funds financial statements are classified into the following five categories, as defined below: • Non-spendable – This classification includes amounts that cannot be spent because they are either not
in spendable form or are legally or contractually required to be maintained intact. Non-spendable items are not expected to be converted to cash or are not expected to be converted to cash within the next year.
• Restricted – This classification includes amounts for which constraints have been placed on the use of the resources either externally imposed by creditors (such as through a debt covenant), grantors, contributors, or laws or regulations of other governments, or imposed by law through constitutional provisions or enabling legislation.
• Committed – This classification includes amounts that can be used only for specific purposes pursuant to constraints imposed by formal action of the Board of Education. These amounts cannot be used for any other purpose unless the Board of Education removes or changes the specified use by taking the same type of action (resolution) that was employed when the funds were initially committed. This classification also includes contractual obligations to the extent that existing resources have been specifically committed for use in satisfying those contractual requirements.
55

BASS RIVER TOWNSHIP SCHOOL DISTRICT
NOTES TO THE FINANCIAL STATEMENTS (continued) YEAR ENDED JUNE 30, 2017
Note 1. Summary of Significant Accounting Policies (continued) Fund Balance (continued) • Assigned – This classification includes amounts that are constrained by the School District’s intent to
be used for a specific purpose but are neither restricted nor committed. This intent can be expressed by the Board of Education or through the Board of Education delegating this responsibility to the business administrator through the budgetary process. This classification also includes the remaining positive fund balance for all governmental funds except for the General Fund.
• Unassigned – This classification includes the residual fund balance for the General Fund. The Unassigned classification also includes negative residual fund balance of any other governmental fund that cannot be eliminated by offsetting of Assigned fund balance amounts.
When an expenditure is incurred for purposes for which both restricted and unrestricted fund balance is available, it is the School District’s policy to consider restricted funds to have been spent first. When an expenditure is incurred for which committed, assigned, or unassigned fund balances are available, it is the School District’s policy to consider amounts to have been spent first out of committed funds, then assigned funds, and finally unassigned funds, as needed, unless the Board has provided otherwise in its commitment or assignment actions. Net Position Net position, represents the difference between summation of assets and deferred outflows of resources, and the summation of liabilities and deferred inflows of resources. Net position is classified into the following three components: • Net Investment in Capital Assets – This components represents capital assets, net of accumulated
depreciation, net of outstanding balances of borrowings used for acquisition, construction, or improvement of those assets.
• Restricted – This component of net position is reported as restricted when there are limitations imposed on their use either through the enabling legislation adopted by the School District or through external restrictions imposed by creditors, grantors or laws or regulations of other governments.
• Unrestricted – This component of net position is reported as unrestricted when it does not meet the criteria of the other two components of net position.
Impact of Recently Issued Accounting Principles Adopted Accounting Pronouncements The following GASB Statements became effective for the fiscal year ended June 30, 2017:
Statement No. 74, Financial Reporting for Postemployment Benefit Plans Other Than Pension Plans. The objective of this Statement is to improve the usefulness of information about postemployment benefits other than pensions (other postemployment benefits or OPEB) included in the general purpose external financial reports of state and local governmental OPEB plans for making decisions and assessing accountability. This Statement results from a comprehensive review of the effectiveness of existing standards of accounting and financial reporting for all postemployment benefits (pensions and OPEB) with regard to providing decision-useful information, supporting assessments of accountability and interperiod equity, and creating additional transparency. The adoption of this Statement had no impact on the School District’s financial statements.
56

BASS RIVER TOWNSHIP SCHOOL DISTRICT
NOTES TO THE FINANCIAL STATEMENTS (continued) YEAR ENDED JUNE 30, 2017
Note 1. Summary of Significant Accounting Policies (continued) Impact of Recently Issued Accounting Principles (continued) Adopted Accounting Pronouncements (continued) Statement No. 77, Tax Abatement Disclosures. This Statement requires governments that enter into tax abatement agreements to disclose information about those agreements. The adoption of this Statement had no impact on the School District’s financial statements. Statement No. 78, Pensions Provided through Certain Multiple-Employer Defined Benefit Pension Plans. The objective of this Statement is to address a practice issue regarding the scope and applicability of Statement No. 68, Accounting and Financial Reporting for Pensions. The adoption of this Statement had no impact on the School District’s financial statements. Statement No. 79, Certain External Investment Pools and Pool Participants. This Statement addresses accounting and financial reporting for certain external investment pools and pool participants. The adoption of this Statement had no impact on the School District’s financial statements. Recently Issued Accounting Pronouncements The GASB has issued the following Statements which will become effective in future fiscal years as shown below: Statement No. 75, Accounting and Financial Reporting for Post-employment Benefits Other than Pensions. This Statement replaces the requirements of Statement No. 45, Accounting and Financial Reporting by Employers for Post- employment Benefits Other Than Pensions, as amended, and No. 57, OPEB Measurements by Agency Employers and Agent Multi-Employer Plans, for OPEB Statement No. 74, Financial Reporting for Post-employment Benefit Plans Other Than Pension Plans, establishes new accounting and financial reporting requirements for OPEB Plans. This Statement will be effective for the year ended June 30, 2018. Management has not yet determined the potential impact on the School District’s financial statements. Statement No. 80, Blending Requirements for Certain Component Units - an amendment of GASB Statement No. 14. The objective of this Statement is to improve financial reporting by clarifying the financial statement presentation requirements for certain component units. This Statement amends the blending requirements established in paragraph 53 of Statement No. 14, The Financial Reporting Entity, as amended. This Statement will be effective for the year ended June 30, 2018. Management does not expect this Statement to have a material impact on the School District’s financial statements. Statement No. 81, Irrevocable Split-Interest Agreements. The objective of this Statement is to improve accounting and financial reporting for irrevocable split-interest agreements by providing recognition and measurement guidance for situations in which a government is a beneficiary of the agreement. This Statement will be effective for the year ended June 30, 2018. Management does not expect this Statement to have a material impact on the School District’s financial statements.
57

BASS RIVER TOWNSHIP SCHOOL DISTRICT
NOTES TO THE FINANCIAL STATEMENTS (continued) YEAR ENDED JUNE 30, 2017
Note 1. Summary of Significant Accounting Policies (continued) Impact of Recently Issued Accounting Principles (continued) Adopted Accounting Pronouncements (continued) Statement No. 82, Pension Issues – an amendment of GASB Statements No. 67, 68 and No. 73. The objective of this Statement is to address certain issues that have been raised with respect to Statements No. 67, Financial Reporting for Pension Plans, No. 68, Accounting and Financial Reporting for Pensions, and No. 73, Accounting and Financial Reporting for Pensions and Related Assets That Are Not within the Scope of GASB Statement 68, and Amendments to Certain Provisions of GASB Statements 67 and 68. This Statement will be effective for the year ended June 30, 2018. Management has not yet determined the potential impact on the School District’s financial statements. Statement No. 83, Certain Asset Retirement Obligations. An asset retirement obligation is a legally enforceable liability associated with the retirement of a tangible capital asset. Statement No. 83 establishes guidance for determining the timing and pattern of recognition for liabilities and corresponding deferred outflow of resources related to such obligations. The requirements of this Statement are effective for reporting periods beginning after June 15, 2018. Management does not expect this Statement to have a material impact on the School District’s financial statements. Statement No. 84, Fiduciary Activities. The Statement intends to improve guidance regarding the identification of fiduciary activities for accounting and financial reporting purposes and how those activities should be reported. To that end, Statement No. 84 establishes criteria for identifying fiduciary activities of all state and local governments and clarifies whether and how business-type activities should report their fiduciary activities. Statement No. 84 is effective for reporting periods beginning after December 15, 2018. Management does not expect this Statement to have a material impact on the School District’s financial statements. Statement No. 85, Omnibus 2017. This Statement provides guidance that addresses several different accounting and financial reporting issues identified during the implementation and application of other GASB pronouncements. The guidance in Statement No. 85 is effective for periods beginning after June 15, 2017. Management does not expect this Statement to have a material impact on the School District’s financial statements. Statement No. 86, Accounting for Certain Debt Extinguishment. Statement No. 86 provides guidance for transactions in which cash and other monetary assets acquired with only existing resources, that is, resources other than the proceeds of refunding debt, are placed in an irrevocable trust for the sole purpose of extinguishing debt. Statement No. 86 is effective for reporting periods beginning after June 15, 2017. Management does not expect this Statement to have a material impact on the School District’s financial statements. Statement No. 87, Leases. Statement No. 87 establishes a single approach to accounting for and reporting leases by state and local governments. The GASB based the new standard on the principle that leases are financing of the right to use an underlying asset. Statement No. 87 is effective for reporting periods beginning after December 15, 2019. Management does not expect this Statement to have a material impact on the School District’s financial statements.
58

BASS RIVER TOWNSHIP SCHOOL DISTRICT
NOTES TO THE FINANCIAL STATEMENTS (continued) YEAR ENDED JUNE 30, 2017
Note 2. Deposits and Investments Deposits Custodial Credit Risk – Custodial credit risk is the risk that, in the event of a bank failure, the Board’s deposits may not be recovered. Although the Board does not have a formal policy regarding custodial credit risk, NJSA 17:9-41 et seq. requires that the governmental units shall deposit public funds in public depositories protected from loss under the provisions of GUDPA. Under the Act, the first $250,000 of governmental deposits in each insured depository is protected by FDIC. Public fund owned by the Board in excess of FDIC insured amounts are protected by GUDPA. However, GUDPA does not protect intermingled trust funds such as salary withholdings, student activity fund or other funds that may pass to the Board relative to the happening of a future condition. Such funds are shown as Uninsured and Uncollateralized in the schedule below. As of June 30, 2017, the School District’s bank balance of $250,440 was exposed to custodial credit risk as follows:
Investments The School District had no investments at June 30, 2017. Note 3. Accounts Receivable Accounts receivable at June 30, 2017 consisted of accounts and intergovernmental grants. All receivables are considered collectible in full due to the stable condition of state and federal programs, the current fiscal year guarantee of federal funds and the budgetary control of New Jersey governmental entities. Accounts receivable in the School District’s governmental and business-type activities as of June 30, 2017, consisted of the following:
Insured under FDIC and GUDPA 250,440$ Uninsured and Uncollateralized -
250,440$
Special TotalGeneral Revenue Governmental
Description Fund Fund Activities
Federal Awards -$ 2,099$ 2,099$ State Awards 13,191 - 13,191 Other 6,035 - 6,035
Total 19,226$ 2,099$ 21,325$
Governmental Funds
59

BASS RIVER TOWNSHIP SCHOOL DISTRICT
NOTES TO THE FINANCIAL STATEMENTS (continued) YEAR ENDED JUNE 30, 2017
Note 4. Capital Assets Capital assets activity for the year ended June 30, 2017 was as follows:
Depreciation expense was not allocated among the various functions/programs of the School District. Note 5. Interfund Receivables, Payables and Transfers Individual fund receivables/payables balances at June 30, 2017 are as follows:
The interfund receivables and payables above predominately resulted from payment made by certain funds on behalf of other funds. All interfund balances are expected to be repaid within one year. The School District had no interfund transfers for the year ended June 30, 2017.
Balance BalanceJuly 1, Retirements June 30, 2016 Additions and Transfers 2017
Governmental Activities:Capital Assets being depreciated:
Land Improvements 97,111$ -$ -$ 97,111$ Buildings and Improvements 1,508,445 - - 1,508,445 Equipment 179,546 18,827 (19,636) 178,737
Total Capital Assets being depreciated 1,785,102 18,827 (19,636) 1,784,293
Less: Accumulated Depreciation:Land Improvements (48,749) (4,711) - (53,460) Buildings and Improvements (1,006,452) (28,407) - (1,034,859) Equipment (169,838) (5,654) 19,636 (155,856)
Total Accumulated Depreciation (1,225,039) (38,772) 19,636 (1,244,175)
Total Capital Assets being depreciated, net 560,063 (19,945) - 540,118
Total Governmental Activities CapitalAssets, net 560,063$ (19,945)$ -$ 540,118$
Interfund InterfundFund Receivables Payables
General Fund 6,035$ -$ Payroll Fund - 6,035
6,035$ 6,035$
60

BASS RIVER TOWNSHIP SCHOOL DISTRICT
NOTES TO THE FINANCIAL STATEMENTS (continued) YEAR ENDED JUNE 30, 2017
Note 6. Long-Term Obligations During the fiscal year-ended June 30, 2017 the following changes occurred in long-term obligations for the governmental and business-type activities:
For governmental activities, the compensated absences, capital leases and net pension liability are liquidated by the general fund. Capital Lease Payable On August 15, 2013, the School District entered into a lease purchase agreement in the amount of $80,000 for the purchase of equipment. The lease obligation was issued at an interest rate of 2.700% and matures on September 15, 2017. On July 2, 2014, the School District entered into a lease purchase agreement in the amount of $100,000 for the purchase of equipment and textbooks. The lease obligation was issued at an interest rate of 2.395% and matures on July 15, 2018. On June 15, 2015, the School District entered into a lease purchase agreement in the amount of $100,000 for the construction of a security vestibule. The lease obligation was issued at an interest rate of 2.230% and matures on October 15, 2019. On June 18, 2015, the School District entered into a lease purchase agreement in the amount of $80,000 for the purchase of equipment. The lease obligation was issued at an interest rate of 2.190% and matures on February 1, 2020. On August 1, 2016, the School District entered into a lease purchase agreement in the amount of $80,000 for the purchase of equipment. The lease obligation was issued at an interest rate of 3.907% and matures on November 15, 2020. On April 4, 2017, the School District entered into a lease purchase agreement in the amount of $369,000 for improvements in accordance with an energy savings improvement plan. The lease obligation was issued at an interest rate of 3.220% and matures on September 1, 2032. The future minimum lease payments for these leases is as follows:
BalanceBalance Balance Due Within
July 1, 2016 Additions Reductions June 30, 2017 One YearGovernmental Activities:
Capital Leases 241,390$ 449,000$ 99,976$ 590,414$ 90,309$ Compensated Absences 75,810 46,197 58,499 63,508 - Net Pension Liability 576,963 55,162 - 632,125 -
894,163$ 550,359$ 158,475$ 1,286,047$ 90,309$
61
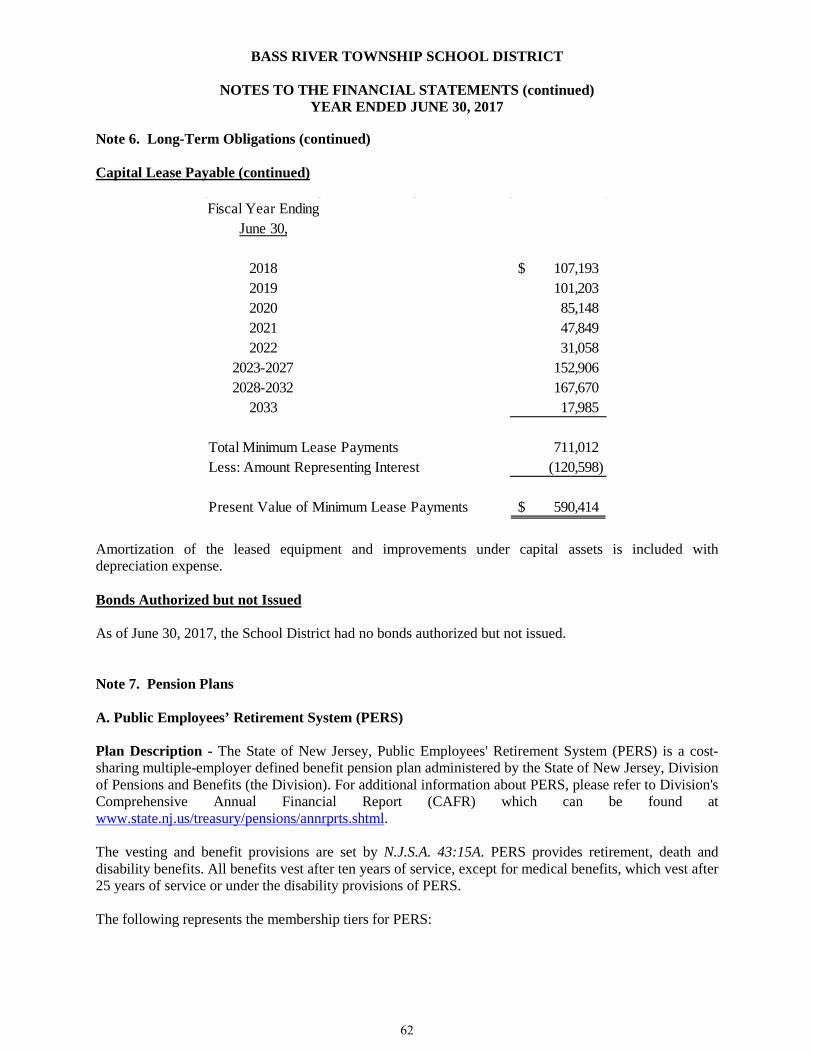
BASS RIVER TOWNSHIP SCHOOL DISTRICT
NOTES TO THE FINANCIAL STATEMENTS (continued) YEAR ENDED JUNE 30, 2017
Note 6. Long-Term Obligations (continued) Capital Lease Payable (continued)
Amortization of the leased equipment and improvements under capital assets is included with depreciation expense. Bonds Authorized but not Issued As of June 30, 2017, the School District had no bonds authorized but not issued. Note 7. Pension Plans A. Public Employees’ Retirement System (PERS) Plan Description - The State of New Jersey, Public Employees' Retirement System (PERS) is a cost-sharing multiple-employer defined benefit pension plan administered by the State of New Jersey, Division of Pensions and Benefits (the Division). For additional information about PERS, please refer to Division's Comprehensive Annual Financial Report (CAFR) which can be found at www.state.nj.us/treasury/pensions/annrprts.shtml. The vesting and benefit provisions are set by N.J.S.A. 43:15A. PERS provides retirement, death and disability benefits. All benefits vest after ten years of service, except for medical benefits, which vest after 25 years of service or under the disability provisions of PERS. The following represents the membership tiers for PERS:
Fiscal Year EndingJune 30,
2018 107,193$ 2019 101,203 2020 85,148 2021 47,849 2022 31,058
2023-2027 152,906 2028-2032 167,670
2033 17,985
Total Minimum Lease Payments 711,012 Less: Amount Representing Interest (120,598)
Present Value of Minimum Lease Payments 590,414$
62

BASS RIVER TOWNSHIP SCHOOL DISTRICT
NOTES TO THE FINANCIAL STATEMENTS (continued) YEAR ENDED JUNE 30, 2017
Note 7. Pension Plans (continued) A. Public Employees’ Retirement System (PERS) (continued) Tier Definition 1 Members who were enrolled prior to July 1, 2007 2 Members who were eligible to enroll on or after July 1, 2007 and prior to November 2, 2008 3 Members who were eligible to enroll on or after November 2, 2008 and prior to May 22, 2010 4 Members who were eligible to enroll on or after May 22, 2010 and prior to June 28, 2011 5 Members who were eligible to enroll on or after June 28, 2011 Service retirement benefits of 1/55th of final average salary for each year of service credit is available to tiers 1 and 2 members upon reaching age 60 and to tier 3 members upon reaching age 62. Service retirement benefits of 1/60th of final average salary for each year of service credit is available to tier 4 members upon reaching age 62 and tier 5 members upon reaching age 65. Early retirement benefits are available to tiers 1 and 2 members before reaching age 60, tiers 3 and 4 before age 62 with 25 or more years of service credit and tier 5 with 30 or more years of service credit before age 65. Benefits are reduced by a fraction of a percent for each month that a member retires prior to the age at which a member can receive full early retirement benefits in accordance with their respective tier. Tier 1 members can receive an unreduced benefit from age 55 to age 60 if they have at least 25 years of service. Deferred retirement is available to members who have at least 10 years of service credit and have not reached the service retirement age for the respective tier. Contributions - The contribution policy for PERS is set by N.J.S.A. 15A and requires contributions by active members and contributing employers. State legislation has modified the amount that is contributed by the State. The State's pension contribution is based on an actuarially determined amount which includes the employer portion of the normal cost and an amortization of the unfunded accrued liability. Funding for noncontributory group insurance benefits is based on actual claims paid. For fiscal year 2016, the State's pension contribution was less than the actuarial determined amount. The local employers' contribution amounts are based on an actuarially determined rate which includes the normal cost and unfunded accrued liability. Chapter 19, P.L. 2009 provided an option for local employers of PERS to contribute 50% of the normal and accrued liability contribution amounts certified for payments due in State fiscal year 2009. Such employers will be credited with the full payment and any such amounts will not be included in their unfunded liability. The actuaries will determine the unfunded liability of those retirement systems, by employer, for the reduced normal and accrued liability contributions provided under this law. This unfunded liability will be paid by the employer in level annual payments over a period of 15 years beginning with the payments due in the fiscal year ended June 30, 2012 and will be adjusted by the rate of return on the actuarial value of assets.
Pension Liability, Pension Expense and Deferred Outflows/Inflows of Resources - At June 30, 2017, the School District reported a liability of $632,125 for its proportionate share of the PERS net pension liability. The net pension liability was measured as of June 30, 2016. The total pension liability used to calculate the net pension liability was determined using update procedures to roll forward the total pension liability from an actuarial valuation as of July 1, 2015, to the measurement date of June 30, 2016. The School District’s proportion of the net pension liability was based on the School District’s actual contributions to the plan relative to the total of all participating employers’ contributions for the year ended June 30, 2016. The School District’s proportion measured as of June 30, 2016, was 0.0025702201%, which was a decrease of 0.0004358994% from its proportion measured as of June 30, 2015.
63

BASS RIVER TOWNSHIP SCHOOL DISTRICT
NOTES TO THE FINANCIAL STATEMENTS (continued) YEAR ENDED JUNE 30, 2017
Note 7. Pension Plans (continued) A. Public Employees’ Retirement System (PERS) (continued) For the year ended June 30, 2017, the School District recognized full accrual pension expense of $43,943 in the government-wide financial statements. This pension expense was based on the pension plans June 30, 2016 measurement date. At June 30, 2017 the School District reported deferred outflows of resources and deferred inflows of resources related to PERS from the following sources:
$20,000 reported as deferred outflows of resources resulting from school district contributions subsequent to the measurement date is estimated based on unadjusted 2016-2017 total salaries for PERS employees multiplied by an employer pension contribution rate of 13.37%. The payable is due on April 1, 2018 and will be recognized as a reduction of the net pension liability in the year ended June 30, 2018. The other amounts reported as deferred outflows of resources and deferred inflows of resources related to pensions will be recognized in pension expense as follows:
Differences between Expected and Actual Experience 11,756$ -$
Changes of Assumptions 130,942 -
Net Difference between Projected and Actual Earnings on Pension Plan Investments 24,103 -
Changes in Proportion and Differences between School District Contributions and Proportionate Share of Contributions 22,544 94,852
School District contributions subsequentto measurement date 20,000 -
209,345$ 94,852$
Deferred Outflows of Resources
Deferred Inflows of Resources
64

BASS RIVER TOWNSHIP SCHOOL DISTRICT
NOTES TO THE FINANCIAL STATEMENTS (continued) YEAR ENDED JUNE 30, 2017
Note 7. Pension Plans (continued) A. Public Employees’ Retirement System (PERS) (continued)
The amortization of the above other deferred outflows of resources and deferred inflows of resources related to pensions will be over the following number of years:
Year EndingJune 30,
2018 23,474$ 2019 23,473 2020 30,141 2021 24,054 2022 (6,649)
94,493$
Deferred DeferredOutflow of Inflow ofResources Resources
Differences between Expected and Actual Experience
Year of Pension Plan Deferral:June 30, 2014 - -June 30, 2015 5.72 -June 30, 2016 5.57 -
Changes of AssumptionsYear of Pension Plan Deferral:June 30, 2014 6.44 -June 30, 2015 5.72 -June 30, 2016 5.57 -
Net Difference between Projected and Actual Earnings on Pension Plan Investments
Year of Pension Plan Deferral:June 30, 2014 5.00 -June 30, 2015 5.00 -June 30, 2016 5.00 -
65

BASS RIVER TOWNSHIP SCHOOL DISTRICT
NOTES TO THE FINANCIAL STATEMENTS (continued) YEAR ENDED JUNE 30, 2017
Note 7. Pension Plans (continued) A. Public Employees’ Retirement System (PERS) (continued) The previous amounts do not include employer specific deferred outflows of resources and deferred inflows of resources related to changes in proportion. These amounts should be recognized (amortized) by each employer over the average of the expected remaining service lives of all plan members, which is 5.57, 5.72 and 6.44 years for the 2016, 2015, and 2014 amounts, respectively. Actuarial Assumptions – The collective total pension liability for the June 30, 2016 measurement date was determined by an actuarial valuation as of July 1, 2015, which was rolled forward to June 30, 2016. This actuarial valuation used the following assumptions:
Pre-retirement mortality rates were based on the RP-2000 Employee Preretirement Mortality Table for male and female active participants. For State employees, mortality tables are set back 4 years for males and females. For local employees, mortality tables are set back 2 years for males and 7 years for females. In addition, the tables provide for future improvements in mortality from the base year of 2013 using a generational approach based on the plan actuary’s modified MP-2014 projection scale. Post-retirement mortality rate were based on the RP-2000 Combined Healthy Male and Female Mortality Tables (setback 1 year for males and females) for service retirements and beneficiaries of former members and a one-year static projection based on the mortality improvement Scale AA. In addition, the tables for service retirements and beneficiaries of former members provide for future improvements in mortality from the base year of 2013 using a generational approach based on the plan actuary’s modified MP-2014 projection scales. Disability retirement rates used to value disabled retirees were based on the RP-2000 Disabled Mortality Table (set back 3 years for males and set forward 1 year for females). The actuarial assumptions used in the July 1, 2015 valuation were based on the results of an actuarial experience study for the period July 1, 2011 to June 30, 2014. It is likely that future experience will not exactly conform to these assumptions. To the extent that actual experience deviates from these assumptions, the emerging liabilities may be higher or lower than anticipated. The more the experience deviates, the larger the impact on future financial statements. In accordance with State statute, the long-term expected rate of return on plan investments (7.65% at June 30, 2016) is determined by the State Treasurer, after consultation with the Directors of the Division of Investments and Division of Pensions and Benefits, the board of trustees and the actuaries. The long-term expected rate of return was determined using a building block method in which best-estimate ranges of expected future real rates of return (expected returns, net of pension plan investment expense and inflation) are developed for each major asset class. These ranges are combined to produce the long-term expected rate of return by weighting the expected future real rates of return by the target asset allocation percentage and by adding expected inflation. Best estimates of arithmetic rates of return for each major asset class included in PERS’s target asset allocation as of June 30, 2016 are summarized in the following table:
Inflation Rate 3.08%
Salary Increases: Through 2026 1.65% - 4.15% Based on Age Thereafter 2.65% - 5.15% Based on Age
Investment Rate of Return 7.65%
66

BASS RIVER TOWNSHIP SCHOOL DISTRICT
NOTES TO THE FINANCIAL STATEMENTS (continued) YEAR ENDED JUNE 30, 2017
Note 7. Pension Plans (continued) A. Public Employees’ Retirement System (PERS) (continued)
Discount Rate - The discount rate used to measure the total pension liability was 3.98% as of June 30, 2016. The single blended discount rate was based on long-term expected rate of return on pension plan investments of 7.65%, and a municipal bond rate of 2.85% as of June 30, 2016 based on the Bond Buyer Go 20-Bond Municipal Bond Index, which includes tax-exempt general obligation municipals bonds with an average rating of AA/Aa or higher. The projection of cash flows used to determine the discount rate assumed that contributions from plan members will be made at the current member contribution rates and that contributions from employers will be made based on the contribution rate in the most recent fiscal year. The State employer contributed 30% of the actuarially determined contributions and the local employers contributed 100% of their actuarially determined contributions. Based on those assumptions, the plan’s fiduciary net position was projected to be available to make projected future benefit payments of current plan members through 2034. Therefore, the long-term expected rate of return on plan investments was applied to projected benefit payments through 2034 and the municipal bond rate was applied to projected benefit payments after that date in determining the total pension liability. Sensitivity of the School District’s proportionate share of the Net Pension Liability to Changes in the Discount Rate - The following presents the School District’s proportionate share of the net pension liability as of June 30, 2016, calculated using the discount rate of 3.98% as well as what the School District’s proportionate share of the net pension liability would be if it were calculated using a discount rate that is 1-percentage point lower or 1-percentage point higher than the current rate:
Long-TermTarget Expected Real
Asset Class Allocation Rate of Return
Cash 5.00% 0.87%U.S. Treasuries 1.50% 1.74%Investment grade credit 8.00% 1.79%Mortgages 2.00% 1.67%High Yield Bonds 2.00% 4.56%Inflation-Indexed Bonds 1.50% 3.44%Broad U.S. Equities 26.00% 8.53%Developed Foreign Equities 13.25% 6.83%Emerging Market Equities 6.50% 9.95%Private Equity 9.00% 12.40%Hedge Funds/Absolute Return 12.50% 4.68%Real Estate (Property) 2.00% 6.91%Commodities 0.50% 5.45%Global debt ex U.S. 5.00% -0.25%REIT 5.25% 5.63%
67

BASS RIVER TOWNSHIP SCHOOL DISTRICT
NOTES TO THE FINANCIAL STATEMENTS (continued) YEAR ENDED JUNE 30, 2017
Note 7. Pension Plans (continued) A. Public Employees’ Retirement System (PERS) (continued)
Additional Information - The following is a summary of the collective balances of the local group at June 30, 2017 and 2016:
B. Teachers’ Pension and Annuity Fund (TPAF) Plan Description - The State of New Jersey, Teachers' Pension and Annuity Fund (TPAF) is a cost sharing multiple-employer defined benefit pension plan with a special-funding situation, by which the State of New Jersey (the State) is responsible to fund 100% of the employer contributions, excluding any local employer early retirement incentive (ERI) contributions. TPAF is administered by the State of New Jersey, Division of Pensions and Benefits (the Division). For additional information about TPAF, please refer to Division's Comprehensive Annual Financial Report (CAFR) which can be found at www.state.nj.us/treasury/pensions/annrprts.shtml. The vesting and benefit provisions are set by N.J.S.A. 18A:66. TPAF provides retirement, death and disability benefits. All benefits vest after ten years of service, except for medical benefits, which vest after 25 years of service or under the disability provisions of TPAF. Members are always fully vested for their own contributions and, after three years of service credit, become vested for 2% of related interest earned on the contributions. In the case of death before retirement, members' beneficiaries are entitled to full interest credited to the members' accounts. The following represents the membership tiers for TPAF:
At 1% At Current At 1%Decrease Discount Rate Increase(2.98%) (3.98%) (4.98%)
School District's Proportionate Share of the Net Pension Liability 774,595$ 632,125$ 514,503$
06/30/17 06/30/16
Collective Deferred Outflows of Resources 7,815,204,785$ 2,946,265,815$ Collective Deferred Inflows of Resources -$ 360,920,604$ Collective Net Pension Liability 29,617,131,759$ 22,447,996,119$
0.00213% 0.00257%School District's portion
68

BASS RIVER TOWNSHIP SCHOOL DISTRICT
NOTES TO THE FINANCIAL STATEMENTS (continued) YEAR ENDED JUNE 30, 2017
Note 7. Pension Plans (continued) B. Teachers’ Pension and Annuity Fund (TPAF) (continued) Tier Definition 1 Members who were enrolled prior to July 1, 2007 2 Members who were eligible to enroll on or after July 1, 2007 and prior to November 2, 2008 3 Members who were eligible to enroll on or after November 2, 2008 and prior to May 22, 2010 4 Members who were eligible to enroll on or after May 22, 2010 and prior to June 28, 2011 5 Members who were eligible to enroll on or after June 28, 2011 Service retirement benefits of 1/55th of final average salary for each year of service credit is available to tiers 1 and 2 members upon reaching age 60 and to tier 3 members upon reaching age 62. Service retirement benefits of 1/60th of final average salary for each year of service credit is available to tier 4 members upon reaching age 62 and tier 5 members upon reaching age 65. Early retirement benefits are available to tiers 1 and 2 members before reaching age 60, tiers 3 and 4 before age 62 with 25 or more years of service credit, and tier 5 before age 65 with 30 or more years of service credit. Benefits are reduced by a fraction of a percent for each month that a member retires prior to the retirement age for his/her respective tier. Deferred retirement is available to members who have at least 10 years of service credit and have not reached the service retirement age for the respective tier. Contributions - The contribution policy for TPAF is set by N.J.S.A 18A:66 and requires contributions by active members and contributing employers. Pursuant to the provisions of Chapter 78, P.L. 2011, the active member contribution rate increased from 5.5% of annual compensation to 6.5% plus an additional 1% phased-in over 7 years beginning in July 2012. The member contribution rate was 7.2% in State fiscal year 2017. The State's pension contribution is based on an actuarially determined amount which includes the employer portion of the normal cost and an amortization of the unfunded accrued liability. Funding for noncontributory group insurance benefits is based on actual claims paid. For fiscal year 2016, the State's pension contribution was less than the actuarial determined amount. As mentioned previously, the employer contributions for local participating employers are legally required to be funded by the State in accordance with N.J.S.A 18:66-33. Therefore, the School District is considered to be in a special funding situation as defined by GASB Statement No. 68 and the State is treated as a nonemployer contributing entity. Since the School District does not contribute directly to the plan (except for employer specific financed amounts), there is no net pension liability or deferred outflows or inflows to report in the financial statements of the local participating employers. Pension Liability and Pension Expense - The State’s proportionate share of the TPAF net pension liability, attributable to the School District as of June 30, 2016 was $9,073,138. The School District’s proportionate share was $0. The net pension liability was measured as of June 30, 2016, and the total pension liability used to calculate the net pension liability was determined by an actuarial valuation as of July 1, 2015, which was rolled forward to June 30, 2016. The State’s proportionate share of the net pension liability associated with the District was based on projection of the State’s long-term contributions to the pension plan associated with the District relative to the projected contributions by the State associated with all participating school districts, actuarially determined. At June 30, 2016, the State proportionate share of the TPAF net pension liability attributable to the School District was 0.0115336943%, which was an increase of 0.0015051465% from its proportion measured as of June 30, 2015.
69

BASS RIVER TOWNSHIP SCHOOL DISTRICT
NOTES TO THE FINANCIAL STATEMENTS (continued) YEAR ENDED JUNE 30, 2017
Note 7. Pension Plans (continued) B. Teachers’ Pension and Annuity Fund (TPAF) (continued) For the fiscal year ended June 30, 2017, the School District recognized $681,720 in on-behalf pension expense and revenue in the government-wide financial statements, for the State of New Jersey on-behalf TPAF pension contributions. This pension expense and revenue was based on the pension plans June 30, 2016 measurement date. Actuarial Assumptions – The total pension liability for the June 30, 2016 measurement date was determined by an actuarial valuation as of July 1, 2015, which was rolled forward to June 30, 2016. This actuarial valuation used the following actuarial assumptions, applied to all periods in the measurement:
Pre-retirement, post-retirement and disabled mortality rates were based on the experience of TPAF members reflecting mortality improvement on generational basis based on a 60-year average of Social Security data from 1953 to 2013. The actuarial assumptions used in the July 1, 2015 valuation were based on the results of an actuarial experience study for the period July 1, 2012 to June 30, 2015. Long-Term Expected Rate of Return - In accordance with State statute, the long-term expected rate of return on plan investments (7.65% at June 30, 2016) is determined by the State Treasurer, after consultation with the Directors of the Division of Investments and Division of Pensions and Benefits, the board of trustees and the actuaries. The long-term expected rate of return was determined using a building block method in which best-estimate ranges of expected future real rates of return (expected returns, net of pension plan investment expense and inflation) are developed for each major asset class. These ranges are combined to produce the long-term expected rate of return by weighting the expected future real rates of return by the target asset allocation percentage and by adding expected inflation. Best estimates of arithmetic real rates of return for each major asset class included in TPAF's target asset allocation as of June 30, 2016 are summarized in the following table:
Inflation Rate 2.50%
Salary Increases: 2012-2021 Varies based on experience Thereafter Varies based on experience
Investment Rate of Return 7.65%
70

BASS RIVER TOWNSHIP SCHOOL DISTRICT
NOTES TO THE FINANCIAL STATEMENTS (continued) YEAR ENDED JUNE 30, 2017
Note 7. Pension Plans (continued) B. Teachers’ Pension and Annuity Fund (TPAF) (continued)
Discount Rate - The discount rate used to measure the total pension liability was 3.22% as of June 30, 2016. The single blended discount rate was based on long-term expected rate of return on pension plan investments of 7.65%, and a municipal bond rate of 2.85% as of June 30, 2016, based on the Bond Buyer Go 20-Bond Municipal Bond Index which includes tax-exempt general obligation municipals bonds with an average rating of AA/Aa or higher. The projection of cash flows used to determine the discount rate assumed that contributions from plan members will be made at the current member contribution rates and that contributions from employers will be made based on the contribution rate in the most recent fiscal year. The State contributed 30% of the actuarially determined contributions. Based on those assumptions, the plan’s fiduciary net position was projected to be available to make projected future benefit payments of current plan members through 2029. Therefore, the long-term expected rate of return on plan investments was applied to projected benefit payments through 2029, and the municipal bond rate was applied to projected benefit payments after that date in determining the total pension liability. Sensitivity of the School District’s proportionate share of the Net Pension Liability to Changes in the Discount Rate – As previously mentioned, TPAF has a special funding situation where the State pays 100% of the School District’s annual required contribution. The following represents the State’s proportionate share of the net pension liability, attributable to the School District calculated using the discount rate of 3.22% as well as what the State’s proportionate share of the net pension liability, attributable to the School District’s would be if it were calculated using a discount rate that is 1-percentage point lower or 1-percentage point higher than the current rate:
Long-TermTarget Expected Real
Asset Class Allocation Rate of Return
Cash 5.00% 0.39%U.S. Government Bonds 1.50% 1.28%U.S. Credit Bonds 13.00% 2.76%U.S. Mortgages 2.00% 2.38%U.S. Inflation-Indexed Bonds 1.50% 1.41%U.S. High Yield Bonds 2.00% 4.70%U.S. Equity Market 26.00% 5.14%Foreign Developed Equity 13.25% 5.91%Emerging Market Equities 6.50% 8.16%Private Real Estate Property 5.25% 3.64%Timber 1.00% 3.86%Farmland 1.00% 4.39%Private Equity 9.00% 8.97%Commodities 0.50% 2.87%Hedge Funds - MultiStrategy 5.00% 3.70%Hedge Funds - Equity Hedge 3.75% 4.72%Hedge Funds - Distressed 3.75% 3.49%
71

BASS RIVER TOWNSHIP SCHOOL DISTRICT
NOTES TO THE FINANCIAL STATEMENTS (continued) YEAR ENDED JUNE 30, 2017
Note 7. Pension Plans (continued) B. Teachers’ Pension and Annuity Fund (TPAF) (continued)
Pension Plan Fiduciary Net Position - For purposes of measuring the net pension liability, deferred outflows of resources and deferred inflows of resources related to pensions, and pension expense, information about the fiduciary net position of the Teachers Pension and Annuity Fund (TPAF) and additions to/deductions from the TPAF’s fiduciary net position have been determined on the same basis as they are reported by the TPAF. For this purpose, benefit payments (including refunds of employee contributions) are recognized when due and payable in accordance with the benefit terms. Investments are reported at fair value. C. Defined Contribution Plan (DCRP) Plan Description - The Defined Contribution Retirement Program (DCRP) was established July 1, 2007, under the provisions of N.J.S.A. 43:15C-1 et seq. The DCRP provides eligible members with a tax-sheltered, defined contribution retirement benefit, along with life insurance and disability coverage Individuals eligible for membership in the DCRP include:
• State or local officials who are elected or appointed on or after July 1, 2007;
• Employees enrolled in the Public Employees’ Retirement System (PERS) or Teachers’ Pension and Annuity Fund (TPAF) on or after July 1, 2007, who earn salary in excess of established “maximum compensation” limits;
• Employees enrolled in the Police and Firemen’s Retirement System (PFRS) or State Police
Retirement System (SPRS) after May 21, 2010, who earn salary in excess of established “maximum compensation” limits;
• Employees otherwise eligible to enroll in the PERS or TPAF on or after November 2, 2008, who
do not earn the minimum annual salary for PERS or TPAF Tier 3 enrollment but who earn salary of at least $5,000 annually. The minimum salary in 2017 is $8,300 and is subject to adjustment in future years.
• Employees otherwise eligible to enroll in the PERS or TPAF after May 21, 2010, who do not
work the minimum number of hours per week required for PERS or TPAF Tier 4 or Tier 5 enrollment but who earn salary of at least $5,000 annually. The minimum number is 35 hours per week for State employees, or 32 hours per week for local government or local educations employees.
At 1% At Current At 1%Decrease Discount Rate Increase(2.22%) (3.22%) (4.22%)
State of New Jersey's Proportionate Share of Net Pension Liability associated with the School District 10,835,354$ 9,073,138$ 7,634,061$
72

BASS RIVER TOWNSHIP SCHOOL DISTRICT
NOTES TO THE FINANCIAL STATEMENTS (continued) YEAR ENDED JUNE 30, 2017
Note 7. Pension Plans (continued) C. Defined Contribution Plan (DCRP) (continued) Contributions - The contribution policy is set by N.J.S.A. 43:15C-3 and requires active members and contribution employers. When enrolled in the DCRP, members are required to contribute 5.5% of their base salary to a tax-deferred investment account established with Prudential Financial, which jointly administers the DCRP investments with the Division of Pension and Benefits. Member contributions are matched by a 3% contribution from the School District. For the year ended June 30, 2017, employee contributions totaled $1,321, and the School District recognized an expense for payments made to the Defined Contribution Retirement program in the amount of $650. Note 8. State Post-Retirement Medical Benefits P.L. 1987, c. 384 and P.L. 1990, c.6 required Teachers’ Pensions and Annuity Fund (TPAF) and the Public Employees’ Retirement System (PERS), respectively, to fund post-retirement medical benefits for those state employees who retire after accumulating 25 years of credited service or on a disability retirement. P.L. 2007, c.103 amended the law to eliminate the funding of post-retirement medical benefits through the TPAF and PERS. It created separate funds outside of the pension plans for the funding and payment of post-retirement medical benefits for retired State employees and retired educational employees. As of June 30, 2016, there were 110,512 retirees receiving post-retirement medical benefits, and the State contributed $1.37 billion on their behalf. The cost of these benefits is funded through contributions by the State in accordance with P.L. 1994, c.62. Funding of post-retirement medical benefits changed from a pre-funding basis to a pay-as-you-go basis beginning in Fiscal Year 1994. The State is also responsible for the cost attributable to P.L. 1992, c.126, which provides employer paid health benefits to members of PERS and the Alternate Benefit Program (APB) who retired from a board of education or county college with 25 years of service. The State paid $231.2 million toward Chapter 126 benefits for 20,045 eligible retired members in Fiscal Year 2016. The School Employees Health Benefits Program (SEHBP) Act is found in New Jersey Statutes Annotated, Title 52, Article 17.25 et. seq. Rules governing the operation and administration of the program are found in Title 17, Chapter 9 of the New Jersey Administrative Code. The State of New Jersey Division of Pensions and Benefits issues a publicly available financial report that includes financial statements and required supplementary information for SEHBP. That report may be obtained from the Treasury website at: http://www.nj.gov/treasury/pensions/pdf/financial/2015divisioncombined.pdf Note 9. On-Behalf Payments for Fringe Benefits and Salaries As previously mentioned, the School District receives on-behalf payments from the State of New Jersey for normal costs and post-retirement medical costs related to the Teachers’ Pension and Annuity Fund (TPAF) pension plan. The School District is not legally responsible for these contributions. The on-behalf payments are recorded as revenues and expenditures in the government-wide and general fund financial statements. For the fiscal year ended June 30, 2017, the on-behalf payments for normal costs, post-retirement medical costs, and long-term disability were $124,245, $103,525 and $365, respectively.
73

BASS RIVER TOWNSHIP SCHOOL DISTRICT
NOTES TO THE FINANCIAL STATEMENTS (continued) YEAR ENDED JUNE 30, 2017
Note 10. Risk Management The School District is exposed to various risks of loss related to torts; theft of, damage to, and destruction of assets; errors and omissions; injuries to employees; and natural disasters.
New Jersey Unemployment Compensation Insurance – The School District has elected to fund its New Jersey Unemployment Compensation Insurance under the “Benefit Reimbursement Method”. Under this plan the School District is required to reimburse the New Jersey Unemployment Trust Fund for benefits paid to its former employees and charged to its account with the State. The School District is billed quarterly for amounts due to the State. The following is a summary of School District contributions, reimbursements to the State for benefits paid and the ending balance of the School District’s trust fund for the current and previous two years:
Property and Liability Insurance – The School District maintains commercial insurance coverage for property, liability, student accident and surety bonds. A complete schedule of insurance coverage can be found in the Statistical Section of this Comprehensive Annual Financial Report. Joint Insurance Pool – The School District also participates in the New Jersey Schools Insurance Group and public entity risk pool. The Pool provides its members with the following coverage:
Property – Blanket Building & Grounds General & Automobile Liability Environmental Impairment Liability Workers’ Compensation School Board Legal Liability Excess Liability Employers Liability Comprehensive Crime Coverage Note 11. Contingencies State and Federal Grantor Agencies - The School District participates in numerous state and federal grant programs, which are governed by various rules and regulations of the grantor agencies; therefore, to the extent that the School District has not complied with the rules and regulations governing the grants, refunds of any money received may be required and the collectability of any related receivable at June 30, 2017 may be impaired. In the opinion of the School District, there are no significant contingent liabilities relating to compliance with the rules and regulations governing the respective grants; therefore, no provisions have been recorded in the accompanying combined financial statements for such contingencies.
Interest Amount EndingFiscal Year Earnings Reimbursed Balance
2016-2017 34$ 99$ 26,099$ 2015-2016 34 149 26,164 2014-2015 34 58 26,279
74

BASS RIVER TOWNSHIP SCHOOL DISTRICT
NOTES TO THE FINANCIAL STATEMENTS (continued) YEAR ENDED JUNE 30, 2017
Note 11. Contingencies (continued) Litigation – The School District is a defendant in various lawsuits. Although the outcome of these lawsuits is not presently determinable, it is the opinion of the School Districts’ attorney that resolution of these matters will not have a material adverse effect on the financial condition of the School District. Economic Dependency – The School District receives a substantial amount of its support from federal and state governments. A significant reduction in the level of support, if this were to occur, could have an effect on the School District’s programs and activities. Note 12. Deferred Compensation The School District offers its employees a choice of the following deferred compensation plans created in accordance with Internal Revenue Code Section 403(b) and 457. The plans, which are administered by the entities listed below, permits participants to defer a portion of their salary until future years. Amounts deferred under the plans are not available to employees until termination, retirement, death or unforeseeable emergency. The plan administrators are as follows:
AXA Equitable Northwestern Mutual
Valic Investments Wells Fargo
Note 13. Compensated Absences The School District accounts for compensated absences (e.g., unused vacation, sick leave) as directed by Governmental Accounting Standards Board Statement No. 16 (GASB 16), “Accounting for Compensated Absences”. A liability for compensated absences attributable to services already rendered and not contingent on a specific event that is outside the control of the employer and employee is accrued as employees earn the rights to the benefits. School District employees are granted varying amount of vacation and sick leave in accordance with the School District's personnel policies. Upon termination, employees are paid for accrued vacation. The School District policy permits employees to accumulate unused sick leave and carry forward the full amount to subsequent years. Upon retirement employees shall be paid by the School District for the unused sick leave in accordance with School Districts’ agreements with the various employee unions. The liability for vested compensated absences of the governmental fund types is recorded in the Statement of Net Position. At June 30, 2017, the liability for compensated absences reported on the government-wide Statement of Net Position was $63,509.
75

BASS RIVER TOWNSHIP SCHOOL DISTRICT
NOTES TO THE FINANCIAL STATEMENTS (continued) YEAR ENDED JUNE 30, 2017
Note 14. Tax Abatements As defined by the Governmental Accounting Standards Board (GASB) Statement No. 77, a tax abatement is an agreement between a government and an individual or entity in which the government promises to forgo tax revenues and the individual or entity promises to subsequently take a specific action that contributes to economic development or otherwise benefits the government or its citizens. School districts are not authorized by New Jersey statute to enter into tax abatement agreements. However, the county or municipality in which the school district is situated may have entered into tax abatement agreements, and that potential must be disclosed in these financial statements. If the county or municipality entered into tax abatement agreements, those agreements will not directly affect the school district’s local tax revenue because N.J.S.A. 54:4-75 and N.J.S.A. 54:4-76 require that amounts so forgiven must effectively be recouped from other taxpayers and remitted to the school district. For a local school district board of education or board of school estimate that has elected to raise their minimum tax levy using the required local share provisions at N.J.S.A. 18A:7F-5(b), the loss of revenue resulting from the municipality or county having entered into a tax abatement agreement is indeterminate due to the complex nature of the calculation of required local share performed by the New Jersey Department of Education based upon district property value and wealth. Note 15. Commitments The School District has contractual commitments at June 30, 2017 to various vendors, which are recorded in the general fund as assigned to other purposes in the amount of $18,240. Note 16. Calculation of Excess Surplus The designation for Restricted Fund Balance – Excess Surplus is a required calculation pursuant to N.J.S.A.18A:7F-7. New Jersey school districts are required to reserve General Fund fund balance at the fiscal year-end of June 30 if they did not appropriate a required minimum amount as budgeted fund balance in their subsequent years’ budget. The School District had no excess fund balance at June 30, 2017. Note 17. Fund Balances General Fund – Of the $97,358 General Fund fund balance at June 30, 2017, $18,240 has been assigned to other purposes; $57,734 has been assigned and included as anticipated revenue for the year ending June 30, 2018; and $21,384 has been unassigned. Capital Projects Fund – Of the $369,000 Capital Projects Fund fund balance at June 30, 2017, $369,000 is restricted for future capital projects approved by the School District.
76

BASS RIVER TOWNSHIP SCHOOL DISTRICT
NOTES TO THE FINANCIAL STATEMENTS (continued) YEAR ENDED JUNE 30, 2017
Note 18. Deficit in Net Position Unrestricted Net Position – The School District governmental activities had a deficit in unrestricted net position in the amount of $510,512 at June 30, 2017. The primary causes of this deficit is the School District not recognizing the receivable for the last two state aid payments and the recording of the net pension liability for the Public Employee’s Retirement System (PERS) as of June 30, 2017. This deficit in unrestricted net position for governmental activities does not indicate that the School District is facing financial difficulties. Note 19. Subsequent Events The District has evaluated subsequent events occurring after June 30, 2017 through the date of October 18, 2017, which is the date the financial statements were available to be issued. The District noted the following: On July 14, 2017 the School District received a revised state aid notice from that State of New Jersey for its budget for the year ended June 30, 2018. This revised notice included a decrease in the School District’s state aid of $17,734. The New Jersey Department of Education authorized school districts that received a decrease in state aid to transfer additional unassigned general fund surplus into the budget for the year ended June 30, 2018. The School District approved a resolution dated July 25, 2017 to transfer additional unassigned general fund surplus in the amount of $17,734 into the budget to compensate for the decrease in state aid.
77

This page intentionally left blank.
78

REQUIRED SUPPLEMENTARY INFORMATION - PART II
79

This page intentionally left blank
80

C. Budgetary Comparison Schedules
81

This page intentionally left blank
82

EXHIBIT C-1
POSITIVE/(NEGATIVE)
ACCOUNT ORIGINAL BUDGET FINAL FINAL TONUMBERS BUDGET TRANSFERS BUDGET ACTUAL ACTUAL
Revenues: Local Sources: Local Tax Levy 10-1210 1,455,596$ -$ 1,455,596$ 1,455,596$ -$ Miscellaneous 10-1990 - - - 6,334 6,334
Total Local Sources 1,455,596 - 1,455,596 1,461,930 6,334
State Sources: Categorical Transportation Aid 10-3121 25,972 - 25,972 25,972 - Categorical Special Education Aid 10-3132 67,203 - 67,203 67,203 - Equalization Aid 10-3176 638,484 - 638,484 638,484 - Categorical Security Aid 10-3177 22,124 - 22,124 22,124 - Adjustment Aid 10-3178 129,586 - 129,586 129,586 - PARCC Readiness Aid 10-3181 1,150 - 1,150 1,150 - Per Pupil Growth Aid 10-3182 1,150 - 1,150 1,150 - Professional Learning Community Aid 10-3183 1,030 - 1,030 1,030 - Extraordinary Aid 10-3131 - - - 6,048 6,048 Non-Public Transportation Aid 10-3121 - - - 174 174 On-Behalf TPAF Pension Contribution (Nonbudgeted): Normal Cost 10-3901 - - - 124,245 124,245 Post-Retirement Medical 10-3901 - - - 103,525 103,525 Long-Term Disability Insurance 10-3901 - - - 365 365 Reimbursed TPAF Social Security (Nonbudgeted) 10-3902 - - - 76,859 76,859
Total State Sources 886,699 - 886,699 1,197,915 311,216
Total Revenues 2,342,295 - 2,342,295 2,659,845 317,550
Expenditures: Current Expense: Instruction - Regular Programs: Preschool - Salaries of Teachers 11-105-100-101 35,261 (4,002) 31,259 31,259 - Kindergarten - Salaries of Teachers 11-110-100-101 66,504 586 67,090 67,089 1 Grades 1-5 - Salaries of Teachers 11-120-100-101 471,859 (32,217) 439,642 439,641 1 Grades 6-8 - Salaries of Teachers 11-130-100-101 67,186 3,269 70,455 70,455 - Home Instruction - Regular Programs: Salaries of Teachers 11-150-100-101 1,500 (1,500) - - - Undistributed - Regular Programs: Other Salaries for Instruction 11-190-100-106 80,991 1,831 82,822 82,821 1 Purchased Technical Services 11-190-100-320 500 - 500 - 500 Other Purchased Services - (400-500 Series) 11-190-100-500 89,300 (244) 89,056 86,218 2,838 General Supplies 11-190-100-610 26,499 (56) 26,443 22,117 4,326 Textbooks 11-190-100-640 500 - 500 266 234 Other Objects 11-190-100-800 2,847 - 2,847 540 2,307
Total Regular Programs 842,947 (32,333) 810,614 800,406 10,208
JUNE 30, 2017
BASS RIVER TOWNSHIP SCHOOL DISTRICT
BUDGETARY COMPARISON SCHEDULEGENERAL FUND
FOR THE FISCAL YEAR ENDED JUNE 30, 2017
83
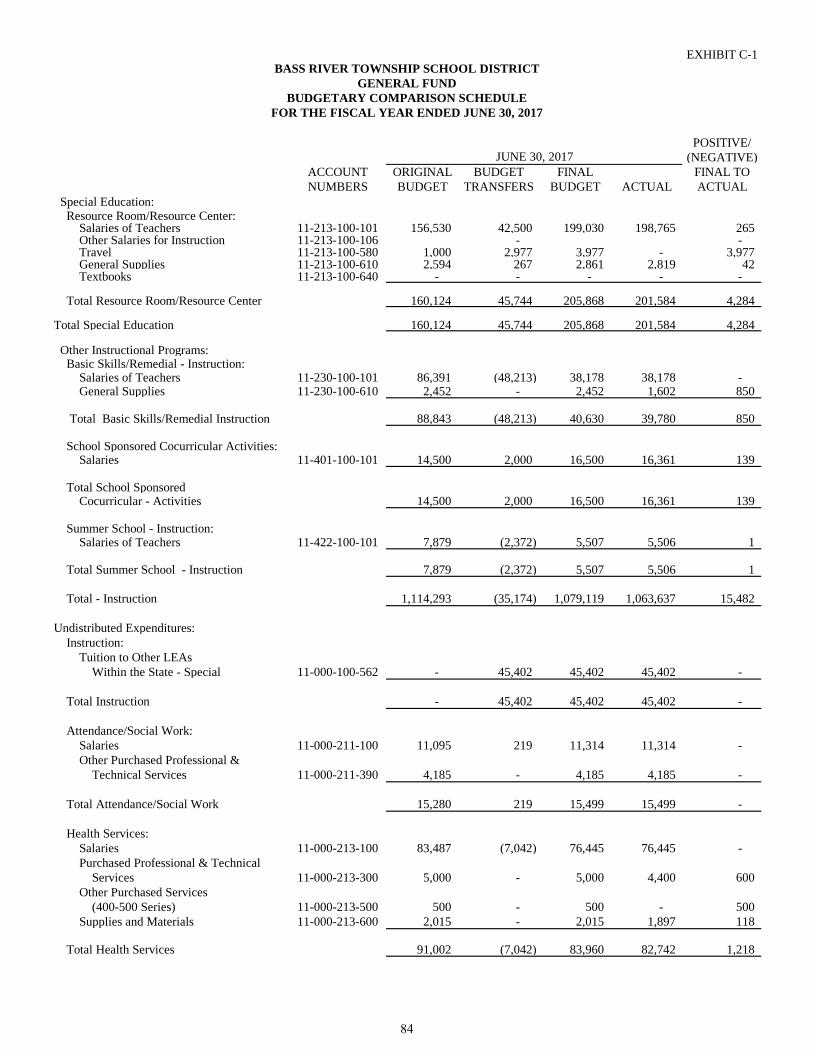
EXHIBIT C-1
POSITIVE/(NEGATIVE)
ACCOUNT ORIGINAL BUDGET FINAL FINAL TONUMBERS BUDGET TRANSFERS BUDGET ACTUAL ACTUAL
JUNE 30, 2017
BASS RIVER TOWNSHIP SCHOOL DISTRICT
BUDGETARY COMPARISON SCHEDULEGENERAL FUND
FOR THE FISCAL YEAR ENDED JUNE 30, 2017
Special Education: Resource Room/Resource Center: Salaries of Teachers 11-213-100-101 156,530 42,500 199,030 198,765 265 Other Salaries for Instruction 11-213-100-106 - - Travel 11-213-100-580 1,000 2,977 3,977 - 3,977 General Supplies 11-213-100-610 2,594 267 2,861 2,819 42 Textbooks 11-213-100-640 - - - - -
Total Resource Room/Resource Center 160,124 45,744 205,868 201,584 4,284
Total Special Education 160,124 45,744 205,868 201,584 4,284
Other Instructional Programs: Basic Skills/Remedial - Instruction: Salaries of Teachers 11-230-100-101 86,391 (48,213) 38,178 38,178 - General Supplies 11-230-100-610 2,452 - 2,452 1,602 850
Total Basic Skills/Remedial Instruction 88,843 (48,213) 40,630 39,780 850
School Sponsored Cocurricular Activities: Salaries 11-401-100-101 14,500 2,000 16,500 16,361 139
Total School Sponsored Cocurricular - Activities 14,500 2,000 16,500 16,361 139
Summer School - Instruction: Salaries of Teachers 11-422-100-101 7,879 (2,372) 5,507 5,506 1
Total Summer School - Instruction 7,879 (2,372) 5,507 5,506 1
Total - Instruction 1,114,293 (35,174) 1,079,119 1,063,637 15,482
Undistributed Expenditures: Instruction: Tuition to Other LEAs Within the State - Special 11-000-100-562 - 45,402 45,402 45,402 -
Total Instruction - 45,402 45,402 45,402 -
Attendance/Social Work: Salaries 11-000-211-100 11,095 219 11,314 11,314 - Other Purchased Professional & Technical Services 11-000-211-390 4,185 - 4,185 4,185 -
Total Attendance/Social Work 15,280 219 15,499 15,499 -
Health Services: Salaries 11-000-213-100 83,487 (7,042) 76,445 76,445 - Purchased Professional & Technical Services 11-000-213-300 5,000 - 5,000 4,400 600 Other Purchased Services (400-500 Series) 11-000-213-500 500 - 500 - 500 Supplies and Materials 11-000-213-600 2,015 - 2,015 1,897 118
Total Health Services 91,002 (7,042) 83,960 82,742 1,218
84

EXHIBIT C-1
POSITIVE/(NEGATIVE)
ACCOUNT ORIGINAL BUDGET FINAL FINAL TONUMBERS BUDGET TRANSFERS BUDGET ACTUAL ACTUAL
JUNE 30, 2017
BASS RIVER TOWNSHIP SCHOOL DISTRICT
BUDGETARY COMPARISON SCHEDULEGENERAL FUND
FOR THE FISCAL YEAR ENDED JUNE 30, 2017
Other Support Services - Students - Related Services: Purchased Professional & Educational Services 11-000-216-320 15,000 - 15,000 12,455 2,545
Total Other Support Services - Students - Related Services 15,000 - 15,000 12,455 2,545
Other Support Services - Students - Special Services: Salaries of Other Professional Staff 11-000-219-104 51,030 (3,843) 47,187 47,186 1 Salaries of Secretarial & Clerical Assistants 11-000-219-105 14,685 490 15,175 15,175 - Purchased Professional - Educational Services 11-000-219-320 9,000 12,381 21,381 21,381 - Other Purchased Services - (400-500 Series) 11-000-219-592 - 460 460 - 460 Supplies and Materials 11-000-219-600 1,000 897 1,897 1,894 3
Total Other Support Services - Students - Special Services 75,715 10,385 86,100 85,636 464
Improvement of Instruction Services: Salaries of Secretarial & Clerical Assistants 11-000-221-105 36,327 (1,812) 34,515 34,515 - Purchased Professional - Educational Services 11-000-221-320 3,500 (200) 3,300 2,625 675 Supplies & Materials 11-000-221-600 100 200 300 204 96
Total Improvement of Instruction Services 39,927 (1,812) 38,115 37,344 771
Educational Media Services/School Library: Purchased Professional & Technical Services 11-000-222-300 20,600 - 20,600 20,202 398 Supplies and Materials 11-000-222-600 8,000 (1,700) 6,300 6,146 154
Total Educational Media Services/School Library 28,600 (1,700) 26,900 26,348 552
Instructional Staff Training Services: Purchased Professional - Educational Services 11-000-223-320 2,000 (1,500) 500 361 139
Total Instructional Staff Training Services 2,000 (1,500) 500 361 139
Support Services General Administration: Salaries 11-000-230-100 58,993 700 59,693 59,693 - Legal Services 11-000-230-331 8,200 (500) 7,700 2,805 4,895 Audit Fees 11-000-230-332 12,500 500 13,000 13,000 - Other Purchased Professional Services 11-000-230-339 5,500 6,513 12,013 11,804 209 Communications/Telephone 11-000-230-530 10,000 600 10,600 10,546 54 Other Purchased Services - (400-500 ) 11-000-230-590 3,000 - 3,000 2,995 5 General Supplies 11-000-230-610 7,000 (880) 6,120 5,673 447 Miscellaneous 11-000-230-890 1,600 880 2,480 2,428 52 BOE Membership Dues & Fees 11-000-230-895 1,975 - 1,975 1,878 97
Total Support Services General Administration 108,768 7,813 116,581 110,822 5,759
85

EXHIBIT C-1
POSITIVE/(NEGATIVE)
ACCOUNT ORIGINAL BUDGET FINAL FINAL TONUMBERS BUDGET TRANSFERS BUDGET ACTUAL ACTUAL
JUNE 30, 2017
BASS RIVER TOWNSHIP SCHOOL DISTRICT
BUDGETARY COMPARISON SCHEDULEGENERAL FUND
FOR THE FISCAL YEAR ENDED JUNE 30, 2017
Support Services School Administration: Salaries of Principals & Assistant Principals 11-000-240-103 58,993 - 58,993 58,993 - Salaries of Secretarial & Clerical Assistants 11-000-240-105 7,397 418 7,815 7,815 - Supplies and Materials 11-000-240-600 2,000 - 2,000 1,300 700 Other Objects 11-000-240-800 - 300 300 - 300
Total Support Services School Administration 68,390 718 69,108 68,108 1,000
Central Services: Salaries 11-000-251-100 3,060 - 3,060 3,000 60 Purchased Professional Services 11-000-251-330 29,200 2,031 31,231 31,231 - Supplies & Materials 11-000-251-600 700 (583) 117 116 1 Other Objects 11-000-251-890 1,700 (321) 1,379 1,379 -
Total Central Services 34,660 1,127 35,787 35,726 61
Required Maintenance for School Facilities: Cleaning, Repair & Maintenance Services 11-000-261-420 18,000 1,600 19,600 13,770 5,830 General Supplies 11-000-261-610 11,000 (1,600) 9,400 5,463 3,937
Subtotal Allowable Maintenance for School Facilities 29,000 - 29,000 19,233 9,767
Custodial Services: Salaries 11-000-262-100 86,167 5,778 91,945 91,944 1 Purchased Professional & Technical Service 11-000-262-300 1,000 551 1,551 651 900 Cleaning, Repair & Maintained Service 11-000-262-420 12,000 1,600 13,600 11,103 2,497 Other Purchased Property Service 11-000-262-490 2,000 - 2,000 - 2,000 Insurance 11-000-262-520 18,850 - 18,850 18,496 354 Travel 11-000-262-580 2,000 - 2,000 492 1,508 General Supplies 11-000-262-610 9,725 (125) 9,600 9,101 499 Energy (Natural Gas) 11-000-262-621 1,800 - 1,800 1,248 552 Energy (Electricity) 11-000-262-622 38,000 1,346 39,346 39,345 1 Energy (Oil) 11-000-262-624 30,000 (1,346) 28,654 17,007 11,647 Other Objects 11-000-262-800 275 125 400 400 -
Total Custodial Services 201,817 7,929 209,746 189,787 19,959
Care & Upkeep of Grounds: General Supplies 11-000-263-610 2,500 (2,120) 380 76 304
Total Care & Upkeep of Grounds 2,500 (2,120) 380 76 304
Security: Cleaning, Repair & Maintenance Services 11-000-266-420 1,900 - 1,900 1,899 1 General Supplies 11-000-266-610 100 - 100 98 2
Total Security 2,000 - 2,000 1,997 3
Total Operations & Maintenance of Plant 235,317 5,809 241,126 211,093 30,033
86

EXHIBIT C-1
POSITIVE/(NEGATIVE)
ACCOUNT ORIGINAL BUDGET FINAL FINAL TONUMBERS BUDGET TRANSFERS BUDGET ACTUAL ACTUAL
JUNE 30, 2017
BASS RIVER TOWNSHIP SCHOOL DISTRICT
BUDGETARY COMPARISON SCHEDULEGENERAL FUND
FOR THE FISCAL YEAR ENDED JUNE 30, 2017
Student Transportation Services: Other Purchased Professional & Technical Services 11-000-270-390 18,700 - 18,700 18,700 - Contracted Services (Other than Between Home & School) - Vendors 11-000-270-512 5,500 (9) 5,491 5,491 - Contracted Services (Between Home & School)-Joint Agree. 11-000-270-513 57,900 8,193 66,093 66,092 1
Total Student Transportation Services 82,100 8,184 90,284 90,283 1
Unallocated Benefits - Employee Benefits: Social Security Contributions 11-000-291-220 20,300 7,050 27,350 27,348 2 Other Retirement Contributions - Regular 11-000-291-241 19,000 - 19,000 18,961 39 Workman's Compensation 11-000-291-260 18,250 615 18,865 18,865 - Health Benefits 11-000-291-270 414,000 (38,819) 375,181 353,878 21,303 Tuition Reimbursement 11-000-291-280 4,000 5,350 9,350 - 9,350 Other Employee Benefits 11-000-291-290 3,247 1,489 4,736 4,736 -
Total Unallocated Benefits - Employee Benefits 478,797 (24,315) 454,482 423,788 30,694
Nonbudgeted: On-Behalf TPAF Pension Contribution: Normal Cost - - - 124,245 (124,245) Post-Retirement Medical - - - 103,525 (103,525) Long-Term Disability Insurance - - - 365 (365) Reimbursed TPAF Social Security Contributions - - - 76,859 (76,859)
Total On-Behalf Contributions - - - 304,994 (304,994)
Total Personal Services - Employee Benefits 478,797 (24,315) 454,482 728,782 (274,300)
Total Undistributed Expenditures 1,275,556 43,288 1,318,844 1,550,601 (231,757)
Total Expenditures - Current Expense 2,389,849 8,114 2,397,963 2,614,238 (216,275)
Capital Outlay: Assets Acquired Under Capital Leases (Nonbudgeted) - - - 80,000 (80,000)
Total Capital Outlay - - - 80,000 (80,000)
Total Expenditures 2,389,849 8,114 2,397,963 2,694,238 (296,275)
Excess/(Deficiency) of Revenues Over/(Under) Expenditures (47,554) (8,114) (55,668) (34,393) 21,275
Other Financing Sources/(Uses): Capital Lease Proceeds (Nonbudgeted) - - - 80,000 80,000
87

EXHIBIT C-1
POSITIVE/(NEGATIVE)
ACCOUNT ORIGINAL BUDGET FINAL FINAL TONUMBERS BUDGET TRANSFERS BUDGET ACTUAL ACTUAL
JUNE 30, 2017
BASS RIVER TOWNSHIP SCHOOL DISTRICT
BUDGETARY COMPARISON SCHEDULEGENERAL FUND
FOR THE FISCAL YEAR ENDED JUNE 30, 2017
Excess/(Deficiency) of Revenues & Other Financing Sources Over/(Under) Expenditures & Other Financing Uses (47,554) (8,114) (55,668) 45,607 101,275
Fund Balances, July 1 140,420 - 140,420 140,420 -
Fund Balances, June 30 92,866$ (8,114)$ 84,752$ 186,027$ 101,275$
Prior Year Reserve for Encumbrances 8,114$
Total Budget Transfers 8,114$
Assigned Fund Balance:Designated for Subsequent Year's Expenditures 40,000$ Additional Assigned Fund Balance - Unreserved - Designated for
Subsequent Year's Expenditures (July 1, 2017 - August 1, 2017) 17,734 Year-End Encumbrances 18,240
Unassigned Fund Balance 110,053
Subtotal 186,027
Reconciliation to Governmental Funds Statements (GAAP): Reconciliation of State Aid Payments For GAAP to Budgetary Basis & Other Adjustments (88,669)
Fund Balance Per Governmental Funds (GAAP) 97,358$
RECAPITULATION OF FUND BALANCE
RECAPITULATION OF BUDGET TRANSFERS
88

EXHIBIT C-2
VARIANCEPOSITIVE/
(NEGATIVE)ORIGINAL BUDGET FINAL FINAL TO
REVENUES BUDGET TRANSFERS BUDGET ACTUAL ACTUAL
Local Sources 20,000$ 1,398$ 21,398$ 21,398$ -$ Federal Sources 93,564 1,210 94,774 94,774 -
Total Revenues 113,564 2,608 116,172 116,172 -
EXPENDITURES: Instruction: Salaries of Teachers 34,187 1,210 35,397 35,397 - Tuition 45,731 - 45,731 45,731 - Other Purchased Services (400-500 Series) 20,000 1,050 21,050 21,050 - General Supplies 618 - 618 618 -
Total Instruction 100,536 2,260 102,796 102,796 -
Support Services: Salaries for Other Professional Staff 3,575 - 3,575 3,575 - Personal Services - Employee Benefits 4,940 - 4,940 4,940 - Purchased Professional - Educational Services 4,513 - 4,513 4,513 - Supplies & Materials - 348 348 348 -
Total Support Services 13,028 348 13,376 13,376 -
Total Outflows 113,564 2,608 116,172 116,172 -
Excess/(Deficiency) of Revenues Over/ Expenditures -$ -$ -$ -$ -$
JUNE 30, 2017
BASS RIVER TOWNSHIP SCHOOL DISTRICT
BUDGETARY COMPARISON SCHEDULE SPECIAL REVENUE FUND
FOR THE FISCAL YEARS ENDED JUNE 30, 2017
89

This page intentionally left blank.
90

NOTES TO REQUIRED SUPPLEMENTARY INFORMATION
91

This page intentionally left blank
92

EXHIBIT C-3
SPECIALGENERAL REVENUE
FUND FUNDSources/Inflows of Resources: Actual Amounts (Budgetary Basis) "Revenue" From the Budgetary Comparison Schedule (C-Series) 2,659,845$ 116,172$
Difference - Budget to GAAP: Grant accounting budgetary basis differs from GAAP in that encumbrances are recognized as expenditures, and the related revenue is recognized.
Prior Year - 2,003 Current Year - -
State aid payment recognized for GAAP statements in the current year, previously recognized for budgetary purposes. 88,291 -
State aid payment recognized for budgetary purposes, not recognized for GAAP statements until the subsequent year. (88,669) -
Total Revenues as Reported on the Statement of Revenues, Expenditures, and Changes in Fund Balances - Governmental Funds. (B-2) 2,659,467$ 118,175$
Uses/outflows of resources: Actual amounts (budgetary basis) "total expenditures" from the budgetary comparison schedule 2,694,238$ 116,172$
Differences - Budget to GAAP: Encumbrances for supplies and equipment ordered but not received is reported in the year the order is placed for budgetary purposes, but in the year the supplies are received for financial reporting purposes. - 2,003
Total Expenditures as Reported on the Statement of Revenues, Expenditures, and Changes in Fund Balances - Governmental Funds (B-2) 2,694,238$ 118,175$
BASS RIVER TOWNSHIP SCHOOL DISTRICT
Note A - Explanation of Differences between Budgetary Inflows and Outflows and GAAP Revenues and Expenditures
FOR THE FISCAL YEARS ENDED JUNE 30, 2017
REQUIRED SUPPLEMENTARY INFORMATIONBUDGETARY COMPARISON SCHEDULE
NOTE TO RSI
93

This page intentionally left blank
94

REQUIRED SUPPLEMENTARY INFORMATION - PART III
95

This page intentionally left blank
96

EXHIBIT L-1BASS RIVER TOWNSHIP SCHOOL DISTRICT
SCHEDULE OF THE DISTRICT'S PROPORTIONATE SHARE OF THE NET PENSION LIABILITYPUBLIC EMPLOYEES' RETIREMENT SYSTEM
LAST FOUR FISCAL YEARS
2017 2016 2015 2014
District's proportion of the net pension liability 0.00213% 0.00257% 0.00230% 0.00260%
District's proportionate share of the netpension liability 632,125$ 576,963$ 477,500$ 501,389$
District's covered payroll 161,580$ 327,767$ 306,325$ 302,575$
District's proportionate share of the net pensionliability as a percentage of its covered payroll 391.21% 176.03% 155.88% 165.71%
Plan fiduciary net position as a percentage ofthe total pension liability 40.14% 47.93% 52.08% 48.72%
97

EXHIBIT L-2
2017 2016 2015 2014
District's contractually required contribution 20,000$ 18,961$ 22,097$ 19,704$
Contributions in relation to thecontractually required contribution 20,000 18,961 22,097 19,704
Contribution deficiency (excess) -$ -$ -$ -$
District's covered payroll 161,580$ 327,767$ 306,325$ 302,575$
Contributions as a percentage of employeepayroll 12.38% 5.78% 7.21% 6.51%
BASS RIVER TOWNSHIP SCHOOL DISTRICT
LAST FOUR FISCAL YEARS
SCHEDULE OF DISTRICT CONTRIBUTIONSPUBLIC EMPLOYEES' RETIREMENT SYSTEM
98

EXHIBIT L-3
2017 2016 2015 2014
District's proportion of the net pension liability 0.00000% 0.00000% 0.00000% 0.00000%
District's proportionate share of the net pension liability -$ -$ -$ -$
State's proportionate share of the net pension liabilityassociated with the District 9,073,138$ 6,338,470$ 5,275,491$ 4,814,168$
District's covered payroll 1,070,327$ 1,132,248$ 1,706,366$ 1,706,965$
District's proportionate share of the net pension liabilityas a percentage of its covered payroll 0.00% 0.00% 0.00% 0.00%
Plan fiduciary net position as a percentage ofthe total pension liability 22.33% 28.71% 33.64% 33.76%
BASS RIVER TOWNSHIP SCHOOL DISTRICTSCHEDULE OF THE STATE'S PROPORTIONATE SHARE OF THE NET PENSION LIABILITY
LAST FOUR FISCAL YEARSTEACHERS' PENSION AND ANNUITY FUND
99

EXHIBIT L-4BASS RIVER TOWNSHIP SCHOOL DISTRICTSCHEDULE OF DISTRICT CONTRIBUTIONSTEACHERS' PENSION AND ANNUITY FUND
LAST FOUR FISCAL YEARS
This schedule is not applicable. There is a special funding situation where the State of New Jersey pays 100% of the required contributions associated with the School District.
100

NOTES TO REQUIRED SUPPLEMENTARY INFORMATION
101

This page intentionally left blank
102

Teachers Pension and Annuity Fund (TPAF)
Changes in Benefit Terms - None.
Public Employees' Retirement System (PERS)
Changes in Benefit Terms - None.
Changes in Assumptions - The discount rate changed from 4.90 % as of June 30, 2015, to 3.98% as of June 30, 2016.
BASS RIVER TOWNSHIP SCHOOL DISTRICTNOTES TO REQUIRED SUPPLEMENTARY INFORMATION - PART III
FOR THE FISCAL YEAR ENDED JUNE 30, 2017
Changes in Assumptions - The discount rate changed from 4.13% as of June 30, 2015, to 3.22% as of June 30, 2016.
103

This page intentionally left blank
104

OTHER SUPPLEMENTARY INFORMATION
105

This page intentionally left blank
106

D. School Based Budget Schedules
Not Applicable
107

This page intentionally left blank
108

E. Special Revenue Fund
109

This page intentionally left blank
110
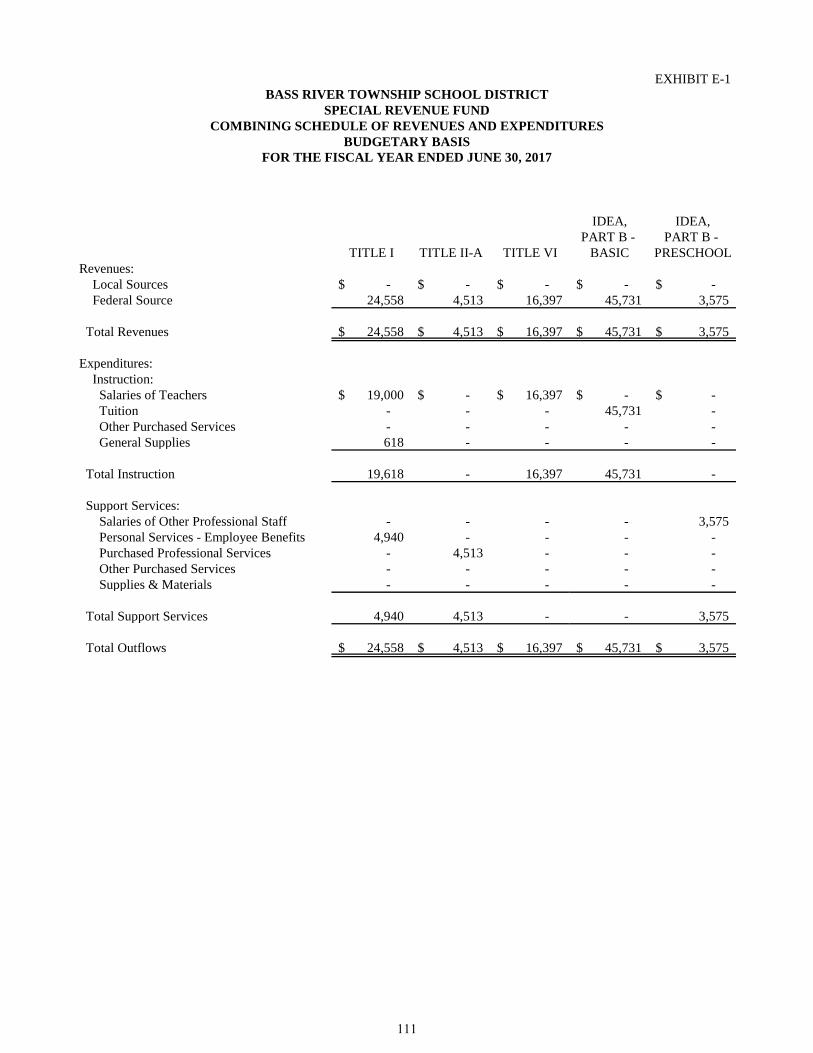
EXHIBIT E-1
IDEA, IDEA,PART B - PART B -
TITLE I TITLE II-A TITLE VI BASIC PRESCHOOLRevenues: Local Sources -$ -$ -$ -$ -$ Federal Source 24,558 4,513 16,397 45,731 3,575
Total Revenues 24,558$ 4,513$ 16,397$ 45,731$ 3,575$
Expenditures: Instruction: Salaries of Teachers 19,000$ -$ 16,397$ -$ -$ Tuition - - - 45,731 - Other Purchased Services - - - - - General Supplies 618 - - - -
Total Instruction 19,618 - 16,397 45,731 -
Support Services: Salaries of Other Professional Staff - - - - 3,575 Personal Services - Employee Benefits 4,940 - - - - Purchased Professional Services - 4,513 - - - Other Purchased Services - - - - - Supplies & Materials - - - - -
Total Support Services 4,940 4,513 - - 3,575
Total Outflows 24,558$ 4,513$ 16,397$ 45,731$ 3,575$
BASS RIVER TOWNSHIP SCHOOL DISTRICTSPECIAL REVENUE FUND
COMBINING SCHEDULE OF REVENUES AND EXPENDITURESBUDGETARY BASIS
FOR THE FISCAL YEAR ENDED JUNE 30, 2017
111

EXHIBIT E-1
SAFETY VIKING YACHTGRANT GRANT 2017
Revenues: Local Sources 348$ 21,050$ 21,398$ Federal Source - - 94,774
Total Revenues 348$ 21,050$ 116,172$
Expenditures: Instruction: Salaries of Teachers -$ -$ 35,397$ Tuition - - 45,731 Other Purchased Services - 21,050 21,050 General Supplies - - 618
Total Instruction - 21,050 102,796
Support Services: Salaries of Other Professional Staff - - 3,575 Personal Services - Employee Benefits - - 4,940 Purchased Professional Services - - 4,513 Other Purchased Services - - - Supplies & Materials 348 - 348
Total Support Services 348 - 13,376
Total Outflows 348$ 21,050$ 116,172$
BASS RIVER TOWNSHIP SCHOOL DISTRICTSPECIAL REVENUE FUND
COMBINING SCHEDULE OF REVENUES AND EXPENDITURESBUDGETARY BASIS
FOR THE FISCAL YEAR ENDED JUNE 30, 2017
112

F. Capital Projects Fund
113

This page intentionally left blank
114

EXHIBIT F-1
UNEXPENDEDORIGINAL PRIOR CURRENT BALANCE
PROJECT TITLE/ISSUE DATE APPROPRIATIONS YEARS YEARS 2017
Energy Savings Improvement Plan 4/4/2017 369,000$ -$ -$ 369,000$
369,000$ -$ -$ 369,000$
EXPENDITURES TO DATE
BASS RIVER TOWNSHIP SCHOOL DISTRICTCAPITAL PROJECTS FUNDS
SUMMARY STATEMENT OF PROJECT EXPENDITURESFOR THE FISCAL YEAR ENDED JUNE 30, 2017
115

EXHIBIT F-2
Revenues & Other Financing Sources: Capital Lease Proceeds 369,000$
Total Revenues 369,000
Expenditures & Other Financing Uses: Purchased Professional & Technical Services - Construction Services - Total Expenditures -
Excess (Deficiency) of Revenues Over (Under) Expenditures 369,000 Fund Balance - Beginning -
Fund Balance - Ending 369,000$
BASS RIVER TOWNSHIP SCHOOL DISTRICTCAPITAL PROJECTS FUND
SUMMARY STATEMENT OF PROJECT EXPENDITURES, AND
FOR THE FISCAL YEAR ENDED JUNE 30, 2017CHANGES IN FUND BALANCE-BUDGETARY BASIS
116

EXHIBIT F-2a
REVISEDPRIOR CURRENT AUTHORIZED
PERIODS PERIODS TOTALS COST
Revenues & Other Financing Sources: Capital Lease Proceeds -$ 369,000$ 369,000$ 369,000$
Total Revenues - 369,000 369,000 369,000
Expenditures & Other Financing Uses: Construction Services - - - 369,000
Total Expenditures - - - 369,000
Excess/(Deficiency) of Revenues Over/ (Under) Expenditures -$ 369,000$ 369,000$ -$
Project Number Not Applicable Grant Date Not Applicable Bond Authorization Date Not Applicable Bonds Authorized Not Applicable Bonds Issued Not Applicable Original Authorized Cost 369,000$ Additional Authorized Cost -$ Revised Authorized Cost 369,000$ Percentage Increase over Original Authorized Cost 0% Percentage Completion 0% Original Target Completion Date June 2018 Revised Target Completion Date June 2018
ADDITIONAL PROJECT INFORMATION
FROM INCEPTION AND FOR THE YEAR ENDED JUNE 30, 2017
BASS RIVER TOWNSHIP SCHOOL DISTRICTCAPITAL PROJECTS FUND
SCHEDULE OF PROJECT REVENUES, EXPENDITURES, AND
ENERGY SAVINGS IMPROVEMENT PLANCHANGES IN FUND BALANCE-BUDGETARY BASIS
117

This page intentionally left blank
118

G. Proprietary Funds
119

This page intentionally left blank
120

Enterprise Funds
Not Applicable
121

This page intentionally left blank
122
Internal Service Fund
Not Applicable
123

This page intentionally left blank
124

H. Fiduciary Fund
125

This page intentionally left blank
126

EXHIBIT H-1
UNEMPLOYMENTCOMPENSATION AGENCY
ASSETS TRUST FUNDS 2017
Cash & Cash Equivalents 26,099$ 12,943$ 39,042$
Total Assets 26,099 12,943 39,042
LIABILITIES
Interfund Payable - 6,035 6,035 Due to Student Groups - 6,908 6,908
Total Liabilities - 12,943 12,943
NET POSITION
Reserved for: Unemployment Claims & Other Purposes 26,099 - 26,099
Total Net Position 26,099$ -$ 26,099$
PRIVATE PURPOSE
BASS RIVER TOWNSHIP SCHOOL DISTRICTFIDUCIARY FUNDS
COMBINING STATEMENT OF FIDUCIARY NET POSITIONJune 30, 2017
127

EXHIBIT H-2
UNEMPLOYMENTADDITIONS FUND 2017
Contributions: Plan Member -$ -$
Total Contributions - -
Investment Earnings: Interest - Checking 34 34
Net Investment Earnings 34 34
Total Additions 34 34
DEDUCTIONS
Claims Paid 99 99
Total Deductions 99 99
Change in Net Position (65) (65) Net Position - Beginning of the Year 26,164 26,164
Net Position - End of the Year 26,099$ 26,099$
BASS RIVER TOWNSHIP SCHOOL DISTRICTFIDUCIARY FUNDS
COMBINING STATEMENT OF CHANGES IN FIDUCIARY NET POSITIONFOR THE FISCAL YEAR ENDED JUNE 30, 2017
PRIVATE PURPOSE
128

EXHIBIT H-3
BALANCE BALANCEJULY 1, JUNE 30,
ASSETS 2016 ADDITIONS DELETIONS 2017
Cash & Cash Equivalents 7,759$ 4,643$ 5,494$ 6,908$
Total Assets 7,759$ 4,643$ 5,494$ 6,908$
LIABILITIES
Due To Student Groups 7,759$ 4,643$ 5,494$ 6,908$
Total Liabilities 7,759$ 4,643$ 5,494$ 6,908$
EXHIBIT H-4
BALANCE BALANCEJULY 1, JUNE 30,
ASSETS 2016 ADDITIONS DELETIONS 2017
Cash & Cash Equivalents 2,989$ 1,524,160$ 1,521,114$ 6,035$
Total Assets 2,989$ 1,524,160$ 1,521,114$ 6,035$
LIABILITIES
Payroll Deductions & Withholdings -$ 1,518,125$ 1,518,125$ -$ Interfund Payable 2,989 6,035 2,989 6,035
Total Liabilities 2,989$ 1,524,160$ 1,521,114$ 6,035$
PAYROLL AGENCY FUNDSCHEDULE OF RECEIPTS AND DISBURSEMENTS
FOR THE FISCAL YEAR ENDED JUNE 30, 2017
BASS RIVER TOWNSHIP SCHOOL DISTRICTSTUDENT ACTIVITY AGENCY FUND
SCHEDULE OF CHANGES OF RECEIPTS AND DISBURSEMENTSFOR THE FISCAL YEAR ENDED JUNE 30, 2017
129

This page intentionally left blank
130

I. Long-Term Debt
131

This page intentionally left blank
132

EXH
IBIT
I-2
LO
NG
-TE
RM
DE
BT
SCH
ED
UL
E O
F O
BL
IGA
TIO
NS
UN
DE
R C
API
TA
L L
EA
SES
AM
OU
NT
AM
OU
NT
AM
OU
NT
OU
TSTA
ND
ING
ISSU
EDR
ETIR
EDO
UTS
TAN
DIN
GD
ATE
OF
OF
OR
IGIN
AL
JUN
E 30
, C
UR
REN
TC
UR
REN
TJU
NE
30,
SER
IES
ISSU
AN
CE
ISSU
E20
16Y
EAR
YEA
R20
17
Mis
cella
neou
s Equ
ipm
ent,
Tech
nolo
gyEq
uipm
ent a
nd T
extb
ooks
8/15
/201
180
,000
$
17
,000
$
-$
17,0
00$
-$
Faci
lity
Equi
pmen
t8/
15/2
013
80,0
00
32,4
83
-
16
,024
16
,459
Equi
pmen
t & T
extb
ooks
7/2/
2014
100,
000
48,0
24
-
15
,631
32
,393
Secu
rity
Ves
tibul
e6/
15/2
015
100,
000
79,7
06
-
19
,272
60
,434
Equi
pmen
t6/
18/2
015
80,0
00
64,1
77
-
15
,527
48
,650
Equi
pmen
t8/
1/20
1680
,000
-
80,0
00
16,5
22
63,4
78
Ener
gy S
avin
gs Im
prov
emen
t Pla
n4/
4/20
1736
9,00
0
-
369,
000
-
369,
000
Tota
l24
1,39
0$
44
9,00
0$
99
,976
$
59
0,41
4$
BA
SS R
IVE
R T
OW
NSH
IP S
CH
OO
L D
IST
RIC
T
FOR
TH
E F
ISC
AL
YE
AR
EN
DE
D J
UN
E 3
0, 2
017
133

This page intentionally left blank
134

STATISTICAL SECTION (Unaudited)
135

This page intentionally left blank
136

Financial Trend Information
Financial trend information is intended to assist the user inunderstanding and assessing how the School District's financial positionhas changed over time. Please refer to the following exhibits for ahistorical view of the School District's financial trends.
137

This page intentionally left blank
138

EXH
IBIT
J-1
2017
2016
2015
2014
2013
2012
2011
2010
2009
2008
Gov
ernm
enta
l Act
iviti
es:
In
veste
d in
Cap
ital A
sset
s, N
et o
f Rel
ated
Deb
t31
8,70
4$
318,
673
$
14
6,50
7$
374,
984
$
44
4,10
8$
604,
002
$
59
0,45
9$
627,
486
$
65
2,56
8$
655,
500
$
Res
trict
ed-
-
10
,000
25
,689
99
,039
38
9,56
1
319,
247
97
,712
10
5,54
8
90,4
19
U
nres
trict
ed(5
10,5
12)
(536
,329
)
(3
29,8
79)
67,0
06
109,
939
10
1,74
3
167,
376
80
,289
72
,363
17
0,56
9
Tota
l Gov
ernm
enta
l Act
iviti
es N
et P
ositi
on(1
91,8
08)
$
(217
,656
)$
(1
73,3
72)
$
467,
679
$
65
3,08
6$
1,09
5,30
6$
1,
077,
082
$
805,
487
$
83
0,47
9$
916,
488
$
Bus
ines
s-Ty
pe A
ctiv
ities
:
Inve
sted
in C
apita
l Ass
ets,
Net
of R
elat
ed D
ebt
-$
-$
-$
-$
-$
-$
-$
-$
-$
659
$
Unr
estri
cted
-
-
-
-
-
-
-
-
3,89
6
3,
749
Tota
l Bus
ines
s-Ty
pe A
ctiv
ities
Net
Pos
ition
-$
-$
-$
-$
-$
-$
-$
-$
3,89
6$
4,
408
$
Go v
ernm
ent-W
ide:
In
veste
d in
Cap
ital A
sset
s, N
et o
f Rel
ated
Deb
t31
8,70
4$
318,
673
$
14
6,50
7$
374,
984
$
44
4,10
8$
604,
002
$
59
0,45
9$
627,
486
$
65
2,56
8$
656,
159
$
Res
trict
ed-
-
10
,000
25
,689
99
,039
38
9,56
1
319,
247
97
,712
10
5,54
8
90,4
19
U
nres
trict
ed(5
10,5
12)
(536
,329
)
(3
29,8
79)
67,0
06
109,
939
10
1,74
3
167,
376
80
,289
76
,259
17
4,31
8
Tota
l Gov
ernm
ent-W
ide
Net
Pos
ition
(191
,808
)$
(2
17,6
56)
$
(173
,372
)$
46
7,67
9$
653,
086
$
1,
095,
306
$
1,07
7,08
2$
80
5,48
7$
834,
375
$
92
0,89
6$
FISC
AL
YEA
R E
ND
ING
JUN
E 30
,
BA
SS R
IVE
R T
OW
NSH
IP S
CH
OO
L D
IST
RIC
TN
ET
PO
SIT
ION
BY
CO
MPO
NE
NT
LA
ST T
EN
FIS
CA
L Y
EA
RS
(AC
CR
UA
L B
ASI
S O
F A
CC
OU
NTI
NG
)
139

EXH
IBIT
J-2
2017
2016
2015
2014
2013
2012
2011
2010
2009
2008
Expe
nses
: G
over
nmen
tal A
ctiv
ities
In
stru
ctio
n:
R
egul
ar80
0,40
6$
862,
319
$
924,
634
$
85
6,81
8$
823,
205
$
80
9,72
6$
791,
050
$
635,
133
$
69
1,04
5$
657,
082
$
Spe
cial
Edu
catio
n30
6,38
3
295,
630
247,
650
27
4,42
7
235,
803
14
0,07
0
136,
446
160,
110
12
7,02
3
146,
123
Oth
er S
peci
al E
duca
tion
39,7
80
44,0
01
57,6
04
64
,917
18
,635
17
,218
10
,380
21
,066
20,0
18
18
,565
Oth
er In
stru
ctio
n21
,867
23
,746
19
,664
20,4
04
20,2
82
16,7
72
9,24
1
8,
924
9,
511
10
,621
S
uppo
rt Se
rvic
es:
Tui
tion
45,4
02
2,82
2
2,
681
-
37,5
14
-
-
136,
317
10
5,73
3
21,1
09
S
tude
nt &
Inst
ruct
ion
Rel
ated
Ser
vice
s27
3,76
1
304,
051
329,
639
32
7,53
3
328,
677
29
6,62
7
247,
962
270,
743
33
1,69
2
327,
577
Sch
ool A
dmin
istra
tive
Serv
ices
68,1
08
66,3
17
64,2
17
63
,377
62
,995
60
,790
58
,770
58
,038
25,6
82
23
,916
Gen
eral
Adm
inis
trativ
e Se
rvic
es14
6,54
8
145,
591
135,
712
13
4,00
8
138,
887
12
7,09
9
129,
137
122,
600
11
6,36
7
176,
313
Pla
nt O
pera
tions
& M
aint
enan
ce16
5,77
7
101,
276
124,
472
14
0,43
0
162,
618
21
1,69
4
207,
895
218,
556
21
2,67
3
235,
747
Pup
il Tr
ansp
orta
tion
90,2
83
84,4
54
74,7
16
10
5,62
0
88,8
54
90,3
18
87,3
40
109,
106
95
,473
82,0
81
Spe
cial
Sch
ools
-
-
-
-
-
-
-
-
8,84
8
2,96
4
U
nallo
cate
d Em
ploy
ee B
enef
its74
1,46
3
1,02
0,81
8
891,
360
58
6,75
6
590,
090
49
0,37
0
443,
733
472,
483
45
4,42
5
599,
552
In
tere
st o
n Lo
ng-T
erm
Deb
t9,
374
3,87
0
-
-
-
-
-
-
-
3,28
6
U
nallo
cate
d A
djus
tmen
t to
Fixe
d A
sset
s-
68
,716
-
-
187,
290
-
-
-
-
-
U
nallo
cate
d D
epre
ciat
ion
38,7
72
49,6
02
49,8
80
59
,665
56
,598
86
,408
25
,765
49
,079
111,
399
41
,660
T
otal
Gov
ernm
enta
l Act
iviti
es E
xpen
ses
2,74
7,92
4
3,
073,
213
2,
922,
229
2,63
3,95
5
2,
751,
448
2,34
7,09
2
2,
147,
719
2,
262,
155
2,30
9,88
9
2,
346,
596
Bus
ines
s-Ty
pe A
ctiv
ities
:
Foo
d Se
rvic
e-
-
-
-
-
-
-
70,8
90
74
,831
70,4
02
Tota
l Bus
ines
s-Ty
pe A
ctiv
ities
Exp
ense
-
-
-
-
-
-
-
70
,890
74,8
31
70
,402
T
otal
Gov
ernm
ent-W
ide
Expe
nses
2,74
7,92
4$
3,
073,
213
$
2,92
2,22
9$
2,
633,
955
$
2,75
1,44
8$
2,
347,
092
$
2,14
7,71
9$
2,33
3,04
5$
2,
384,
720
$
2,41
6,99
8$
Prog
ram
Rev
enue
s:
Gov
ernm
enta
l Act
iviti
es:
Ope
ratin
g G
rant
s & C
ontri
butio
ns42
3,16
9$
708,
862
$
545,
706
$
29
8,51
7$
307,
779
$
93
,637
$
16
8,13
7$
48
,702
$
93,3
53$
11
3,01
3$
Tota
l Gov
ernm
enta
l Act
iviti
es P
rogr
am
Rev
enue
s42
3,16
9
708,
862
545,
706
29
8,51
7
307,
779
93
,637
16
8,13
7
48
,702
93,3
53
11
3,01
3
Bus
ines
s-Ty
pe A
ctiv
ities
:
Cha
rges
for S
ervi
ces:
Foo
d Se
rvic
e-
-
-
-
-
-
-
-
20
,871
22,5
01
Ope
ratin
g G
rant
s & C
ontri
butio
ns-
-
-
-
-
-
-
-
17
,334
20,7
97
Tota
l Bus
ines
s Typ
e A
ctiv
ities
Pro
gram
R
even
ues
-
-
-
-
-
-
-
-
38,2
05
43
,298
R
even
ues
Tota
l Gov
ernm
ent-W
ide
Prog
ram
Rev
enue
s42
3,16
9$
708,
862
$
545,
706
$
29
8,51
7$
307,
779
$
93
,637
$
16
8,13
7$
48
,702
$
131,
558
$
15
6,31
1$
BA
SS R
IVER
TO
WN
SHIP
SC
HO
OL
DIS
TRIC
TC
HA
NG
ES IN
NET
PO
SITI
ON
- (A
CC
RU
AL
BA
SIS
OF
AC
CO
UN
TIN
G)
LAST
TEN
FIS
CA
L Y
EAR
S
FISC
AL
YEA
R E
ND
ING
JU
NE
30,
140

EXH
IBIT
J-2
2017
2016
2015
2014
2013
2012
2011
2010
2009
2008
BA
SS R
IVER
TO
WN
SHIP
SC
HO
OL
DIS
TRIC
TC
HA
NG
ES IN
NET
PO
SITI
ON
- (A
CC
RU
AL
BA
SIS
OF
AC
CO
UN
TIN
G)
LAST
TEN
FIS
CA
L Y
EAR
S
FISC
AL
YEA
R E
ND
ING
JU
NE
30,
Net
(Exp
ense
)/Rev
enue
:
Gov
ernm
enta
l Act
iviti
es(2
,324
,755
)$
(2,3
64,3
51)
$
(2
,376
,523
)$
(2
,335
,438
)$
(2,4
43,6
69)
$
(2
,253
,455
)$
(1,9
79,5
82)
$
(2
,213
,453
)$
(2
,216
,536
)$
(2
,233
,583
)$
Bus
ines
s-Ty
pe A
ctiv
ities
-
-
-
-
-
-
-
(7
0,89
0)
(3
6,62
6)
(2
7,10
4)
T
otal
Gov
ernm
ent-W
ide
Net
Exp
ense
(2,3
24,7
55)
$
(2
,364
,351
)$
(2,3
76,5
23)
$
(2,3
35,4
38)
$
(2
,443
,669
)$
(2,2
53,4
55)
$
(1
,979
,582
)$
(2,2
84,3
43)
$
(2,2
53,1
62)
$
(2,2
60,6
87)
$
Gen
eral
Rev
enue
s & O
ther
Cha
nges
in N
et P
ositi
on:
Gov
ernm
enta
l Act
iviti
es:
P
rope
rty T
axes
Lev
ied
for G
ener
al
P
urpo
ses,
Net
1,45
5,59
6$
1,
427,
055
$
1,34
6,56
5$
1,
263,
753
$
1,21
4,68
0$
1,
190,
863
$
1,14
8,39
4$
1,10
4,22
5$
1,
061,
755
$
1,00
7,16
9$
T
axes
Lev
ied
for D
ebt S
ervi
ce-
-
-
-
-
-
-
25,1
38
48
,897
F
eder
al &
Sta
te A
id n
ot re
stric
ted
869,
142
85
2,40
4
88
0,07
5
874,
003
1,
037,
238
1,04
6,52
3
1,
013,
929
1,
048,
020
1,18
1,70
3
1,
154,
764
Tui
tion
Rec
eive
d-
-
-
-
17,3
00
-
19,0
00
-
-
-
Inve
stm
ent E
arni
ngs
-
329
28
5
463
31
2
441
2,
153
-
6,
133
9,
012
Mis
cella
neou
s Inc
ome
29,7
35
36,4
09
9,93
6
11
,812
2,
149
13,3
50
5,34
5
10
,440
-
35
7
Tra
nsfe
rs/C
ance
llatio
ns-
-
-
-
-
-
(32,
158)
(30,
241)
(30,
253)
T
otal
Gov
ernm
enta
l Act
iviti
es2,
354,
473
2,31
6,19
7
2,23
6,86
1
2,
150,
031
2,27
1,67
9
2,
251,
177
2,18
8,82
1
2,13
0,52
7
2,
244,
488
2,18
9,94
6
Bus
ines
s-Ty
pe A
ctiv
ities
:
Inve
stm
ent E
arni
ngs
-
-
-
-
-
-
-
15
67
22
7
Tra
nsfe
rs-
-
-
-
(3,8
96)
32
,158
30,2
41
30
,253
T
otal
Bus
ines
s-Ty
pe A
ctiv
ities
-
-
-
-
-
-
(3
,896
)
32,1
73
30
,308
30,4
80
Tota
l Gov
ernm
ent-W
ide
2,35
4,47
3$
2,
316,
197
$
2,23
6,86
1$
2,
150,
031
$
2,27
1,67
9$
2,
251,
177
$
2,18
4,92
5$
2,16
2,70
0$
2,
274,
796
$
2,22
0,42
6$
Cha
nge
in N
et P
ositi
on:
G
over
nmen
tal A
ctiv
ities
29,7
18$
(48,
154)
$
(1
39,6
62)
$
(1
85,4
07)
$
(171
,990
)$
(2
,278
)$
20
9,23
9$
(8
2,92
6)$
27
,952
$
(43,
637)
$
B
usin
ess-
Type
Act
iviti
es-
-
-
-
-
-
(3,8
96)
(3
8,71
7)
(6
,318
)
3,
376
T
otal
Gov
ernm
ent-W
ide
29,7
18$
(48,
154)
$
(1
39,6
62)
$
(1
85,4
07)
$
(171
,990
)$
(2
,278
)$
20
5,34
3$
(1
21,6
43)
$
21
,634
$
(40,
261)
$
141

EXH
IBIT
J-3
2017
2016
2015
2014
2013
2012
2011
2010
2009
2008
Gen
eral
Fun
d:
Res
erve
d-
$
-
$
-
$
-
$
-
$
38
9,56
1$
319,
247
$
97
,712
$
10
5,54
8$
90,4
19$
R
estri
cted
-
-
10,0
00
25,6
89
99,0
39
-
-
-
-
-
A
ssig
ned
75,9
74
55,6
68
53,5
18
51,0
40
21,2
70
-
-
-
-
-
U
nres
erve
d/U
nass
igne
d21
,384
(3
,539
)
11
,215
88
,911
16
6,52
0
164,
584
21
9,38
1
163,
764
16
3,49
0
207,
078
Tota
l Gen
eral
Fun
d97
,358
$
52
,129
$
74
,733
$
16
5,64
0$
286,
829
$
55
4,14
5$
538,
628
$
26
1,47
6$
269,
038
$
29
7,49
7$
All
Oth
er G
over
nmen
tal F
unds
:
Unr
eser
ved,
Rep
orte
d in
:
S
peci
al R
even
ue F
und
-$
-$
-$
-$
-$
-$
-$
-$
(1,1
06)
$
(406
)$
Cap
ital P
roje
cts F
und
369,
000
-
-
-
-
-
-
-
-
-
T ota
l All
Oth
er G
over
nmen
tal
F
unds
369,
000
$
-
$
-
$
-
$
-
$
-
$
-
$
-
$
(4
06)
$
(4
06)
$
FISC
AL
YEA
R E
ND
ING
JUN
E 30
,
BA
SS R
IVE
R T
OW
NSH
IP S
CH
OO
L D
IST
RIC
TFU
ND
BA
LA
NC
ES
AN
D G
OV
ER
NM
EN
TA
L F
UN
DS
LA
ST T
EN
FIS
CA
L Y
EA
RS
(MO
DIF
IED
AC
CR
UA
L B
ASI
S O
F A
CC
OU
NTI
NG
)
142

EXH
IBIT
J-4
2017
2016
2015
2014
2013
2012
2011
2010
2009
2008
Rev
enue
s:
Tax
Lev
y1,
455,
596
$
1,42
7,05
5$
1,34
6,56
5$
1,26
3,75
3$
1,23
8,97
4$
1,21
4,68
0$
1,
190,
863
$
1,14
8,39
4$
1,
104,
225
$
1,08
6,89
3$
Tui
tion
Cha
rges
-
-
-
-
-
-
-
19,0
00
-
-
M
isce
llane
ous
29,7
35
36,7
38
10,2
21
12,2
75
8,83
0
22,1
59
13,7
91
7,49
8
10
,440
6,
133
S
tate
Sou
rces
1,19
7,53
7
1,
171,
885
1,
101,
688
1,
074,
666
1,
083,
372
1,
037,
238
1,04
8,92
1
90
7,00
0
1,04
8,02
0
1,
203,
121
F
eder
al S
ourc
es94
,774
94
,704
94
,440
97
,854
91
,068
91
,239
16
5,73
9
155,
631
93
,353
91
,595
T
otal
Rev
enue
2,77
7,64
2
2,
730,
382
2,
552,
914
2,
448,
548
2,
422,
244
2,
365,
316
2,41
9,31
4
2,
237,
523
2,25
6,03
8
2,
387,
742
Expe
nditu
res:
Ins
truct
ion:
R
egul
ar In
stru
ctio
n80
0,40
6
862,
319
844,
634
776,
818
743,
205
809,
726
79
1,05
0
635,
133
69
1,04
5
657,
082
Spe
cial
Edu
catio
n In
stru
ctio
n30
6,38
3
316,
680
247,
650
274,
427
235,
803
140,
070
13
6,44
6
160,
110
12
7,02
3
146,
123
Oth
er S
peci
al E
duca
tion
Inst
ruct
ion
39,7
80
44,0
01
57,6
04
64,9
17
18,6
35
17,2
18
10,3
80
21,0
66
20,0
18
18,5
65
O
ther
Inst
ruct
ion
21,8
67
23,7
46
19,6
64
20,4
04
20,2
82
16,7
72
9,24
1
8,
924
9,51
1
10
,621
Su
ppor
t Ser
vice
s:-
-
Tui
tion
45,4
02
2,82
2
2,
681
-
37,5
14
-
-
136,
317
10
5,73
3
21,1
09
S
tude
nt &
Inst
ruct
ion
Rel
ated
Ser
vice
s27
3,76
1
283,
001
329,
639
327,
533
328,
677
311,
226
24
7,96
2
270,
743
33
1,69
2
327,
577
Sch
ool A
dmin
istra
tive
Serv
ices
68,1
08
66,3
17
64,2
17
63,3
77
62,9
95
60,7
90
58,7
70
58,0
38
25,6
82
23,9
16
G
ener
al A
dmin
istra
tion
Serv
ices
146,
548
14
5,59
1
13
5,71
2
13
4,00
8
13
8,88
7
12
7,09
9
129,
137
12
2,60
0
116,
367
17
6,31
3
P
lant
Ope
ratio
ns &
Mai
nten
ance
211,
093
20
1,76
0
20
5,87
5
20
4,15
9
20
8,62
8
21
1,69
4
207,
895
21
8,55
6
212,
673
23
5,74
7
P
upil
Tran
spor
tatio
n90
,283
84
,454
74
,716
10
5,62
0
88
,854
90
,318
87
,340
10
9,10
6
95,4
73
82,0
81
E
mpl
oyee
Ben
efits
728,
782
71
2,29
5
66
1,42
9
59
1,66
2
57
5,08
0
49
0,37
0
443,
733
47
2,84
3
454,
425
59
9,55
2
Spec
ial S
choo
ls-
-
-
-
-
-
-
-
8,
848
2,96
4
C
apita
l Out
lay
80,0
00
190,
000
80,0
00
86,8
12
311,
000
74,5
16
20,2
08
31,6
49
52,7
43
43,0
83
Deb
t Ser
vice
:
Prin
cipa
l-
-
-
-
-
-
-
-
53
,000
Inte
rest
& O
ther
Cha
rges
-
-
-
-
-
-
-
-
-
3,28
6
T
otal
Exp
endi
ture
s2,
812,
413
2,93
2,98
6
2,72
3,82
1
2,64
9,73
7
2,76
9,56
0
2,34
9,79
9
2,
142,
162
2,24
5,08
5
2,
251,
233
2,40
1,01
9
Exce
ss (D
efic
ienc
y) o
f Rev
enue
s
Ove
r/(U
nder
) Exp
endi
ture
s(3
4,77
1)
(202
,604
)
(1
70,9
07)
(201
,189
)
(3
47,3
16)
15,5
17
277,
152
(7
,562
)
4,80
5
(1
3,27
7)
Oth
er F
inan
cing
Sou
rces
/(Use
s):
C
apita
l Lea
se P
roce
eds
449,
000
18
0,00
0
80
,000
80
,000
80
,000
-
-
-
-
-
Tra
nsfe
rs In
-
-
-
-
-
-
-
-
-
-
T
rans
fer O
ut-
-
-
-
-
-
-
-
(3
2,51
8)
(30,
241)
Tota
l Oth
er F
inan
cing
Sou
rces
/(Use
s)44
9,00
0
180,
000
80,0
00
80,0
00
-
-
-
(32,
518)
(3
0,24
1)
(30,
253)
Net
Cha
nge
in F
und
Bal
ance
s41
4,22
9$
(22,
604)
$
(1
21,1
89)
$
(267
,316
)$
15
,517
$
27
7,15
2$
(7,5
62)
$
(2
7,71
3)$
(43,
518)
$
(1
00,3
76)
$
Deb
t Ser
vice
as a
Per
cent
age
of
Non
capi
tal E
xpen
ditu
res
0%0%
0%0%
0%0%
0%0%
0%2.
4%
Sour
ce: D
istri
ct re
cord
s
BA
SS R
IVE
R T
OW
NSH
IP S
CH
OO
L D
IST
RIC
TC
HA
NG
ES
IN F
UN
D B
AL
AN
CE
S, G
OV
ER
NM
EN
TA
L F
UN
DS
LA
ST T
EN
FIS
CA
L Y
EA
RS
(MO
DIF
IED
AC
CR
UA
L B
ASI
S O
F A
CC
OU
NTI
NG
)
FISC
AL
YEA
R E
ND
ING
JUN
E 30
,
143

EXHIBIT J-5
FISCALYEAR
ENDINGJUNE 30, TUITION INTEREST MISCELLANEOUS TOTAL
2017 -$ 299$ 6,035$ 6,334$ 2016 - 329 3,129 3,458 2015 - 285 8,201 8,486 2014 - 463 3,413 3,876 2013 - - 8,830 8,830 2012 17,300 312 2,149 19,761 2011 - 441 13,350 13,791 2010 - 2,153 3,794 5,947 2009 - 8,580 1,860 10,440 2008 - 6,133 - 6,133
Source: District records
BASS RIVER TOWNSHIP SCHOOL DISTRICTGENERAL FUND - OTHER LOCAL REVENUE BY SOURCE
LAST TEN FISCAL YEARS(MODIFIED ACCRUAL BASIS OF ACCOUNTING)
144

Revenue Capacity Information
Revenue capacity information is intended to assist users in understanding andassessing the factors affecting the School District's ability to generate revenues.Please refer to the following exhibits for a historical view of these factors and howthey relate to the School District's ability to generate revenues.
145

This page intentionally left blank
146

EXH
IBIT
J-6
FISC
AL
TOTA
LES
TIM
ATE
D
YEA
R
TOTA
LN
ETD
IREC
TC
OU
NTY
END
EDV
AC
AN
TA
SSES
SED
PUB
LIC
VA
LUA
TIO
NSC
HO
OL
TAX
EQU
ALI
ZED
JUN
E 30
,LA
ND
RES
IDEN
TIA
LFA
RM
REG
ULA
RQ
FA
RM
CO
MM
ERC
IAL
IND
UST
RIA
LA
PAR
TMEN
TV
ALU
EU
TILI
TIES
TAX
AB
LER
ATE
VA
LUE
2017
8,47
6,60
0$
116,
194,
500
$
6,02
7,70
0$
700,
100
$
39,0
84,1
00$
-
$
-$
17
0,48
3,00
0$
1,32
2,60
0$
17
1,80
5,60
0$
0.86
7
190,
269,
922
$
2016
8,66
6,30
0
117,
283,
100
5,09
3,10
0
707,
180
27,3
54,1
00
-
-
15
9,10
3,78
0
1,04
1,30
0
16
0,14
5,08
0
0.88
3
177,
090,
274
2015
9,04
8,20
0
117,
471,
700
5,13
6,70
0
702,
600
27,3
54,1
00
-
-
15
9,71
3,30
0
1,04
6,30
1
16
0,75
9,60
1
0.83
8
146,
998,
579
2014
(r)
11,6
31,1
00
142,
805,
600
5,79
1,50
0
711,
600
27,1
20,5
00
-
-
18
8,06
0,30
0
1,07
9,63
6
18
9,13
9,93
6
0.66
9
201,
074,
666
2013
11,6
31,0
00
145,
382,
700
5,89
8,20
0
707,
700
29,5
50,5
00
-
-
19
3,17
0,10
0
1,08
1,01
1
19
4,25
1,11
1
0.62
1
200,
214,
620
2012
11,5
65,7
00
146,
447,
200
6,14
8,60
0
562,
700
29,5
54,5
00
-
-
19
4,27
8,70
0
1,10
9,48
5
19
5,38
8,18
5
0.63
7
201,
671,
353
2011
12,0
14,8
00
145,
419,
700
5,99
2,30
0
553,
000
29,5
54,5
00
-
-
19
3,53
4,30
0
1,25
5,07
7
19
4,78
9,37
7
0.61
1
202,
641,
353
2010
11,7
25,9
00
147,
096,
800
6,19
5,40
0
553,
000
32,0
54,5
00
-
-
19
7,62
5,60
0
1,32
7,38
1
19
8,95
2,98
1
0.57
7
187,
362,
785
2009
12,5
96,0
00
149,
795,
300
5,91
5,60
0
525,
300
32,8
93,2
00
-
-
20
1,72
5,40
0
1,22
2,26
9
20
2,94
7,66
9
0.54
5
196,
172,
249
2008
N/A
N/A
N/A
N/A
N/A
N/A
N/A
N/A
N/A
N/A
1.47
1
N/A
(r) -
Rea
sses
smen
t
Sour
ce: C
ount
y A
bstra
ct o
f Rat
able
s & M
unic
ipal
Tax
Ass
esso
r
BA
SS R
IVE
R T
OW
NSH
IP S
CH
OO
L D
IST
RIC
TA
SSE
SSE
D V
AL
UE
AN
D A
CT
UA
L V
AL
UE
OF
TA
XA
BL
E P
RO
PER
TY
LA
ST T
EN
FIS
CA
L Y
EA
RS
147

EXH
IBIT
J-7
FISC
AL
TOTA
LY
EAR
GEN
ERA
LD
IREC
T A
ND
END
EDB
ASI
CO
BLI
GA
TIO
NTO
TAL
TOW
NSH
IP O
F B
UR
LIN
GTO
NPI
NEL
AN
DS
REG
ION
AL
OV
ERLA
PPIN
GJU
NE
30,
RA
TED
EBT
SER
VIC
ED
IREC
TB
ASS
RIV
ERC
OU
NTY
SC
HO
OL
DST
RIC
TTA
X R
ATE
2017
$0.8
67$0
.000
$0.8
67$0
.156
$0.4
70$0
.693
$2.1
8620
160.
883
0.00
00.
883
0.15
60.
461
0.70
32.
203
2015
0.83
80.
000
0.83
80.
131
0.41
90.
648
2.03
620
14 (r
) 0.
669
0.00
00.
669
0.10
70.
357
0.51
31.
646
2013
0.63
70.
000
0.63
70.
056
0.37
20.
494
1.55
920
120.
621
0.00
00.
621
0.04
10.
376
0.47
41.
512
2011
0.61
10.
000
0.61
10.
042
0.39
40.
479
1.52
620
100.
577
0.00
00.
577
0.01
20.
353
0.43
31.
375
2009
0.54
50.
000
0.54
50.
011
0.37
70.
404
1.33
720
081.
401
0.07
01.
471
0.00
01.
003
0.99
63.
470
(r) R
eass
essm
ent
Sour
ce: M
unic
ipal
Tax
Col
lect
or
OV
ERLA
PPIN
G R
ATE
SB
ass R
iver
Tow
nshi
p Sc
hool
Dis
trict
Dire
ct
BA
SS R
IVE
R T
OW
NSH
IP S
CH
OO
L D
IST
RIC
TD
IRE
CT
AN
D O
VE
RL
APP
ING
PR
OPE
RT
Y T
AX
RA
TE
SL
AST
TE
N F
ISC
AL
YE
AR
S
(Rat
e pe
r $10
0 of
Ass
esse
d V
alue
)B
ASS
RIV
ER
TO
WN
SHIP
148

EXHIBIT J-8
% OF TOTAL % OF TOTALTAXABLE DISTRICT NET TAXABLE DISTRICT NETASSESSED ASSESSED ASSESSED ASSESSED
TAXPAYER VALUE RANK VALUE VALUE RANK VALUE
Total $0 0.00% 0 0.00%
Source: Municipal Tax Assessor
NOT AVAILABLE
BASS RIVER TOWNSHIP SCHOOL DISTRICTPRINCIPAL PROPERTY TAX PAYERS
CURRENT YEAR AND NINE YEARS AGO
2017 2008
149

EXHIBIT J-9
FISCAL TAXES COLLECTIONSYEAR LEVIED FOR IN
ENDED THE FISCAL PERCENTAGE SUBSEQUENTJUNE 30, YEAR AMOUNT OF LEVY YEARS
2017 1,455,596.00$ 1,455,596.00$ 100.00% -2016 1,427,055.00 1,427,055.00 100.00% -2015 1,346,565.00 1,346,565.00 100.00% -2014 1,263,753.00 1,263,753.00 100.00% -2013 1,238,974.00 1,135,726.00 91.67% N/A2012 1,214,680.00 1,214,680.00 100.00% -2011 2,954,269.00 2,805,337.00 94.96% N/A2010 2,985,799.00 2,811,748.00 94.17% N/A2009 2,735,750.00 2,535,476.00 92.68% N/A2008 2,716,927.00 2,449,045.00 90.14% N/A
Source: District records including the Certificate and Report of School Taxes (A4F form)
YEAR OF THE LEVY
BASS RIVER TOWNSHIP SCHOOL DISTRICTPROPERTY TAX LEVIES AND COLLECTIONS
LAST TEN FISCAL YEARS
COLLECTED WITHIN THE FISCAL
150

Debt Capacity Information
Debt capacity information is intended to assist users in understanding and assessingthe School District's debt burden and its ability to issue additional debt. Please referto the following exhibits for a historical view of the school District's outstanding debtand its debt capacity.
151

This page intentionally left blank
152

EXHIBIT J-10
FISCALYEAR GENERAL PERCENTAGE PER CAPITA
ENDED OBLIGATION CAPITAL TOTAL OF PERSONAL PERSONALJUNE, 30 BONDS LEASES DISTRICT INCOME INCOME
2017 -$ 590,414$ 590,414$ N/A N/A2016 - 241,390 241,390 N/A N/A2015 - 341,874 341,874 619.03% 55,227$ 2014 - 163,277 163,277 303.79% 53,747 2013 - 294,012 294,012 567.76% 51,785 2012 - - - N/A 51,390 2011 - - - N/A 49,955 2010 - - - N/A 48,047 2009 - - - N/A 47,649 2008 - - - N/A 47,816
* = The Per Capital Income information presented is for the entire County of Burlington.
Source: District CAFR Schedules I-1, I-2
BASS RIVER TOWNSHIP SCHOOL DISTRICTRATIOS OF OUTSTANDING DEBT BY TYPE
LAST TEN FISCAL YEARS
GOVERNMENTAL ACTIVITIES
153

EXHIBIT J-11
NET PERCENTAGEFISCAL GENERAL OF ACTUALYEAR GENERAL BONDED TAXABLE
ENDED OBLIGATION DEDUCTIONS DEBT VALUE OFJUNE 30, BONDS OUTSTANDING PROPERTY PER CAPITA
2017 - - - 0.00% N/A2016 - - - 0.00% N/A2015 - - - 0.00% 55,227$ 2014 - - - 0.00% 53,747 2013 - - - 0.00% 51,785 2012 - - - 0.00% 51,390 2011 - - - 0.00% 49,955 2010 - - - 0.00% 48,047 2009 - - - 0.00% 47,649 2008 - - - 0.07% 47,816
OUTSTANDING
BASS RIVER TOWNSHIP SCHOOL DISTRICT
GENERAL BONDED DEBT
RATIOS OF NET GENERAL BONDED DEBT OUTSTANDINGLAST TEN FISCAL YEARS
154

EXHIBIT J-12
ESTIMATED SHARE OFDEBT PERCENTAGE OVERLAPPING
OUTSTANDING APPLICABLE DEBT
Debt Repaid With Property Taxes: Local Municipality 410,828$ 100.00% 410,828$ Pinelands Regional School District 5,393,000 5.64% 304,165 County of Burlington 314,942,084 0.39% 1,242,138
Subtotal, Overlapping Debt 1,957,131
Local School District Direct Debt 590,414
Total Direct & Overlapping Debt 2,547,545$
Sources: Assessed value data used to estimate applicable percentages provided by the Burlington County Boardof Taxation.
BASS RIVER TOWNSHIP SCHOOL DISTRICTRATIOS OF OVERLAPPING GOVERNMENTAL ACTIVITIES DEBT
AS OF JUNE 30, 2017
GOVERNMENTAL UNIT
155

EXH
IBIT
J-13
2017
2016
2015
2014
2013
2012
2011
2010
2009
2008
Deb
t Lim
it4,
400,
623
$
4,
406,
656
$
4,
445,
108
$
4,
544,
568
$
4,
804,
139
$
4,84
6,21
6$
4,84
4,32
0$
4,86
0,06
4$
4,58
8,38
0$
4,08
6,10
4$
Tota
l Net
Deb
t App
licab
le to
L
imit
- -
- -
- -
- -
- -
Lega
l Deb
t Mar
gin
4,40
0,62
3$
4,40
6,65
6$
4,44
5,10
8$
4,54
4,56
8$
4,80
4,13
9$
4,
846,
216
$
4,
844,
320
$
4,
860,
064
$
4,
588,
380
$
4,
086,
104
$
Tota
l Net
Deb
t App
licab
le to
the
Lim
it
as a
Per
cent
age
of D
ebt L
imit
0.00
%0.
00%
0.00
%0.
00%
0.00
%0.
00%
0.00
%0.
00%
0.00
%0.
00%
Equa
lized
Val
uatio
n B
asis
2016
174,
979,
986
$
2015
176,
538,
001
20
1417
6,55
6,82
1 52
8,07
4,80
8$
Ave
rage
Equ
aliz
ed V
alua
tion
of T
axab
le P
rope
rty17
6,02
4,93
6$
Deb
t Lim
it (2
.50%
of A
vera
ge E
qual
izat
ion
Val
ue)
4,40
0,62
3$
N
et B
onde
d Sc
hool
Deb
t-
Lega
l Deb
t Mar
gin
4,40
0,62
3$
Sour
ce:
Equa
lized
val
uatio
n ba
ses w
ere
obta
ined
from
the
Ann
ual R
epor
t of t
he S
tate
of N
ew Je
rsey
,D
epar
tmen
t of T
reas
ury,
Div
isio
n of
Tax
atio
n
Leg
al D
ebt M
argi
n C
alcu
latio
n fo
r Fi
scal
Yea
r 20
17
FISC
AL
YEA
R E
ND
ING
JUN
E 30
,
BA
SS R
IVE
R T
OW
NSH
IP S
CH
OO
L D
IST
RIC
TL
EG
AL
DE
BT
MA
RG
IN IN
FOR
MA
TIO
NL
AST
TE
N F
ISC
AL
YE
AR
S
(Dol
lars
in T
hous
ands
)
156

Demographic and Economic Information
Demographic and economic information is intended to (1) to assist users inunderstanding the socioeconomic environment within which the School Districtoperates and (2) to provide information that facilitates comparisons of financialinformation over time and among school districts. Please refer to the followingexhibits for a historical view of the demographic and economic statistics and factorsprevalent in the location in which the School District's operates.
157

This page intentionally left blank
158

EXHIBIT J-14
PER CAPITAPERSONAL PERSONAL UNEMPLOYMENT
YEAR POPULATION INCOME INCOME RATE
BASS RIVER TOWNSHIP2017 1,443 N/A N/A 7.5%2016 1,449 N/A N/A 4.2%2015 1,445 79,803,015$ 55,227$ 6.5%2014 1,445 77,664,415 53,747 10.5%2013 1,444 74,777,540 51,785 12.3%2012 1,445 74,258,550 51,390 9.2%2011 * 1,446 72,234,930 49,955 9.0%2010 1,541 74,040,427 48,047 9.0%2009 1,547 73,713,003 47,649 8.7%2008 1,551 74,162,616 47,816 5.1%
* 2010 Census
EXHIBIT J-15
CURRENT YEAR AND TEN YEARS AGO
NOT AVAILABLE
BASS RIVER TOWNSHIP SCHOOL DISTRICTDEMOGRAPHIC AND ECONOMIC STATISTICS
LAST TEN FISCAL YEARS
PRINCIPAL EMPLOYERS
159

This page intentionally left blank.
160

Operating Information
Operating information is intended to provide contextual information about the SchoolDistrict's operations and resources to assist readers in using financial information tounderstand and assess the School District's economic condition. Please refer to thefollowing exhibits for a historical view of the factors and statistics pertinent to theSchool District's operations.
161

This page intentionally left blank
162

EXH
IBIT
J-16
2017
2016
2015
2014
2013
2012
2011
2010
2009
2008
Func
tion/
Prog
ram
Inst
ruct
ion:
R
egul
ar7.
2514
.012
.012
.011
.011
.511
.411
.411
.411
.4
Spe
cial
Edu
catio
n3.
03.
04.
04.
04.
04.
03.
03.
03.
03.
0
Oth
er S
peci
al E
duca
tion
Inst
ruct
ion
4.75
3.0
3.0
2.0
2.0
0.8
0.8
0.8
0.8
0.8
Supp
ort S
ervi
ces:
S
tude
nt &
Inst
ruct
ion
Rel
ated
Ser
vice
s2.
12.
03.
03.
03.
03.
23.
23.
24.
23.
4
Gen
eral
Adm
inis
trativ
e Se
rvic
es0.
51.
51.
51.
51.
51.
71.
71.
71.
71.
0
Sch
ool A
dmin
istra
tive
Serv
ices
0.75
2.0
2.0
2.0
2.0
2.0
2.0
2.0
2.0
2.0
P
lant
Ope
ratio
ns &
Mai
nten
ance
2.5
2.5
2.5
2.5
2.5
2.5
2.5
2.5
2.5
2.5
O
ther
Sup
port
Serv
ices
0.5
1.0
1.0
1.0
1.0
1.0
1.0
1.0
1.0
1.0
F
ood
Serv
ice
0.0
0.0
0.0
0.0
0.0
0.0
0.0
0.0
1.6
1.6
Tota
l21
.429
.029
.028
.027
.026
.725
.625
.628
.226
.7
Sour
ce: D
istri
ct P
erso
nnel
Rec
ords
LA
ST T
EN
FIS
CA
L Y
EA
RS
FUL
L-T
IME
EQ
UIV
AL
EN
T D
IST
RIC
T E
MPL
OY
EE
S B
Y F
UN
CT
ION
/PR
OG
RA
MB
ASS
RIV
ER
TO
WN
SHIP
SC
HO
OL
DIS
TR
ICT
163

EXH
IBIT
J-17
PUPI
L/TE
AC
HER
RA
TIO
AV
ERA
GE
AV
ERA
GE
% C
HA
NG
E IN
OPE
RA
TIN
GD
AIL
YD
AIL
YA
VER
AG
E ST
UD
ENT
FISC
AL
EXPE
ND
ITU
RES
CO
ST P
ERPE
RC
ENTA
GE
TEA
CH
ING
ELEM
ENTA
RY
ENR
OLL
MEN
TA
TTEN
DA
NC
ED
AIL
Y
ATT
END
AN
CE
YEA
REN
RO
LLM
ENT
(a)
PUPI
LC
HA
NG
EST
AFF
(b)
SCH
OO
L(A
DE)
(c)
(AD
A) (
c)EN
RO
LLM
ENT
PER
CEN
TAG
E
2017
102
$2,7
32,4
13
26,7
88
3.52
%15
1:
6.8
102.
0 96
.6
-6.8
5%94
.67%
2016
106
2,74
2,98
6 25
,877
7.
67%
17
1:7.
510
9.5
102.
7 -0
.54%
93.7
9%20
1511
0 2,
643,
821
24,0
35
5.97
%19
1:
0811
0.1
109.
3 1.
10%
94.4
7%20
1411
3 2,
562,
925
22,6
81
16.2
4%19
1:
0610
8.9
102.
9 -1
1.82
%94
.49%
2013
126
2,45
8,56
0 19
,512
16
.63%
18
1:07
123.
5 11
7.8
10.2
9%95
.38%
2012
136
2,27
5,28
3 16
,730
-4
.60%
22
1:03
131.
8 12
6.0
-6.4
0%92
.45%
2011
121
2,12
1,95
4 17
,537
-0
.96%
18
1:07
119.
5 11
3.5
-18.
80%
93.7
5%20
1012
5 2,
213,
436
17,7
07
1.49
%18
1:
0812
7.7
120.
0 -1
5.74
%93
.75%
2009
126
2,19
8,49
0 17
,448
5.
17%
20
1:16
107.
0 10
1.3
-1.5
5%91
.34%
2008
127
2,10
6,98
5 16
,590
7.
37%
20
1:16
127.
0 11
6.0
3.70
%91
.34%
Sour
ces:
D
istri
ct re
cord
s
Not
e: E
nrol
lmen
t bas
ed o
n an
nual
Oct
ober
dis
trict
cou
nt.
aO
pera
ting
expe
nditu
res e
qual
tota
l exp
endi
ture
s les
s deb
t ser
vice
and
cap
ital o
utla
y.b
Teac
hing
staf
f inc
lude
s onl
y fu
ll-tim
e eq
uiva
lent
s of c
ertif
icat
ed st
aff.
cA
vera
ge d
aily
enr
ollm
ent a
nd a
vera
ge d
aily
atte
ndan
ce a
re o
btai
ned
from
the
Scho
ol R
egist
er S
umm
ary
(SR
S).
BA
SS R
IVE
R T
OW
NSH
IP S
CH
OO
L D
IST
RIC
TO
PER
AT
ING
ST
AT
IST
ICS
LA
ST T
EN
FIS
CA
L Y
EA
RS
164

EXH
IBIT
J-18
DIS
TRIC
T B
UIL
DIN
G20
1720
1620
1520
1420
1320
1220
1120
1020
0920
08
Bas
s Riv
er T
owns
hip
Elem
enta
ry S
choo
l
S
quar
e Fe
et45
,299
45,2
9945
,299
45,2
9945
,299
45,2
9945
,299
45,2
9945
,299
45,2
99
C
apac
ity (S
tude
nts)
205
205
205
205
205
205
205
205
205
205
Enr
ollm
ent
106
110
113
113
126
136
121
119
126
127
Num
ber o
f Sch
ools
at J
une
30, 2
017:
E
lem
enta
ry S
choo
l = 1
M
iddl
e Sc
hool
= 0
H
igh
Scho
ol =
0
Oth
er =
0
Sour
ce: D
istri
ct F
acili
ties O
ffice
BASS
RIV
ER T
OW
NSH
IP S
CH
OO
L D
ISTR
ICT
SCH
OO
L BU
ILD
ING
INFO
RM
ATI
ON
LAST
TEN
FIS
CA
L Y
EAR
FISC
AL
YEA
R E
ND
ING
JUN
E 30
,
165

EXHIBIT J-19
UNDISTRIBUTED EXPENDITURES - REQUIRED MAINTENANCE FOR SCHOOL FACILITIES
11-000-261-xxxBass River Township
* School Facilities Elementary SchoolProject Numbers 4950-060-04-1000
2017 19,233$ 2016 14,623 2015 8,171 2014 15,708 2013 27,149 2012 33,161 2011 21,812 2010 31,488 2009 72,044 2008 31,393
BASS RIVER TOWNSHIP SCHOOL DISTRICTSCHEDULE OF REQUIRED MAINTENANCE
LAST TEN FISCAL YEARS
166

EXHIBIT J-20
DEDUCTIBLE
School Package Policy NJ School Board Association 350,000,000$ Property-Blanket Building & Contents 5,668,437 1,000 Commercial General Liability General Aggregate 16,000,000 N/A Products & Completed Operations Aggreg 16,000,000 N/A Personal & Advertising Injury 16,000,000 N/A Each Occurrence 16,000,000 N/A Fire Damage (Any on Fire) 16,000,000 N/A Medical Expense (Any one Person) 10,000 N/A Professional Liability Coverage A - Each Policy Period 16,000,000 10,000/claim Coverage B - Each Claim 100,000 Coverage C - Each Policy Period 300,000 10,000/claim Comprehensive Automobile Liability Hired & Non Owned Only 16,000,000 N/A Commercial Crime Policy Money-All risk In/Out 25,000 500 Public Employee Dishonesty 500,000 1,000 Forgery & Altercation 100,000 500 Computer Fraud 100,000 500
Computer & Scheduled Equipment Utica National Ins Group- Commercial Inland Marine Computers 185,000 1,000 Commercial Articles Included
Boiler & Machinery- Hartford Stm Boiler Boiler & Machinery 100,000,000 1,000 Business Interruption Included 12 hours Property-Blanket Building & Contents 5,668,437 1,000 Commercial General Liability Extra Expense 10,000,000 Service Interruption 10,000,000 24 hours
Accident & HealthBerkeley Accident & Health LLC Accident & Health 1,000,000 N/A Accident & Health/Voluntary 500,000 N/A Retained Limit
Public Employee's Fidelity Bonds- Utica National Ins. Group Board Secretary 100,000 N/A Treasurer of School Monies 180,000 N/A
Workers Compensation- NJ School Board Association Each Accident 2,000,000 N/A Disease-Policy Limit 2,000,000 N/A Disease-Each Employee 2,000,000 N/A
BASS RIVER TOWNSHIP SCHOOL DISTRICT
TYPE OF COVERAGECOMPANY
INSURANCE SCHEDULEJUNE 30, 2017
167

This page intentionally left blank.
168

SINGLE AUDIT SECTION
169

This page intentionally left blank
170

EXHIBIT K-1
INDEPENDENT AUDITOR’S REPORT ON INTERNAL CONTROL OVER FINANCIAL REPORTING AND ON COMPLIANCE AND OTHER MATTERS BASED ON AN AUDIT OF
FINANCIAL STATEMENTS PERFORMED IN ACCORDANCE WITH GOVERNMENT AUDITING STANDARDS
Honorable President and Members of the Board of Education Bass River Township School District County of Burlington New Gretna, New Jersey
We have audited, in accordance with the auditing standards generally accepted in the United States of America and the standards applicable to financial audits contained in Government Auditing Standards issued by the Comptroller General of the United States and audit requirements as prescribed by the Office of School Finance, Department of Education, State of New Jersey, the financial statements of the governmental activities, each major fund and the aggregate remaining fund information of the Bass River Township School District, as of and for the year ended June 30, 2017, and the related notes to the financial statements, which collectively comprise the Bass River Township School District’s basic financial statements, and have issued our report thereon dated October 18, 2017.
Internal Control Over Financial Reporting
In planning and performing our audit of the financial statements, we considered the Bass River Township School District’s internal control over financial reporting (internal control) to determine the audit procedures that are appropriate in the circumstances for the purpose of expressing our opinions on the financial statements, but not for the purpose of expressing an opinion on the effectiveness of the School District’s internal control. Accordingly, we do not express an opinion on the effectiveness of the Bass River Township School District’s internal control.
Our consideration of internal control was for the limited purpose described in the preceding paragraph and was not designed to identify all deficiencies in internal control that might be material weaknesses or significant deficiencies and therefore, material weaknesses or significant deficiencies may exist that were not identified. However, as described in the accompanying schedule of findings and questioned costs, we identified certain deficiencies in internal control that we consider to be material weaknesses and significant deficiencies.
A deficiency in internal control exists when the design or operation of a control does not allow management or employees, in the normal course of performing their assigned functions, to prevent, or detect and correct, misstatements on a timely basis. A material weakness is a deficiency, or a combination of deficiencies, in internal control, such that there is a reasonable possibility that a material misstatement of the entity’s financial statements will not be prevented, or detected and corrected on a timely basis. A significant deficiency is a deficiency, or a combination of deficiencies, in internal control that is less severe than a material weakness, yet important enough to merit attention by those charged with governance.
Our consideration of internal control was for the limited purpose described in the first paragraph of this section and was not designed to identify all deficiencies in internal control that might be material weaknesses or significant deficiencies and therefore, material weaknesses or significant deficiencies may
171

exist that were not identified. Given these limitations, during our audit we did not identify any deficiencies in internal control that we consider to be material weaknesses. We did identify certain deficiencies in internal control, described in the accompanying schedule of findings and questioned costs to be a significant deficiency as finding no. 2017-001. Compliance and Other Matters As part of obtaining reasonable assurance about whether the Bass River Township School District’s financial statements are free from material misstatement, we performed tests of its compliance with certain provisions of laws, regulations, contracts, and grant agreements, noncompliance with which could have a direct and material effect on the determination of financial statement amounts. However, providing an opinion on compliance with those provisions was not an objective of our audit, and accordingly, we do not express such an opinion. The results of our tests disclosed one instance of noncompliance or other matters that is required to be reported under Government Auditing Standards, and audit requirements as prescribed by the Office of School Finance, Department of Education, State of New Jersey as finding no. 2017-001. The Bass River Township School District’s Response to Findings The Bass River Township School District’s response to the finding identified in our audit is described in the accompanying schedule of findings and questioned costs. The School District’s response was not subjected to the auditing procedures applied in the audit of the financial statements and, accordingly, we express no opinion on it. Purpose of this Report The purpose of this report is solely to describe the scope of our testing of internal control and compliance and the results of that testing, and not to provide an opinion on the effectiveness of the School District’s internal control or on compliance. This report is an integral part of an audit performed in accordance with Government Auditing Standards and audit requirements as prescribed by the Office of School Finance, Department of Education, State of New Jersey, and federal and state awarding agencies and pass-through entities, in considering the School District’s internal control and compliance. Accordingly, this communication is not suitable for any other purpose.
Respectfully Submitted,
HOLMAN FRENIA ALLISON, P.C.
Rodney R. Haines Certified Public Accountant Public School Accountant, No. 2198
Toms River, New Jersey October 18, 2017
172

EXHIBIT K-2
INDEPENDENT AUDITOR’S REPORT ON COMPLIANCE FOR EACH MAJOR PROGRAM AND ON INTERNAL CONTROL OVER COMPLIANCE REQUIRED BY NEW JERSEY OMB
CIRCULAR 15-08
Honorable President and Members of the Board of Education Bass River Township School District County of Burlington New Gretna, New Jersey Report on Compliance for Each Major State Program We have audited the Bass River Township School District’s compliance with the types of compliance requirements described in the New Jersey State Aid/Grant Compliance Supplement that could have a direct and material effect on each of the School District’s major state programs for the fiscal year ended June 30, 2017. The Bass River Township School District’s major state programs are identified in the summary of auditor’s results section of the accompanying schedule of findings and questioned costs. Management’s Responsibility Management is responsible for compliance with state statutes, regulations, and the terms and conditions of its state awards applicable to its state programs. Auditor’s Responsibility Our responsibility is to express an opinion on compliance for each of the Bass River Township School District’s major state programs based on our audit of the types of compliance requirements referred to above. We conducted our audit of compliance in accordance with auditing standards generally accepted in the United States of America; the standards applicable to financial audits contained in Government Auditing Standards, issued by the Comptroller General of the United States; New Jersey OMB’s Circular 15-08, Single Audit Policy for Recipients of Federal Grants, State Grants and State Aid; and the audit requirements prescribed by the Office of School Finance, Department of Education, State of New Jersey. Those standards and New Jersey OMB’s Circular 15-08 require that we plan and perform the audit to obtain reasonable assurance about whether noncompliance with the types of compliance requirements referred to above that could have a direct and material effect on a major state program occurred. An audit
173

includes examining, on a test basis, evidence about the School District’s compliance with those requirements and performing such other procedures as we considered necessary in the circumstances. We believe that our audit provides a reasonable basis for our opinion on compliance for each major state program. However, our audit does not provide a legal determination of the School District’s compliance. Opinion on Each Major State Program In our opinion, the Bass River Township School District complied, in all material respects, with the types of compliance requirements referred to above that could have a direct and material effect on each of its major state programs for the year ended June 30, 2017. Other Matters The results of our auditing procedures disclosed instances of noncompliance, which are required to be reported in accordance with New Jersey OMB’s Circular 15-08 and which are described in the accompanying schedule of findings and questioned costs as items 2017-002. Our opinion on each major state program is not modified with respect to these matters. Bass River Township School District’s response to the noncompliance findings identified in our audit is described in the accompanying schedule of findings and questioned costs. Bass River Township School District’s response was not subjected to the auditing procedures applied in the audit of compliance and, accordingly, we express no opinion on the response. Report on Internal Controls Over Compliance Management of the Bass River Township School District is responsible for establishing and maintaining effective internal control over compliance with the types of compliance requirements referred to above. In planning and performing our audit of compliance, we considered the School District’s internal control over compliance with the types of requirements that could have a direct and material effect on each major state program to determine the auditing procedures that are appropriate in the circumstances for the purpose of expressing an opinion on compliance for each major state program and to test and report on internal control over compliance in accordance with New Jersey OMB’s Circular 15-08, but not for the purpose of expressing an opinion on the effectiveness of internal control over compliance. Accordingly, we do not express an opinion on the effectiveness of the School District’s internal control over compliance. Our consideration of internal control over compliance was for the limited purpose described in the preceding paragraph and was not designed to identify all deficiencies in internal control over compliance that might be material weaknesses or significant deficiencies and therefore, material weaknesses or significant deficiencies may exist that were not identified. However, as discussed below, we identified certain deficiencies in internal control over compliance that we consider to be a significant deficiency. A deficiency in internal control over compliance exists when the design or operation of a control over compliance does not allow management or employees, in the normal course of performing their assigned functions, to prevent, or detect and correct, noncompliance with a type of compliance requirement of a state program on a timely basis. A material weakness in internal control over compliance is a deficiency, or combination of deficiencies, in internal control over compliance, such that there is a reasonable
174

possibility that material noncompliance with a type of compliance requirement of a state program will not be prevented, or detected and corrected, on a timely basis. We did not identify any deficiencies in internal control over compliance that we consider to be material weaknesses. However, material weaknesses may exist that have not been identified. A significant deficiency in internal control over compliance is a deficiency, or a combination of deficiencies, in internal control over compliance with a type of compliance requirement of a state program that is less severe than a material weakness in internal control over compliance, yet important enough to merit attention by those charged with governance. We consider the deficiency in internal control over compliance described in the accompanying schedule of findings and questioned costs as items 2017-002 to be a significant deficiency. Bass River Township School District’s response to the internal control over compliance findings identified in our audit is described in the accompanying schedule of findings and questioned costs. Bass River Township School District’s response was not subjected to the auditing procedures applied in the audit of compliance and, accordingly, we express no opinion on the response. The purpose of this report on internal control over compliance is solely to describe the scope of our testing of internal control over compliance and the results of that testing based on the requirements of New Jersey OMB’s Circular 15-08. Accordingly, this report is not suitable for any other purpose.
Respectfully Submitted,
HOLMAN FRENIA ALLISON, P.C.
Rodney R. Haines Certified Public Accountant Public School Accountant, No. 2198
Toms River, New Jersey October 18, 2017
175

This page intentionally left blank.
176

The
acco
mpa
nyin
g N
otes
to S
ched
ules
of E
xpen
ditu
res o
f Fed
eral
Aw
ards
and
Sta
te F
inan
cial
Ass
istan
ce a
re a
n in
tegr
al p
art o
f thi
s sch
edul
e.
EXH
IBIT
K-3
SCH
EDU
LE A
Pass
-Thr
ough
Fede
ral
Fede
ral A
war
dEn
tity
Prog
ram
or
Bal
ance
To
tal
Pass
edC
FDA
Iden
tific
atio
nId
entif
ying
Aw
ard
Gra
nt P
erio
dat
June
30,
Cas
hB
udge
tary
Th
roug
h to
Acc
ount
s U
near
ned
Due
toN
umbe
r N
umbe
r N
umbe
rA
mou
ntFr
omTo
2016
Rec
eive
dEx
pend
iture
sSu
brec
ipie
nts
Rec
eiva
ble
Rev
enue
Gra
ntor
U.S
. Dep
artm
ent o
f Edu
catio
nPa
ssed
-thro
ugh
Stat
e D
epar
tmen
t of E
duca
tion:
Spec
ial R
even
ue F
und:
Spec
ial E
duca
tion
Clu
ster
:I.D
.E.A
. Par
t B, B
asic
84.0
27H
027A
1601
0010
0-03
4-50
65-0
1645
,731
$
7/1/
2016
6/30
/201
7-
$
50,0
00$
(45,
731)
$
-
$
-
$
4,26
9$
-
$
I.D.E
.A. P
art B
, Pre
scho
ol84
.173
H17
3A16
0114
100-
034-
5065
-020
3,57
5
7/1/
2016
6/30
/201
7-
3,57
5
(3,5
75)
-
-
-
-
To
tal S
peci
al E
duca
tion
Clu
ster
-
53
,575
(4
9,30
6)
-
-
4,
269
-
Oth
er P
rogr
ams:
Title
I, P
art A
84.0
10S0
10A
1600
3010
0-03
4-50
64-1
9424
,558
7/1/
2016
6/30
/201
7-
24,5
58
(24,
558)
-
-
-
-
Ti
tle II
, Par
t A S
uppo
rting
Effe
ctiv
e In
stru
ctio
n84
.367
S367
A16
0029
100-
034-
5063
-290
4,51
3
7/1/
2016
6/30
/201
7-
4,51
3
(4,5
13)
-
-
-
-
Title
VI,
Smal
l Rur
al S
choo
ls A
chie
vem
ent P
rogr
am84
.358
S358
B16
0030
Not
Ava
ilabl
e16
,397
7/1/
2016
6/30
/201
7-
16,3
97
(16,
397)
-
-
-
-
Ti
tle V
I, Sm
all R
ural
Sch
ools
Ach
ieve
men
t Pro
gram
84.3
58S3
58B
1500
30N
ot A
vaila
ble
15,1
87
7/
1/20
156/
30/2
016
(1,5
19)
1,51
9
-
-
-
-
-
Subt
otal
for C
FDA
#84
.358
(1,5
19)
17,9
16
(16,
397)
-
-
-
-
Tota
l Spe
cial
Rev
enue
Fun
d(1
,519
)
10
0,56
2
(9
4,77
4)
-
-
4,
269
-
Tota
l U.S
. Dep
artm
ent o
f Edu
catio
n(1
,519
)
10
0,56
2
(9
4,77
4)
-
-
4,
269
-
Tota
l Fed
eral
Aw
ards
(1,5
19)
$
100,
562
$
(94,
774)
$
-
$
-
$
4,26
9$
-
$
Gra
ntor
/Pro
gram
Titl
e or
Clu
ster
BA
SS R
IVER
TO
WN
SHIP
SC
HO
OL
DIS
TRIC
TSC
HED
ULE
OF
EXPE
ND
ITU
RES
OF
FED
ERA
L A
WA
RD
SFO
R T
HE
FISC
AL
YEA
R E
ND
ED J
UN
E 30
, 201
7
Bal
ance
at J
une
30, 2
017
Fede
ral G
rant
or/P
ass-
Thro
ugh
177

The
acco
mpa
nyin
g N
otes
to S
ched
ules
of E
xpen
ditu
res o
f Aw
ards
and
Fin
anci
al A
ssis
tanc
e ar
e an
inte
gral
par
t of t
his s
ched
ule.
EXH
IBIT
K-4
SCH
EDU
LE B
Gra
nt o
rPr
ogra
m o
rPa
ssed
Cum
ulat
ive
Stat
e Pr
ojec
tA
war
d G
rant
Per
iod
Bal
ance
Cas
hB
udge
tary
Th
roug
h To
Acc
ount
sU
near
ned
Due
toB
udge
tary
Tota
lN
umbe
rA
mou
ntFr
omTo
June
30,
201
6R
ecei
ved
Expe
nditu
res
Subr
ecip
ient
sR
ecei
vabl
eR
even
ueG
rant
orR
ecei
vabl
eEx
pend
iture
s
Stat
e D
epar
tmen
t of E
duca
tion:
Gen
eral
Fun
d:St
ate
Aid
- Pu
blic
:Eq
ualiz
atio
n A
id49
5-03
4-51
20-0
7863
8,48
4$
7/1/
2016
6/30
/201
7-
$
638,
484
$
(638
,484
)$
-$
-
$
-
$
-
$
63,8
50$
63
8,48
4$
Sp
ecia
l Edu
catio
n C
ateg
oric
al A
id49
5-03
4-51
20-0
8967
,203
7/1/
2016
6/30
/201
7-
67,2
03
(67,
203)
-
-
-
-
6,
720
67
,203
Secu
rity
Aid
495-
034-
5120
-084
22,1
24
7/
1/20
166/
30/2
017
-
22
,124
(2
2,12
4)
-
-
-
-
2,21
1
22,1
24
A
djus
tmen
t Aid
495-
034-
5120
-085
129,
586
7/
1/20
166/
30/2
017
-
12
9,58
6
(1
29,5
86)
-
-
-
-
12
,958
129,
586
Per P
upil
Gro
wth
Aid
495-
034-
5120
-097
1,15
0
7/
1/20
166/
30/2
017
-
1,
150
(1,1
50)
-
-
-
-
115
1,15
0
PAR
CC
Rea
dine
ss A
id49
5-03
4-51
20-0
981,
150
7/1/
2016
6/30
/201
7-
1,15
0
( 1
,150
)
-
-
-
-
11
5
1,
150
Pr
ofes
sion
al L
earn
ing
Com
mun
ity A
id49
5-03
4-51
20-1
011,
030
7/1/
2016
6/30
/201
7-
1,03
0
(1
,030
)
-
-
-
-
10
3
1,
030
To
tal S
tate
Aid
- Pu
blic
-
86
0,72
7
(8
60,7
27)
-
-
-
-
86
,072
860,
727
Tran
spor
tatio
n A
id49
5-03
4-51
20-0
1425
,972
7/1/
2016
6/30
/201
7-
25,9
72
(25,
972)
-
-
-
-
2,
597
25
,972
Add
ition
al N
onpu
blic
Tra
nspo
rtatio
n A
id49
5-03
4-51
20-0
1417
4
7/1/
2016
6/30
/201
7-
(1
74)
-
(174
)
-
-
-
17
4
Ex
traor
dina
ry A
id49
5-03
4-51
20-0
446,
048
7/1/
2016
6/30
/201
7-
(6
,048
)
-
(6,0
48)
-
-
-
6,
048
R
eim
burs
ed T
PAF
Soci
al S
ecur
ity C
ontri
butio
ns10
0-03
4-50
94-0
0376
,859
7/1/
2016
6/30
/201
7-
69,8
90
(76,
859)
-
(6,9
69)
-
-
-
76
,859
Rei
mbu
rsed
TPA
F So
cial
Sec
urity
Con
tribu
tions
100-
034-
5094
-003
83,9
01
7/
1/20
156/
30/2
016
(8,2
28)
8,22
8
-
-
-
-
-
-
83
,901
TPA
F - P
ensi
on
Con
tribu
tions
(Non
cash
Ass
ista
nce)
495-
034-
5094
-002
124,
245
7/
1/20
166/
30/2
017
-
12
4,24
5
(1
24,2
45)
-
-
-
-
-
124,
245
TPA
F - P
ost-R
etire
men
t M
edic
al (N
onca
sh A
ssis
tanc
e)49
5-03
4-50
94-0
0110
3,52
5
7/1/
2016
6/30
/201
7-
103,
525
(103
,525
)
-
-
-
-
-
10
3,52
5
TP
AF
- Lon
g-Te
rm D
isab
ility
In
sura
nce
(Non
cash
Ass
ista
nce)
495-
034-
5094
-004
365
7/
1/20
166/
30/2
017
-
36
5
(365
)
-
-
-
-
-
36
5
Tota
l Gen
eral
Fun
d(8
,228
)
1,
192,
952
(1
,197
,915
)
-
(13,
191)
-
-
88
,669
1,28
1,81
6
Tota
l Sta
te D
epar
tmen
t of E
duca
tion
(8,2
28)
1,19
2,95
2
(1,1
97,9
15)
-
(1
3,19
1)
-
-
88,6
69
1,
281,
816
Tota
l Sta
te F
inan
cial
Ass
ista
nce
(8,2
28)
$
1,19
2,95
2$
( 1,1
97,9
15)
$
-$
(1
3,19
1)$
-
$
-
$
88,6
69$
1,
281,
816
$
Stat
e Fi
nanc
ial A
ssis
tanc
e Pr
ogra
ms n
ot su
bjec
t to
Cal
cula
tion
for M
ajor
Pro
gram
Det
erm
inat
ion:
TPA
F - P
ensi
on
Con
tribu
tions
(Non
cash
Ass
ista
nce)
495-
034-
5094
-002
124,
245
7/
1/20
166/
30/2
017
(124
,245
)
TPA
F - P
ost-R
etire
men
t M
edic
al (N
onca
sh A
ssis
tanc
e)49
5-03
4-50
94-0
0110
3,52
5
7/1/
2016
6/30
/201
7(1
03,5
25)
TPA
F - L
ong-
Term
Dis
abili
ty
Insu
ranc
e (N
onca
sh A
ssis
tanc
e)49
5-03
4-50
94-0
0436
5
7/1/
2016
6/30
/201
7(3
65)
Tota
l Sta
te F
inan
cial
Ass
ista
nce
subj
ect t
o C
alcu
latio
n fo
r Maj
or P
rogr
am D
eter
min
atio
n(9
69,7
80)
$
BA
SS R
IVE
R T
OW
NSH
IP S
CH
OO
L D
IST
RIC
TSC
HE
DU
LE
OF
EX
PEN
DIT
UR
ES
OF
STA
TE
FIN
AN
CIA
L A
SSIS
TA
NC
EFO
R T
HE
FIS
CA
L Y
EA
R E
ND
ED
JU
NE
30,
201
7
Stat
e G
rant
or/P
rogr
am T
itle
Bal
ance
at J
une
30, 2
017
MEM
O
178

EXHIBIT K-5 (Page 1 of 2)
BASS RIVER TOWNSHIP SCHOOL DISTRICT
NOTES TO SCHEDULES OF EXPENDITURES OF FEDERAL AWARDS AND STATE FINANCIAL ASSISTANCE
FOR THE FISCAL YEAR ENDED JUNE 30, 2017 Note 1. Basis of Presentation The accompanying schedules of expenditures of federal awards and state financial assistance present the activity of all federal awards and state financial assistance programs of the Bass River Township School District. The School District is defined in Note 1 of the basic financial statements. The information in these schedules is presented in accordance with the requirements of Title 2 U.S. Code of Federal Regulations (CFR) Part 200, Uniform Administrative Requirements, Cost Principles, and Audit Requirements for Federal Awards (Uniform Guidance) and New Jersey OMB’s Circular 15-08, Single Audit Policy for Recipients of Federal Grants, State Grants and State Aid. All federal and state awards received directly from federal and state agencies, as well as federal awards and state financial assistance passed through other government agencies is included on the schedule of expenditures of federal awards and state financial assistance. Note 2. Summary of Significant Accounting Policies The accompanying schedules of expenditures of federal awards and state financial assistance are presented using the budgetary basis of accounting with the following exception: programs recorded in the enterprise fund are presented using the accrual basis of accounting and programs recorded in the capital projects fund are presented using the modified accrual basis of accounting. These bases of accounting are described in Note 1 to the School District’s basic financial statements. The information in this schedule is presented in accordance with the requirements of Title 2 U.S. Code of Federal Regulations (CFR) Part 200, Uniform Administrative Requirements, Cost Principles, and Audit Requirements for Federal Awards and New Jersey OMB’s Circular 15-08, Single Audit Policy for Recipients of Federal Grants, State Grants and State Aid. Therefore, some amounts presented in this schedule may differ from amounts presented in, or used in the preparation of, the basic financial statements. The School District did not elect the 10-percent de deminimis indirect cost rate as discussed in 2 CFR 200.414. Revenues and expenditures reported under the Food Distribution Program represent current year value received and current year distributions respectively. The amount reported as TPAF Pension Contributions represents the amount paid by the state on behalf of the School District for the year ended June 30, 2017. TPAF Social Security Contributions represents the amount reimbursed by the state for the employer’s share of social security contributions for TPAF members for the year ended June 30, 2017. Note 3. Relationship to Basic Financial Statements The basic financial statements present the general fund and special revenue fund on a GAAP basis. Budgetary comparison statements or schedules (RSI) are presented for the general fund and special revenue fund to demonstrate finance-related legal compliance in which certain revenue is permitted by law or grant agreement to be recognized in the audit year, whereas for GAAP reporting, revenue is not recognized until the subsequent year or when expenditures have been made.
179

EXHIBIT K-5 (Page 2 of 2)
BASS RIVER TOWNSHIP SCHOOL DISTRICT
NOTES TO SCHEDULES OF EXPENDITURES OF FEDERAL AWARDS AND STATE FINANCIAL ASSISTANCE
FOR THE FISCAL YEAR ENDED JUNE 30, 2017 Note 3. Relationship to Basic Financial Statements (continued) The general fund is presented in the accompanying schedules on the modified accrual basis with the exception of the revenue recognition of the one or more deferred June state aid payments in the current budget year, which is mandated pursuant to N.J.S.A. 18A:22-44.2. For GAAP purposes payments are not recognized until the subsequent budget year due to the state deferral and recording of the one or more June state aid payments in the subsequent year. The special revenue fund is presented in the accompanying schedules on the grant accounting budgetary basis, which recognizes encumbrances as expenditures and also recognizes the related revenues, whereas the GAAP basis does not. The special revenue fund also recognizes the one or more state aid June payments in the current budget year, consistent with N.J.S.A. 18A:22-4.2. The net adjustment to reconcile from the budgetary basis to the GAAP basis is ($378) for the general fund and $0 for the special revenue fund. See Exhibit C-3 Note A of the basic financial statements, for a reconciliation of the budgetary basis to the modified accrual basis of accounting for the general and special revenue funds. Awards and financial assistance expenditures reported in the School District’s basic financial statements on a GAAP basis are presented as follows:
Note 4. Relationship to Federal and State Financial Reports Amounts reported in the accompanying schedules agree with the amounts reported in the related federal and state financial reports. Note 5. Federal and State Loans Outstanding The Bass River Township School District had no loan balances outstanding at June 30, 2017.
Fund Federal State Total
General Fund -$ 1,197,537$ 1,197,537$ Special Revenue Fund 94,774 - 94,774
Total Awards & Financial Assistance 94,774$ 1,197,537$ 1,292,311$
180

Financial Statements
Type of auditor's report issued
Internal control over financial reporting:
1) Material weakness(es) identified? yes X no
2) Significant deficiency(ies) identified? X yes none reported
Noncompliance material to financial statements noted? yes X no
Federal AwardsSECTION IS N/A - NOT REQUIRED
Internal control over major programs:
1) Material weakness(es) identified? yes no
2) Significant deficiency(ies) identified? yes none reported
Type of auditor's report issued on compliance for major programs
Any audit findings disclosed that are required to be reportedin accordance with 2 CFR 200 section .516(a) of Uniform Guidance? yes no
Identification of major programs:
CFDA Number(s) FAIN Number(s) Name of Federal Program or Cluster
Dollar threshold used to determine Type A programs
Auditee qualified as low-risk auditee? yes no
EXHIBIT K-6(Page 1 of 2)
BASS RIVER TOWNSHIP SCHOOL DISTRICTSCHEDULE OF FINDINGS AND QUESTIONED COSTS
FOR THE FISCAL YEAR ENDED JUNE 30, 2017
Section I - Summary of Auditor's Results
Unmodified
181

State Financial Assistance
Dollar threshold used to determine Type A programs
Auditee qualified as low-risk auditee? X yes no
Internal control over major programs:
1) Material weakness(es) identified? yes X no
2) Significant deficiency(ies) identified? X yes no
Type of auditor's report issued on compliance for major programs
Any audit findings disclosed that are required to be reportedin accordance with New Jersey OMB's Circular 15-08? X yes no
Identification of major programs:
State Grant/Project Number(s) Name of State Program
495-034-5120-098 PARCC Readiness Aid495-034-5120-101 Professional Learning Community Aid
495-034-5120-085 Adjustment Aid495-034-5120-089 Special Education Categorical Aid495-034-5120-097 Per Pupil Growth Aid
State Aid - Public Cluster:495-034-5120-078 Equalization Aid495-034-5120-084 Security Aid
Unmodified
EXHIBIT K-6(Page 2 of 2)
BASS RIVER TOWNSHIP SCHOOL DISTRICTSCHEDULE OF FINDINGS AND QUESTIONED COSTS
FOR THE FISCAL YEAR ENDED JUNE 30, 2017
Section I - Summary of Auditor's Results (continued)
$750,000
182
EXHIBIT K-7
BASS RIVER TOWNSHIP SCHOOL DISTRICT SCHEDULE OF FINDINGS & QUESTIONED COSTS
FOR THE FISCAL YEAR ENDED JUNE 30, 2017
Section II – Financial Statement Findings This section identifies the significant deficiencies, material weaknesses and instances of noncompliance related to the basic financial statements that are required to be reported in accordance with Government Auditing Standards and with audit requirements prescribed by the Division of Administration and Finance, Department of Education, State of New Jersey. Finding 2017-001 Criteria or specific requirement: N.J.A.C. 6A:23A-16.12(c) states that “Receipts shall be detailed showing date, sources, purpose and amount. All receipts should be promptly deposited in the bank.” Condition: During our testing of receipts in the Student Activities Fund it was noted that deposits did not contain sufficient detail and were not promptly deposited. Context: Two out of sixteen deposits did not contain sufficient detail and all sixteen deposits were not promptly deposited. Cause: The advisor did not maintain sufficient evidentiary support and did not put an emphasis on depositing the receipts in a timely manner. Effect or potential effect: Not maintaining sufficient detail for deposits does not provide a proper audit trail. Not depositing receipts in a timely matter could cause deposits to be misplaced or improperly recorded. Recommendation: That deposits be made promptly upon receipt of funds and that sufficient evidentiary support be maintained for proper audit trail. View of responsible officials and planned corrective actions: The School District agrees with this finding and will improve controls over Student Activity Fund receipts in the fiscal year ending June 30, 2018.
183

EXHIBIT K-7
BASS RIVER TOWNSHIP SCHOOL DISTRICT SCHEDULE OF FINDINGS & QUESTIONED COSTS
FOR THE FISCAL YEAR ENDED JUNE 30, 2017
Section III – Federal Awards & State Financial Assistance Findings & Questioned Costs This section identifies the significant deficiencies, material weaknesses and instances of noncompliance, including questioned costs, related to the audit of major federal and state programs, as required by Title 2 U.S. Code of Federal Regulations (CFR) Part 200, Uniform Administrative Requirements, Cost Principals, and Audit Requirements for Federal Awards (Uniform Guidance) and New Jersey OMB’s Circular 15-08. FEDERAL AWARDS
N/A – Federal single audit not required STATE FINANCIAL ASSISTANCE
Finding 2017-002 Information on the state program: 495-034-5120-078 – Equalization Aid; 495-034-5120-084 – Security Aid; 495-034-5120-085 – Adjustment Aid; 495-034-5120-089 – Special Education Categorical Aid; 495-034-5120-097 – Per Pupil Growth Aid; 495-034-5120-098 – PARCC Readiness Aid; 495-034-5120-101 – Professional Learning Community Aid Criteria or specific requirement: Chapter 78 of the Laws of 2011 sets forth requirements that employees contribute to the cost of health benefits at certain statutory rates. Condition: During our testing it was noted that two out of fifteen employees did not have the proper deductions withheld from their wages in accordance with the statutory calculations. Context: The District under-withheld a total of $561 for the two employees for the year ended June 30, 2017. Cause: The District did not properly calculate the mandatory withholding.
184

EXHIBIT K-7
BASS RIVER TOWNSHIP SCHOOL DISTRICT SCHEDULE OF FINDINGS & QUESTIONED COSTS
FOR THE FISCAL YEAR ENDED JUNE 30, 2017
Section III – Federal Awards & State Financial Assistance Findings & Questioned Costs (continued)
STATE FINANCIAL ASSISTANCE (continued)
Finding 2017-002 (continued)
Effect or potential effect:
The District did not withhold the proper amounts leading to expenses for health benefits to be overstated by $561.
Recommendation:
That the District implement procedures to properly calculate the mandatory withholding for health benefits.
Management’s response:
The School District agrees with this finding and will improve controls over health benefit deductions in the fiscal year ending June 30, 2018.
185

EXHIBIT K-8
BASS RIVERTOWNSHIP SCHOOL DISTRICT SUMMARY SCHEDULE OF PRIOR YEAR AUDIT FINDINGS
AND QUESTIONED COSTS AS PREPARED BY MANAGEMENT FOR THE FISCAL YEAR ENDED JUNE 30, 2017
This section identifies the status of prior year findings related to the financial statements, federal awards and state financial assistance that are required to be reported in accordance with Government Auditing Standards, Title 2 U.S. Code of Federal Regulations (CFR) Part 200, Uniform Administrative Requirements, Cost Principals, and Audit Requirements for Federal Awards (Uniform Guidance), and New Jersey OMB’s Circular 15-08.
Financial Statement Findings
No Prior Year Findings.
Federal Awards
N/A – No Federal Single Audit in prior year.
State Financial Assistance
No Prior Year Findings.
186