school district of union beach of monmouth county … · letter of transmittal 1-4 organizational...
TRANSCRIPT
SCHOOL DISTRICT
OF
UNION BEACH
OF MONMOUTH COUNTY
Union Beach School District
Union Beach, New Jersey
COMPREHENSIVE ANNUAL FINANCIAL REPORT
Fiscal Year Ended June 30, 2018

COMPREHENSIVE ANNUALFINANCIAL REPORT
Of the
Union Beach School Districtof Monmouth County
Union Beach, New Jersey
For the Fiscal Year Ended June 30, 2018
Prepared by
Union Beach Board of EducationFinance Department
OUTLINE FOR COMPREHENSIVE ANNUAL FINANCIAL REPORT
PageINTRODUCTORY SECTION
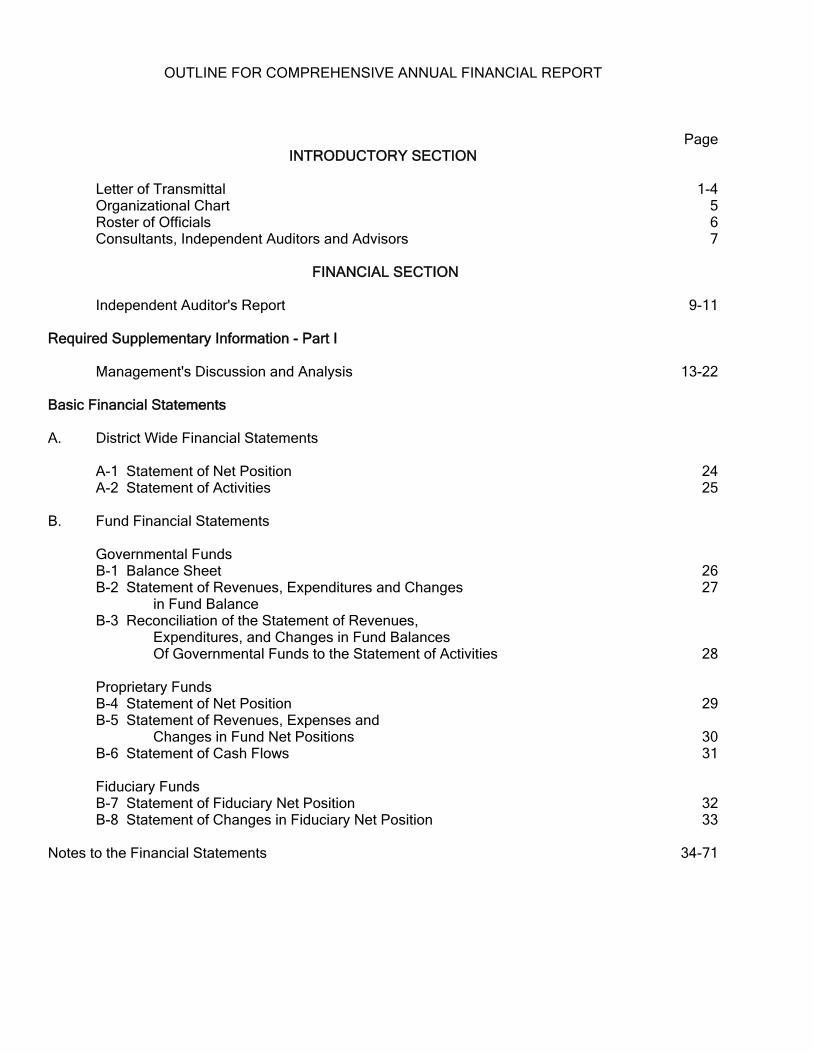
Letter of Transmittal 1-4Organizational Chart 5Roster of Officials 6Consultants, Independent Auditors and Advisors 7
FINANCIAL SECTION
Independent Auditor's Report 9-11
Required Supplementary Information - Part I
Management's Discussion and Analysis 13-22
Basic Financial Statements
A. District Wide Financial Statements
A-1 Statement of Net Position 24A-2 Statement of Activities 25
B. Fund Financial Statements
Governmental FundsB-1 Balance Sheet 26B-2 Statement of Revenues, Expenditures and Changes 27
in Fund BalanceB-3 Reconciliation of the Statement of Revenues,
Expenditures, and Changes in Fund BalancesOf Governmental Funds to the Statement of Activities 28
Proprietary FundsB-4 Statement of Net Position 29B-5 Statement of Revenues, Expenses and
Changes in Fund Net Positions 30B-6 Statement of Cash Flows 31
Fiduciary FundsB-7 Statement of Fiduciary Net Position 32B-8 Statement of Changes in Fiduciary Net Position 33
Notes to the Financial Statements 34-71
OUTLINE FOR COMPREHENSIVE ANNUAL FINANCIAL REPORT
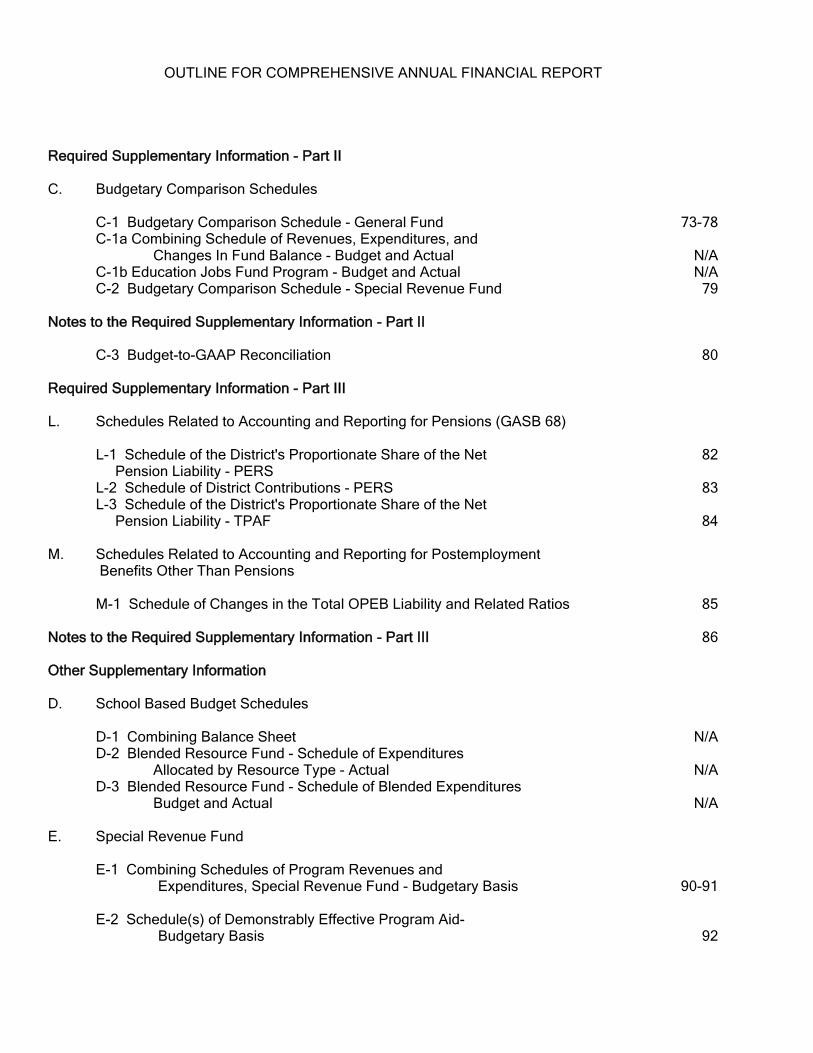
Required Supplementary Information - Part II
C. Budgetary Comparison Schedules
C-1 Budgetary Comparison Schedule - General Fund 73-78C-1a Combining Schedule of Revenues, Expenditures, and
Changes In Fund Balance - Budget and Actual N/AC-1b Education Jobs Fund Program - Budget and Actual N/AC-2 Budgetary Comparison Schedule - Special Revenue Fund 79
Notes to the Required Supplementary Information - Part II
C-3 Budget-to-GAAP Reconciliation 80
Required Supplementary Information - Part III
L. Schedules Related to Accounting and Reporting for Pensions (GASB 68)
L-1 Schedule of the District's Proportionate Share of the Net 82 Pension Liability - PERSL-2 Schedule of District Contributions - PERS 83L-3 Schedule of the District's Proportionate Share of the Net Pension Liability - TPAF 84
M. Schedules Related to Accounting and Reporting for Postemployment Benefits Other Than Pensions
M-1 Schedule of Changes in the Total OPEB Liability and Related Ratios 85
Notes to the Required Supplementary Information - Part III 86
Other Supplementary Information
D. School Based Budget Schedules
D-1 Combining Balance Sheet N/AD-2 Blended Resource Fund - Schedule of Expenditures
Allocated by Resource Type - Actual N/AD-3 Blended Resource Fund - Schedule of Blended Expenditures
Budget and Actual N/A
E. Special Revenue Fund
E-1 Combining Schedules of Program Revenues and Expenditures, Special Revenue Fund - Budgetary Basis 90-91
E-2 Schedule(s) of Demonstrably Effective Program Aid-Budgetary Basis 92

OUTLINE FOR COMPREHENSIVE ANNUAL FINANCIAL REPORT
F. Capital Projects Fund
F-1 Summary Statement of Project Expenditures N/AF-2 Summary Schedule of Revenues, Expenditures, and Changes in
Fund Balance - Budgetary Basis N/AF-2a Schedule of Project Revenues, Expenditures, Project Balance,
and Project Status - Budgetary Basis N/A
G. Proprietary Funds
Enterprise FundG-1 Combining Statement of Net Position 95G-2 Combining Schedule of Revenues, Expenses and
Changes in Fund Net Position 96G-3 Combining Statement of Cash Flows 97
H. Fiduciary Funds
H-1 Combining Statement of Fiduciary Net Position 99H-2 Combining Statement of Changes in Fiduciary Net Position 100H-3 Student Activity Agency Fund Schedule of Receipts
and Disbursements 101H-4 Payroll Agency Fund Schedule of Receipts
and Disbursements 102H-5 Private Purpose Scholarship Fund Schedule of
Receipts and Disbursements N/A
I. Long-Term Debt
I-1 Schedule of Serial Bonds N/AI-2 Schedule of Obligations Under Capital Leases N/AI-3 Debt Service Fund Budgetary Comparison Schedule 104I-4 Statement of Loans Payable - C.D.L. 105
STATISTICAL SECTION (Unaudited)
Introduction to the Statistical Section
Financial TrendsJ-1 Net Position by Component 108J-2 Changes in Net Position 109J-3 Fund Balances - Governmental Funds 110J-4 Changes in Fund Balances, Governmental Funds 111J-5 General Fund Other Local Revenue by Source 112
Revenue CapacityJ-6 Assessed Value and Estimated Actual Value of Taxable Property 113J-7 Direct and Overlapping Property Tax Rates 114J-8 Principal Property Taxpayers 115J-9 Property Tax Levies and Collections 116
Debt CapacityJ-10 Ratios of Outstanding Debt by Type 117J-11 Ratios of General Bonded Debt Outstanding 118J-12 Direct and Overlapping Governmental Activities Debt 119J-13 Legal Debt Margin Information 120
OUTLINE FOR COMPREHENSIVE ANNUAL FINANCIAL REPORT
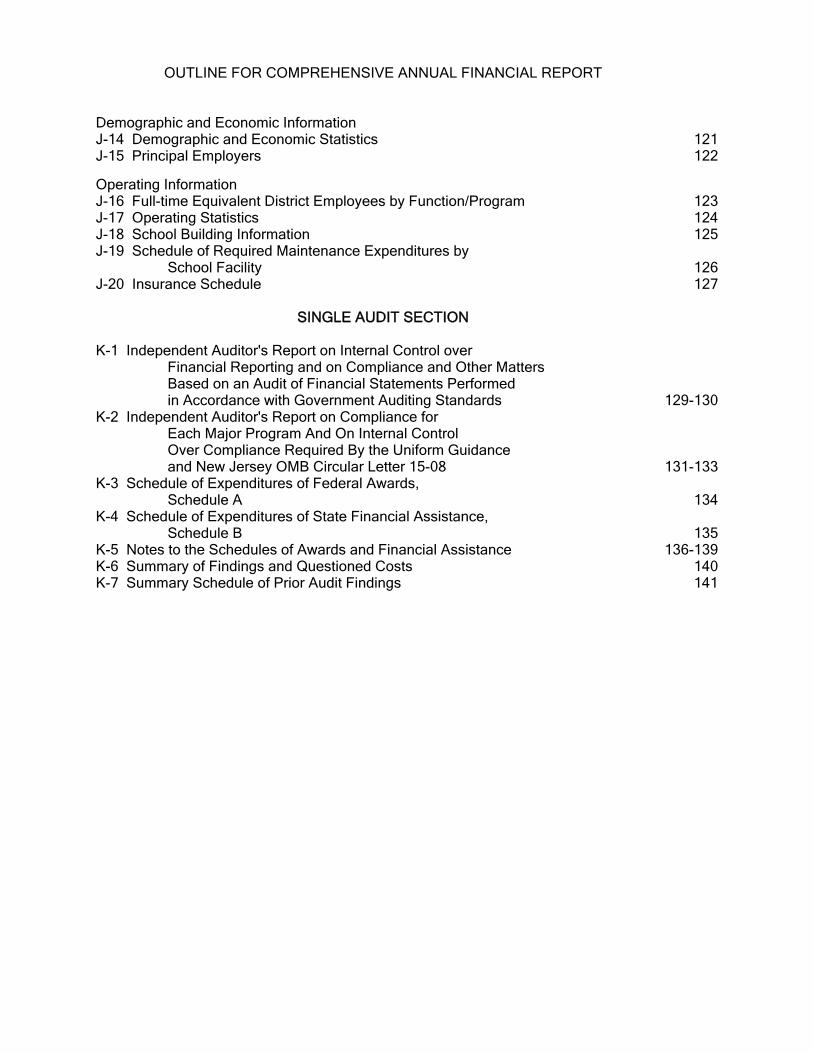
Demographic and Economic InformationJ-14 Demographic and Economic Statistics 121J-15 Principal Employers 122
Operating InformationJ-16 Full-time Equivalent District Employees by Function/Program 123J-17 Operating Statistics 124J-18 School Building Information 125J-19 Schedule of Required Maintenance Expenditures by
School Facility 126J-20 Insurance Schedule 127
SINGLE AUDIT SECTION
K-1 Independent Auditor's Report on Internal Control over Financial Reporting and on Compliance and Other Matters Based on an Audit of Financial Statements Performed in Accordance with Government Auditing Standards 129-130
K-2 Independent Auditor's Report on Compliance forEach Major Program And On Internal Control Over Compliance Required By the Uniform Guidanceand New Jersey OMB Circular Letter 15-08 131-133
K-3 Schedule of Expenditures of Federal Awards,Schedule A 134
K-4 Schedule of Expenditures of State Financial Assistance,Schedule B 135
K-5 Notes to the Schedules of Awards and Financial Assistance 136-139K-6 Summary of Findings and Questioned Costs 140K-7 Summary Schedule of Prior Audit Findings 141

INTRODUCTORY SECTION

1

2

3

4
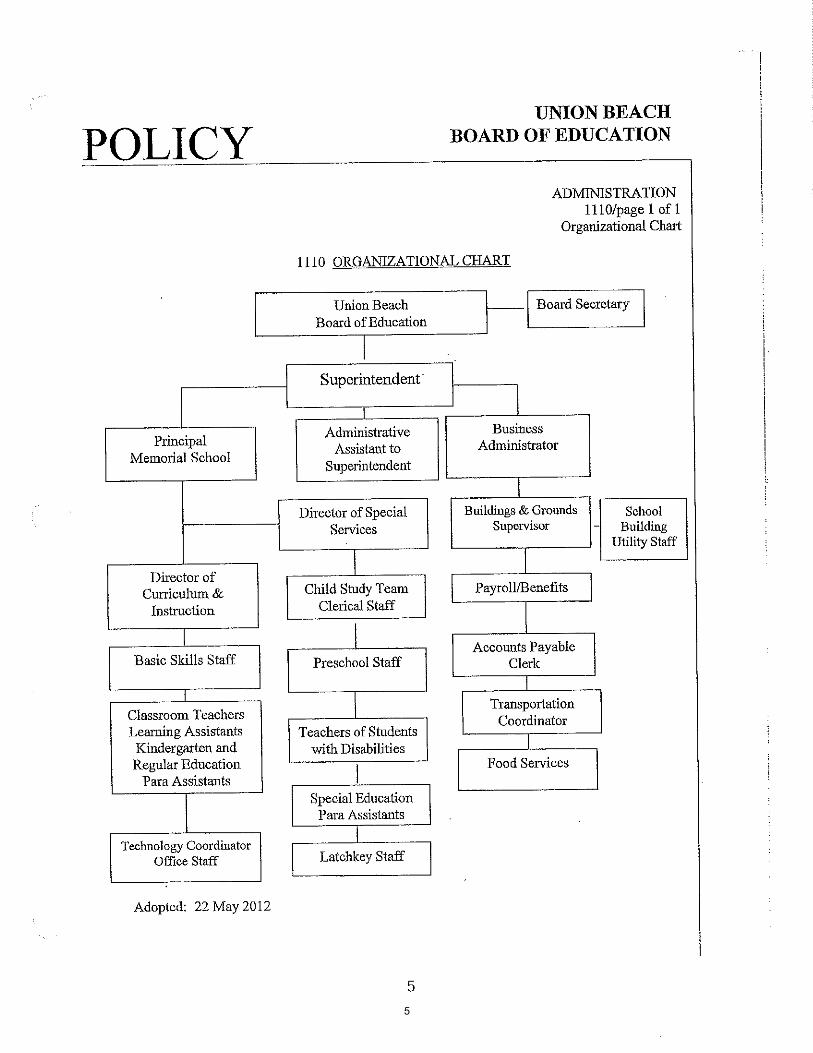
5
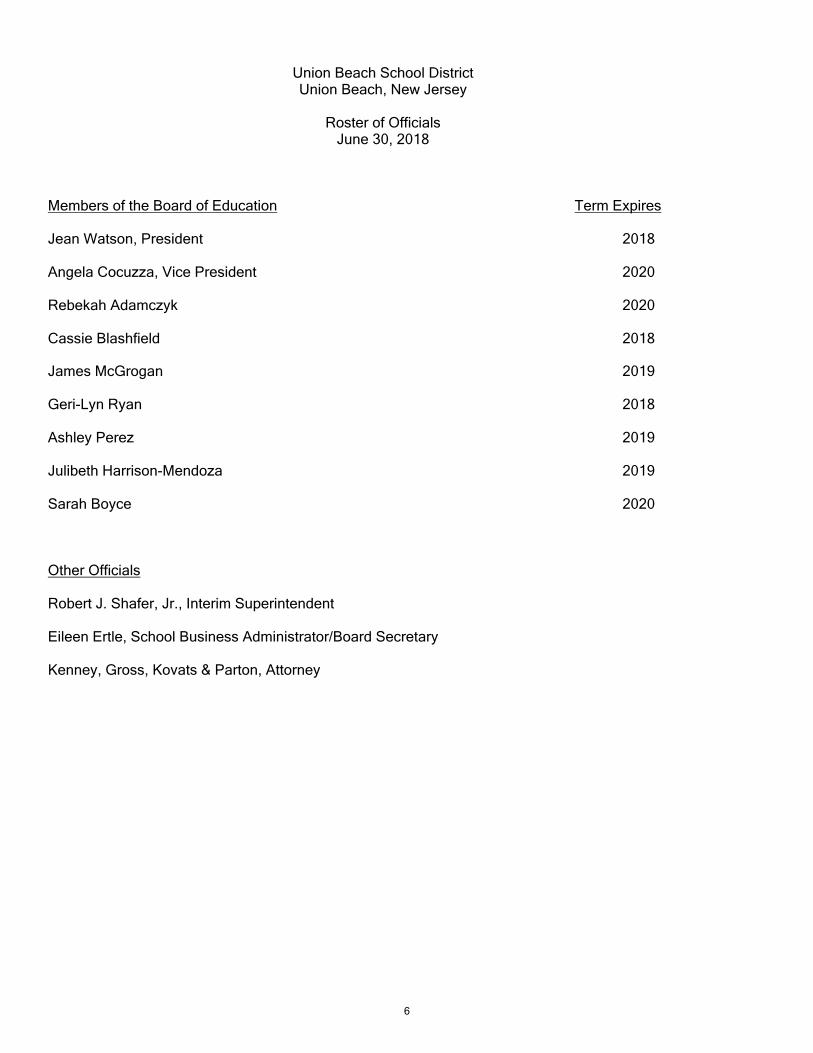
Union Beach School DistrictUnion Beach, New Jersey
Roster of OfficialsJune 30, 2018
Members of the Board of Education Term Expires
Jean Watson, President 2018
Angela Cocuzza, Vice President 2020
Rebekah Adamczyk 2020
Cassie Blashfield 2018
James McGrogan 2019
Geri-Lyn Ryan 2018
Ashley Perez 2019
Julibeth Harrison-Mendoza 2019
Sarah Boyce 2020
Other Officials
Robert J. Shafer, Jr., Interim Superintendent
Eileen Ertle, School Business Administrator/Board Secretary
Kenney, Gross, Kovats & Parton, Attorney
6

Union Beach School DistrictConsultants and Advisors
Audit Firm
Jump, Perry and Company, L.L.P.12 Lexington Avenue
Toms River, New Jersey 08753
Attorney
Kenney, Gross, Kovats & Parton130 Maple Avenue
Building 8Red Bank, NJ 07701
Official Depositories
Provident Bank
State of NJ Cash Management Fund
7

FINANCIAL SECTION
8
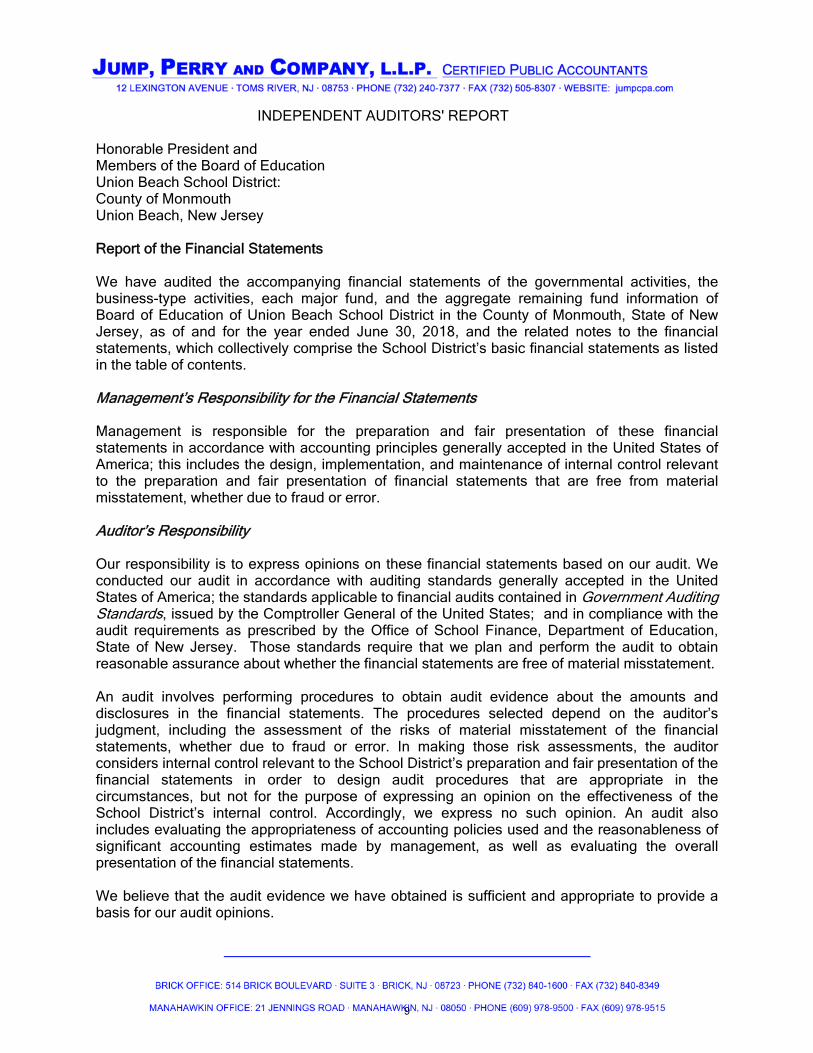
INDEPENDENT AUDITORS' REPORT
Honorable President and Members of the Board of EducationUnion Beach School District:County of Monmouth Union Beach, New Jersey
Report of the Financial Statements
We have audited the accompanying financial statements of the governmental activities, thebusiness-type activities, each major fund, and the aggregate remaining fund information ofBoard of Education of Union Beach School District in the County of Monmouth, State of NewJersey, as of and for the year ended June 30, 2018, and the related notes to the financialstatements, which collectively comprise the School District’s basic financial statements as listedin the table of contents.
Management’s Responsibility for the Financial Statements
Management is responsible for the preparation and fair presentation of these financialstatements in accordance with accounting principles generally accepted in the United States ofAmerica; this includes the design, implementation, and maintenance of internal control relevantto the preparation and fair presentation of financial statements that are free from materialmisstatement, whether due to fraud or error.
Auditor’s Responsibility
Our responsibility is to express opinions on these financial statements based on our audit. Weconducted our audit in accordance with auditing standards generally accepted in the UnitedStates of America; the standards applicable to financial audits contained in Government AuditingStandards, issued by the Comptroller General of the United States; and in compliance with theaudit requirements as prescribed by the Office of School Finance, Department of Education,State of New Jersey. Those standards require that we plan and perform the audit to obtainreasonable assurance about whether the financial statements are free of material misstatement.
An audit involves performing procedures to obtain audit evidence about the amounts anddisclosures in the financial statements. The procedures selected depend on the auditor’sjudgment, including the assessment of the risks of material misstatement of the financialstatements, whether due to fraud or error. In making those risk assessments, the auditorconsiders internal control relevant to the School District’s preparation and fair presentation of thefinancial statements in order to design audit procedures that are appropriate in thecircumstances, but not for the purpose of expressing an opinion on the effectiveness of theSchool District’s internal control. Accordingly, we express no such opinion. An audit alsoincludes evaluating the appropriateness of accounting policies used and the reasonableness ofsignificant accounting estimates made by management, as well as evaluating the overallpresentation of the financial statements.
We believe that the audit evidence we have obtained is sufficient and appropriate to provide abasis for our audit opinions.
9

Opinion
In our opinion, the financial statements referred to above present fairly, in all material respects,the respective financial position of the governmental activities, the business-type activities, eachmajor fund, and the aggregate remaining fund information of Union Beach School District in theCounty of Monmouth, State of New Jersey as of June 30, 2018 and the respective changes infinancial position and, where applicable, cash flows thereof for the year then ended inaccordance with accounting principles generally accepted in the United States of America.
Emphasis of Matter
Change in Accounting Principle
As discussed in Note 1 to the basic financial statements, in 2018, the Board adoptedGovernmental Accounting Standards Board Statement No. 75, Accounting and FinancialReporting for Postemployment Benefits Other Than Pensions (an Amendment of GASBStatement No. 45). Our opinions are not modified with respect to this matter.
Other Matters
Required Supplementary Information
Accounting principles generally accepted in the United States of America require that themanagement’s discussion and analysis and budgetary comparison information, and theschedules related to accounting and reporting for pensions and post-retirement benefits, aslisted in the table of contents be presented to supplement the basic financial statements. Suchinformation, although not a part of the basic financial statements, is required by theGovernmental Accounting Standards Board, who considers it to be an essential part of financialreporting for placing the basic financial statements in an appropriate operational, economic, orhistorical context. We have applied certain limited procedures to the required supplementaryinformation in accordance with auditing standards generally accepted in the United States ofAmerica, which consisted of inquiries of management about the methods of preparing theinformation and comparing the information for consistency with management’s responses to ourinquiries, the basic financial statements, and other knowledge we obtained during our audit ofthe basic financial statements. We do not express an opinion or provide any assurance on theinformation because the limited procedures do not provide us with sufficient evidence to expressan opinion or provide any assurance.
Other Information
Our audit was conducted for the purpose of forming opinions on the financial statements thatcollectively comprise the Union Beach School District's basic financial statements. Theintroductory section, combining fund financial statements and schedules and statistical section,are presented for purposes of additional analysis and are not a required part of the basicfinancial statements. The schedule of expenditures of federal and state awards is presented forpurposes of additional analysis as required by Title 2 U.S. Code of Federal Regulations (CFR)Part 200, Uniform Administrative Requirements, Cost Principles, and Audit Requirements forFederal Awards, and New Jersey OMB’s Circular 15-08, Single Audit Policy for Recipients ofFederal Grants, State Grants and State Aid, and is also not a required part of the basic financialstatements.
10

Other Information (continued)
The combining fund financial statements and schedules and the schedule of expenditures offederal and state awards are the responsibility of management and were derived from and relatedirectly to the underlying accounting and other records used to prepare the basic financialstatements. Such information has been subjected to the auditing procedures applied in the auditof the basic financial statements and certain additional procedures, including comparing andreconciling such information directly to the underlying accounting and other records used toprepare the basic financial statements or to the basic financial statements themselves, and otheradditional procedures in accordance with auditing standards generally accepted in the UnitedStates of America. In our opinion, the combining fund financial statements and schedules andthe schedule of expenditures of federal and state awards are fairly stated, in all materialrespects in relation to the basic financial statements as a whole.
The introductory and statistical sections have not been subjected to the auditing proceduresapplied in the audit of the basic financial statements and, accordingly, we do not express anopinion or provide any assurance on them.
Other Reporting Required by Government Auditing Standards
In accordance with Government Auditing Standards, we have also issued our report datedJanuary 31, 2019 on our consideration of the Board of Education of the Union Beach SchoolDistrict in the County of Monmouth, State of New Jersey internal control over financial reportingand on our tests of its compliance with certain provisions of laws, regulations, contracts, andgrant agreements and other matters. The purpose of that report is to describe the scope of ourtesting of internal control over financial reporting and compliance and the results of that testing,and not to provide an opinion on internal control over financial reporting or on compliance. Thatreport is an integral part of an audit performed in accordance with Government AuditingStandards in considering Union Beach School District in the County of Monmouth, State of NewJersey internal control over financial reporting and compliance.
Respectfully Submitted
Jump, Perry & Company L.L.P.Toms River, NJ
Kathryn Perry, PartnerLicensed Public School AccountantNo. CS 20CS00226400
January 31, 2019Toms River, New Jersey
11
REQUIRED SUPPLEMENTARY INFORMATION - PART I
12

Union Beach School District
Management's Discussion and Analysis
For the Fiscal Year Ended June 30, 2018
Unaudited
The discussion and analysis of Union Beach School District's financial performance provides an overallreview of the School Board's financial activities for the fiscal year ended June 30, 2018. The intent of thisdiscussion and analysis is to look at the School Board's financial performance as a whole; readers shouldalso review the notes to the basic financial statements and financial statements to enhance theirunderstanding of the School Board's financial performance.
Financial Highlights
Key financial highlights for June 30, 2018 are as follows:
Net position totaled $5,936,581, which represents a 8.94 percent increase from June 30, 2017.
General revenues accounted for $15,866,954 in revenue or 93.96 percent of all revenues. Programspecific revenues in the form of charges for services, operating grants and contributions, and capitalgrants and contributions accounted for $1,019,330 or 6.04 percent of total revenues of $16,886,284.
Total assets increased by $397,154 as current assets increased by $400,931 and capital assets, netdecreased by $3,777.
The School Board had $16,399,122 in expenses; only $1,019,330 of these expenses were offset byprogram specific charges for services, grants or contributions. General revenues (primarily propertytaxes) of $15,866,954 were adequate to provide for these programs.
Among major funds, the General Fund had $15,775,409 in revenues and $15,721,503 in expendituresand transfers. The General Fund's balance increased $53,906 over June 30, 2017. The General Fund'sbalance is $3,494,702.
Using this Comprehensive Annual Financial Report (CAFR)
The annual report consists of a series of financial statements and notes to those statements. Thesestatements are organized so the reader can understand Union Beach School District as a financial whole,an entire operating entity. The statements then proceed to provide an increasingly detailed look atspecific financial activities.
The Statement of Net Position and Statement of Activities provide information about the activities of theSchool Board, presenting both an aggregate view of the School Board's finances and longer-term view ofthose finances. Fund financial statements provide the next level of detail. For government funds, thesestatements tell how services were financed in the short term as well as what remains for future spending.The fund financial statements also look at the School Board's most significant funds with all other non-major funds presented in total in one column. In the case of Union Beach School District, the GeneralFund is by far the most significant.
13

Reporting the School Board as a Whole
Statement of Net Position and the Statement of Activities
This document contains all funds used by the School Board to provide programs and activities viewingthe School Board as a whole and reports the culmination of all financial transactions. The report answersthe question "How Did We Do Financially During Fiscal Year June 30, 2018?" The Statement of NetPosition and the Statement of Activities provides the summary. The statements include all assets,liabilities, deferred outflows of resources, and deferred inflows of resources using the accrual basis ofaccounting similar to the accounting used by most private-sector companies. This basis of accountingtakes into account, all of the current year's revenues and expenses regardless of when cash is receivedor paid.
These two statements report the School Board's net position and changes in those assets. This changein net position is important because reports whether the School Board's financial position has improvedor diminished.
In the Statement of Net Position and the Statement of Activities, the School Board is divided into twokinds of activities:
Governmental Activities - All of the School Board's programs and services are reported here including,instruction, support services, operation and maintenance of plant facilities, pupil transportation andextracurricular activities.
Business-Type Activities - This service is provided on a charge for goods or services basis to recover allthe expense of the goods or services provided. The Food Service Funds are reported as a businessactivity.
Reporting the School Board's Most Significant Funds
Fund Financial Statement
The Analysis of the School Board's major funds begins with Exhibit B-1. Fund financial reports providedetailed information about the School Board's major funds. The School Board's major governmentalfunds are the General Fund and Special Revenue Fund.
Governmental Funds
The School Board's activities are reported in governmental funds, which focus on how money flows intoand out of the funds and balances left at year-end available for spending in the future years. Thesefunds are reported using a modified accrual accounting method which measures cash and all otherfinancial assets that can readily be converted to cash. The governmental fund statements provide adetailed short-term view of the School Board's general government operations and the basic services itprovides. Governmental fund information helps determine whether there are more or fewer financialresources that can be spent in the near future to finance educational programs. The relationshipbetween governmental activities (reported in the Statement of Net Position and the Statement ofActivities) and governmental funds is reconciled in the financial statements.
Enterprise Fund
The Enterprise Fund uses the same basis of accounting as business-type activities.
14
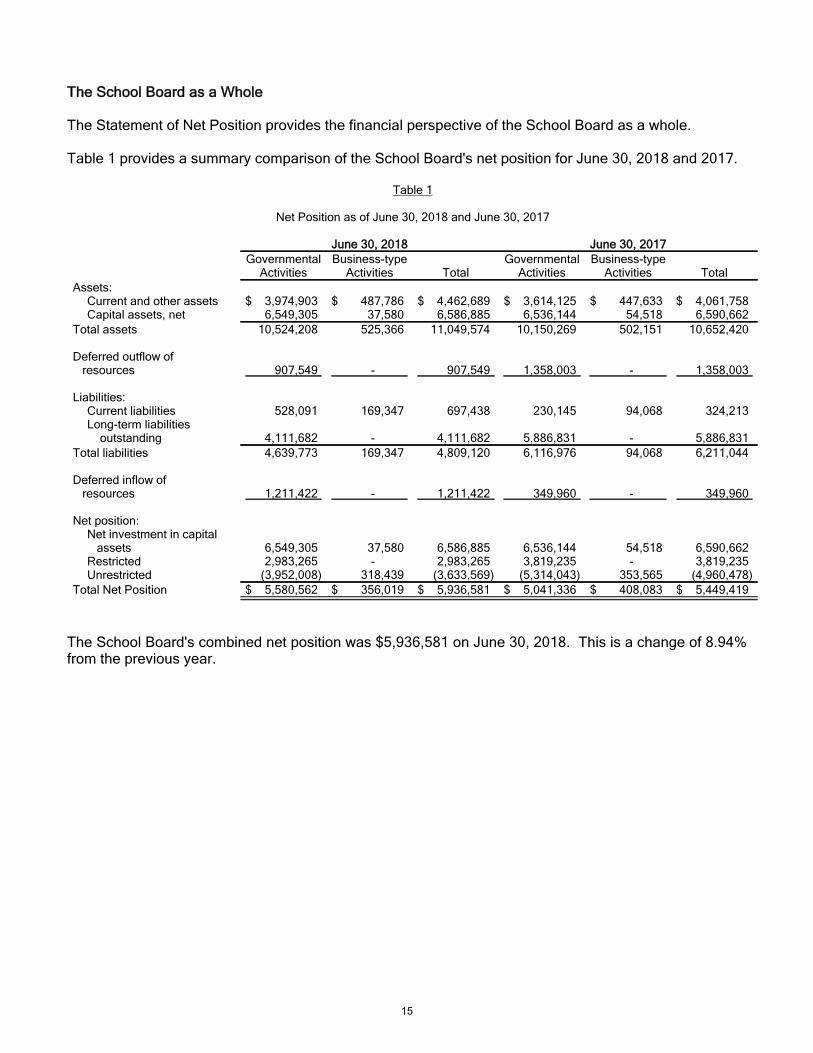
The School Board as a Whole
The Statement of Net Position provides the financial perspective of the School Board as a whole.
Table 1 provides a summary comparison of the School Board's net position for June 30, 2018 and 2017.
Table 1
Net Position as of June 30, 2018 and June 30, 2017
June 30, 2018 June 30, 2017Governmental
ActivitiesBusiness-type
Activities TotalGovernmental
ActivitiesBusiness-type
Activities TotalAssets:
Current and other assets $ 3,974,903 $ 487,786 $ 4,462,689 $ 3,614,125 $ 447,633 $ 4,061,758Capital assets, net 6,549,305 37,580 6,586,885 6,536,144 54,518 6,590,662
Total assets 10,524,208 525,366 11,049,574 10,150,269 502,151 10,652,420
Deferred outflow of resources 907,549 - 907,549 1,358,003 - 1,358,003
Liabilities:Current liabilities 528,091 169,347 697,438 230,145 94,068 324,213Long-term liabilities outstanding 4,111,682 - 4,111,682 5,886,831 - 5,886,831
Total liabilities 4,639,773 169,347 4,809,120 6,116,976 94,068 6,211,044
Deferred inflow of resources 1,211,422 - 1,211,422 349,960 - 349,960
Net position:Net investment in capital assets 6,549,305 37,580 6,586,885 6,536,144 54,518 6,590,662Restricted 2,983,265 - 2,983,265 3,819,235 - 3,819,235Unrestricted (3,952,008) 318,439 (3,633,569) (5,314,043) 353,565 (4,960,478)
Total Net Position $ 5,580,562 $ 356,019 $ 5,936,581 $ 5,041,336 $ 408,083 $ 5,449,419
The School Board's combined net position was $5,936,581 on June 30, 2018. This is a change of 8.94%from the previous year.
15
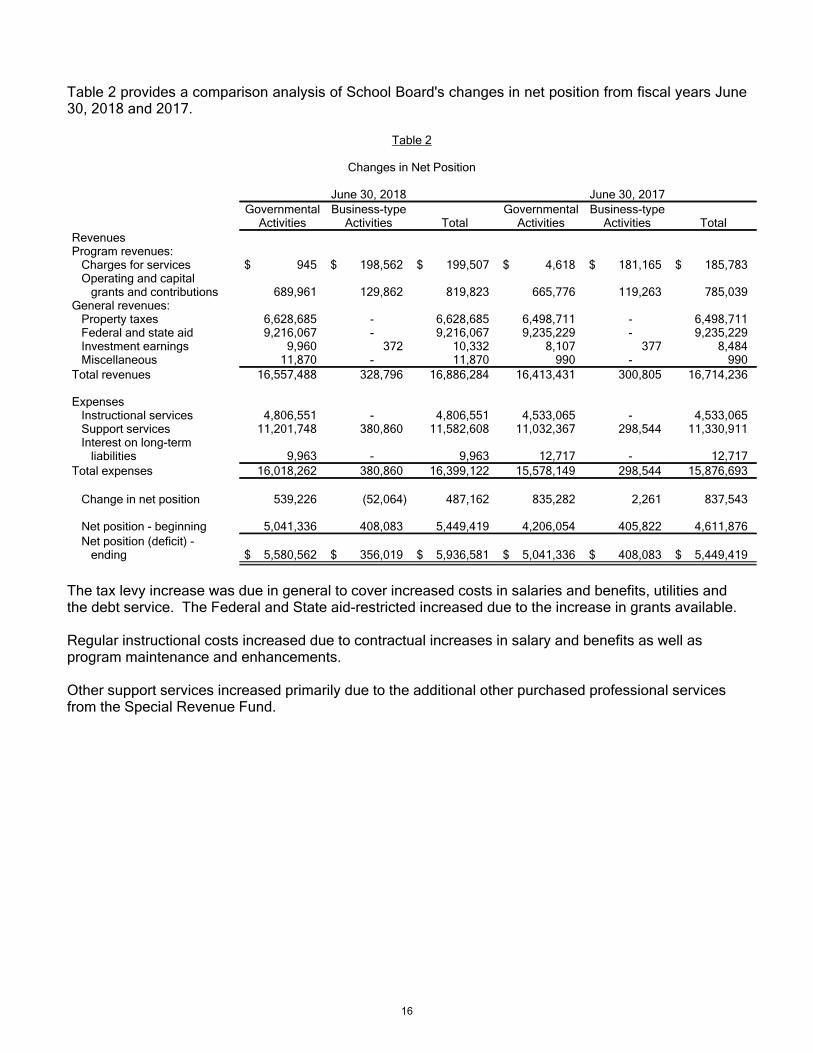
Table 2 provides a comparison analysis of School Board's changes in net position from fiscal years June30, 2018 and 2017.
Table 2
Changes in Net Position
June 30, 2018 June 30, 2017Governmental
ActivitiesBusiness-type
Activities TotalGovernmental
ActivitiesBusiness-type
Activities TotalRevenuesProgram revenues:
Charges for services $ 945 $ 198,562 $ 199,507 $ 4,618 $ 181,165 $ 185,783Operating and capital grants and contributions 689,961 129,862 819,823 665,776 119,263 785,039
General revenues:Property taxes 6,628,685 - 6,628,685 6,498,711 - 6,498,711Federal and state aid 9,216,067 - 9,216,067 9,235,229 - 9,235,229Investment earnings 9,960 372 10,332 8,107 377 8,484Miscellaneous 11,870 - 11,870 990 - 990
Total revenues 16,557,488 328,796 16,886,284 16,413,431 300,805 16,714,236
ExpensesInstructional services 4,806,551 - 4,806,551 4,533,065 - 4,533,065Support services 11,201,748 380,860 11,582,608 11,032,367 298,544 11,330,911Interest on long-term liabilities 9,963 - 9,963 12,717 - 12,717
Total expenses 16,018,262 380,860 16,399,122 15,578,149 298,544 15,876,693
Change in net position 539,226 (52,064) 487,162 835,282 2,261 837,543
Net position - beginning 5,041,336 408,083 5,449,419 4,206,054 405,822 4,611,876Net position (deficit) - ending $ 5,580,562 $ 356,019 $ 5,936,581 $ 5,041,336 $ 408,083 $ 5,449,419
The tax levy increase was due in general to cover increased costs in salaries and benefits, utilities andthe debt service. The Federal and State aid-restricted increased due to the increase in grants available.
Regular instructional costs increased due to contractual increases in salary and benefits as well asprogram maintenance and enhancements.
Other support services increased primarily due to the additional other purchased professional servicesfrom the Special Revenue Fund.
16

Expenses for Fiscal Year June 30, 2018
Business-Type Activities
Revenues for the District's business-type activities (food service program and child care) were comprisedof charges for services and royalties.
Total Enterprise Fund expenses exceeded revenue by $52,064.
Charges for services represent $198,562 of revenue. This represents the amount paid by patrons fordaily food service and catering.
Federal and state reimbursements for meals, including interest, payments for free and reduced lunchesand donated commodities was $129,862.
Governmental Activities
The Statement of Activities shows the cost of program services and the charges for services and grantsoffsetting those services. Table 3 shows the total costs of services and the net cost of services. The netcost shows the financial burden that was placed on the School District's taxpayers by each of thesefunctions.
Table 3
Governmental Activities
2018 2017Total Cost of
ServicesNet Cost of
ServicesTotal Cost of
ServicesNet Cost of
Services
Instruction $ 4,806,551 $ 4,805,606 $ 4,533,065 $ 4,528,447Support Services:
Pupils and Instructional Staff 6,743,397 6,053,436 6,759,369 6,093,593General Administration,
School Administration,Business Operation
and Maintenanceof Facilities 3,747,677 3,747,677 3,491,422 3,491,422
Pupil Transportation 710,674 710,674 781,576 781,576Interest and Fiscal Charges 9,963 9,963 12,717 12,717
Total Expenses $ 16,018,262 $ 15,327,356 $ 15,578,149 $ 14,907,755
17

Instruction expenses include activities directly dealing with the teaching of pupils and the interactionbetween teacher and student, including extracurricular activities.
Extracurricular activities includes expenses related to student activities provided by the District which aredesigned to provide opportunities for students to participate in school and public events for the purposeof motivation, enjoyment, skill improvement, school spirit and leadership. Approximately 90% of thestudent population participates in extracurricular activities.
Pupils and instructional staff include the activities involved with assisting staff with the content andprocess of teaching to students, including curriculum and staff development.
General administration, school administration and business include expenses associated withadministrative and financial supervision of the District.
Operation and maintenance of facilities activities involve keeping the school grounds, buildings, andequipment in an effective working condition.
Pupil transportation includes activities involved with the conveyance of students to and from school, toschool curricular and athletic activities and field trips as provided by state law.
Interest and fiscal charges involve the transactions associated with the payment of interest and otherrelated charges to debt of the District.
18
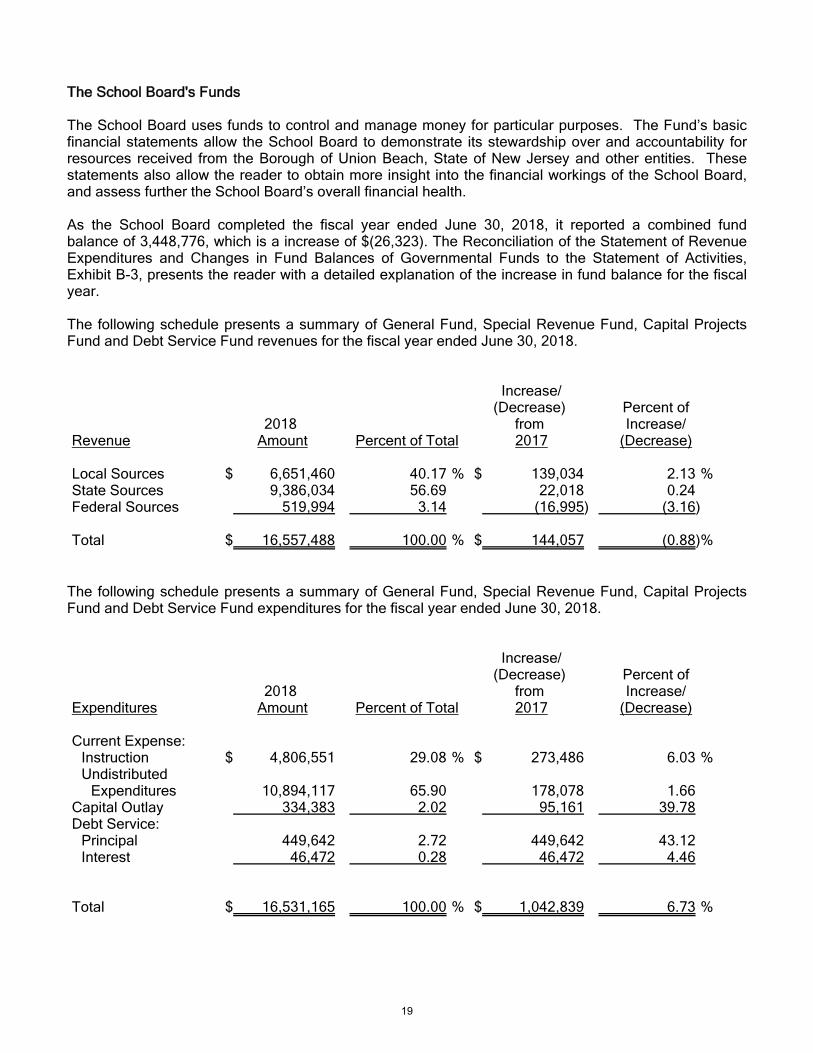
The School Board's Funds
The School Board uses funds to control and manage money for particular purposes. The Fund’s basicfinancial statements allow the School Board to demonstrate its stewardship over and accountability forresources received from the Borough of Union Beach, State of New Jersey and other entities. Thesestatements also allow the reader to obtain more insight into the financial workings of the School Board,and assess further the School Board’s overall financial health.
As the School Board completed the fiscal year ended June 30, 2018, it reported a combined fundbalance of 3,448,776, which is a increase of $(26,323). The Reconciliation of the Statement of RevenueExpenditures and Changes in Fund Balances of Governmental Funds to the Statement of Activities,Exhibit B-3, presents the reader with a detailed explanation of the increase in fund balance for the fiscalyear.
The following schedule presents a summary of General Fund, Special Revenue Fund, Capital ProjectsFund and Debt Service Fund revenues for the fiscal year ended June 30, 2018.
Revenue2018
Amount Percent of Total
Increase/(Decrease)
from 2017
Percent ofIncrease/
(Decrease)
Local Sources $ 6,651,460 %40.17 $ 139,034 %2.13State Sources 9,386,034 56.69 22,018 0.24Federal Sources 519,994 3.14 (16,995) (3.16)
Total $ 16,557,488 %100.00 $ 144,057 %(0.88)
The following schedule presents a summary of General Fund, Special Revenue Fund, Capital ProjectsFund and Debt Service Fund expenditures for the fiscal year ended June 30, 2018.
Expenditures2018
Amount Percent of Total
Increase/(Decrease)
from 2017
Percent ofIncrease/
(Decrease)
Current Expense:Instruction $ 4,806,551 %29.08 $ 273,486 %6.03Undistributed
Expenditures 10,894,117 65.90 178,078 1.66Capital Outlay 334,383 2.02 95,161 39.78Debt Service:
Principal 449,642 2.72 449,642 43.12Interest 46,472 0.28 46,472 4.46
Total $ 16,531,165 %100.00 $ 1,042,839 %6.73
19
General Fund Budgeting Highlights
The School Board's budget is prepared according to New Jersey law and is based on accounting forcertain transactions on a basis of cash receipts, disbursements and encumbrances. The most significantbudgeted fund is the General Fund.
Over the course of the year, the School Board revises its budget as it attempts to take into considerationunexpected changes in revenue and expenditures.
A schedule showing the School Board’s original and final budget compared with actual operating resultsis provided in Section C of the CAFR, entitled Budgetary Comparison Schedules. The School Boardgenerally did better than had been budgeted in its General Fund since it practices conservativebudgetary practices in which revenues are forecasted very conservatively and expenditures arebudgeted with worst-case scenarios in mind.
The General Fund finished the fiscal year approximately $1,516,832 better than had been budgeted interms of expenditures. Revenue-wise, the General Fund fared about $142,996 better than expected.Both these amounts have been adjusted for the non-budgeted amounts reflected in the comparisonschedule for reimbursed TPAF social security contributions and on-behalf TPAF post-retirement medicalcontributions.
The General Fund has restricted a portion of its Fund Balance. The restricted Fund Balance items areCapital Reserve $1,074,190, Maintenance Reserve $510,675, Tuition Reserve $715,000 and EmergencyReserve $50,000. These restricted reserves are regulated as to their use by the State of New Jersey.Therefore, the Board places funds in the reserves in combination with the future financial needs of theDistrict.
The expenditures were less due to cost containment by the Board even after the salary and benefitincreases. General supplies were purchased at better prices than expected due to the school boardjoining other schools in cooperative bidding. The district also joined a co-op for energy consumption,which was done after the budget was struck. Through efforts made in finding jointures with other localdistricts, and increase students on district owned vehicles the district transportation costs were loweredfor special needs students.
The excesses will be carried forward into the beginning fund balance from the 2017-2018 fiscal year andwill be used to reduce the local tax levy for the 2019-2020 fiscal year.
20
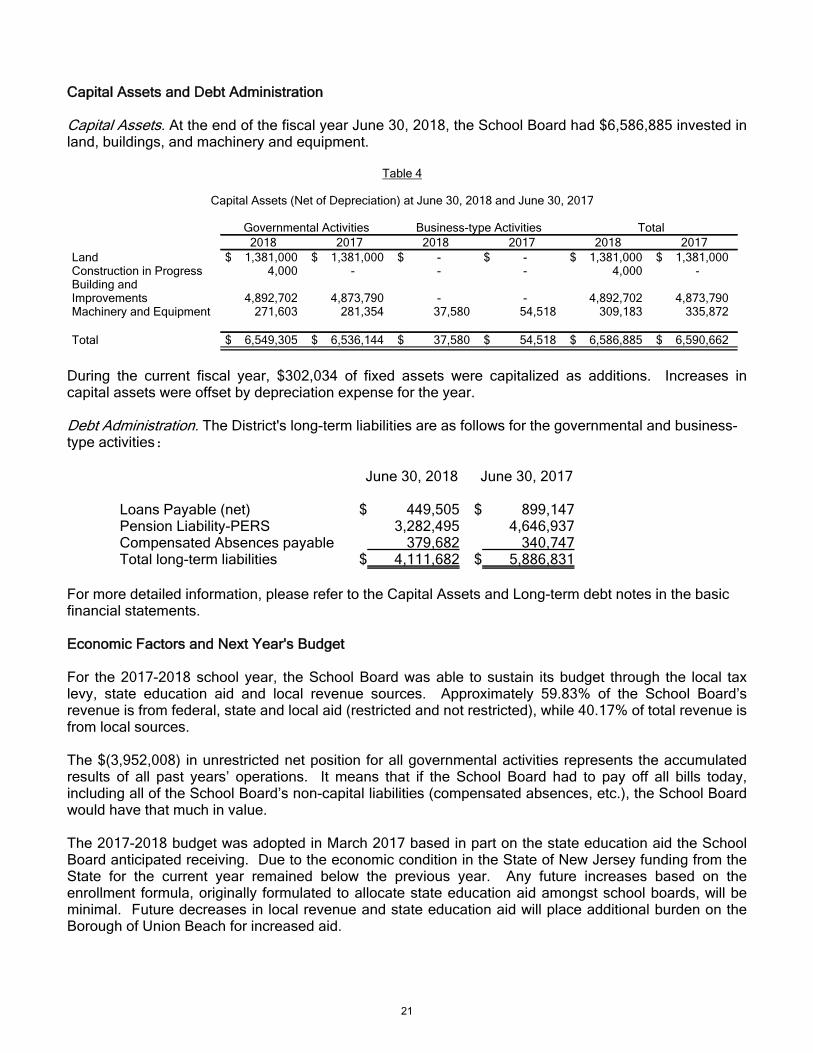
Capital Assets and Debt Administration
Capital Assets. At the end of the fiscal year June 30, 2018, the School Board had $6,586,885 invested inland, buildings, and machinery and equipment.
Table 4
Capital Assets (Net of Depreciation) at June 30, 2018 and June 30, 2017
Governmental Activities Business-type Activities Total2018 2017 2018 2017 2018 2017
Land $ 1,381,000 $ 1,381,000 $ - $ - $ 1,381,000 $ 1,381,000Construction in Progress 4,000 - - - 4,000 -Building andImprovements 4,892,702 4,873,790 - - 4,892,702 4,873,790Machinery and Equipment 271,603 281,354 37,580 54,518 309,183 335,872
Total $ 6,549,305 $ 6,536,144 $ 37,580 $ 54,518 $ 6,586,885 $ 6,590,662
During the current fiscal year, $302,034 of fixed assets were capitalized as additions. Increases incapital assets were offset by depreciation expense for the year.
Debt Administration. The District's long-term liabilities are as follows for the governmental and business-type activities:
June 30, 2018 June 30, 2017
Loans Payable (net) $ 449,505 $ 899,147Pension Liability-PERS 3,282,495 4,646,937Compensated Absences payable 379,682 340,747Total long-term liabilities $ 4,111,682 $ 5,886,831
For more detailed information, please refer to the Capital Assets and Long-term debt notes in the basicfinancial statements.
Economic Factors and Next Year's Budget
For the 2017-2018 school year, the School Board was able to sustain its budget through the local taxlevy, state education aid and local revenue sources. Approximately 59.83% of the School Board’srevenue is from federal, state and local aid (restricted and not restricted), while 40.17% of total revenue isfrom local sources.
The $(3,952,008) in unrestricted net position for all governmental activities represents the accumulatedresults of all past years’ operations. It means that if the School Board had to pay off all bills today,including all of the School Board’s non-capital liabilities (compensated absences, etc.), the School Boardwould have that much in value.
The 2017-2018 budget was adopted in March 2017 based in part on the state education aid the SchoolBoard anticipated receiving. Due to the economic condition in the State of New Jersey funding from theState for the current year remained below the previous year. Any future increases based on theenrollment formula, originally formulated to allocate state education aid amongst school boards, will beminimal. Future decreases in local revenue and state education aid will place additional burden on theBorough of Union Beach for increased aid.
21
The School Board anticipates a slight increase in enrollment for the 2018-2019 fiscal year. If the SchoolBoard were to experience a significant increase in enrollment with no appreciable increase in state aid forfuture budgets, the School Board will be faced with the following alternatives: (a) reduce programs andservices, (b) increase local tax levy or (c) seek alternative sources of funding.
Contacting the School Board's Financial Management
This financial report is designed to provide our citizens, taxpayers, investors and creditors with a generaloverview of the School Board's finances and to show the School Board's accountability for the money itreceives. If you have questions about this report or need additional information, you may contact theSchool Business Administrator/Board Secretary at Union Beach School District, 1207 Florence Avenue,Union Beach, NJ, 07735.
22

BASIC FINANCIAL STATEMENTS
23
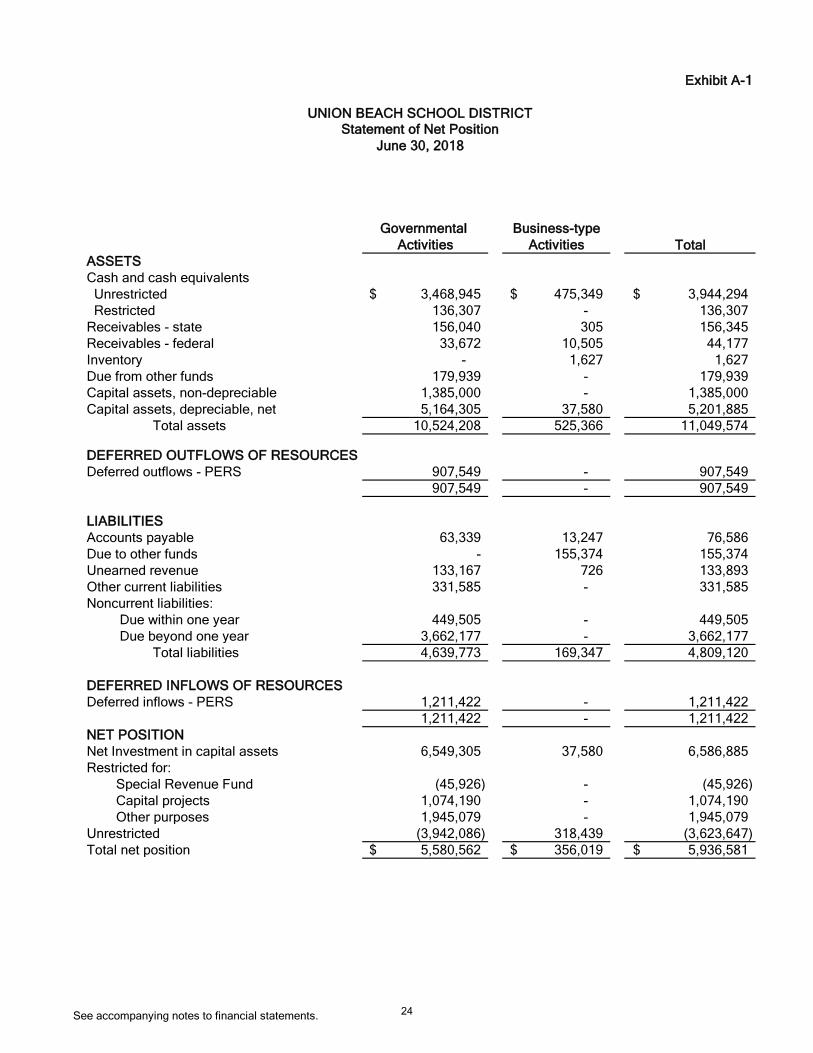
Exhibit A-1
Governmental Business-type
Activities Activities Total
ASSETS
Cash and cash equivalents
Unrestricted 3,468,945$ 475,349$ 3,944,294$
Restricted 136,307 - 136,307
Receivables - state 156,040 305 156,345
Receivables - federal 33,672 10,505 44,177
Inventory - 1,627 1,627
Due from other funds 179,939 - 179,939
Capital assets, non-depreciable 1,385,000 - 1,385,000
Capital assets, depreciable, net 5,164,305 37,580 5,201,885
Total assets 10,524,208 525,366 11,049,574
DEFERRED OUTFLOWS OF RESOURCES
Deferred outflows - PERS 907,549 - 907,549
907,549 - 907,549
LIABILITIES
Accounts payable 63,339 13,247 76,586
Due to other funds - 155,374 155,374
Unearned revenue 133,167 726 133,893
Other current liabilities 331,585 - 331,585
Noncurrent liabilities:
Due within one year 449,505 - 449,505
Due beyond one year 3,662,177 - 3,662,177
Total liabilities 4,639,773 169,347 4,809,120
DEFERRED INFLOWS OF RESOURCES
Deferred inflows - PERS 1,211,422 - 1,211,422
1,211,422 - 1,211,422
NET POSITION
Net Investment in capital assets 6,549,305 37,580 6,586,885
Restricted for:
Special Revenue Fund (45,926) - (45,926)
Capital projects 1,074,190 - 1,074,190
Other purposes 1,945,079 - 1,945,079
Unrestricted (3,942,086) 318,439 (3,623,647)
Total net position 5,580,562$ 356,019$ 5,936,581$
UNION BEACH SCHOOL DISTRICT
Statement of Net Position
June 30, 2018
See accompanying notes to financial statements. 24

Exhibit A-2
Net (Expense) Revenue and
Program Revenues Changes in Net Position
Indirect Operating Capital
Expenses Charges for Grants and Grants and Governmental Business-type
Functions/Programs Expenses Allocation Services Contributions Contributions Activities Activities Total
Governmental activities:
Current:
Regular instruction 3,509,848$ -$ 945$ -$ -$ (3,508,903)$ -$ (3,508,903)$
Special schools instruction 1,229,124 - - - - (1,229,124) - (1,229,124)
Other special instruction 67,579 - (67,579) (67,579)
Support services and undistributed costs:
Instruction 4,768,900 - - - - (4,768,900) (4,768,900)
Health services 95,160 - - - - (95,160) - (95,160)
Other support services 1,057,656 - - - - (1,057,656) - (1,057,656)
Educational media services 114,771 - - - - (114,771) - (114,771)
Instruction staff training 16,949 - - - - (16,949) - (16,949)
General administrative services 318,255 - - - - (318,255) - (318,255)
School administrative services 219,510 - - - - (219,510) - (219,510)
Central services 196,134 - - - - (196,134) - (196,134)
Allowed maintenance for school facilities 183,203 - - - - (183,203) - (183,203)
Other operation & maintenance of plant 670,832 - - - - (670,832) - (670,832)
Care and upkeep of grounds 40,834 - - - - (40,834) - (40,834)
Security 74,257 - - - - (74,257) - (74,257)
Student transportation services 710,674 - - - - (710,674) - (710,674)
Unallocated employee benefits 2,044,652 - - - - (2,044,652) - (2,044,652)
Non-budgeted expenditures 689,961 - - 689,961 - - -
Interest expense 9,963 - - - - (9,963) - (9,963)
Total governmental activities 16,018,262 - 945 689,961 - (15,327,356) - (15,327,356)
Business-type activities:
Food service 309,657 120,697 129,862 - - (59,098) (59,098)
Latchkey Program 71,203 77,865 - - - 6,662 6,662
Total business-type activities 380,860 198,562 129,862 - - (52,436) (52,436)
Total primary government 16,399,122$ 199,507$ 819,823$ -$ (15,327,356) (52,436) (15,379,792)
General revenues:
Taxes:
Property taxes levied for general purpose 6,628,685 - 6,628,685
Federal and state aid 9,216,067 - 9,216,067
Miscellaneous income 11,870 - 11,870
Investment earnings 9,960 372 10,332
Total general revenues 15,866,582 372 15,866,954
Change in net position 539,226 (52,064) 487,162
Net position—beginning 5,041,336 408,083 5,449,419
Net position—ending 5,580,562$ 356,019$ 5,936,581$
UNION BEACH SCHOOL DISTRICT
For the Fiscal Year Ended June 30, 2018
Statement of Activities
See accompanying notes to financial statements.25
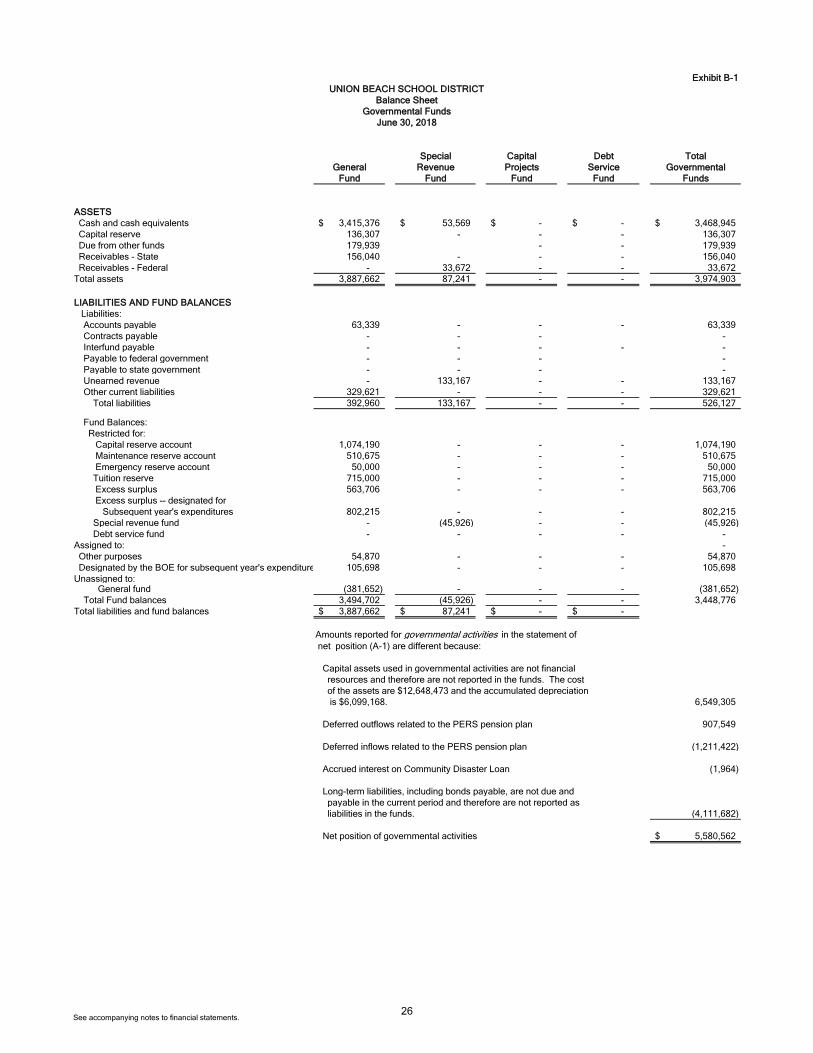
Exhibit B-1
Special Capital Debt Total
General Revenue Projects Service Governmental
Fund Fund Fund Fund Funds
ASSETS
Cash and cash equivalents 3,415,376$ 53,569$ -$ -$ 3,468,945$
Capital reserve 136,307 - - - 136,307
Due from other funds 179,939 - - 179,939
Receivables - State 156,040 - - - 156,040
Receivables - Federal - 33,672 - - 33,672
Total assets 3,887,662 87,241 - - 3,974,903
LIABILITIES AND FUND BALANCES
Liabilities:
Accounts payable 63,339 - - - 63,339
Contracts payable - - - -
Interfund payable - - - - -
Payable to federal government - - - -
Payable to state government - - - -
Unearned revenue - 133,167 - - 133,167
Other current liabilities 329,621 - - - 329,621
Total liabilities 392,960 133,167 - - 526,127
Fund Balances:
Restricted for:
Capital reserve account 1,074,190 - - - 1,074,190
Maintenance reserve account 510,675 - - - 510,675
Emergency reserve account 50,000 - - - 50,000
Tuition reserve 715,000 - - - 715,000
Excess surplus 563,706 - - - 563,706
Excess surplus -- designated for
Subsequent year's expenditures 802,215 - - - 802,215
Special revenue fund - (45,926) - - (45,926)
Debt service fund - - - - -
Assigned to: -
Other purposes 54,870 - - - 54,870
Designated by the BOE for subsequent year's expenditures 105,698 - - - 105,698
Unassigned to: General fund (381,652) - - - (381,652)
Total Fund balances 3,494,702 (45,926) - - 3,448,776
Total liabilities and fund balances 3,887,662$ 87,241$ -$ -$
Amounts reported for governmental activities in the statement of
net position (A-1) are different because:
Capital assets used in governmental activities are not financial
resources and therefore are not reported in the funds. The cost
of the assets are $12,648,473 and the accumulated depreciation
is $6,099,168. 6,549,305
Deferred outflows related to the PERS pension plan 907,549
Deferred inflows related to the PERS pension plan (1,211,422)
Accrued interest on Community Disaster Loan (1,964)
Long-term liabilities, including bonds payable, are not due and
payable in the current period and therefore are not reported as
liabilities in the funds. (4,111,682)
Net position of governmental activities 5,580,562$
UNION BEACH SCHOOL DISTRICT
Balance Sheet
Governmental Funds
June 30, 2018
See accompanying notes to financial statements.26

Exhibit B-2 Exhibit B-2
Special Debt Total
General Revenue Service Governmental
Fund Fund Fund Funds
REVENUES
Local sources:
Local tax levy 6,628,685$ -$ -$ 6,628,685$
Tuition charges 945 - - 945
Interest on investments 9,960 - - 9,960
Interest earned on capital reserve funds - - - -
Miscellaneous 11,870 - - 11,870
Total - Local Sources 6,651,460 - - 6,651,460
State sources 9,123,949 262,085 - 9,386,034
Federal sources - 519,994 - 519,994
Total revenues 15,775,409$ 782,079$ -$ 16,557,488$
EXPENDITURES
Current:
Regular instruction 2,803,586$ 706,262$ -$ 3,509,848$
Special education instruction 1,229,124 - - 1,229,124
Other special instruction 67,579 - - 67,579
Undistributed - current:
Instruction 4,564,452 - - 4,564,452
Health services 95,160 - - 95,160
Other support services 906,151 103,400 - 1,009,551
Educational media services 114,771 - - 114,771
Instruction staff training 16,949 - - 16,949
General administrative services 307,912 - - 307,912
School administrative services 219,510 - - 219,510
Allowed maintenance for school facilities 183,203 - - 183,203
Other operation & maintenance of plant 620,684 - - 620,684
Care and upkeep of grounds 40,834 40,834
Security 74,257 74,257
Student transportation services 702,496 - - 702,496
Central services 196,134 - - 196,134
Unallocated employee benefits 2,058,243 - - 2,058,243
Non-budgeted expenditures 689,961 - - 689,961
Debt service:
Principal - - 449,642 449,642
Interest and other charges - - 46,472 46,472
Capital outlay 334,383 - - 334,383
Transfer to debt service 496,114 - 496,114 992,228
Total expenditures 15,721,503 809,662 992,228 17,523,393
Excess (Deficiency) of revenues
over expenditures 53,906 (27,583) (992,228) (965,905)
Fund balance—July 1 3,440,796 (18,343) - 3,422,453 Fund balance—June 30 3,494,702$ (45,926)$ (992,228)$ 2,456,548$
GAAP
UNION BEACH SCHOOL DISTRICT
Statement of Revenues, Expenditures, And Changes in Fund Balances
Governmental Funds
For the Fiscal Year Ended June 30, 2018
See accompanying notes to financial statements.27

Exhibit B-3
Total net change in fund balances - governmental funds (from B-2) (965,905)$
Amounts reported for governmental activities in the statement
of activities (A-2) are different because:
Capital outlays are reported in governmental funds as expenditures. However, in the statement of
activities, the cost of those assets is allocated over their estimated useful lives as depreciation expense.
This is the amount by which capital outlays exceeded depreciation in the period.
Depreciation expense (288,873)
Capital outlays 302,034 13,161
In the Statement of Activities, the PERS pension expense is the amount paid plus net change in the Deferred Outflows,
Deferred Inflows and pension liability as reported by the State of New Jersey 52,526
In the statement of activities, interest on long-term debt is accrued, regardless of when due. In the governmental
funds, interest is reported when due. The change in accrued interest is an addition to the reconciliation. 36,509
Repayment of CDL principal is an expenditure in the governmental funds, but the repayment reduces
long-term liabilities in the statement of net position and is not reported in the statement of activities. 449,642
In the statement of activities, certain operating expenses, e.g., compensated absences (sick leave) and
special termination benefits (early retirement incentive) are measured by the amounts
earned during the year. In the governmental funds, however, expenditures for these items are reported
in the amount of financial resources used, essentially, the amounts actually paid. (38,935)
Change in net position of governmental activities (453,002)$
UNION BEACH SCHOOL DISTRICT
For the Fiscal Year Ended June 30, 2018
Reconciliation of the Statement of Revenues, Expenditures,
and Changes in Fund Balances of Governmental Funds
to the Statement of Activities
See accompanying notes to financial statements.28

Exhibit B-4
Food Latchkey
Service Program Totals
ASSETS
Current assets:
Cash and cash equivalents 237,027$ 238,322$ 475,349$
Accounts receivable - State 305 - 305
Accounts receivable - Federal 10,505 - 10,505
Interfund receivable - - -
Other receivables - - -
Inventories 1,627 - 1,627
Total current assets 249,464 238,322 487,786
Noncurrent assets:
Furniture, machinery & equipment 338,751 - 338,751
Less accumulated depreciation (301,171) - (301,171)
Total noncurrent assets 37,580 - 37,580
Total assets 287,044 238,322 525,366
LIABILITIES
Current liabilities:
Accounts payable 13,247 - 13,247
Deferred revenue 726 - 726
Interfund payable 155,374 - 155,374
Total current liabilities 169,347 - 169,347
NET POSITION
Net investment in capital assets 37,580 - 37,580
Contributed capital -
Restricted for:
Capital projects - - -
Unrestricted 80,117 238,322 318,439
Total net position 117,697 238,322 356,019
Total liabilities and net position 287,044$ 238,322$ 525,366$
Business-type-activities-
Enterprise Funds
UNION BEACH School District
Statement of Net Position
Proprietary Funds
June 30, 2018
See accompanying notes to financial statements.29
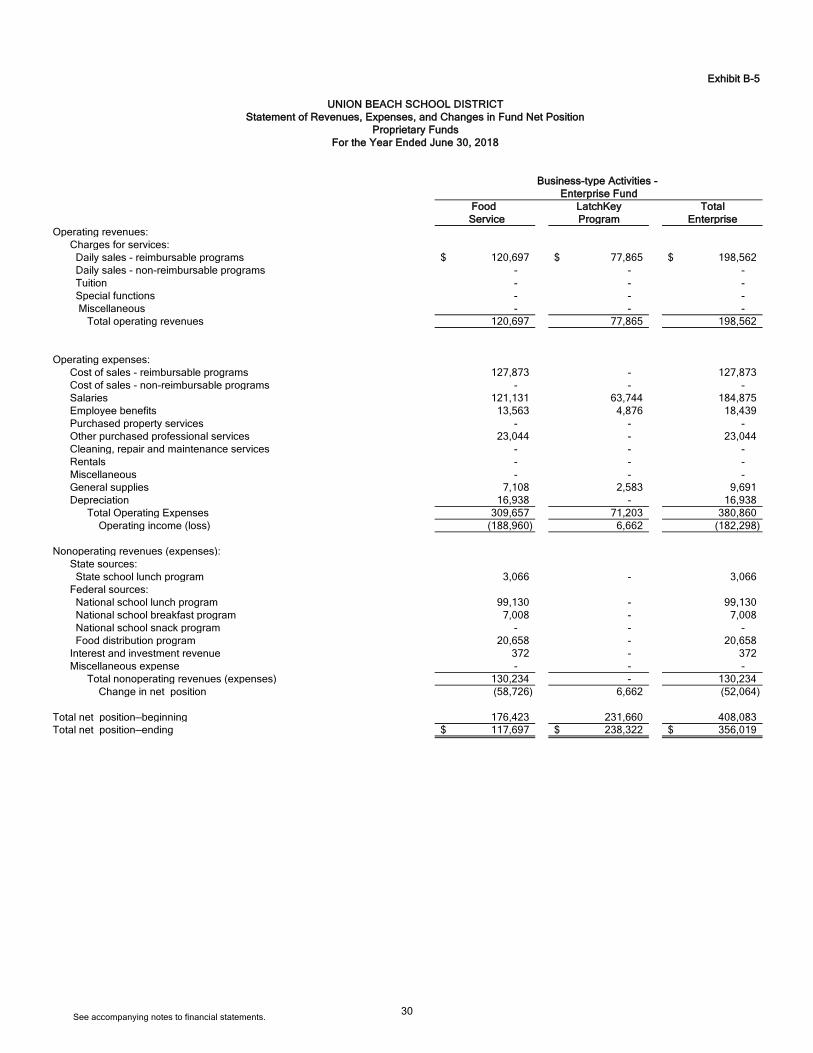
Exhibit B-5
Business-type Activities -
Enterprise Fund
Food LatchKey Total
Service Program Enterprise
Operating revenues:
Charges for services:
Daily sales - reimbursable programs 120,697$ 77,865$ 198,562$
Daily sales - non-reimbursable programs - - -
Tuition - - -
Special functions - - -
Miscellaneous - - -
Total operating revenues 120,697 77,865 198,562
Operating expenses:
Cost of sales - reimbursable programs 127,873 - 127,873
Cost of sales - non-reimbursable programs - - -
Salaries 121,131 63,744 184,875
Employee benefits 13,563 4,876 18,439
Purchased property services - - -
Other purchased professional services 23,044 - 23,044
Cleaning, repair and maintenance services - - -
Rentals - - -
Miscellaneous - - -
General supplies 7,108 2,583 9,691
Depreciation 16,938 - 16,938
Total Operating Expenses 309,657 71,203 380,860
Operating income (loss) (188,960) 6,662 (182,298)
Nonoperating revenues (expenses):
State sources:
State school lunch program 3,066 - 3,066
Federal sources:
National school lunch program 99,130 - 99,130
National school breakfast program 7,008 - 7,008
National school snack program - - -
Food distribution program 20,658 - 20,658
Interest and investment revenue 372 - 372
Miscellaneous expense - - -
Total nonoperating revenues (expenses) 130,234 - 130,234
Change in net position (58,726) 6,662 (52,064)
Total net position—beginning 176,423 231,660 408,083
Total net position—ending 117,697$ 238,322$ 356,019$
UNION BEACH SCHOOL DISTRICT
Statement of Revenues, Expenses, and Changes in Fund Net Position
Proprietary Funds
For the Year Ended June 30, 2018
See accompanying notes to financial statements.30
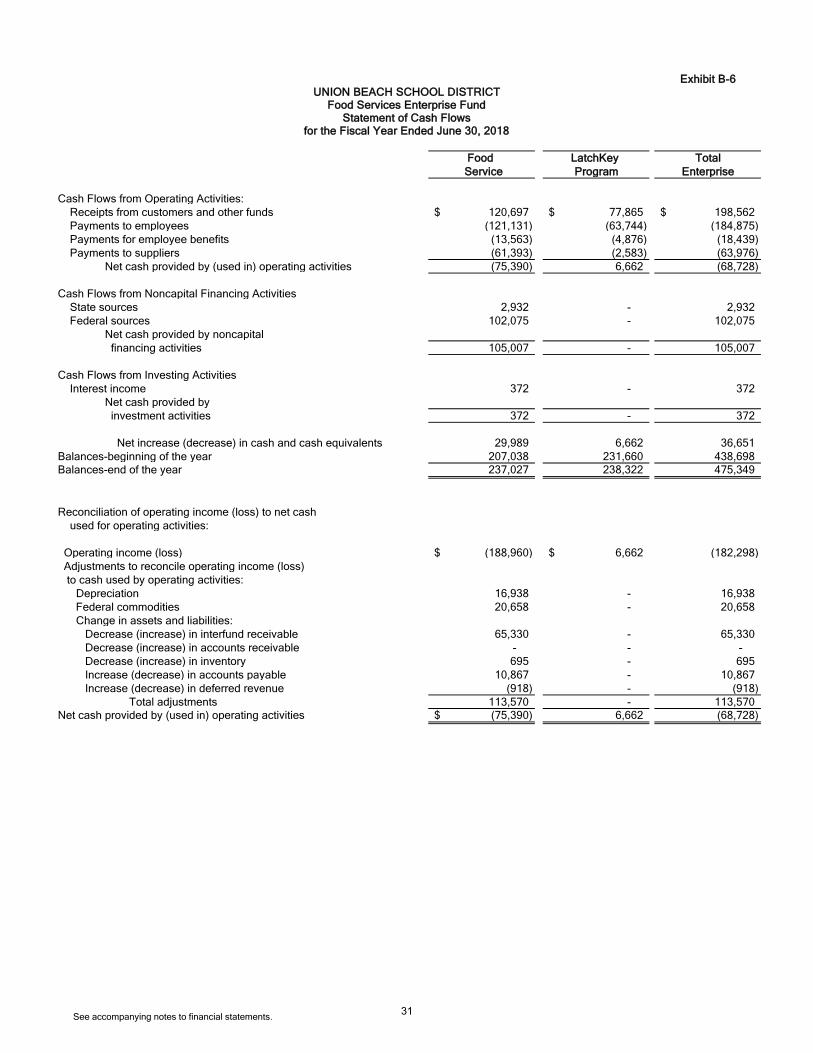
Exhibit B-6
Food LatchKey Total
Service Program Enterprise
Cash Flows from Operating Activities:
Receipts from customers and other funds 120,697$ 77,865$ 198,562$
Payments to employees (121,131) (63,744) (184,875)
Payments for employee benefits (13,563) (4,876) (18,439)
Payments to suppliers (61,393) (2,583) (63,976)
Net cash provided by (used in) operating activities (75,390) 6,662 (68,728)
Cash Flows from Noncapital Financing Activities
State sources 2,932 - 2,932
Federal sources 102,075 - 102,075
Net cash provided by noncapital
financing activities 105,007 - 105,007
Cash Flows from Investing Activities
Interest income 372 - 372
Net cash provided by
investment activities 372 - 372
Net increase (decrease) in cash and cash equivalents 29,989 6,662 36,651
Balances-beginning of the year 207,038 231,660 438,698
Balances-end of the year 237,027 238,322 475,349
Reconciliation of operating income (loss) to net cash
used for operating activities:
Operating income (loss) (188,960)$ 6,662$ (182,298)
Adjustments to reconcile operating income (loss)
to cash used by operating activities:
Depreciation 16,938 - 16,938
Federal commodities 20,658 - 20,658
Change in assets and liabilities:
Decrease (increase) in interfund receivable 65,330 - 65,330
Decrease (increase) in accounts receivable - - -
Decrease (increase) in inventory 695 - 695
Increase (decrease) in accounts payable 10,867 - 10,867
Increase (decrease) in deferred revenue (918) - (918)
Total adjustments 113,570 - 113,570
Net cash provided by (used in) operating activities (75,390)$ 6,662 (68,728)
UNION BEACH SCHOOL DISTRICTFood Services Enterprise Fund
Statement of Cash Flowsfor the Fiscal Year Ended June 30, 2018
See accompanying notes to financial statements.31
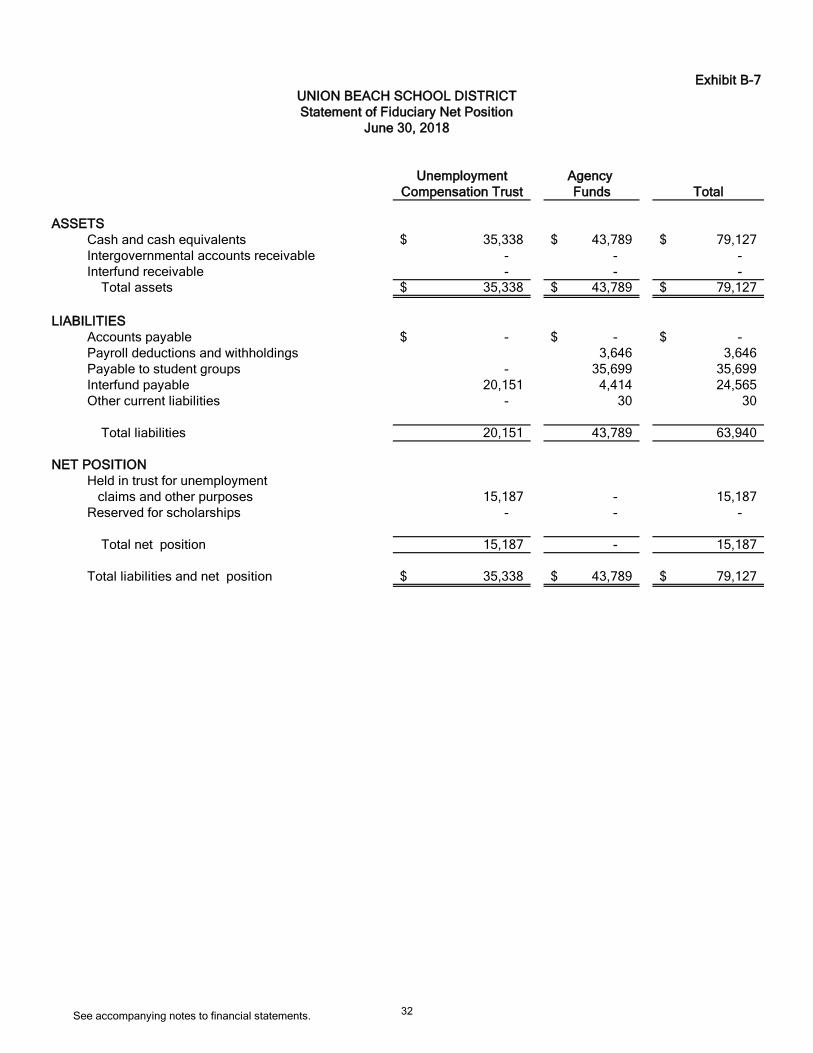
Exhibit B-7
Unemployment Agency
Compensation Trust Funds Total
ASSETS
Cash and cash equivalents 35,338$ 43,789$ 79,127$
Intergovernmental accounts receivable - - -
Interfund receivable - - -
Total assets 35,338$ 43,789$ 79,127$
LIABILITIES
Accounts payable -$ -$ -$
Payroll deductions and withholdings 3,646 3,646
Payable to student groups - 35,699 35,699
Interfund payable 20,151 4,414 24,565
Other current liabilities - 30 30
Total liabilities 20,151 43,789 63,940
NET POSITION
Held in trust for unemployment
claims and other purposes 15,187 - 15,187
Reserved for scholarships - - -
Total net position 15,187 - 15,187
Total liabilities and net position 35,338$ 43,789$ 79,127$
UNION BEACH SCHOOL DISTRICT
Statement of Fiduciary Net Position
June 30, 2018
See accompanying notes to financial statements. 32

Exhibit B-8
Unemployment
Compensation Trust
ADDITIONS
Contributions:
Plan members 21,078$
Other -
Total contributions 21,078
Investment earnings:
Net increase (decrease) in
fair value of investments -
Interest -
Dividends 61
Less investment expense -
Net investment earnings 61
Total additions 21,139
DEDUCTIONS
Quarterly contribution reports -
Unemployment claims 23,862
Scholarships awarded -
Refunds of contributions -
Administrative expenses -
Total deductions 23,862
Change in net position (2,723)
Net position—beginning of the year 17,910
Net position—end of the year 15,187$
UNION BEACH SCHOOL DISTRICT
Statement of Changes in Fiduciary Net Position
Fiduciary Funds
For the Fiscal Year Ended June 30, 2018
See accompanying notes to financial statements. 33

Union Beach School District
Notes to Financial Statements
For the Year Ended June 30, 2018
1. Summary of Significant Accounting Policies
The Financial statements of the Board of Education ("Board") of the Union Beach School District("District") have been prepared in conformity with accounting principles generally accepted inthe United States of America ("GAAP") as applied to governmental units. The GovernmentalAccounting Standards Board ("GASB") is the accepted standard-setting body for establishinggovernmental accounting and financial reporting principles. The more significant of the Board'saccounting policies are described below.
A. Reporting Entity:
The Union Beach School District is a Type II district located in the county of Monmouth, State ofNew Jersey. As a Type II district, the School District functions independently through a Board ofEducation. The Board is compromised of nine members elected to three-year staggered terms.The purpose of the District is to educate students in grades PreK-8. The Union Beach SchoolDistrict had an approximate enrollment of 637 students at June 30, 2018.
The Board is an instrumentality of the State of New Jersey, established to function as aneducational institution. The Board consists of elected officials and is responsible for the fiscalcontrol of the District. A Superintendent is appointed by the Board and is responsible for theadministrative control of the District.
The primary criterion for including activities within the District's reporting entity, as set forth inSection 2100 of the GASB Codification of Governmental Accounting and Financial ReportingStandards, is the degree of oversight responsibility maintained by the District. Oversightresponsibility includes financial interdependency, selection of governing authority, designation ofmanagement, ability to significantly influence operations and accountability for fiscal matters.The district-wide financial statements include all funds and account groups of the District overwhich the Board exercises operating control. The operations of the District include anelementary school located in Union Beach. There were no additional entities required to beincluded in the reporting entity under the criteria as described above, in the current fiscal year.Furthermore, the District is not includable in any other reporting entity on the basis of suchcriteria.
B. Basis of Presentation, Basis of Accounting:
The School District's basic financial statements consist of District-wide statements, including aStatement of Net Position and a Statement of Activities, and Fund Financial Statements whichprovide a more detailed level of financial information.
34

Union Beach School District
Notes to Financial Statements
For the Year Ended June 30, 2018
1. Summary of Significant Accounting Policies (Cont'd)
B. Basis of Presentation, Basis of Accounting (Cont'd):
Basis of Presentation
The School District has Bond Costs which have been classified as a Deferred Outflow and theBond Premium has been classified as a Deferred Inflow. The School District has employees thatare enrolled in a defined benefit plan operated by the State of New Jersey which createsdeferred outflows and inflows as described in Note 13.
District-Wide Statements: The district-wide financial statements (A-1 and A-2) include thestatement of net position and the statement of activities. These Statements include the financialactivities of the overall District, except for fiduciary activities. All interfund activity, excluding thefiduciary funds, has been eliminated in the statement of activities. Individual funds are notdisplayed but the statements distinguish governmental activities, generally financed in whole orin part with fees charged to external customers.
The Statement of Net Position presents the financial condition of the governmental andbusiness-type activity of the District at fiscal year-end. The Statement of Activities presents acomparison between direct expenses and program revenues for the business-type activity of theDistrict and for each function of the District's governmental activities. Direct expenses are thosethat are specifically associated with a program or function and, therefore, are clearly identifiableto a particular function. Program revenues include (a) fees and charges paid by the recipients ofgoods or services offered by the programs and (b) grants and contributions that are restricted tomeeting the operational or capital requirements of a particular program. Revenues that are notclassified as program revenues, including all taxes, are presented as general revenues. Thecomparison of direct expenses with program revenues identifies the extent to which eachgovernmental function or business segment is self-financing or draws from the general revenuesof the District.
Fund Financial Statements: During the fiscal year, the District segregates transactions relatedto certain District functions or activities in separate funds in order to aid financial managementand to demonstrate legal compliance. The Fund Financial Statements provide information aboutthe District's funds, including its fiduciary funds. Separate statements for each Fund category -governmental, proprietary, and fiduciary - are presented. The New Jersey Department ofEducation ("NJDOE") has elected to require New Jersey districts to treat each governmentalfund as a major fund in accordance with the option noted by Governmental AccountingStandards. The NJDOE believes that the presentation of all funds as major is important forpublic interest and to promote consistency among district financial reporting models.
35
Union Beach School District
Notes to Financial Statements
For the Year Ended June 30, 2018
1. Summary of Significant Accounting Policies (Cont'd)
B. Basis of Presentation, Basis of Accounting (Cont'd):
Basis of Presentation (Cont'd):
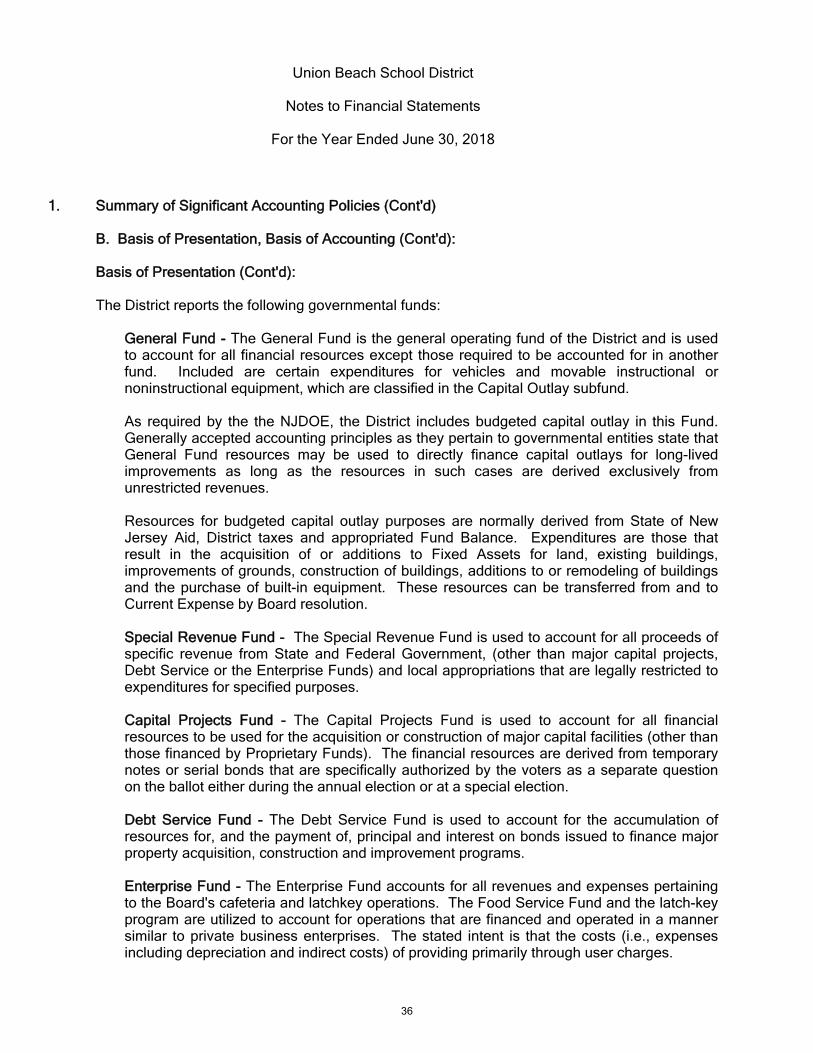
The District reports the following governmental funds:
General Fund - The General Fund is the general operating fund of the District and is usedto account for all financial resources except those required to be accounted for in anotherfund. Included are certain expenditures for vehicles and movable instructional ornoninstructional equipment, which are classified in the Capital Outlay subfund.
As required by the the NJDOE, the District includes budgeted capital outlay in this Fund.Generally accepted accounting principles as they pertain to governmental entities state thatGeneral Fund resources may be used to directly finance capital outlays for long-livedimprovements as long as the resources in such cases are derived exclusively fromunrestricted revenues.
Resources for budgeted capital outlay purposes are normally derived from State of NewJersey Aid, District taxes and appropriated Fund Balance. Expenditures are those thatresult in the acquisition of or additions to Fixed Assets for land, existing buildings,improvements of grounds, construction of buildings, additions to or remodeling of buildingsand the purchase of built-in equipment. These resources can be transferred from and toCurrent Expense by Board resolution.
Special Revenue Fund - The Special Revenue Fund is used to account for all proceeds ofspecific revenue from State and Federal Government, (other than major capital projects,Debt Service or the Enterprise Funds) and local appropriations that are legally restricted toexpenditures for specified purposes.
Capital Projects Fund - The Capital Projects Fund is used to account for all financialresources to be used for the acquisition or construction of major capital facilities (other thanthose financed by Proprietary Funds). The financial resources are derived from temporarynotes or serial bonds that are specifically authorized by the voters as a separate questionon the ballot either during the annual election or at a special election.
Debt Service Fund - The Debt Service Fund is used to account for the accumulation ofresources for, and the payment of, principal and interest on bonds issued to finance majorproperty acquisition, construction and improvement programs.
Enterprise Fund - The Enterprise Fund accounts for all revenues and expenses pertainingto the Board's cafeteria and latchkey operations. The Food Service Fund and the latch-keyprogram are utilized to account for operations that are financed and operated in a mannersimilar to private business enterprises. The stated intent is that the costs (i.e., expensesincluding depreciation and indirect costs) of providing primarily through user charges.
36
Union Beach School District
Notes to Financial Statements
For the Year Ended June 30, 2018
1. Summary of Significant Accounting Policies (Cont'd)
B. Basis of Presentation, Basis of Accounting (Cont'd):
Basis of Presentation (Cont'd):
The District reports the following fund types:
Trust and Agency Funds - The Trust and Agency Funds are used to account for assets heldby the District in a trustee capacity or as an agent for individuals, private organizations,other governments and/or other funds.
Expandable Trust Fund - An Expandable Trust Fund is accounted for in essentially thesame manner as the governmental fund types, using the same measurement focus andbasis of accounting. Expendable Trust Funds account for assets where both the principaland interest may be spent. The Expendable Trust Fund includes the UnemploymentCompensation Insurance Fund.
Agency Funds - Agency Funds are used to account for the assets that the District holds onbehalf of others as their agent. Agency Funds are custodial in nature and do not involvemeasurement of results of operations. Agency Funds include payroll and student activitiesfunds.
Basis of Accounting
Basis of Accounting determines when transactions are recorded in the financial records andreported on the financial statements.
District-Wide, Proprietary, and Fiduciary Fund Financial Statements: The District-wide financialstatements are prepared using the accrual basis of accounting. Governmental funds use themodified accrual basis of accounting; the Enterprise Fund and Fiduciary Funds use the accrualbasis of accounting. Differences in the accrual basis of accounting arise in the recognition ofrevenue, the recording of deferred revenue, and in the presentation of expenses versusexpenditures. Ad Valorem (Property) Taxes are susceptible to accrual as, under New JerseyState Statute, a municipality is required to remit to its school district the entire balance of taxesin the amount voted upon or certified, prior to the end of the school year. The District recordsthe entire approved tax levy as revenue (accrued) at the start of the fiscal year, since therevenue is both measurable and available. The District is entitled to receive monies under theestablished payment schedule and the unpaid amount is considered to be an "AccountsReceivable". Revenue from grants, entitlements, and donations is recognized in the fiscal yearin which all eligibility requirements have been satisfied.
37

Union Beach School District
Notes to Financial Statements
For the Year Ended June 30, 2018
1. Summary of Significant Accounting Policies (Cont'd)
B. Basis of Presentation, Basis of Accounting (Cont'd):
Basis of Accounting (cont'd)
Governmental Fund Financial Statements: Governmental Funds are reported using the currentfinancial resources measurement focus and the modified accrual basis of accounting. Underthis method, revenues are recognized when measurable and available. "Measurable" meansthe amount of the transaction can be determined and "available" means collectible within thecurrent period or soon enough thereafter to be used to pay liabilities of the current period.Expenditures are recorded when the related fund liability is incurred, except for principal andinterest on general long-term debt, claims and judgments, and compensated absences, whichare recognized as expenditures to the extent they have matured. General capital assetacquisitions are reported as expenditures in governmental funds, Proceeds if general long-termdebt and acquisitions under capital releases are reported as other financing sources.
All governmental and business-type activities and Enterprise Funds of the District follow thecodification of the Financial Accounting Standards Board
C. Budgets/Budgetary Control: Annual appropriated budgets are prepared in the spring ofeach year for the General, Special Revenue, and Debt Service Funds. The budgets aresubmitted and approved by the County Office and are not voted upon in the annual schoolelection. Budgets are prepared using the modified accrual basis of accounting, except forSpecial Revenue Fund. Line item accounts are defined as the lowest (most specific) level ofdetail as established pursuant to the minimum chart of accounts referenced in N.J.A.C 6:20-2A.2(m)1. All budget amendments/transfers must be approved by Board resolution. All budgetamounts presented in the accompanying supplementary information reflect the original budgetand the amended budget (which have been adjusted for legally-authorized revisions of theannual budgets during the year.
Appropriations, except remaining project appropriations, encumbrances, and unexpected grantappropriation, lapse at the end of each fiscal year. The Capital Project Fund presents theremaining project appropriations compared to current-year expenditures.
Formal budgetary integration into the accounting system is employed as a management controldevice during the year. For governmental funds there are no substantial differences betweenthe budgetary basis of accounting and generally accepted accounting principles with theexception of the legally mandated revenue recognition of the last state aid payment forbudgetary purposes only and the Special Revenue Fund as noted below. Encumbranceaccounting is also employed as an extension of formal budgetary integration in thegovernmental fund-types. Unencumbered appropriations lapse at fiscal year-end.
38
Union Beach School District
Notes to Financial Statements
For the Year Ended June 30, 2018
1. Summary of Significant Accounting Policies (Cont'd)
C. Budgets/Budgetary Control: (cont'd)
The accounting records of the Special Revenue Fund are maintained on the grant accountingbudgetary basis. The grant accounting budgetary basis differs from GAAP in that the grantaccounting budgetary basis recognizes encumbrances as expenditures and also recognizes therelated revenues, whereas the GAAP basis does not. Sufficient supplemental records aremaintained to allow for the presentation of GAAP basis financial reports. At June 30, 2018,there was a reconciling difference of $(582,608) between the budgetary basis and GAAP basisin the General Fund and of $(27,583) in the Special Revenue Fund.
The following presents a reconciliation of the General Fund revenues and Special RevenueFund revenues and expenditures from the budgetary basis of accounting as presented in theBudgetary Comparison Schedules - General and Special Revenue Funds to the GAAP basis ofaccounting as presented in the Combined Statement of Revenues, Expenditures and Changesin Fund Balances - All Governmental Fund Types. Note that the District does not reportencumbrances outstanding at year-end as expenditures in the General Fund since the GeneralFund budget follows modified accrual basis with the exception of the revenue recognition policyfor the last state aid payment.
D. Encumbrance Accounting:
Under Encumbrance Accounting, purchase orders, contracts and other commitments for theexpenditure of resources are recorded to reserve and portion of the applicable appropriation.Open encumbrances in governmental funds other than the Special Revenue Fund are reportedas reservations of fund balances at fiscal year-end as they do not constitute expenditures orliabilities but rather commitments related to unperformed contracts for goods and services.
Open encumbrances in the Special Revenue Fund, for which the District has received advancesare reflected in the Balance Sheet as deferred revenues at fiscal year-end.
The encumbered appropriation authority carries over into the next fiscal year. An entry will bemade at the beginning of the next fiscal year to increase the appropriation reflected in thecertified budget by the outstanding encumbrance amount as of the current fiscal year-end.
E. Assets, Liabilities, and Equity:
Interfund Transactions:
Transfers between Governmental and Business-Type activities on the District-wide statementsare reported in the same manner as general revenues.
39
Union Beach School District
Notes to Financial Statements
For the Year Ended June 30, 2018
1. Summary of Significant Accounting Policies (Cont'd)
E. Assets, Liabilities, and Equity:
Interfund Transactions: (cont'd)
Exchange transactions between funds are reported as revenues in the seller funds and asexpenditures/expenses in the purchaser funds. Flows of cash or goods from one fund toanother without a requirement for repayment are reported as Interfund transfers. Interfundtransfers are reported as other financing sources/uses in Governmental Funds and after non-operating revenues/expenses to the funds that initially paid for them are not presented on thefinancial statements.
Inventories:
Inventories and prepaid expenses, which benefit future periods are recorded as an expenditureduring the year of purchase.
Prior to 2018, the District reported inventories at the lower of cost or market. Cost isdetermined using the first-in, first-out (FIFO) method. The District began stating inventoriesprospectively at the lower of FIFO cost and net realizable value. This change was made inresponse to a recent FASB standard issued as part of the Board's simplification initiative. Underthe prior method, "market", was replacement cost, subject to possible adjustments. Netrealizable value is based on the selling price. The change is intended to reduce complexity infinancial statement preparation. This change had no significant effect on earnings for 2018.
Capital Assets:
The District has an established formal system of accounting for its Capital Assets. Purchased orconstructed Capital Assets are reported at cost. Donated Capital Assets are valued at theirestimated acquisition value on the date received. The cost of normal maintenance and repairsthat do not add to the value of the asset or materially extend assets' lives are not capitalized.The District does not possess any infrastructure.
All reported Capital Assets except for Land and Construction in Progress are depreciated.Depreciation is computed using the straight-line method over the following estimated usefullives:
Asset ClassEstimated
Useful Lives
Building and Improvements 20-50 yearsFurniture and Equipment 5-20 yearsVehicles 8 years
40

Union Beach School District
Notes to Financial Statements
For the Year Ended June 30, 2018
1. Summary of Significant Accounting Policies (Cont'd)
E. Assets, Liabilities, and Equity (Cont'd):
Compensated Absences:
The Districts accounts for Compensated Absences (e.g., unused vacation, sick leave) asdirected by the Governmental Accounting Board Statement. A liability for CompensatedAbsences attributable to services already rendered and not contingent on a specific event that isoutside the control of the employer and the employee is accrued as the employees earn therights to the benefits.
District employees are granted varying amounts of vacation and sick leave in accordance withthe District's personnel policy. Upon termination, employees are paid for accrued vacation. TheDistrict's Policy permits employees to accumulate unused sick leave and carry forward the fullamount to subsequent years. Upon retirement, employees shall be paid by the District for theunused sick leave in accordance with the District's agreements with the various employeeunions.
In the District-wide Statement of Net Position, the liabilities whose average maturities aregreater than one year should be reported in two components - the amount due within one yearand the amount due in more than one year.
The liability for vested compensated absences of the proprietary fund-types is recorded withinthose funds as the benefits accrue to employees. As of June 30, 2018, no liability existed forcompensated absences in the Enterprise Fund.
Unearned Revenue:
Unearned Revenue arises when assets are recognized before revenue recognition criteria havebeen satisfied. Grants and entitlement received before the eligibility requirements are met arealso recorded as Unearned Revenue.
Accrued Liabilities and Long-Term Obligations:
All Payables, Accrued Liabilities, and Long-Term Obligations are reported on the District-widefinancial statements. In general, governmental fund payables are accrued liabilities that, onceincurred are paid in a timely manner and in full from current financial resources are reported asobligations of the funds. However, contractually-required pension contributions andcompensated absences that are paid from governmental funds are reported as liabilities on thefund financial statements only to the extent that they are due for payment during the currentyear. Bonds are recognized as a liability on the fund financial statements when due.
41
Union Beach School District
Notes to Financial Statements
For the Year Ended June 30, 2018
1. Summary of Significant Accounting Policies (Cont'd)
E. Assets, Liabilities, and Equity (Cont'd):
Net Position:
Net Position represent the difference between assets and liabilities. Net investment in capitalassets consists of capital assets, net of accumulated depreciation, reduced by the outstandingbalance of any borrowing used for the acquisition, construction, or improvement of those assets.Net Position are reported as restricted when there are limitations imposed on their use eitherthrough the enabling legislation adopted by the District or through external restrictions imposedby creditors, grantors, or laws or regulations of other governments. The District's policy is to firstapply restricted resources when an expense is incurred for purposes for which both restrictedand unrestricted Net Position are available.
Fund Balance Reserves:
The District reserves those portions of Fund Balance which are legally segregated for a specificfuture use or which do not represent available expendable resources and, therefore, are notavailable for appropriation in future periods. A Fund Balance Reserve has been established forencumbrances, maintenance, capital, emergency, tuition and subsequent year's expenditures.
Revenues - Exchange and Nonexchange Transactions:
Revenue resulting from Exchange Transactions, in which each party gives and receivesessentially equal value, is recorded on the actual accrual basis when the Exchange takes place.On the modified accrual basis, revenue is recorded in the fiscal year in which the resources aremeasurable and become available. Available means the resources will be collected within thecurrent fiscal year or are expected to be collected soon enough thereafter to be used to payliabilities of the current fiscal year. For the District available means within sixty days of the fiscalyear-end.
Nonexchange Transactions, in which the District receives value without directly giving equalvalue in return, include property taxes, income taxes, grants, entitlements, and donations. Onthe accrual basis, revenue from property taxes is recognized in the fiscal year for which thetaxes are levied. Revenue from income taxes is recognized in the period in which the income isearned. Revenue from grants, entitlements, and donations is recognized in the fiscal year inwhich all eligibility requirements have been satisfied. Eligibility requirements include timingrequirements, which specify the year when the resources are required to be used or the fiscalyear when use is first permitted; matching requirements, in which the District must provide localresources to be used for a specific purpose; and expenditure requirements, in which theresources are provided to the District on a reimbursement basis. On the modified accrual basis,revenue from Nonexchange Transactions must also by available before it can be recognized.
Under the modified accrual basis, the following revenue sources are considered to be bothmeasurable and available at fiscal year-end: property taxes available as an advance, interest,and tuition.
42

Union Beach School District
Notes to Financial Statements
For the Year Ended June 30, 2018
1. Summary of Significant Accounting Policies (Cont'd)
E. Assets, Liabilities, and Equity (Cont'd):
Operating Revenues and Expenses:
Operating revenues are those revenues that are generated directly from the primary activity ofthe Enterprise Fund. For the School District, these revenues are sales for food service andlatch-key program. Operating expenses are necessary costs incurred to provide the service thatis the primary activity of the Enterprise Fund.
Deferred Outflows/Inflows of Resources
In addition to assets, the Statement of Net Position will sometimes report a separate section fordeferred outflows of resources. This separate financial statement element, deferred outflows ofresources, represents a consumption of net position that applies to a future period(s) and so willnot be recognized as an outflow of resources (expense/expenditure) until then.
In addition to liabilities, the Statement of Net Position will sometimes report a separate sectionfor deferred inflows of resources. This separate financial statement element, deferred inflows ofresources, represents an acquisition of net position that applies to future periods and so will notbe recognized as an inflow of resources (revenue) until that time.
Allocation of Indirect Expenses:
The District reports all Direct Expenses by function in the Statement of Activities. DirectExpenses are those that are clearly identifiable with a function. Indirect Expenses are allocatedto functions but are reported separately in the Statement of Activities. Employee Benefits,including the employer's share of Social Security, workers compensation, and medical anddental benefits, were allocated based on salaries of that program. Depreciation expense, wherepracticable, is specifically identified by function and is included in the Indirect Expense column ofthe Statement of Activities. Depreciation expense that could not be attributable to a specificfunction is considered an Indirect Expense and is reported separately in the Statement ofActivities. Interest on long-term debt is considered an Indirect Expense and is reportedseparately on the Statement of Activities.
Extraordinary and Special Items:
Extraordinary Items are transactions or events that are unusual in nature and infrequent inoccurrence. Special Items are transactions or events that are within the control of managementand are either unusual in nature or infrequent in occurrence.
43
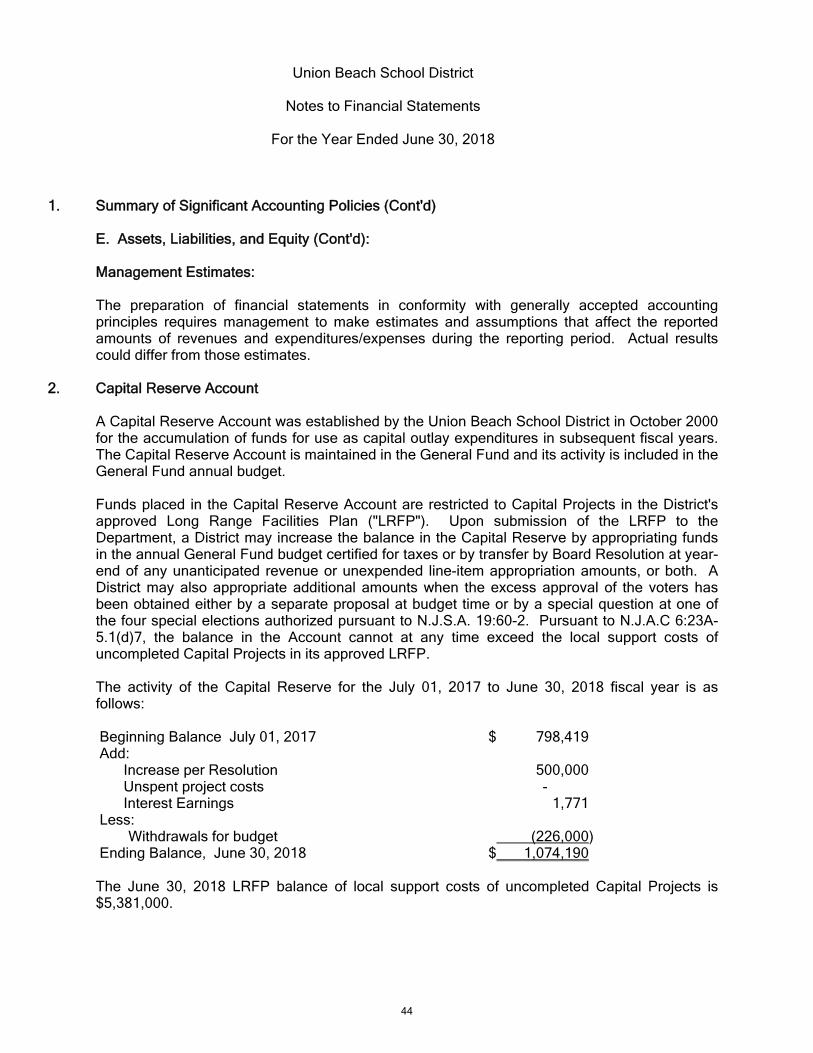
Union Beach School District
Notes to Financial Statements
For the Year Ended June 30, 2018
1. Summary of Significant Accounting Policies (Cont'd)
E. Assets, Liabilities, and Equity (Cont'd):
Management Estimates:
The preparation of financial statements in conformity with generally accepted accountingprinciples requires management to make estimates and assumptions that affect the reportedamounts of revenues and expenditures/expenses during the reporting period. Actual resultscould differ from those estimates.
2. Capital Reserve Account
A Capital Reserve Account was established by the Union Beach School District in October 2000for the accumulation of funds for use as capital outlay expenditures in subsequent fiscal years.The Capital Reserve Account is maintained in the General Fund and its activity is included in theGeneral Fund annual budget.
Funds placed in the Capital Reserve Account are restricted to Capital Projects in the District'sapproved Long Range Facilities Plan ("LRFP"). Upon submission of the LRFP to theDepartment, a District may increase the balance in the Capital Reserve by appropriating fundsin the annual General Fund budget certified for taxes or by transfer by Board Resolution at year-end of any unanticipated revenue or unexpended line-item appropriation amounts, or both. ADistrict may also appropriate additional amounts when the excess approval of the voters hasbeen obtained either by a separate proposal at budget time or by a special question at one ofthe four special elections authorized pursuant to N.J.S.A. 19:60-2. Pursuant to N.J.A.C 6:23A-5.1(d)7, the balance in the Account cannot at any time exceed the local support costs ofuncompleted Capital Projects in its approved LRFP.
The activity of the Capital Reserve for the July 01, 2017 to June 30, 2018 fiscal year is asfollows:
Beginning Balance July 01, 2017 $ 798,419Add:
Increase per Resolution 500,000Unspent project costs -Interest Earnings 1,771
Less:Withdrawals for budget (226,000)
Ending Balance, June 30, 2018 $ 1,074,190
The June 30, 2018 LRFP balance of local support costs of uncompleted Capital Projects is$5,381,000.
44
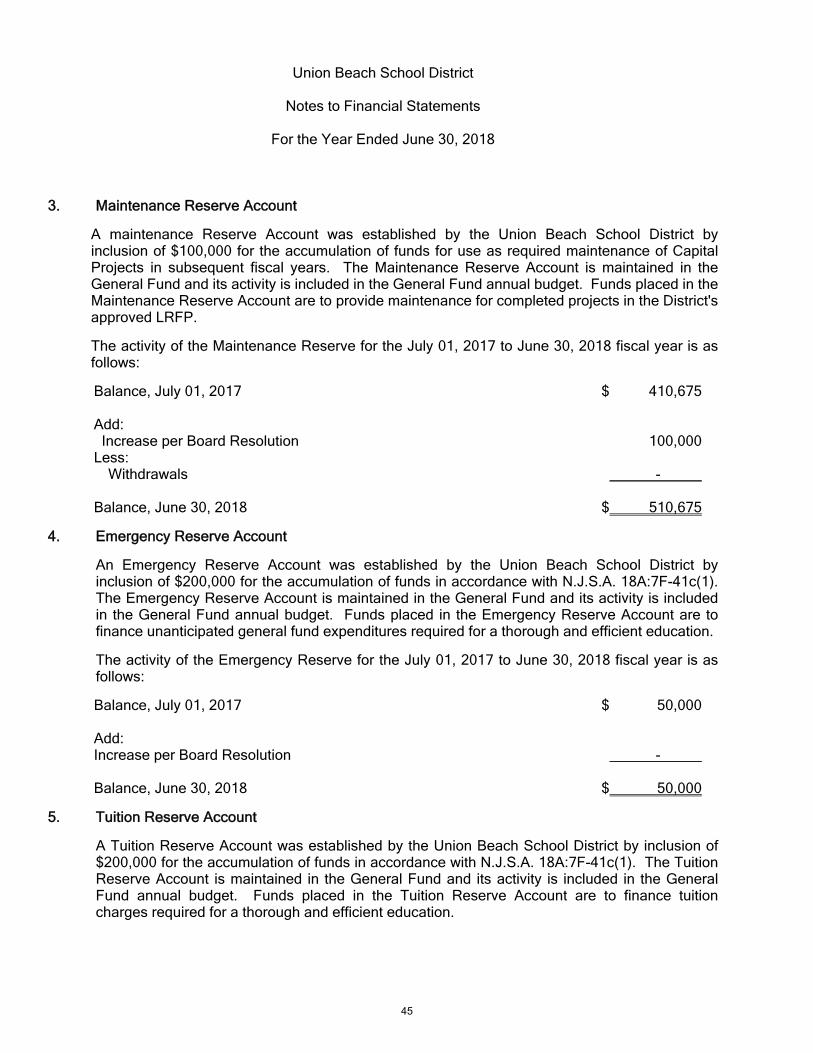
Union Beach School District
Notes to Financial Statements
For the Year Ended June 30, 2018
3. Maintenance Reserve Account
A maintenance Reserve Account was established by the Union Beach School District byinclusion of $100,000 for the accumulation of funds for use as required maintenance of CapitalProjects in subsequent fiscal years. The Maintenance Reserve Account is maintained in theGeneral Fund and its activity is included in the General Fund annual budget. Funds placed in theMaintenance Reserve Account are to provide maintenance for completed projects in the District'sapproved LRFP.
The activity of the Maintenance Reserve for the July 01, 2017 to June 30, 2018 fiscal year is asfollows:
Balance, July 01, 2017 $ 410,675
Add: Increase per Board Resolution 100,000Less:
Withdrawals -
Balance, June 30, 2018 $ 510,675
4. Emergency Reserve Account
An Emergency Reserve Account was established by the Union Beach School District byinclusion of $200,000 for the accumulation of funds in accordance with N.J.S.A. 18A:7F-41c(1).The Emergency Reserve Account is maintained in the General Fund and its activity is includedin the General Fund annual budget. Funds placed in the Emergency Reserve Account are tofinance unanticipated general fund expenditures required for a thorough and efficient education.
The activity of the Emergency Reserve for the July 01, 2017 to June 30, 2018 fiscal year is asfollows:
Balance, July 01, 2017 $ 50,000
Add:Increase per Board Resolution -
Balance, June 30, 2018 $ 50,000
5. Tuition Reserve Account
A Tuition Reserve Account was established by the Union Beach School District by inclusion of$200,000 for the accumulation of funds in accordance with N.J.S.A. 18A:7F-41c(1). The TuitionReserve Account is maintained in the General Fund and its activity is included in the GeneralFund annual budget. Funds placed in the Tuition Reserve Account are to finance tuitioncharges required for a thorough and efficient education.
45
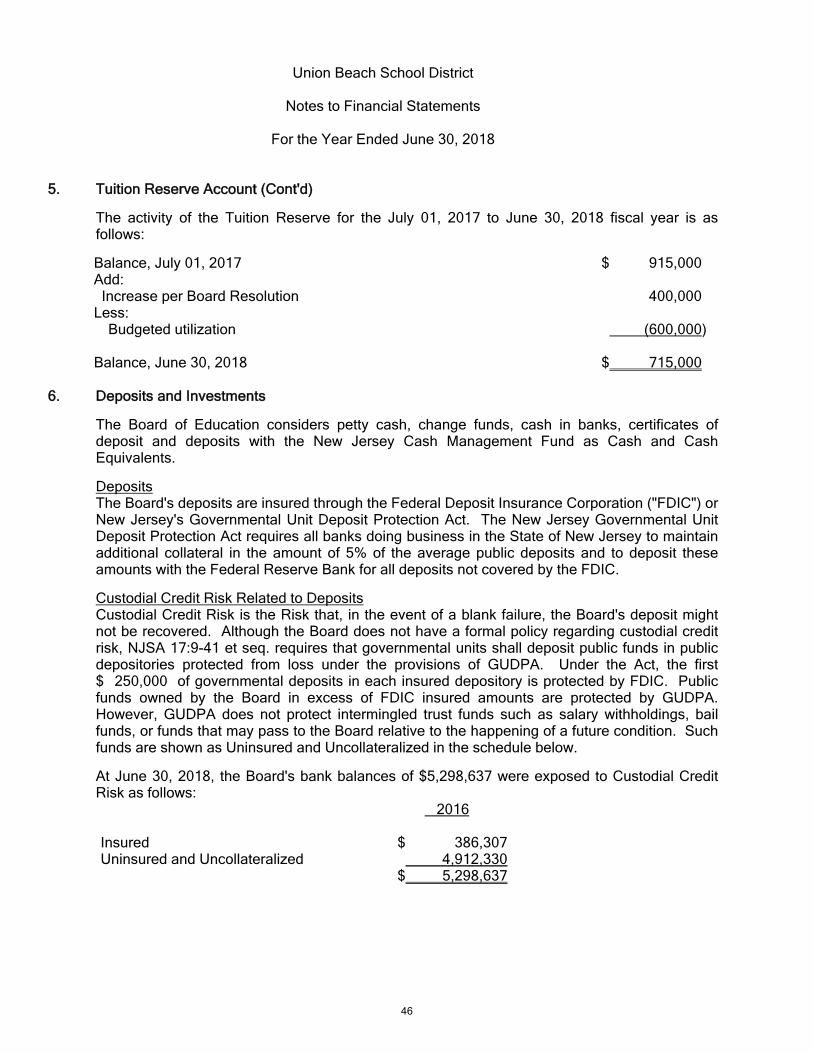
Union Beach School District
Notes to Financial Statements
For the Year Ended June 30, 2018
5. Tuition Reserve Account (Cont'd)
The activity of the Tuition Reserve for the July 01, 2017 to June 30, 2018 fiscal year is asfollows:
Balance, July 01, 2017 $ 915,000Add: Increase per Board Resolution 400,000Less:
Budgeted utilization (600,000)
Balance, June 30, 2018 $ 715,000
6. Deposits and Investments
The Board of Education considers petty cash, change funds, cash in banks, certificates ofdeposit and deposits with the New Jersey Cash Management Fund as Cash and CashEquivalents.
DepositsThe Board's deposits are insured through the Federal Deposit Insurance Corporation ("FDIC") orNew Jersey's Governmental Unit Deposit Protection Act. The New Jersey Governmental UnitDeposit Protection Act requires all banks doing business in the State of New Jersey to maintainadditional collateral in the amount of 5% of the average public deposits and to deposit theseamounts with the Federal Reserve Bank for all deposits not covered by the FDIC.
Custodial Credit Risk Related to DepositsCustodial Credit Risk is the Risk that, in the event of a blank failure, the Board's deposit mightnot be recovered. Although the Board does not have a formal policy regarding custodial creditrisk, NJSA 17:9-41 et seq. requires that governmental units shall deposit public funds in publicdepositories protected from loss under the provisions of GUDPA. Under the Act, the first$ 250,000 of governmental deposits in each insured depository is protected by FDIC. Publicfunds owned by the Board in excess of FDIC insured amounts are protected by GUDPA.However, GUDPA does not protect intermingled trust funds such as salary withholdings, bailfunds, or funds that may pass to the Board relative to the happening of a future condition. Suchfunds are shown as Uninsured and Uncollateralized in the schedule below.
At June 30, 2018, the Board's bank balances of $5,298,637 were exposed to Custodial CreditRisk as follows:
2016
Insured $ 386,307Uninsured and Uncollateralized 4,912,330
$ 5,298,637
46

Union Beach School District
Notes to Financial Statements
For the Year Ended June 30, 2018
6. Deposits and Investments (Cont'd)
Investments
The Board is permitted to invest public funds in accordance with the types of securitiesauthorized by N.J.S.A. 18A:20-37. Examples of the allowable investments are bonds or otherobligations of the United States or obligations guaranteed by the United States of America,Government Money Market Mutual Funds, bonds or other obligations of the school district orbonds or other obligations of the local unit or units within which the school district is located,Local Government investment pools, and agreements or the repurchase of fully-collateralizedsecurities, if transacted in accordance with the above statute.
In order to maximize liquidity, the District utilized the New Jersey Cash Management Fund(“NJCMF”) as it sole investment. The NJCMF is administered by the New Jersey Department ofTreasury. It invests pooled monies from various State and non-State agencies in primarilyshort-term investments. These investments include: U.S. Treasuries, short-term CommercialPaper, U.S. Agency Bonds, Corporate Bonds, and investment rates. Monies can be freelyadded or withdrawn from the NJCMF on a daily basis without penalty.
As of June 30, 2018, the Board had the following investments:
Fair ValueAmount
Moody's Rating
S & P Rating
Investment TypeNew Jersey Cash Management Fund $136,307 AAA AAA
Interest Rate Risk
The District does not have a policy to limit interest rate risk. The average maturity of theDistrict’s sole investment, the NJCMF, is less than one year.
Credit Risk
State law limits investments as noted above (N.J.S.A. 18A:20-37). The District has aninvestment policy that further limits its investment choices.
Investment and interest earnings in the Capital Projects Fund are assigned to the General Fundin accordance with Board policy.
47
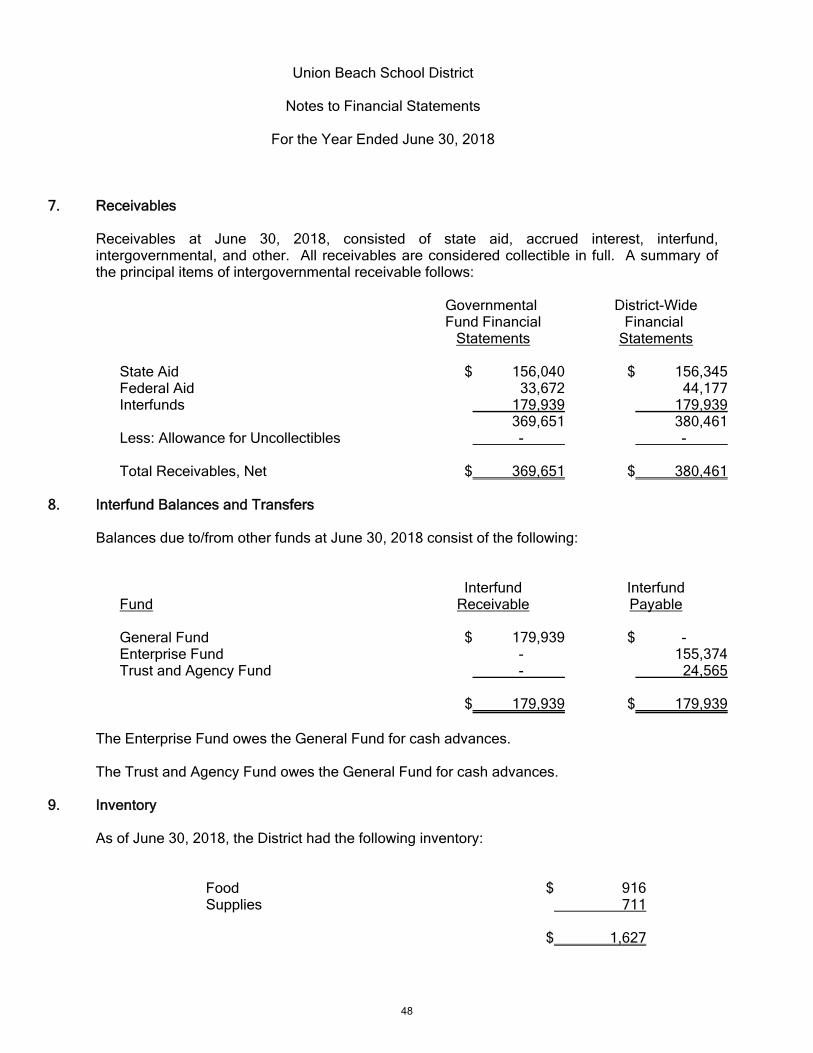
Union Beach School District
Notes to Financial Statements
For the Year Ended June 30, 2018
7. Receivables
Receivables at June 30, 2018, consisted of state aid, accrued interest, interfund,intergovernmental, and other. All receivables are considered collectible in full. A summary ofthe principal items of intergovernmental receivable follows:
Governmental Fund Financial
Statements
District-WideFinancial
Statements
State Aid $ 156,040 $ 156,345Federal Aid 33,672 44,177Interfunds 179,939 179,939
369,651 380,461Less: Allowance for Uncollectibles - -
Total Receivables, Net $ 369,651 $ 380,461
8. Interfund Balances and Transfers
Balances due to/from other funds at June 30, 2018 consist of the following:
FundInterfund
ReceivableInterfundPayable
General Fund $ 179,939 $ -Enterprise Fund - 155,374Trust and Agency Fund - 24,565
$ 179,939 $ 179,939
The Enterprise Fund owes the General Fund for cash advances.
The Trust and Agency Fund owes the General Fund for cash advances.
9. Inventory
As of June 30, 2018, the District had the following inventory:
Food $ 916Supplies 711
$ 1,627
48
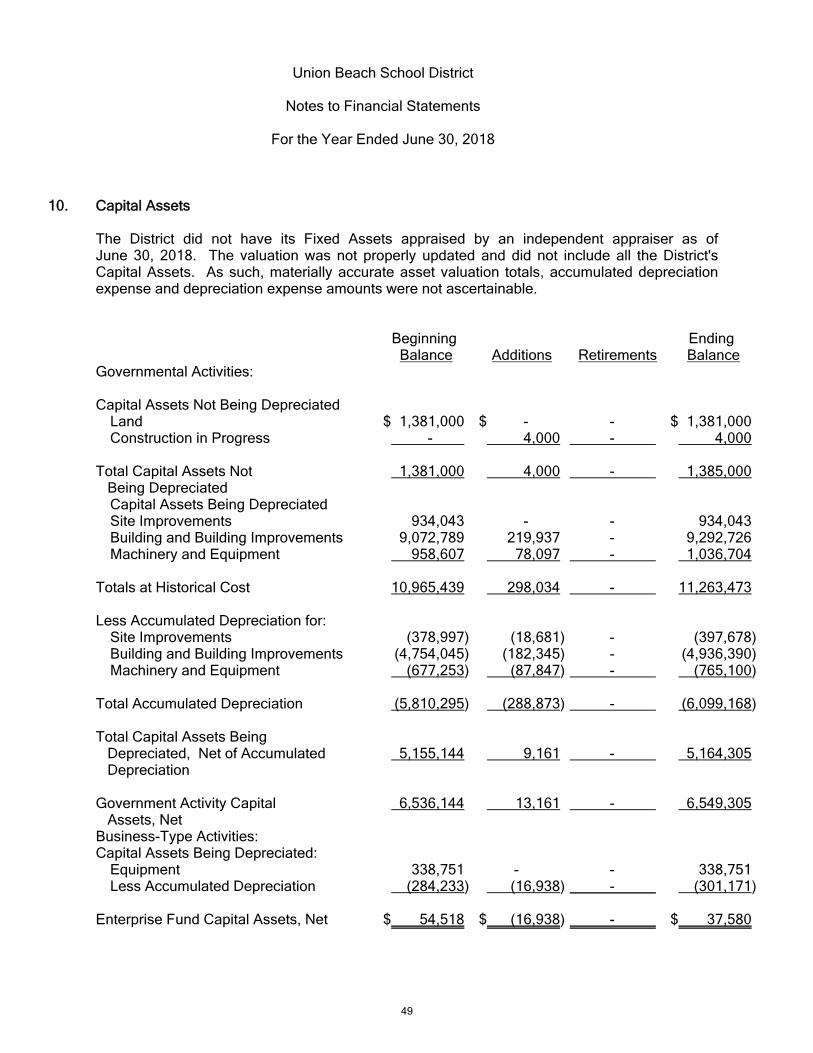
Union Beach School District
Notes to Financial Statements
For the Year Ended June 30, 2018
10. Capital Assets
The District did not have its Fixed Assets appraised by an independent appraiser as ofJune 30, 2018. The valuation was not properly updated and did not include all the District'sCapital Assets. As such, materially accurate asset valuation totals, accumulated depreciationexpense and depreciation expense amounts were not ascertainable.
Beginning Balance Additions Retirements
Ending Balance
Governmental Activities:
Capital Assets Not Being DepreciatedLand $ 1,381,000 $ - - $ 1,381,000Construction in Progress - 4,000 - 4,000
Total Capital Assets Not Being Depreciated
1,381,000 4,000 - 1,385,000
Capital Assets Being DepreciatedSite Improvements 934,043 - - 934,043Building and Building Improvements 9,072,789 219,937 - 9,292,726Machinery and Equipment 958,607 78,097 - 1,036,704
Totals at Historical Cost 10,965,439 298,034 - 11,263,473
Less Accumulated Depreciation for:Site Improvements (378,997) (18,681) - (397,678)Building and Building Improvements (4,754,045) (182,345) - (4,936,390)Machinery and Equipment (677,253) (87,847) - (765,100)
Total Accumulated Depreciation (5,810,295) (288,873) - (6,099,168)
Total Capital Assets Being Depreciated, Net of Accumulated Depreciation
5,155,144 9,161 - 5,164,305
Government Activity Capital Assets, Net
6,536,144 13,161 - 6,549,305
Business-Type Activities:Capital Assets Being Depreciated:
Equipment 338,751 - - 338,751Less Accumulated Depreciation (284,233) (16,938) - (301,171)
Enterprise Fund Capital Assets, Net $ 54,518 $ (16,938) - $ 37,580
49
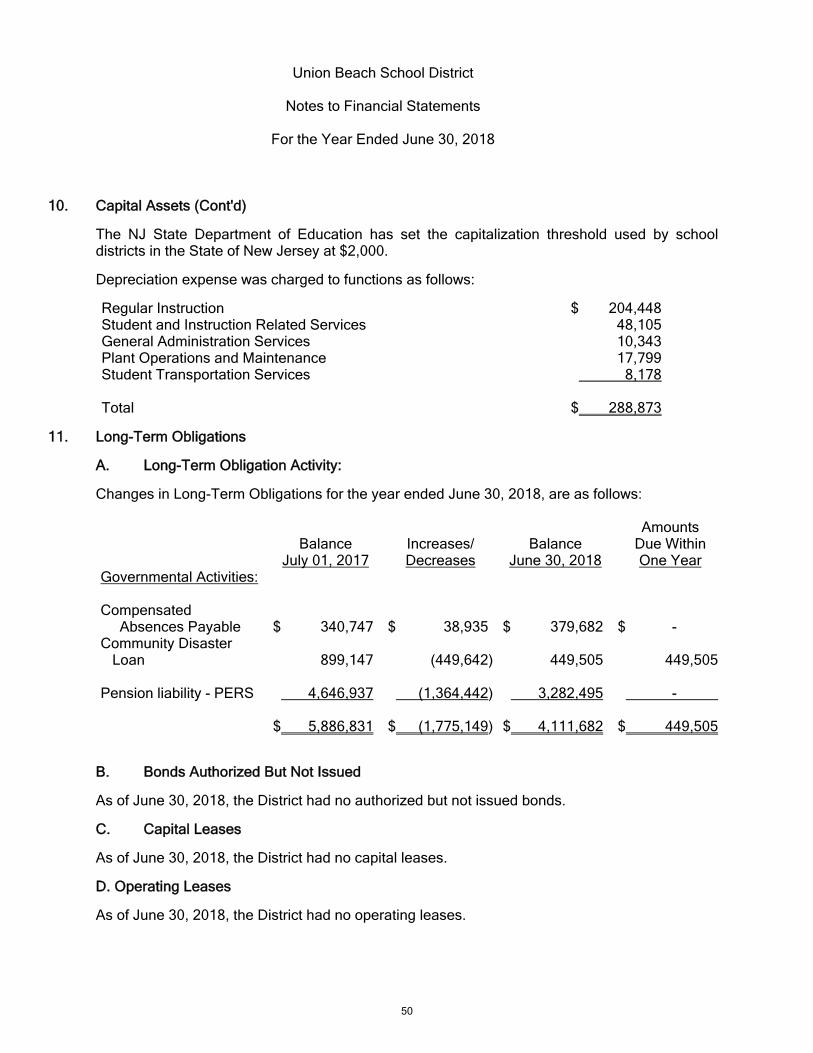
Union Beach School District
Notes to Financial Statements
For the Year Ended June 30, 2018
10. Capital Assets (Cont'd)
The NJ State Department of Education has set the capitalization threshold used by schooldistricts in the State of New Jersey at $2,000.
Depreciation expense was charged to functions as follows:
Regular Instruction $ 204,448Student and Instruction Related Services 48,105General Administration Services 10,343Plant Operations and Maintenance 17,799Student Transportation Services 8,178
Total $ 288,873
11. Long-Term Obligations
A. Long-Term Obligation Activity:
Changes in Long-Term Obligations for the year ended June 30, 2018, are as follows:
BalanceJuly 01, 2017
Increases/Decreases
BalanceJune 30, 2018
AmountsDue WithinOne Year
Governmental Activities:
CompensatedAbsences Payable $ 340,747 $ 38,935 $ 379,682 $ -
Community Disaster Loan 899,147 (449,642) 449,505 449,505
Pension liability - PERS 4,646,937 (1,364,442) 3,282,495 -
$ 5,886,831 $ (1,775,149) $ 4,111,682 $ 449,505
B. Bonds Authorized But Not Issued
As of June 30, 2018, the District had no authorized but not issued bonds.
C. Capital Leases
As of June 30, 2018, the District had no capital leases.
D. Operating Leases
As of June 30, 2018, the District had no operating leases.
50

Union Beach School District
Notes to Financial Statements
For the Year Ended June 30, 2018
12. FEMA Community Disaster Loan (CDL)
The school district applied for and received a CDL in response to the devastating effects on theproperty tax ratable base of the municipality due to Superstorm Sandy in October 2012. Thedistrict was approved for $4,158,107 total loan and chose to withdraw $899,147 as a reductionof the tax levy assessed for the 2013-2014 school year. The amount of principal and interestaccrued through June 30, 2018 is $449,505 and 1964, respectively which is due and payable inJuly 2018.
13. Pension Plans
A. Public Employees' Retirement System (PERS)
Plan Description - The State of New Jersey, Public Employees' Retirement System (PERS) is acost-sharing multiple-employer defined benefit pension plan administered by the State of NewJersey, Division of Pensions and Benefits (the Division). For additional information about PERS,please refer to Division's Comprehensive Annual Financial Report (CAFR) which can be foundat www.state.nj.us/treasury/pensions/financial-reports.shtml.
The vesting and benefit provisions are set by N.J.S.A. 43:15A. PERS provides retirement,death and disability benefits. All benefits vest after ten years of service, except for medicalbenefits, which vest after 25 years of service or under the disability provisions of PERS.
The following represents the membership tiers for PERS:
Tier Definition 1 Members who were enrolled prior to July 1, 2007 2 Members who were eligible to enroll on or after July 1, 2007 and prior to
November 2, 2008 3 Members who were eligible to enroll on or after November 2, 2008 and prior to
May 22, 2010 4 Members who were eligible to enroll on or after May 22, 2010 and prior to
June 28, 2011 5 Members who were eligible to enroll on or after June 28, 2011
51

Union Beach School District
Notes to Financial Statements
For the Year Ended June 30, 2018
13. Pension Plans (cont'd)
A. Public Employees' Retirement System (PERS) (cont'd)
Service retirement benefits of 1/55th of final average salary for each year of service credit isavailable to tiers 1 and 2 members upon reaching age 60 and to tier 3 members upon reachingage 62. Service retirement benefits of 1/60th of final average salary for each year of servicecredit is available to tier 4 members upon reaching age 62 and tier 5 members upon reachingage 65. Early retirement benefits are available to tiers 1 and 2 members before reaching age60, tiers 3 and 4 before age 62 with 25 or more years of service credit and tier 5 with 30 or moreyears of service credit before age 65. Benefits are reduced by a fraction of a percent for eachmonth that a member retires prior to the age at which a member can receive full early retirementbenefits in accordance with their respective tier. Tier 1 members can receive an unreducedbenefit from age 55 to age 60 if they have at least 25 years of service. Deferred retirement isavailable to members who have at least 10 years of service credit and have not reached theservice retirement age for the respective tier.
Contributions - The contribution policy for PERS is set by N.J.S.A. 15A and requirescontributions by active members and contributing employers. State legislation has modified theamount that is contributed by the State. The State's pension contribution is based on anactuarially determined amount which includes the employer portion of the normal cost and anamortization of the unfunded accrued liability. Funding for noncontributory group insurancebenefits is based on actual claims paid. For fiscal year 2017, the State's pension contributionwas less than the actuarial determined amount.
The local employers' contribution amounts are based on an actuarially determined rate, whichincludes the normal cost and unfunded accrued liability. Chapter 19, P.L. 2009 provided anoption for local employers of PERS to contribute 50% of the normal and accrued liabilitycontribution amounts certified for payments due in State fiscal year 2009. Such employers willbe credited with the full payment and such amounts will not be included in their unfundedliability. The actuaries will determine the unfunded liability of those retirement systems, byemployer, for the reduced normal and accrued liability contributions provided under this law.This unfunded liability will be paid by the employer in level annual payments over a period of 15years beginning with the payments due in the fiscal year ended June 30, 2012 and will beadjusted by the rate of return on the actuarial value of assets.
Pension Liability, Pension Expense and Deferred Outlows/Inflows of Resources - AtJune 30, 2018, the School District reported a liability of $3,282,495 for its proportionate share ofthe PERS net pension liability. The net pension liability was measured as of June 30, 2017.The total pension liability used to calculate the net pension liability was determined using updateprocedure to roll forward the total pension liability from an actuarial valuation as of July 1, 2016,to the measurement date of June 30, 2017. The School District's proportion of the net pensionliability was based on the School District's actual contributions to the plan relative to the total ofall participating employers' contributions for the year ended June 30, 2017. The School District'sproportion measured as of June 30, 2017, was .0141010318%, which was a decrease of.0015889998% from its proportion measured as of June 30, 2016.
52

Union Beach School District
Notes to Financial Statements
For the Year Ended June 30, 2018
13. Pension Plans (cont'd)
A. Public Employees' Retirement System (PERS) (cont'd)
For the year ended June 30, 2018, the School District recognized full accrual pension expenseof $(52,526) in the government-wide financial statements. This pension expense was based onthe pension plans June 30, 2017 measurement date. At June 30, 2017, the School Districtreported deferred outflows of resources and deferred inflows of resources related to PERS fromthe following sources:
DeferredOutflows ofResources
DeferredInflows of
ResourcesDifferences between expected and actual experience $ 77,291 $ -Changes of assumptions 661,310 658,885Net difference between projected and actual earnings on pension plan investments 22,352 -Changes in proportion and differences between District contributions and proportionate share of contributions - 552,537District contributions subsequent to the measurement date 146,596 -
Total $ 907,549 $ 1,211,422
$146,596 reported as deferred outflows of resources resulting from school district contributionssubsequent to the measurement date is estimated based on unadjusted 2017-2018 totalsalaries for PERS employees multiplied by an employer contribution rate. The payable is dueon April 1, 2019 and will be recognized as a reduction of the net pension liability in the yearended June 30, 2019. The other amounts reported as deferred outflows of resources anddeferred inflows of resources related to pensions will be recognized in pension expense asfollows:
Year ended June 30:2018 $ (341,041)2019 (514,639)2020 (311,845)2021 414,7552022 302,301Thereafter -Total $ (450,469)
53
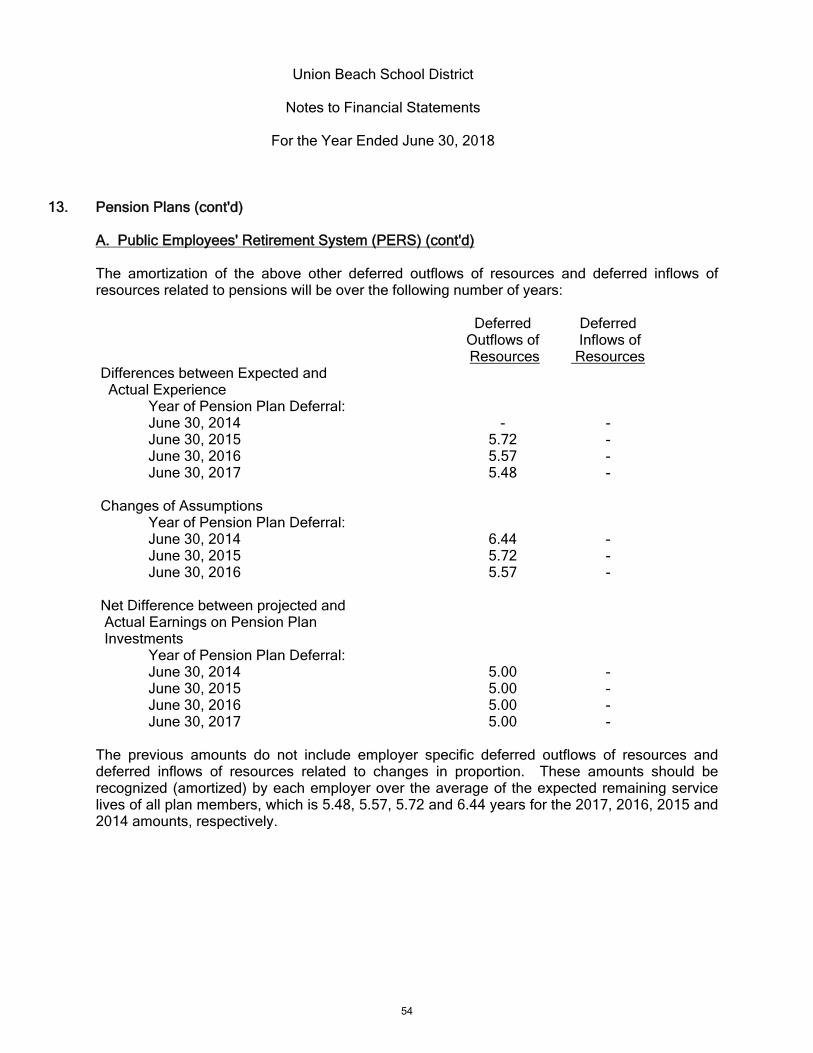
Union Beach School District
Notes to Financial Statements
For the Year Ended June 30, 2018
13. Pension Plans (cont'd)
A. Public Employees' Retirement System (PERS) (cont'd)
The amortization of the above other deferred outflows of resources and deferred inflows ofresources related to pensions will be over the following number of years:
DeferredOutflows ofResources
Deferred Inflows of
ResourcesDifferences between Expected and Actual Experience
Year of Pension Plan Deferral:June 30, 2014 - -June 30, 2015 5.72 -June 30, 2016 5.57 -June 30, 2017 5.48 -
Changes of AssumptionsYear of Pension Plan Deferral:June 30, 2014 6.44 -June 30, 2015 5.72 -June 30, 2016 5.57 -
Net Difference between projected and Actual Earnings on Pension Plan Investments
Year of Pension Plan Deferral:June 30, 2014 5.00 -June 30, 2015 5.00 -June 30, 2016 5.00 -June 30, 2017 5.00 -
The previous amounts do not include employer specific deferred outflows of resources anddeferred inflows of resources related to changes in proportion. These amounts should berecognized (amortized) by each employer over the average of the expected remaining servicelives of all plan members, which is 5.48, 5.57, 5.72 and 6.44 years for the 2017, 2016, 2015 and2014 amounts, respectively.
54
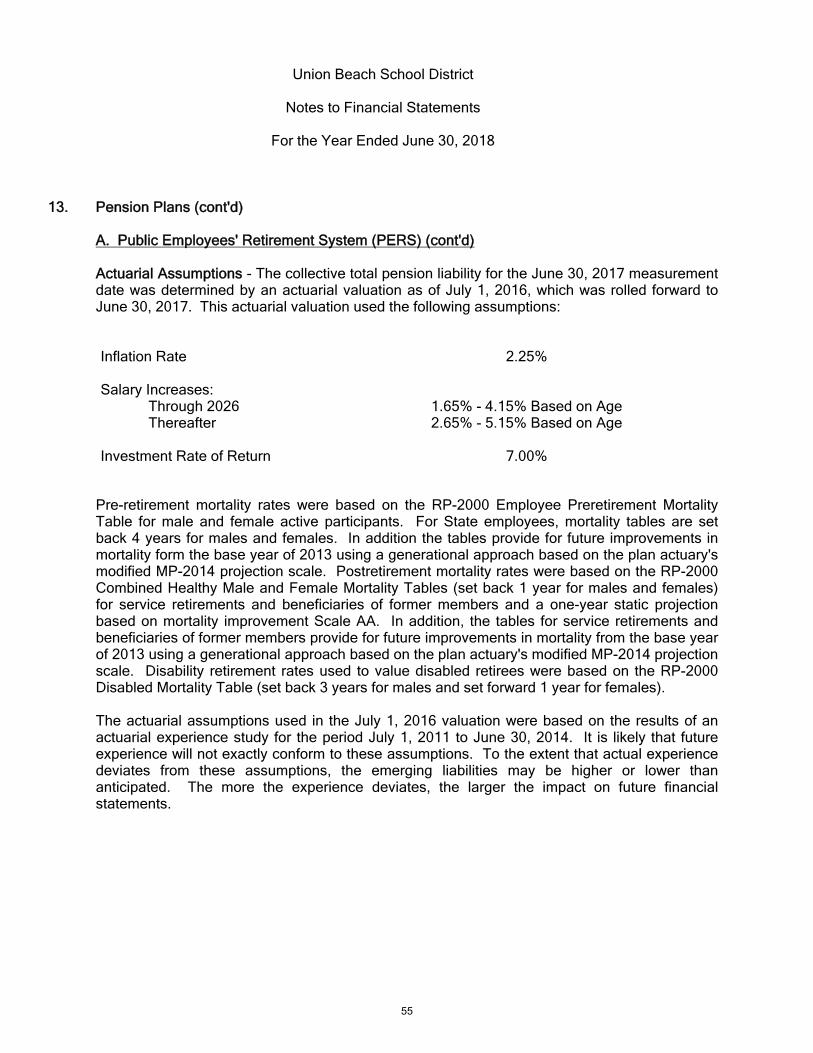
Union Beach School District
Notes to Financial Statements
For the Year Ended June 30, 2018
13. Pension Plans (cont'd)
A. Public Employees' Retirement System (PERS) (cont'd)
Actuarial Assumptions - The collective total pension liability for the June 30, 2017 measurementdate was determined by an actuarial valuation as of July 1, 2016, which was rolled forward toJune 30, 2017. This actuarial valuation used the following assumptions:
Inflation Rate 2.25%
Salary Increases:Through 2026 1.65% - 4.15% Based on AgeThereafter 2.65% - 5.15% Based on Age
Investment Rate of Return 7.00%
Pre-retirement mortality rates were based on the RP-2000 Employee Preretirement MortalityTable for male and female active participants. For State employees, mortality tables are setback 4 years for males and females. In addition the tables provide for future improvements inmortality form the base year of 2013 using a generational approach based on the plan actuary'smodified MP-2014 projection scale. Postretirement mortality rates were based on the RP-2000Combined Healthy Male and Female Mortality Tables (set back 1 year for males and females)for service retirements and beneficiaries of former members and a one-year static projectionbased on mortality improvement Scale AA. In addition, the tables for service retirements andbeneficiaries of former members provide for future improvements in mortality from the base yearof 2013 using a generational approach based on the plan actuary's modified MP-2014 projectionscale. Disability retirement rates used to value disabled retirees were based on the RP-2000Disabled Mortality Table (set back 3 years for males and set forward 1 year for females).
The actuarial assumptions used in the July 1, 2016 valuation were based on the results of anactuarial experience study for the period July 1, 2011 to June 30, 2014. It is likely that futureexperience will not exactly conform to these assumptions. To the extent that actual experiencedeviates from these assumptions, the emerging liabilities may be higher or lower thananticipated. The more the experience deviates, the larger the impact on future financialstatements.
55

Union Beach School District
Notes to Financial Statements
For the Year Ended June 30, 2018
13. Pension Plans (cont'd)
A. Public Employees' Retirement System (PERS) (cont'd)
In accordance with State statute, the long-term expected rate of return on plan investments(7.00% at June 30, 2017) is determined by the State Treasurer, after consultation with theDirectors of the Division of Investments and Division of Pensions and Benefits, the board oftrustees and the actuaries. The long-term expected rate of return was determined using abuilding block method in which best-estimate ranged of expected future real rates of return(expected returns, net of pension plan investment expense and inflation) are developed for eachmajor asset class. These ranges are combined to produce the long-term expected rate of returnby weighting the expected future real rates of return by the target asset allocation percentageand by adding expected inflation. Best estimates of arithmetic real rates of return for eachmajor asset class included in PERS's target asset allocation as of June 30, 2017 aresummarized in the following table:
Asset ClassTarget
Allocation
Long-TermExpected Real
Rate ofReturn
Absolute Return/Risk Mitigation 5.00 % 5.51 %Cash Equivalents 5.50 % 1.00 %U.S. Treasuries 3.00 % 1.87 %Investment Grade Credit 10.00 % 3.78 %Public High Yield 2.50 % 6.82 %Global Diversified Credit 5.00 % 7.10 %Credit Oriented Hedge Funds 1.00 % 6.60 %Debt Related Private Equity 2.00 % 10.63 %Debt Related Real Estate 1.00 % 6.61 %Private Real Asset 2.50 % 11.83 %Equity Related Real Estate 6.25 % 9.23 %U.S. Equity 30.00 % 8.19 %Non-U.S. Developed Markets Equity 11.50 % 9.00 %Emerging Markets Equity 6.50 % 11.64 %Buyouts/Venture Capital 8.25 % 13.08 %
56

Union Beach School District
Notes to Financial Statements
For the Year Ended June 30, 2018
13. Pension Plans (cont'd)
A. Public Employees' Retirement System (PERS) (cont'd)
Discount Rate
The discount rate used to measure the total pension liability was 5.00% as of June 30, 2017.This single blended discount rate was based on the long-term expected rate of return onpension plan investments of 7.00%, and a municipal bond rate of 3.58% as of June 30, 2017,based on Bond Buyer Go 20-Bond Municipal Bond Index which includes tax-exempt generalobligation municipal bonds with an average rating of AA/Aa or higher. The projection of cashflows used to determine the discount rate assumed that contributions from plan members will bemade at the current member contribution rates and that contributions from employers will bemade based on the contribution rate in the most recent fiscal year. State employer contributed40% of the actuarially determined contributions and the local employers contributed 100% oftheir actuarially determined contributions. Based on those assumptions, the plan's fiduciary netposition was projected to be available to make projected future benefit payments of current planmembers through 2040. Therefore, the long-term expected rate of return on plan investmentswas applied to projected benefit payments through 2040, and the municipal bond rate wasapplied to projected benefit payments after that date in determining the total pension liability.
Sensitivity of the Collective Net Pension Liability to Changes in the Discount Rate
The following presents the collective net pension liability of the participating employers as ofJune 30, 2017 calculated using the discount rate as disclosed above as well as what thecollective net pension liability would be if it was calculated using a discount rate that is 1-percentage-point lower or 1-percentage-point higher than the current rate:
1%Decrease(4.00%)
CurrentDiscount Rate
(5.00%)
1%Increase(6.00%)
District's proportionate share of the netpension liability 4,072,158 3,282,495 2,624,608
Additional Information - The following is a summary of the collective balances of the local groupat June 30, 2018 and 2017:
6/30/18 6/30/17Collective Deferred Outflows of Resources 723,829,861 7,815,204,785Collective Deferred Inflows of Resources - -Collective Net Pension Liability 23,278,401,588 29,617,131,759
School District's Portion .0141010318% .0156900316%
57

Union Beach School District
Notes to Financial Statements
For the Year Ended June 30, 2018
13. Pension Plans (cont'd)
B. Teachers' Pension and Annuity (TPAF)
Plan Description - The State of New Jersey, Teachers' Pension and Annuity Fund (TPAF) is acost sharing multiple-employer defined benefit plan with a special-funding situation, by which aState of New Jersey (the State) is responsible to fund 100% of the employer contributions,excluding any local employer early retirement incentive (ERI) contributions. TPAF isadministered by the State of New Jersey, Division of Pensions and Benefits (the Division). Foradditional information about TPAF, please refer to Division's Comprehensive Annual FinancialReport (CAFR) which can be found at www.state.nj.us/treasury/pensions/financial-reports.shtml.
The vesting and benefit provisions are set by N.J.S.A 18A:66. TPAF provides retirement, death,and disability benefits. All benefits vest after ten years of service, except for medical benefits,which vest after 25 years of service or under the disability provisions of TPAF. Members arealways fully vested for their own contributions and, after three years of service credit, becomevested for 2% of related interest earned on the contributions. In the case of death beforeretirement, members' beneficiaries are entitled to full interest credited to the members' accounts.
The following represents the membership tiers for TPAF:
Tier Definition 1 Members who were enrolled prior to July 1, 2007 2 Members who were eligible to enroll on or after July 1, 2007 and prior to
November 2, 2008 3 Members who were eligible to enroll on or after November 2, 2008 and prior to
May 22, 2010 4 Members who were eligible to enroll on or after May 22, 2010 and prior to
June 28, 2011 5 Members who were eligible to enroll on or after June 28, 2011
Service retirement benefits of 1/55th of final average salary for each year of service credit isavailable to tiers 1 and 2 members upon reaching age 60 and to tier 3 members upon reachingage 62. Service retirement benefits of 1/60th of final average salary for each year of servicecredit is available to tier 4 members upon reaching age 62 and tier 5 members upon reachingage 65. Early retirement benefits are available to tiers 1 and 2 members before reaching age60, tiers 3 and 4 before age 62 with 25 or more years of service credit and tier 5 with 30 or moreyears of service credit before age 65. Benefits are reduced by a fraction of a percent for eachmonth that a member retires prior to the age at which a member can receive full early retirementbenefits in accordance with their respective tier. Tier 1 members can receive an unreducedbenefit from age 55 to age 60 if they have at least 25 years of service. Deferred retirement isavailable to members who have at least 10 years of service credit and have not reached theservice retirement age for the respective tier.
58

Union Beach School District
Notes to Financial Statements
For the Year Ended June 30, 2018
13. Pension Plans (cont'd)
B. Teachers' Pension and Annuity (TPAF) (cont'd)
Contributions - The contribution policy for TPAF is set by N.J.S.A. 18A:66 and requirescontributions by active members and contributing employers. State legislation has modified theamount that is contributed by the State. The State's pension contribution is based on anactuarially determined amount, which includes the employer portion of the normal cost and anamortization of the unfunded accrued liability. Funding for noncontributory group insurancebenefits is based on actual claims paid. For fiscal year 2017, the State's pension contributionwas less than the actuarial determined amount.
As mentioned previously, the employer contributions for local participating employers are legallyrequired to be funded by the State in accordance with N.J.S.A. 18A:66-33. Therefore, theSchool District is considered to be in a special funding situation as defined by GASB StatementNo. 68 and the State is treated as a nonemployer contributing entity. Since the School Districtdoes not contribute directly to the plan (except for employer specific financed amounts), there isno net pension liability or deferred outflows or inflows to report in the financial statements of theSchool District.
Pension Liability and Pension Expense - The State's proportionate share of the TPAF netpension liability, attributable to the School District as of June 30, 2017 was $25,993,219. TheSchool District's proportionate share was $0.The net pension liability was measured as of June 30, 2016, and the total pension liability usedto calculate the net pension liability was determined by an actuarial valuation as of July 1, 2016,which was rolled forward to June 30, 2017. The State's proportionate share of the net pensionliability associated with the District was based on projection of the State's long-termcontributions to the pension plan associated with the District relative to the projectedcontributions by the State associated with all participating school districts, actuariallydetermined. At June 30, 2017, the State proportionate share of the TPAF net pension liabilityattributable to the School District was .0385521044%, which was a decrease of .0013980688%from its proportion measured as of June 30, 2016.
For the fiscal year ended June 30, 2018, the State of New Jersey recognized a pension expensein the amount of $591,455 for the State's proportionate share of the TPAF pension expenseattributable to the School District. This pension expense was based on the pension plans June30, 2017 measurement date.
59
Union Beach School District
Notes to Financial Statements
For the Year Ended June 30, 2018
13. Pension Plans (cont'd)
B. Teachers' Pension and Annuity (TPAF) (cont'd)
Actuarial Assumptions - The collective total pension liability for the June 30, 2017 measurementdate was determined by an actuarial valuation as of July 1, 2016, which was rolled forward toJune 30, 2017. This actuarial valuation used the following assumptions, applied to all periods inthe measurement:
Inflation Rate 2.25%
Salary Increases:2012-2021 Varies Based on ExperienceThereafter Varies Based on Experience
Investment Rate of Return 7.00%
Pre-retirement, post-retirement and disabled mortality rates were based on the experience ofTPAF members reflecting mortality improvement on a generational basis based on a 60-yearaverage of Social Security data from 1953 to 2013.
The actuarial assumptions used in the July 1, 2016 valuation were based on the results of anactuarial experience study for the period July 1, 2012 to June 30, 2015.
Long-term Expected Rate of Return - In accordance with State statute, the long-term expectedrate of return on plan investments (7.00% at June 30, 2017) is determined by the StateTreasurer, after consultation with the Directors of the Division of Investments and Division ofPensions and Benefits, the board of trustees and the actuaries. The long-term expected rate ofreturn was determined using a building block method in which best-estimate ranged of expectedfuture real rates of return (expected returns, net of pension plan investment expense andinflation) are developed for each major asset class. These ranges are combined to produce thelong-term expected rate of return by weighting the expected future real rates of return by thetarget asset allocation percentage and by adding expected inflation. Best estimates ofarithmetic real rates of return for each major asset class included in TPAF's target assetallocation as of June 30, 2017 are summarized in the following table:
60
Union Beach School District
Notes to Financial Statements
For the Year Ended June 30, 2018
13. Pension Plans (cont'd)
B. Teachers' Pension and Annuity (TPAF) (cont'd)
Asset ClassTarget
Allocation
Long-TermExpected Real
Rate ofReturn
Absolute Return/Risk Mitigation 5.00 % 5.51 %Cash Equivalents 5.50 % 1.00 %U.S. Treasuries 3.00 % 1.87 %Investment Grade Credit 10.00 % 3.78 %Public High Yield 2.50 % 6.82 %Global Diversified Credit 5.00 % 7.10 %Credit Oriented Hedge Funds 1.00 % 6.60 %Debt Related Private Equity 2.00 % 10.63 %Debt Related Real Estate 1.00 % 6.61 %Private Real Asset 2.50 % 11.83 %Equity Related Real Estate 6.25 % 9.23 %U.S. Equity 30.00 % 8.19 %Non-U.S. Developed Markets Equity 11.50 % 9.00 %Emerging Markets Equity 6.50 % 11.64 %Buyouts/Venture Capital 8.25 % 13.08 %
Discount Rate - The discount rate used to measure the total pension liability was 4.25% as ofJune 30, 2017. This single blended discount rate was based on the long-term expected rate ofreturn on pension plan investments of 7.00%, and a municipal bond rate of 3.58% as of June 30,2017, based on Bond Buyer Go 20-Bond Municipal Bond Index which includes tax-exemptgeneral obligation municipal bonds with an average rating of AA/Aa or higher. The projection ofcash flows used to determine the discount rate assumed that contributions from plan memberswill be made at the current member contribution rates and that contributions from employers willbe made based on the contribution rate in the most recent fiscal year. State employercontributed 40% of the actuarially determined contributions and the local employers contributed100% of their actuarially determined contributions. Based on those assumptions, the plan'sfiduciary net position was projected to be available to make projected future benefit payments ofcurrent plan members through 2036. Therefore, the long-term expected rate of return on planinvestments was applied to projected benefit payments through 2036, and the municipal bondrate was applied to projected benefit payments after that date in determining the total pensionliability.
61
Union Beach School District
Notes to Financial Statements
For the Year Ended June 30, 2018
13. Pension Plans (cont'd)
B. Teachers' Pension and Annuity (TPAF) (cont'd)
Sensitivity of the Collective Net Pension Liability to Changes in the Discount Rate
The following presents the collective net pension liability of the participating employers as ofJune 30, 2017 calculated using the discount rate as disclosed above as well as what thecollective net pension liability would be if it was calculated using a discount rate that is 1-percentage-point lower or 1-percentage-point higher than the current rate:
1%Decrease(3.25%)
CurrentDiscount Rate
(4.25%)
1%Increase(5.25%)
District's proportionate share of the netpension liability 30,993,706 25,993,219 22,047,186
Pension Plan Fiduciary Net Position - For purposes of measuring the net pension liability,deferred outflows of resources and deferred inflows of resources related to pensions, andpension expense, information about the fiduciary net position of the Teachers Pension andAnnuity Fund (TPAF) and additions to/deductions from the TPAF's fiduciary net position havebeen determined on the same basis as they are reported by the TPAF. For this purpose, benefitpayments (including refunds of employee contributions) are recognized when due and payablein accordance with the benefit terms. Investments are reported at fair value.
Defined Contribution Retirement Plan (DCRP)
The Defined Contribution Retirement Plan is a cost-sharing multiple-employer definedcontribution pension plan which was established on July 1, 2007, under the provisions ofChapter 92, P.L. 2007 and Chapter 103, P.L. 2007 (N.J.S.A.43:15C-1 et. seq), and expandedunder the provisions of Chapter 89, P.L. 2008 and Chapter 1, P.L. 2010. The DefinedContribution Retirement Program Board oversees the DCRP, which is administered for theDivisions of Pensions and Benefits by Prudential Financial. The DCRP provides eligiblemembers, and their beneficiaries, with tax-sheltered, defined contribution retirement benefit,along with life insurance and disability coverage. Vesting and benefit provisions are establishedby N.J.S.A.43:15C-1 et. seq.
The contribution requirements of plan members are determined by State statute. In accordancewith Chapter 92, P.L. 2007 and Chapter 103, P.L. 2007, plan members are required tocontribute 5.5% of their annual covered salary. In addition to the employee contributions, theSchool District’s contribution amounts for each pay period are transmitted to Prudential not laterthan the fifth business day after the date on which the employee is paid for that pay period.
62

Union Beach School District
Notes to Financial Statements
For the Year Ended June 30, 2018
13. Pension Plans (Cont'd)
Defined Contribution Retirement Plan (DCRP) (cont'd)
The District’s contributions to the DCRP for June 30, 2018 were $3,200. There was no liabilityfor unpaid contributions at June 30, 2018.
Related Party Investments – The Division of Pensions and Benefits does not invest in securitiesissued by the School District.
14. Post-Retirement Benefits
General Information about the OPEB Plan
Plan description and benefits provided
P.L. 1987, c. 384 and P.L. 1990, c.6 required Teachers' Pensions and Annuity Fund (TPAF) andthe Public Employees' Retirement System (PERS), respectively, to fund post-retirement medicalmedical benefits for those State employees who retire after accumulating 25 years of creditedservice or on a disability retirement. P.L. 2007, c.103 amended the law to eliminate the fundingof post-retirement medical benefits through the TPAF and PERS. It created separate fundsoutside of the pension plans for the funding and payment of post-retirement medical benefits forretired state employees and retired educational employees. The cost of these benefits is fundedthrough contributions by the State in accordance with, P.L. 1994 c. 62. Funding of post-retirement medical benefits changed from a pre-funding basis to a pay-as-you-go basisbeginning in fiscal year 1994.
The State is also responsible for the cost attributable to P.L. 1992, c.126 which providesemployer paid health benefits to members of PERS and the Alternate Benefit Program whoretired from a board of education or county college with 25 years of service.(GASB Cod. Sec. 2300.106(g)
The School Employees Health Benefits Program (SEHBP) Act is found in New Jersey StatutesAnnotated, Title 52, Article 17.25 et. seq. Rules governing the operation and administration ofthe program are found in Title 17, Chapter 9 of the New Jersey Administrative Code.
No assets are accumulated in a trust that meets the criteria in paragraph 4 of GASB 75.
63
Union Beach School District
Notes to Financial Statements
For the Year Ended June 30, 2018
14. Post-Retirement Benefits (cont'd)
Employees covered by benefit terms
At June 30, 2016, the following employees were covered by the benefit terms:
Inactive plan members or beneficiaries currently receiving benefit payments 142,331
Active plan members 223,747
Total 366,078
Total Nonemployer OPEB Liability
The State, a nonemployer contributing entity, is the only entity that has a legal obligation tomake employer contributions to OPEB for qualified returned PERS and TPAF participants. TheLEA's proportionate share percentage determined under paragraphs 193 and 203 through 205of GASB 75 is zero percent. Accordingly, the LEA did not recognize any portion of the collectivenet OPEB liability on the Statement of Net Position. Accordingly, the following OPEB liabilitynote information is reported at the State's level and is not specific to the board of education.Note that actual numbers will be published in the NJ State's CAFR(https://www.nj.gov/treasury/omb/publications/archives.shtml).
Actuarial assumptions and other imputes
The total OPEB liability in the June 30, 2017 actuarial valuation reported by the State in theState's most recently issued CAFR was determined using the following actuarial assumptionsand other inputs, applied to all periods included in the measurement, unless otherwise specified:
Inflation Rate 2.5%Salary Increases through 2026 PERS 2.15%-4.15%
PFRS 2.1%-8.98%TPAF 1.55%-4.55%
Salary Increases after 2026 PERS 3.15%-5.15%PFRS 3.1%-9.98%TPAF 2.0%-5.45%
Discount Rate 3.58%Healthcare Cost Trend Rates 4.5%-5.9%Retirees' Share of Benefit Related Costs 1.5% of projected health insurance
premiums for retirees
64

Union Beach School District
Notes to Financial Statements
For the Year Ended June 30, 2018
14. Post-Retirement Benefits (cont'd)
Preretirement mortality rates were based on the RP-2014 Headcount-weighted HealthyEmployee Male/Female Mortality Table with Fully Generational Mortality Improvementprojections from the central year using Scale MP-2017. Postretirement mortality rates werebased on the RP-2014 Headcount-weighted Health Annuitant Male/Female mortality table withfully generational improvement projections from the central year using the MP-2017 scale. Thedisabled mortality was based on the RP-2014 Headcount-weighted Male/Female mortality tablewith fully generational improvement projects from the central year using the MP-2017 scale.
The actuarial assumptions used in the June 30, 2016 valuation were based on the results of anactuarial experience study for PERS-June 30, 2014; TPAF-June 30, 2015 and PFRS-June 30,2013.
Changes in the Total OPEB Liability reported by the State of New Jersey
Balance at June 30, 2016 $ 57,831,784,184
Changes for the year:Service cost 2,391,878,884Interest on the total OPEB liability 1,699,441,736Changes in assumptions (7,086,599,129)Gross benefit payments by the state (1,242,412,566)Contributions from members 45,748,749
Net changes (4,191,942,326)
Balance at June 30, 2017 $ 53,639,841,858
Discount rate
The discount rate was 2.85% percent in 2016 and 3.58% percent in 2017. This represents themunicipal bond rate chosen by the State of New Jersey Division of Pension and Benefits. Thesource is the Bond Buyer Go 20-Bond municipal bond index, which includes tax-exempt generalobligation municipal bonds with an average rating of AA/Aa or higher.
65
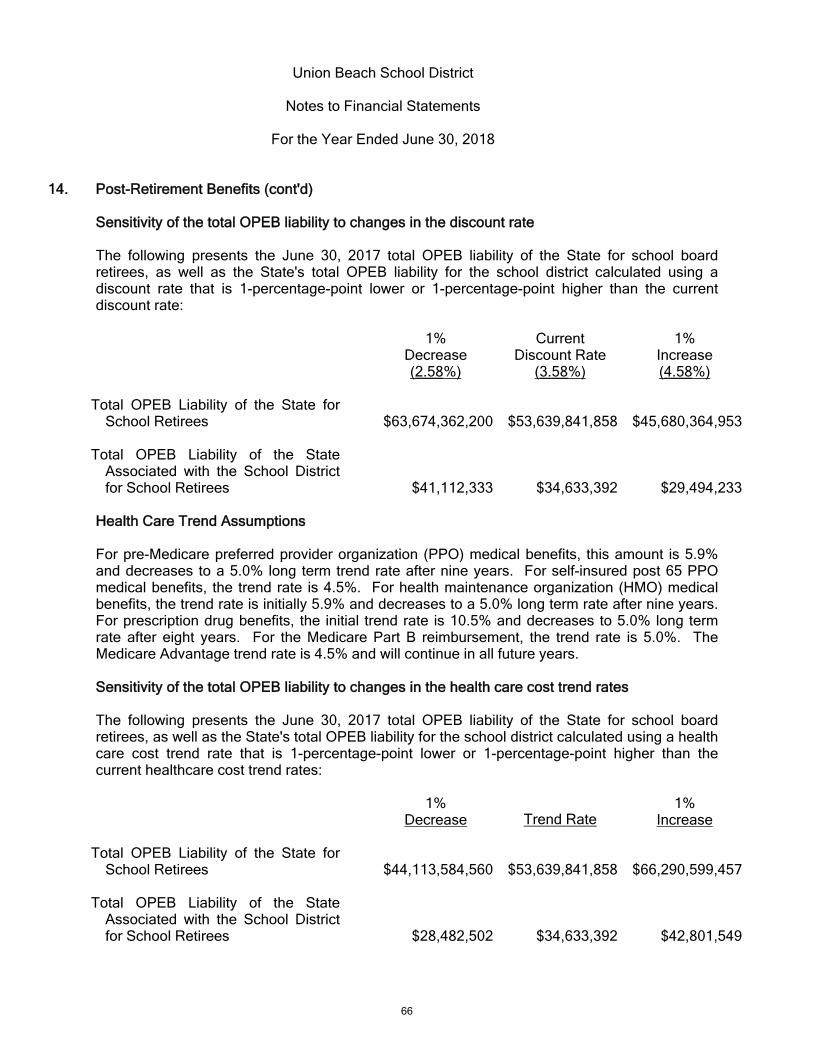
Union Beach School District
Notes to Financial Statements
For the Year Ended June 30, 2018
14. Post-Retirement Benefits (cont'd)
Sensitivity of the total OPEB liability to changes in the discount rate
The following presents the June 30, 2017 total OPEB liability of the State for school boardretirees, as well as the State's total OPEB liability for the school district calculated using adiscount rate that is 1-percentage-point lower or 1-percentage-point higher than the currentdiscount rate:
1%Decrease(2.58%)
CurrentDiscount Rate
(3.58%)
1%Increase(4.58%)
Total OPEB Liability of the State forSchool Retirees $63,674,362,200 $53,639,841,858 $45,680,364,953
Total OPEB Liability of the StateAssociated with the School Districtfor School Retirees $41,112,333 $34,633,392 $29,494,233
Health Care Trend Assumptions
For pre-Medicare preferred provider organization (PPO) medical benefits, this amount is 5.9%and decreases to a 5.0% long term trend rate after nine years. For self-insured post 65 PPOmedical benefits, the trend rate is 4.5%. For health maintenance organization (HMO) medicalbenefits, the trend rate is initially 5.9% and decreases to a 5.0% long term rate after nine years.For prescription drug benefits, the initial trend rate is 10.5% and decreases to 5.0% long termrate after eight years. For the Medicare Part B reimbursement, the trend rate is 5.0%. TheMedicare Advantage trend rate is 4.5% and will continue in all future years.
Sensitivity of the total OPEB liability to changes in the health care cost trend rates
The following presents the June 30, 2017 total OPEB liability of the State for school boardretirees, as well as the State's total OPEB liability for the school district calculated using a healthcare cost trend rate that is 1-percentage-point lower or 1-percentage-point higher than thecurrent healthcare cost trend rates:
1%Decrease Trend Rate
1%Increase
Total OPEB Liability of the State forSchool Retirees $44,113,584,560 $53,639,841,858 $66,290,599,457
Total OPEB Liability of the StateAssociated with the School Districtfor School Retirees $28,482,502 $34,633,392 $42,801,549
66

Union Beach School District
Notes to Financial Statements
For the Year Ended June 30, 2018
14. Post-Retirement Benefits (cont'd)
OPEB Expense and Deferred Outflows of Resources and Deferred Inflows of ResourcesRelated to OPEB
For the year ended June 30, 2018, the board of education recognized OPEB expense of$1,281,416 determined by the State as the total OPEB liability for benefits provided through adefined benefit OPEB plan that is not administered through a trust that meets the criteria inparagraph 4 of GASB 75 and in which there is a special funding situation.
In accordance with GASB 75, the Union Beach School District's proportionate share of schoolretirees OPEB is zero, there is no recognition of the allocation of proportionate share of deferredoutflows of resources and deferred inflows of resources. At June 30, 2017, the State reporteddeferred outflows of resources and deferred inflows of resources related to retired schoolemployee's OPEB from the following sources:
Deferred Outflowsof Resources
DeferredInflows of
ResourcesDifferences between expected and actual experienceChanges of assumptions $ - $ 6,343,769,032Contributions made in fiscal year ending 2018 after June 30, 2017 measurement date 1,190,373,242 -
Total $ 1,190,373,242 $ 6,343,769,032
Amounts reported as deferred outflows of resources and deferred inflows of resources related toretired school employee's OPEB will be recognized in OPEB expense as follows:
Year ended June 30:2018 $ (742,830,097)2019 (742,830,097)2020 (742,830,097)2021 (742,830,097)2022 (742,830,097)Thereafter (2,629,618,547)Total $ (6,343,769,032)
67
Union Beach School District
Notes to Financial Statements
For the Year Ended June 30, 2018
15. Deferred Compensation
The Board offers its employees a choice of Deferred Compensation Plans created inaccordance with Internal Revenue Code Section 403(b). The Plans, which are administered bythe entities listed below, permit participants to defer a portion of their salary until future years.Amounts deferred under the Plans are not available to employees until termination, retirement,death or unforeseeable emergency. The Plan administrators are as follows:
Lincoln Investment Financial Metropolitan Life InsuranceFranklin Templeton Oppenheimer Funds
AXA Equitable Siracusa
16. Risk Management
The District is exposed to various risks of loss related to torts: theft of, damage to, anddestruction of assets; errors and omission; injuries to employees; and natural disasters.
Property and Liability Insurance - The District maintains commercial insurance coverage forproperty, liability, student accident and surety bonds. A complete schedule of insurancecoverage can be found in the Statistical Section of this Comprehensive Annual Financial Report.
68
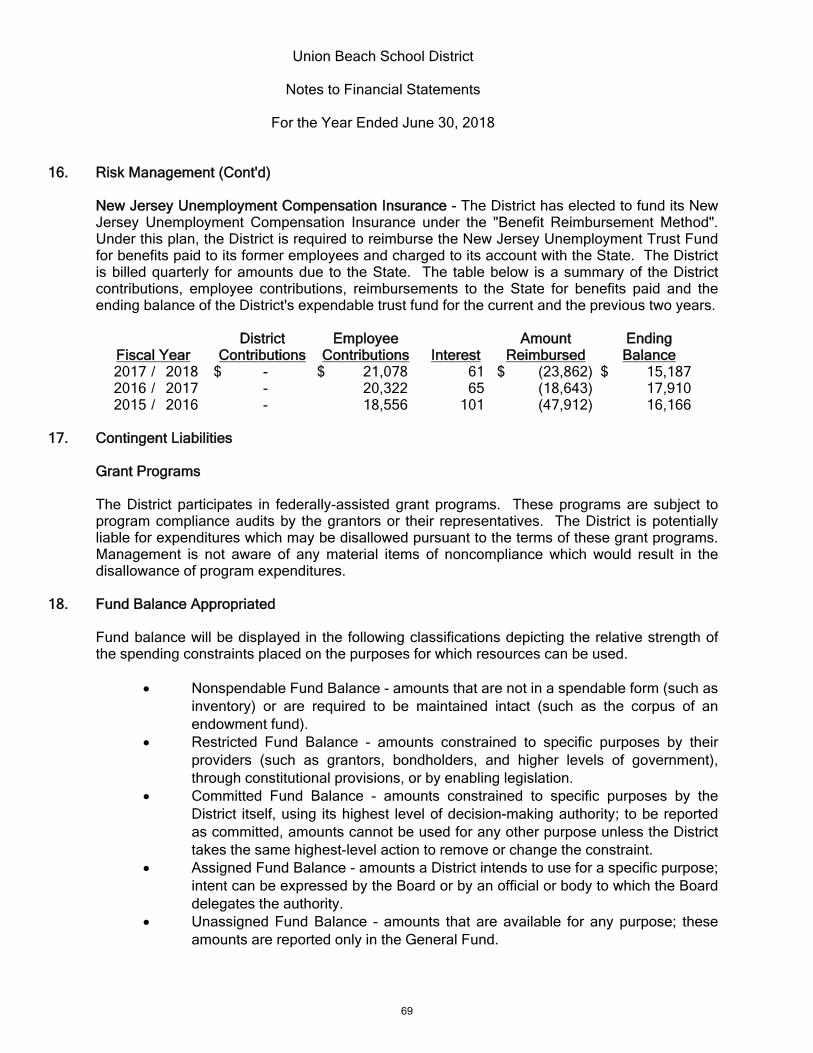
Union Beach School District
Notes to Financial Statements
For the Year Ended June 30, 2018
16. Risk Management (Cont'd)
New Jersey Unemployment Compensation Insurance - The District has elected to fund its NewJersey Unemployment Compensation Insurance under the "Benefit Reimbursement Method".Under this plan, the District is required to reimburse the New Jersey Unemployment Trust Fundfor benefits paid to its former employees and charged to its account with the State. The Districtis billed quarterly for amounts due to the State. The table below is a summary of the Districtcontributions, employee contributions, reimbursements to the State for benefits paid and theending balance of the District's expendable trust fund for the current and the previous two years.
Fiscal YearDistrict
ContributionsEmployee
Contributions InterestAmount
ReimbursedEndingBalance
2017 / 2018 $ - $ 21,078 61 $ (23,862) $ 15,1872016 / 2017 - 20,322 65 (18,643) 17,9102015 / 2016 - 18,556 101 (47,912) 16,166
17. Contingent Liabilities
Grant Programs
The District participates in federally-assisted grant programs. These programs are subject toprogram compliance audits by the grantors or their representatives. The District is potentiallyliable for expenditures which may be disallowed pursuant to the terms of these grant programs.Management is not aware of any material items of noncompliance which would result in thedisallowance of program expenditures.
18. Fund Balance Appropriated
Fund balance will be displayed in the following classifications depicting the relative strength ofthe spending constraints placed on the purposes for which resources can be used.
Nonspendable Fund Balance - amounts that are not in a spendable form (such asinventory) or are required to be maintained intact (such as the corpus of anendowment fund).
Restricted Fund Balance - amounts constrained to specific purposes by theirproviders (such as grantors, bondholders, and higher levels of government),through constitutional provisions, or by enabling legislation.
Committed Fund Balance - amounts constrained to specific purposes by theDistrict itself, using its highest level of decision-making authority; to be reportedas committed, amounts cannot be used for any other purpose unless the Districttakes the same highest-level action to remove or change the constraint.
Assigned Fund Balance - amounts a District intends to use for a specific purpose;intent can be expressed by the Board or by an official or body to which the Boarddelegates the authority.
Unassigned Fund Balance - amounts that are available for any purpose; theseamounts are reported only in the General Fund.
69

Union Beach School District
Notes to Financial Statements
For the Year Ended June 30, 2018
18. Fund Balance Appropriated (Cont'd)
Fund balance reporting is the result of State Statutes, New Jersey Department of Educationregulations and motions (resolutions/ordinances) that are passed at Board meetings. The Boardacts on these motions under the guidance of the District's Superintendent and BusinessAdministrator.
The District's policy is to apply expenditures against non-spendable fund balance, restrictedfund balance, committed fund balance, assigned fund balance, and unassigned fund balance atthe end of each fiscal year, utilizing adjusting journal entries.
First, non-spendable fund balances are determined; then, restricted fund balances for specificpurposed are determined (not including non-spendable amounts). Any remaining fund balanceamounts for the non-General Funds are classified as restricted fund balances.
There is a potential for the non-general funds to have negative unassigned fund balance whennon-spendable amounts plus the restricted fund balances for specific purpose amounts exceedthe positive fund balances for the non-general funds.Classification Totals
GeneralFund
SpecialRevenue
Fund
Debt Service
Fund
CapitalProjects
Fund TotalFundBalances:
Restricted 3,715,786 - - - 3,715,786Committed - - - - -Assigned 160,568 - - - 160,568Unassigned (381,652) (45,926) - - (427,578)
3,494,702 (45,926) - - 3,448,776
19. Deficit Fund Balances
The District has a deficit fund balance of $381,652 in the General Fund as of June 30, 2018 asreported in the fund statements. N.J.S.A. 18A:22-44.2 provides that in the event a state schoolaid payment is not made until the following school budget year, districts must record the delayedone or more June state aid payments as revenue, for budget purposes only, in the currentschool budget year. The bill provides legal authority for school districts to recognize thisrevenue in the current budget year. For intergovernmental transactions, GovernmentalAccounting Standards require that recognition revenue, expenditure, asset, liability should be insymmetry, i.e., if one government recognizes an asset, the other government recognizes aliability. Since the State is recording the June state aid payments in the subsequent fiscal year,the school district can not recognize the June state aid payments (on the GAAP financialstatements) until the year the State records the payable. Due to the timing difference ofrecording the June state aid payments, the General Fund balance deficit does not alone indicatethat the district is facing financial difficulties.
70

Union Beach School District
Notes to Financial Statements
For the Year Ended June 30, 2018
19. Deficit Fund Balances (Cont'd)
Pursuant to N.J.S.A. 18A:22-44.2 any negative unreserved, undesignated general fund balancethat is reported as a direct result from a delay in June payments of state aid until the followingfiscal year is not considered in violation of New Jersey statute and regulation nor in need ofcorrective action. The District deficit in the GAAP funds statements of $381,652 is less than thetwo state aid payments.
20. Calculation of Excess Surplus
The Designation for Reserved Fund Balance - Excess Surplus is a required calculation pursuantto N.J.S.A. 18A:7F-7, as amended. New Jersey school districts are required to reserve GeneralFund fund balance at the fiscal year end of June 30 if they did not appropriate a requiredminimum amount as budgeted fund balance in their subsequent years' budget. The excess fundbalance at June 30, 2018 is $563,706.
21. Uncertain Tax Positions
The school district had no unrecognized tax benefits at June 30, 2018. The school district filestax returns in the U.S. federal jurisdiction and New Jersey. The school district has no open yearprior to June 30, 2015.
22. Subsequent Events
Management has evaluated subsequent events through January 31, 2019, the date thefinancial statements were available to be issued.
23. Tax Abatement
As defined by the Governmental Accounting Standards Board (GASB), a tax abatement is anagreement between a government and an individual or entity in which the government promisesto forgo tax revenues and the individual or entity promises to subsequently take a specific actionthat contributes to economic development or otherwise benefits the government or its citizens.School districts are not authorized by New Jersey statute to enter into tax abatementagreements. However, the county or municipality in which the school district is situated mayhave entered into tax abatement agreements, and that potential must be disclosed in thesefinancial statements. If the county or municipality entered into tax abatement agreements, thoseagreements will not directly affect the school district's local tax revenue because N.J.S.A. 54:4-75 and N.J.S.A. 54:4-76 require that amounts so forgiven must effectively be recouped fromother taxpayers and remitted to the school district.
71

REQUIRED SUPPLEMENTARY INFORMATION - PART II
72

Exhibit C-1
Original Budget Final Variance
Budget Transfers Budget Actual Final to Actual
REVENUES:
Local sources:
Local tax levy 6,628,685$ -$ 6,628,685$ 6,628,685$ -$
Tuition - - - 945 945
Interest 5,000 - 5,000 9,960 4,960
Interest earned on capital reserve funds - - - - - Rents and Royalties - - - 2,450 2,450
Miscellaneous - - - 9,420 9,420
Total - local sources 6,633,685 - 6,633,685 6,651,460 17,775
State sources:
Transportation aid 39,173 - 39,173 39,173 -
Special education aid 658,640 - 658,640 658,640 -
Equalization aid 7,444,810 - 7,444,810 7,444,810 -
Extraordinary aid - - - 135,565 135,565
Security aid 28,312 - 28,312 28,312 -
Adjustment Aid 160,375 (73,023) 87,352 87,352 -
Additional Adjustment Aid - - - - -
Non-public transportation - - - 5,759 5,759
PARCC Readiness 8,820 - 8,820 8,820 -
Per Pupil Growth 8,820 - 8,820 8,820 - Prof Learning Comm Aid 7,890 - 7,890 7,890 -
TPAF - LTDI (on-behalf - Non-budgeted) - - - 1,267 1,267
TPAF - post retirement medical (on-behalf - Non-budgeted) - - - 382,008 382,008
Teacher's pension and annuity fund (on-behalf - Non-budgeted) - - - 591,455 591,455
TPAF social security (reimbursed - Non-budgeted) - - - 306,686 306,686
Total state sources 8,356,840 (73,023) 8,283,817 9,706,557 1,422,740
Federal sources: Medicaid reimbursement 16,103 - 16,103 - (16,103) Total federal sources 16,103 - 16,103 - (16,103)
Total revenues 15,006,628$ (73,023)$ 14,933,605$ 16,358,017$ 1,424,412$
EXPENDITURES:
Current Expense:
Regular Programs - Instruction
Preschool/Kindergarten - Salaries of teachers 272,218$ 227$ 272,445$ 267,845$ 4,600$
Grades 1-5 - Salaries of teachers 1,162,931 8,131 1,171,062 1,162,104 8,958
Grades 6-8 - Salaries of teachers 948,532 (8,360) 940,172 929,814 10,358
Local Contrib-tfr to Spc Rev-Regular 73,594 - 73,594 - 73,594
Regular Programs - Home Instruction:
Salaries of teachers 10,000 - 10,000 5,920 4,080
Purchased professional-educational services - 5,261 5,261 4,812 449
Regular Programs - Undistributed Instruction
Other salaries for instruction 61,356 20,002 81,358 76,980 4,378
Other purchased services (400-500 series) 22,000 - 22,000 16,423 5,577
General supplies 217,809 (184) 217,625 202,067 15,558
Textbooks 92,837 (26,000) 66,837 62,400 4,437
Other objects 93,544 1,650 95,194 75,221 19,973
TOTAL REGULAR PROGRAMS - INSTRUCTION 2,954,821 727 2,955,548 2,803,586 151,962
SPECIAL EDUCATION - INSTRUCTION
UNION BEACH SCHOOL DISTRICT
Budgetary Comparison Schedule
General Fund
For the Fiscal Year Ended June 30, 2018
73
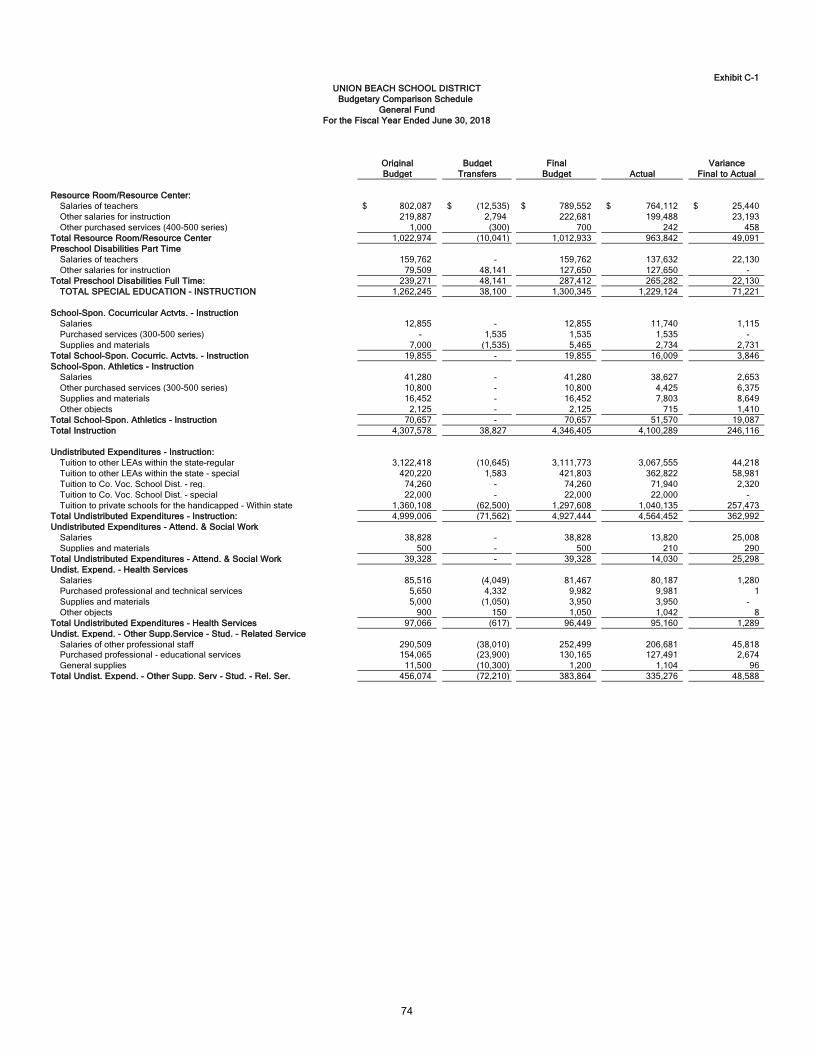
Exhibit C-1
Original Budget Final Variance
Budget Transfers Budget Actual Final to Actual
UNION BEACH SCHOOL DISTRICT
Budgetary Comparison Schedule
General Fund
For the Fiscal Year Ended June 30, 2018
Resource Room/Resource Center:
Salaries of teachers 802,087$ (12,535)$ 789,552$ 764,112$ 25,440$
Other salaries for instruction 219,887 2,794 222,681 199,488 23,193
Other purchased services (400-500 series) 1,000 (300) 700 242 458
Total Resource Room/Resource Center 1,022,974 (10,041) 1,012,933 963,842 49,091
Preschool Disabilities Part Time
Salaries of teachers 159,762 - 159,762 137,632 22,130
Other salaries for instruction 79,509 48,141 127,650 127,650 -
Total Preschool Disabilities Full Time: 239,271 48,141 287,412 265,282 22,130
TOTAL SPECIAL EDUCATION - INSTRUCTION 1,262,245 38,100 1,300,345 1,229,124 71,221
School-Spon. Cocurricular Actvts. - Instruction
Salaries 12,855 - 12,855 11,740 1,115
Purchased services (300-500 series) - 1,535 1,535 1,535 -
Supplies and materials 7,000 (1,535) 5,465 2,734 2,731
Total School-Spon. Cocurric. Actvts. - Instruction 19,855 - 19,855 16,009 3,846
School-Spon. Athletics - Instruction
Salaries 41,280 - 41,280 38,627 2,653
Other purchased services (300-500 series) 10,800 - 10,800 4,425 6,375
Supplies and materials 16,452 - 16,452 7,803 8,649
Other objects 2,125 - 2,125 715 1,410
Total School-Spon. Athletics - Instruction 70,657 - 70,657 51,570 19,087
Total Instruction 4,307,578 38,827 4,346,405 4,100,289 246,116
Undistributed Expenditures - Instruction:
Tuition to other LEAs within the state-regular 3,122,418 (10,645) 3,111,773 3,067,555 44,218
Tuition to other LEAs within the state - special 420,220 1,583 421,803 362,822 58,981
Tuition to Co. Voc. School Dist. - reg. 74,260 - 74,260 71,940 2,320
Tuition to Co. Voc. School Dist. - special 22,000 - 22,000 22,000 -
Tuition to private schools for the handicapped - Within state 1,360,108 (62,500) 1,297,608 1,040,135 257,473
Total Undistributed Expenditures - Instruction: 4,999,006 (71,562) 4,927,444 4,564,452 362,992
Undistributed Expenditures - Attend. & Social Work
Salaries 38,828 - 38,828 13,820 25,008
Supplies and materials 500 - 500 210 290
Total Undistributed Expenditures - Attend. & Social Work 39,328 - 39,328 14,030 25,298
Undist. Expend. - Health Services
Salaries 85,516 (4,049) 81,467 80,187 1,280
Purchased professional and technical services 5,650 4,332 9,982 9,981 1
Supplies and materials 5,000 (1,050) 3,950 3,950 -
Other objects 900 150 1,050 1,042 8
Total Undistributed Expenditures - Health Services 97,066 (617) 96,449 95,160 1,289
Undist. Expend. - Other Supp.Service - Stud. - Related Service
Salaries of other professional staff 290,509 (38,010) 252,499 206,681 45,818 Purchased professional - educational services 154,065 (23,900) 130,165 127,491 2,674
General supplies 11,500 (10,300) 1,200 1,104 96
Total Undist. Expend. - Other Supp. Serv - Stud. - Rel. Ser. 456,074 (72,210) 383,864 335,276 48,588
74
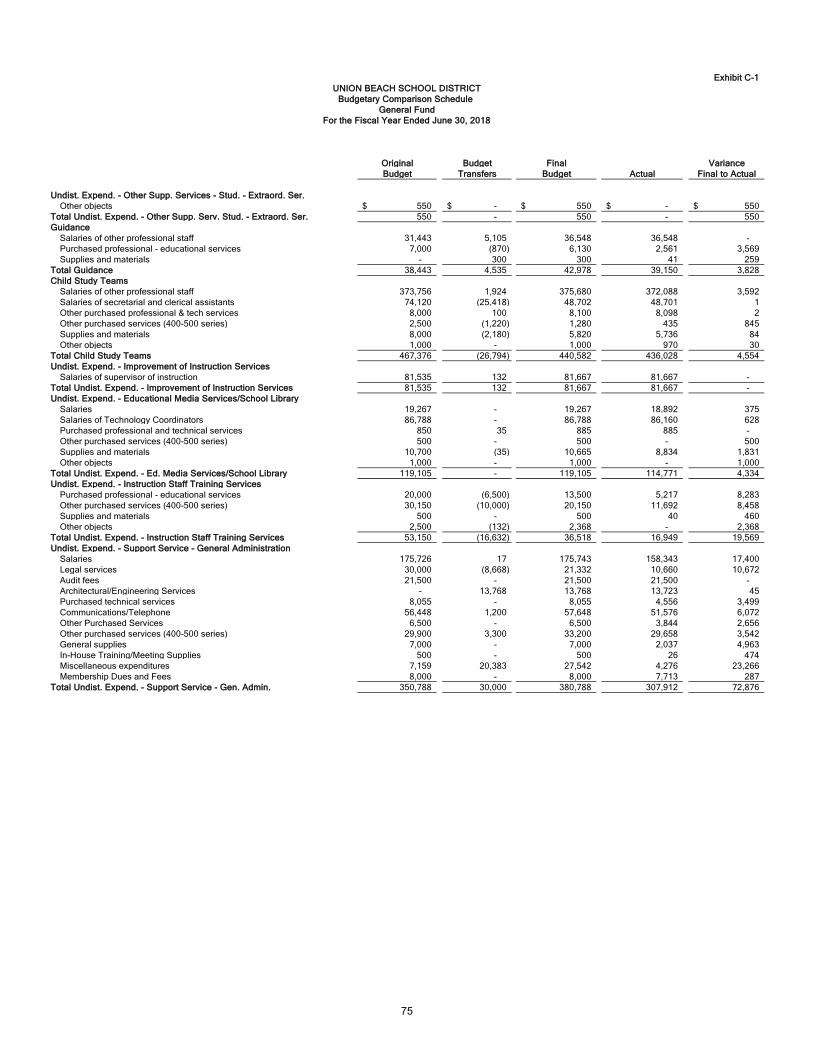
Exhibit C-1
Original Budget Final Variance
Budget Transfers Budget Actual Final to Actual
UNION BEACH SCHOOL DISTRICT
Budgetary Comparison Schedule
General Fund
For the Fiscal Year Ended June 30, 2018
Undist. Expend. - Other Supp. Services - Stud. - Extraord. Ser.
Other objects 550$ -$ 550$ -$ 550$
Total Undist. Expend. - Other Supp. Serv. Stud. - Extraord. Ser. 550 - 550 - 550
Guidance
Salaries of other professional staff 31,443 5,105 36,548 36,548 -
Purchased professional - educational services 7,000 (870) 6,130 2,561 3,569
Supplies and materials - 300 300 41 259
Total Guidance 38,443 4,535 42,978 39,150 3,828
Child Study Teams
Salaries of other professional staff 373,756 1,924 375,680 372,088 3,592
Salaries of secretarial and clerical assistants 74,120 (25,418) 48,702 48,701 1
Other purchased professional & tech services 8,000 100 8,100 8,098 2
Other purchased services (400-500 series) 2,500 (1,220) 1,280 435 845
Supplies and materials 8,000 (2,180) 5,820 5,736 84
Other objects 1,000 - 1,000 970 30
Total Child Study Teams 467,376 (26,794) 440,582 436,028 4,554
Undist. Expend. - Improvement of Instruction Services
Salaries of supervisor of instruction 81,535 132 81,667 81,667 -
Total Undist. Expend. - Improvement of Instruction Services 81,535 132 81,667 81,667 -
Undist. Expend. - Educational Media Services/School Library
Salaries 19,267 - 19,267 18,892 375
Salaries of Technology Coordinators 86,788 - 86,788 86,160 628
Purchased professional and technical services 850 35 885 885 -
Other purchased services (400-500 series) 500 - 500 - 500
Supplies and materials 10,700 (35) 10,665 8,834 1,831
Other objects 1,000 - 1,000 - 1,000
Total Undist. Expend. - Ed. Media Services/School Library 119,105 - 119,105 114,771 4,334
Undist. Expend. - Instruction Staff Training Services
Purchased professional - educational services 20,000 (6,500) 13,500 5,217 8,283
Other purchased services (400-500 series) 30,150 (10,000) 20,150 11,692 8,458
Supplies and materials 500 - 500 40 460
Other objects 2,500 (132) 2,368 - 2,368
Total Undist. Expend. - Instruction Staff Training Services 53,150 (16,632) 36,518 16,949 19,569
Undist. Expend. - Support Service - General Administration
Salaries 175,726 17 175,743 158,343 17,400
Legal services 30,000 (8,668) 21,332 10,660 10,672
Audit fees 21,500 - 21,500 21,500 -
Architectural/Engineering Services - 13,768 13,768 13,723 45
Purchased technical services 8,055 - 8,055 4,556 3,499
Communications/Telephone 56,448 1,200 57,648 51,576 6,072
Other Purchased Services 6,500 - 6,500 3,844 2,656
Other purchased services (400-500 series) 29,900 3,300 33,200 29,658 3,542
General supplies 7,000 - 7,000 2,037 4,963
In-House Training/Meeting Supplies 500 - 500 26 474
Miscellaneous expenditures 7,159 20,383 27,542 4,276 23,266
Membership Dues and Fees 8,000 - 8,000 7,713 287
Total Undist. Expend. - Support Service - Gen. Admin. 350,788 30,000 380,788 307,912 72,876
75
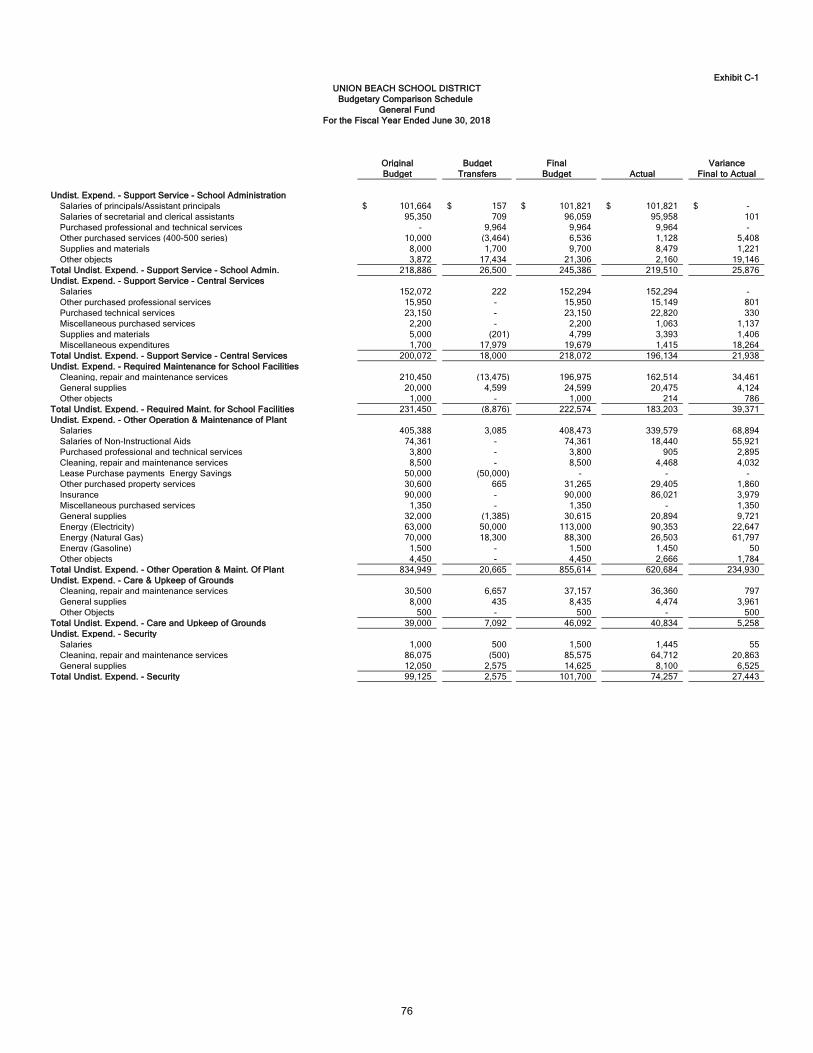
Exhibit C-1
Original Budget Final Variance
Budget Transfers Budget Actual Final to Actual
UNION BEACH SCHOOL DISTRICT
Budgetary Comparison Schedule
General Fund
For the Fiscal Year Ended June 30, 2018
Undist. Expend. - Support Service - School Administration
Salaries of principals/Assistant principals 101,664$ 157$ 101,821$ 101,821$ -$
Salaries of secretarial and clerical assistants 95,350 709 96,059 95,958 101
Purchased professional and technical services - 9,964 9,964 9,964 -
Other purchased services (400-500 series) 10,000 (3,464) 6,536 1,128 5,408
Supplies and materials 8,000 1,700 9,700 8,479 1,221
Other objects 3,872 17,434 21,306 2,160 19,146
Total Undist. Expend. - Support Service - School Admin. 218,886 26,500 245,386 219,510 25,876
Undist. Expend. - Support Service - Central Services
Salaries 152,072 222 152,294 152,294 -
Other purchased professional services 15,950 - 15,950 15,149 801
Purchased technical services 23,150 - 23,150 22,820 330
Miscellaneous purchased services 2,200 - 2,200 1,063 1,137
Supplies and materials 5,000 (201) 4,799 3,393 1,406
Miscellaneous expenditures 1,700 17,979 19,679 1,415 18,264
Total Undist. Expend. - Support Service - Central Services 200,072 18,000 218,072 196,134 21,938
Undist. Expend. - Required Maintenance for School Facilities
Cleaning, repair and maintenance services 210,450 (13,475) 196,975 162,514 34,461
General supplies 20,000 4,599 24,599 20,475 4,124
Other objects 1,000 - 1,000 214 786
Total Undist. Expend. - Required Maint. for School Facilities 231,450 (8,876) 222,574 183,203 39,371
Undist. Expend. - Other Operation & Maintenance of Plant
Salaries 405,388 3,085 408,473 339,579 68,894
Salaries of Non-Instructional Aids 74,361 - 74,361 18,440 55,921
Purchased professional and technical services 3,800 - 3,800 905 2,895
Cleaning, repair and maintenance services 8,500 - 8,500 4,468 4,032
Lease Purchase payments Energy Savings 50,000 (50,000) - - -
Other purchased property services 30,600 665 31,265 29,405 1,860
Insurance 90,000 - 90,000 86,021 3,979
Miscellaneous purchased services 1,350 - 1,350 - 1,350
General supplies 32,000 (1,385) 30,615 20,894 9,721
Energy (Electricity) 63,000 50,000 113,000 90,353 22,647
Energy (Natural Gas) 70,000 18,300 88,300 26,503 61,797
Energy (Gasoline) 1,500 - 1,500 1,450 50
Other objects 4,450 - 4,450 2,666 1,784
Total Undist. Expend. - Other Operation & Maint. Of Plant 834,949 20,665 855,614 620,684 234,930
Undist. Expend. - Care & Upkeep of Grounds
Cleaning, repair and maintenance services 30,500 6,657 37,157 36,360 797
General supplies 8,000 435 8,435 4,474 3,961
Other Objects 500 - 500 - 500
Total Undist. Expend. - Care and Upkeep of Grounds 39,000 7,092 46,092 40,834 5,258
Undist. Expend. - Security
Salaries 1,000 500 1,500 1,445 55
Cleaning, repair and maintenance services 86,075 (500) 85,575 64,712 20,863
General supplies 12,050 2,575 14,625 8,100 6,525
Total Undist. Expend. - Security 99,125 2,575 101,700 74,257 27,443
76
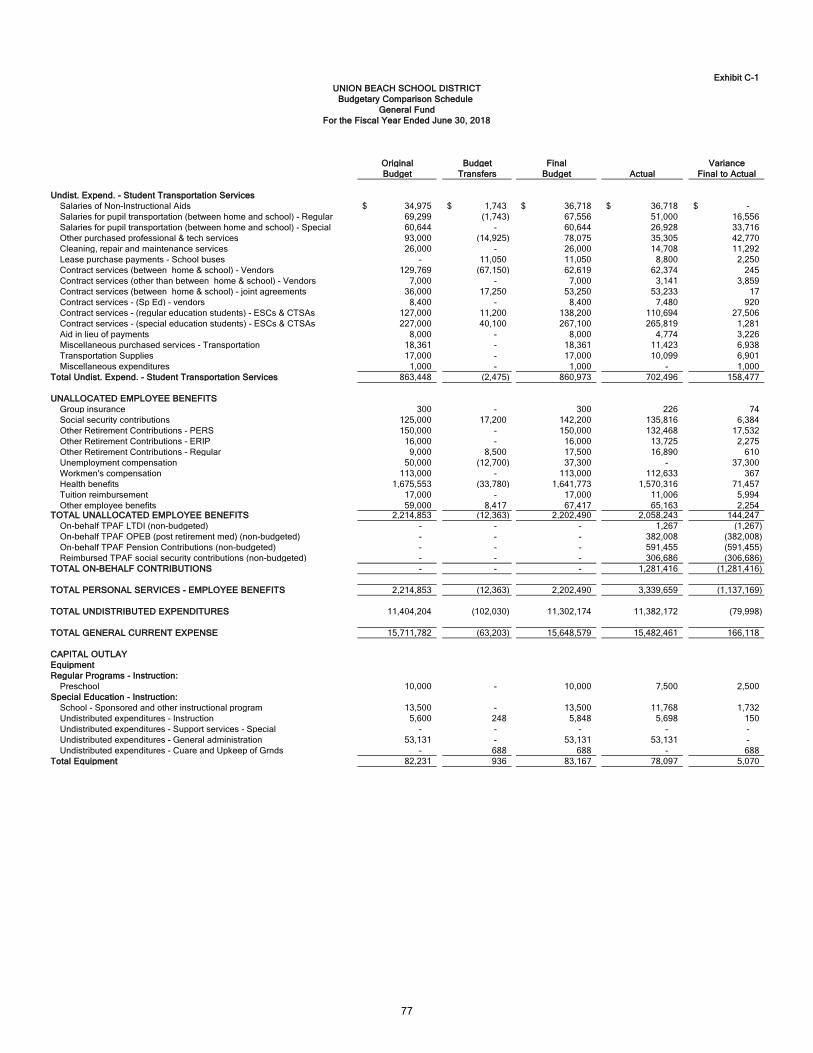
Exhibit C-1
Original Budget Final Variance
Budget Transfers Budget Actual Final to Actual
UNION BEACH SCHOOL DISTRICT
Budgetary Comparison Schedule
General Fund
For the Fiscal Year Ended June 30, 2018
Undist. Expend. - Student Transportation Services
Salaries of Non-Instructional Aids 34,975$ 1,743$ 36,718$ 36,718$ -$
Salaries for pupil transportation (between home and school) - Regular 69,299 (1,743) 67,556 51,000 16,556
Salaries for pupil transportation (between home and school) - Special 60,644 - 60,644 26,928 33,716
Other purchased professional & tech services 93,000 (14,925) 78,075 35,305 42,770
Cleaning, repair and maintenance services 26,000 - 26,000 14,708 11,292
Lease purchase payments - School buses - 11,050 11,050 8,800 2,250
Contract services (between home & school) - Vendors 129,769 (67,150) 62,619 62,374 245
Contract services (other than between home & school) - Vendors 7,000 - 7,000 3,141 3,859
Contract services (between home & school) - joint agreements 36,000 17,250 53,250 53,233 17
Contract services - (Sp Ed) - vendors 8,400 - 8,400 7,480 920
Contract services - (regular education students) - ESCs & CTSAs 127,000 11,200 138,200 110,694 27,506
Contract services - (special education students) - ESCs & CTSAs 227,000 40,100 267,100 265,819 1,281
Aid in lieu of payments 8,000 - 8,000 4,774 3,226
Miscellaneous purchased services - Transportation 18,361 - 18,361 11,423 6,938
Transportation Supplies 17,000 - 17,000 10,099 6,901
Miscellaneous expenditures 1,000 - 1,000 - 1,000
Total Undist. Expend. - Student Transportation Services 863,448 (2,475) 860,973 702,496 158,477
UNALLOCATED EMPLOYEE BENEFITS
Group insurance 300 - 300 226 74
Social security contributions 125,000 17,200 142,200 135,816 6,384
Other Retirement Contributions - PERS 150,000 - 150,000 132,468 17,532
Other Retirement Contributions - ERIP 16,000 - 16,000 13,725 2,275
Other Retirement Contributions - Regular 9,000 8,500 17,500 16,890 610
Unemployment compensation 50,000 (12,700) 37,300 - 37,300
Workmen's compensation 113,000 - 113,000 112,633 367
Health benefits 1,675,553 (33,780) 1,641,773 1,570,316 71,457
Tuition reimbursement 17,000 - 17,000 11,006 5,994
Other employee benefits 59,000 8,417 67,417 65,163 2,254 TOTAL UNALLOCATED EMPLOYEE BENEFITS 2,214,853 (12,363) 2,202,490 2,058,243 144,247
On-behalf TPAF LTDI (non-budgeted) - - - 1,267 (1,267)
On-behalf TPAF OPEB (post retirement med) (non-budgeted) - - - 382,008 (382,008)
On-behalf TPAF Pension Contributions (non-budgeted) - - - 591,455 (591,455)
Reimbursed TPAF social security contributions (non-budgeted) - - - 306,686 (306,686)
TOTAL ON-BEHALF CONTRIBUTIONS - - - 1,281,416 (1,281,416)
TOTAL PERSONAL SERVICES - EMPLOYEE BENEFITS 2,214,853 (12,363) 2,202,490 3,339,659 (1,137,169)
TOTAL UNDISTRIBUTED EXPENDITURES 11,404,204 (102,030) 11,302,174 11,382,172 (79,998)
TOTAL GENERAL CURRENT EXPENSE 15,711,782 (63,203) 15,648,579 15,482,461 166,118
CAPITAL OUTLAY
Equipment
Regular Programs - Instruction:
Preschool 10,000 - 10,000 7,500 2,500
Special Education - Instruction:
School - Sponsored and other instructional program 13,500 - 13,500 11,768 1,732
Undistributed expenditures - Instruction 5,600 248 5,848 5,698 150
Undistributed expenditures - Support services - Special - - - - -
Undistributed expenditures - General administration 53,131 - 53,131 53,131 -
Undistributed expenditures - Cuare and Upkeep of Grnds - 688 688 - 688
Total Equipment 82,231 936 83,167 78,097 5,070
77
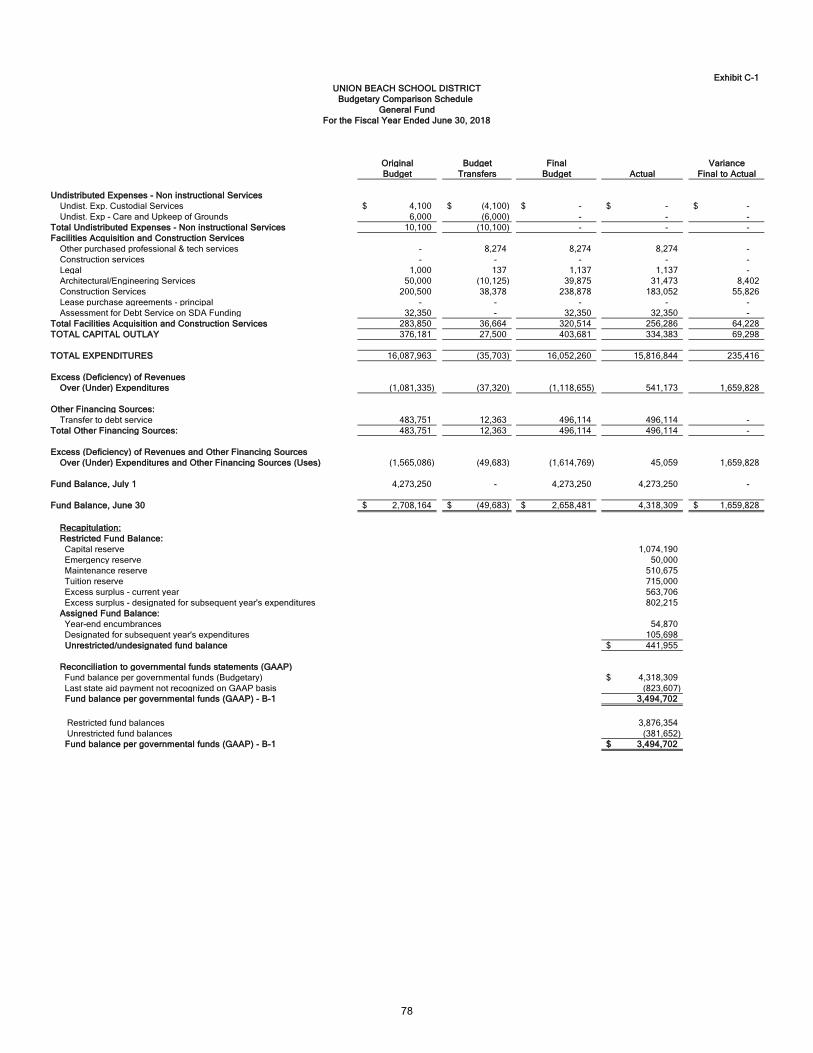
Exhibit C-1
Original Budget Final Variance
Budget Transfers Budget Actual Final to Actual
UNION BEACH SCHOOL DISTRICT
Budgetary Comparison Schedule
General Fund
For the Fiscal Year Ended June 30, 2018
Undistributed Expenses - Non instructional Services
Undist. Exp. Custodial Services 4,100$ (4,100)$ -$ -$ -$
Undist. Exp - Care and Upkeep of Grounds 6,000 (6,000) - - -
Total Undistributed Expenses - Non instructional Services 10,100 (10,100) - - -
Facilities Acquisition and Construction Services
Other purchased professional & tech services - 8,274 8,274 8,274 -
Construction services - - - - -
Legal 1,000 137 1,137 1,137 -
Architectural/Engineering Services 50,000 (10,125) 39,875 31,473 8,402
Construction Services 200,500 38,378 238,878 183,052 55,826
Lease purchase agreements - principal - - - - -
Assessment for Debt Service on SDA Funding 32,350 - 32,350 32,350 -
Total Facilities Acquisition and Construction Services 283,850 36,664 320,514 256,286 64,228
TOTAL CAPITAL OUTLAY 376,181 27,500 403,681 334,383 69,298
TOTAL EXPENDITURES 16,087,963 (35,703) 16,052,260 15,816,844 235,416
Excess (Deficiency) of Revenues
Over (Under) Expenditures (1,081,335) (37,320) (1,118,655) 541,173 1,659,828
Other Financing Sources:
Transfer to debt service 483,751 12,363 496,114 496,114 -
Total Other Financing Sources: 483,751 12,363 496,114 496,114 -
Excess (Deficiency) of Revenues and Other Financing Sources
Over (Under) Expenditures and Other Financing Sources (Uses) (1,565,086) (49,683) (1,614,769) 45,059 1,659,828
Fund Balance, July 1 4,273,250 - 4,273,250 4,273,250 -
Fund Balance, June 30 2,708,164$ (49,683)$ 2,658,481$ 4,318,309 1,659,828$
Recapitulation:
Restricted Fund Balance:
Capital reserve 1,074,190
Emergency reserve 50,000
Maintenance reserve 510,675
Tuition reserve 715,000
Excess surplus - current year 563,706
Excess surplus - designated for subsequent year's expenditures 802,215
Assigned Fund Balance:
Year-end encumbrances 54,870
Designated for subsequent year's expenditures 105,698
Unrestricted/undesignated fund balance 441,955$
Reconciliation to governmental funds statements (GAAP)
Fund balance per governmental funds (Budgetary) 4,318,309$
Last state aid payment not recognized on GAAP basis (823,607)
Fund balance per governmental funds (GAAP) - B-1 3,494,702
Restricted fund balances 3,876,354
Unrestricted fund balances (381,652)
Fund balance per governmental funds (GAAP) - B-1 3,494,702$
78

Exhibit C-2
Original Budget Final Variance
Budget Transfers Budget Actual Final to Actual
REVENUES
Local sources -$ -$ -$ -$ -$
State sources 422,835 - 422,835 289,668 (133,167)
Federal sources 558,590 - 558,590 519,994 (38,596)
Total Revenues 981,425 - 981,425 809,662 (171,763)
EXPENDITURES
Instruction:
Salaries of teachers 284,485 5,253 289,738 396,338 (106,600)
Other salaries for instruction 167,581 7,714 175,295 40,663 134,632
Purchased professional services - - - - -
Tuition 241,673 - 241,673 241,673 -
Textbooks - - - - -
Miscellaneous expense - - - - -
General supplies 30,039 (2,082) 27,957 27,588 369
Total instruction 723,778 10,885 734,663 706,262 28,401
Support services:
Other professional staff salaries - - - - -
Secretarial/clerical salaries - - - - -
Personal services - employee benefits 49,525 - 49,525 49,525 -
Purchased professional - educational services 86,447 (10,785) 75,662 53,875 21,787
Other purchased professional services 113,175 - 113,175 - 113,175
Purchased technical services - - - - -
Travel 500 - 500 - 500
Miscellaneous purchased services (400-500 series) - - - - -
Miscellaneous expenditures - - - - -
Supplies & materials 8,000 (100) 7,900 - 7,900
Total support services 257,647 (10,885) 246,762 103,400 143,362
Facilities acquisition and const. serv.:
Instructional equipment - - - - -
Total facilities acquisition and const. serv. - - - - -
Total expenditures 981,425 - 981,425 809,662 171,763
Other financing sources (uses)
Transfer in from general fund - - - -
Contribution to whole school reform - - - - -
- - - - -
Total outflows 981,425 - 981,425 809,662 171,763
Excess (deficiency) of revenues
Over (under) expenditures -$ -$ -$ -$ -$
Reconciliation to governmental funds statements (GAAP)
Last state aid payment not recognized on GAAP basis (45,926)$
Fund balance per governmental funds (GAAP) (45,926)$
Budgetary Comparison Schedule
For the Fiscal Year Ended June 30, 2018
Special Revenue Fund
UNION BEACH SCHOOL DISTRICT
79
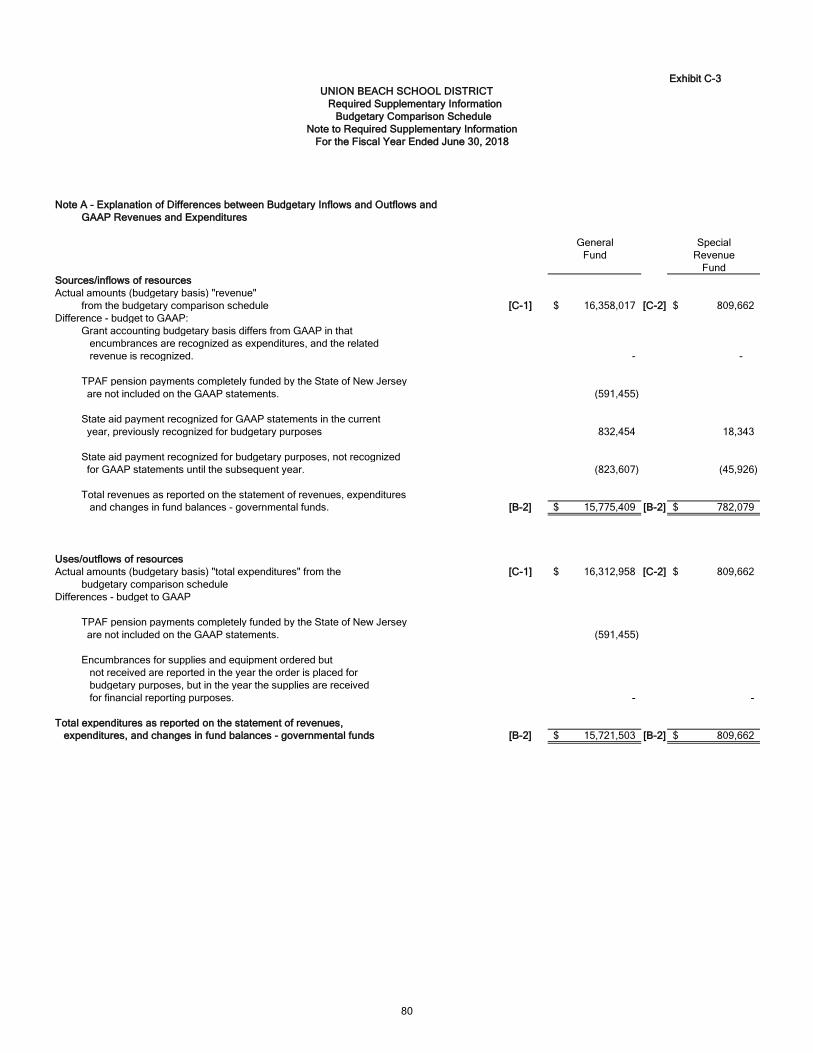
Exhibit C-3
Note A - Explanation of Differences between Budgetary Inflows and Outflows and
GAAP Revenues and Expenditures
General Special
Fund Revenue
Fund
Sources/inflows of resources
Actual amounts (budgetary basis) "revenue"
from the budgetary comparison schedule [C-1] 16,358,017$ [C-2] 809,662$
Difference - budget to GAAP:
Grant accounting budgetary basis differs from GAAP in that
encumbrances are recognized as expenditures, and the related
revenue is recognized. - -
TPAF pension payments completely funded by the State of New Jersey
are not included on the GAAP statements. (591,455)
State aid payment recognized for GAAP statements in the current
year, previously recognized for budgetary purposes 832,454 18,343
State aid payment recognized for budgetary purposes, not recognized
for GAAP statements until the subsequent year. (823,607) (45,926)
Total revenues as reported on the statement of revenues, expenditures
and changes in fund balances - governmental funds. [B-2] 15,775,409$ [B-2] 782,079$
Uses/outflows of resources
Actual amounts (budgetary basis) "total expenditures" from the [C-1] 16,312,958$ [C-2] 809,662$
budgetary comparison schedule
Differences - budget to GAAP
TPAF pension payments completely funded by the State of New Jersey
are not included on the GAAP statements. (591,455)
Encumbrances for supplies and equipment ordered but
not received are reported in the year the order is placed for
budgetary purposes, but in the year the supplies are received
for financial reporting purposes. - -
Total expenditures as reported on the statement of revenues,
expenditures, and changes in fund balances - governmental funds [B-2] 15,721,503$ [B-2] 809,662$
For the Fiscal Year Ended June 30, 2018
Required Supplementary Information
Budgetary Comparison Schedule
Note to Required Supplementary Information
UNION BEACH SCHOOL DISTRICT
80

REQUIRED SUPPLEMENTARY INFORMATION - PART III
81
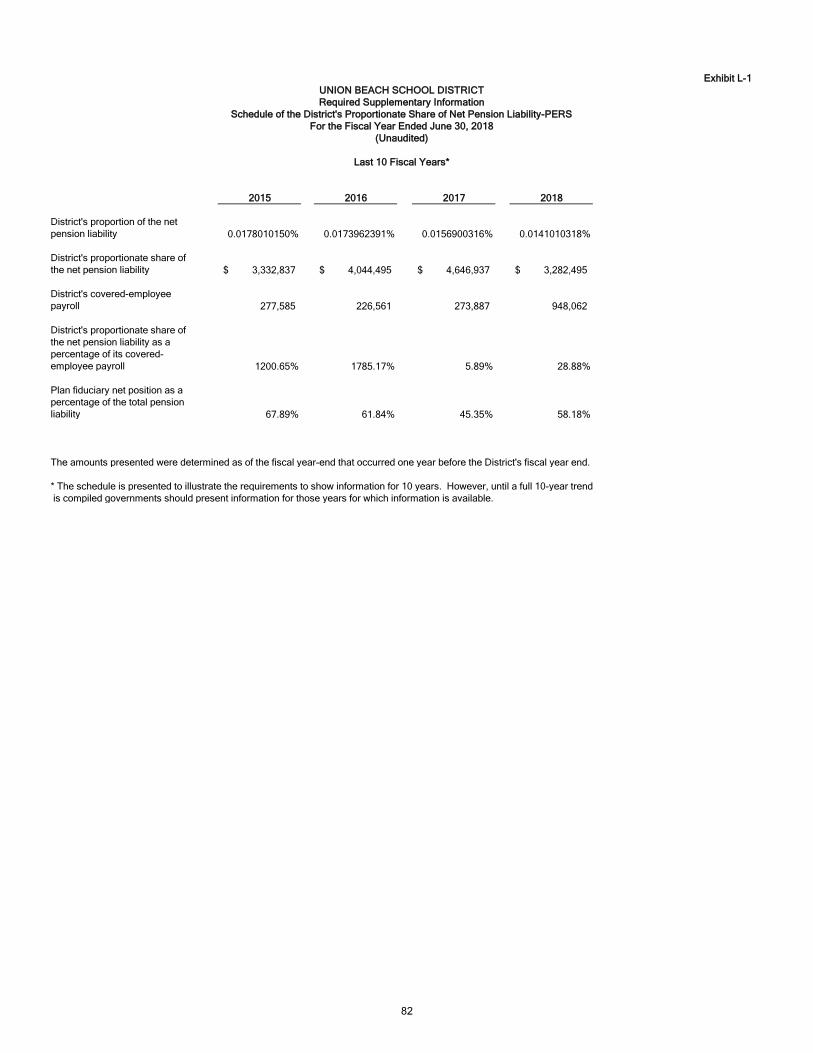
Exhibit L-1
2015 2016 2017 2018
District's proportion of the net
pension liability 0.0178010150% 0.0173962391% 0.0156900316% 0.0141010318%
District's proportionate share of
the net pension liability 3,332,837$ 4,044,495$ 4,646,937$ 3,282,495$
District's covered-employee
payroll 277,585 226,561 273,887 948,062
District's proportionate share of
the net pension liability as a
percentage of its covered-
employee payroll 1200.65% 1785.17% 5.89% 28.88%
Plan fiduciary net position as a
percentage of the total pension
liability 67.89% 61.84% 45.35% 58.18%
The amounts presented were determined as of the fiscal year-end that occurred one year before the District's fiscal year end.
* The schedule is presented to illustrate the requirements to show information for 10 years. However, until a full 10-year trend
is compiled governments should present information for those years for which information is available.
UNION BEACH SCHOOL DISTRICT
Required Supplementary Information
Schedule of the District's Proportionate Share of Net Pension Liability-PERS
For the Fiscal Year Ended June 30, 2018
Last 10 Fiscal Years*
(Unaudited)
82
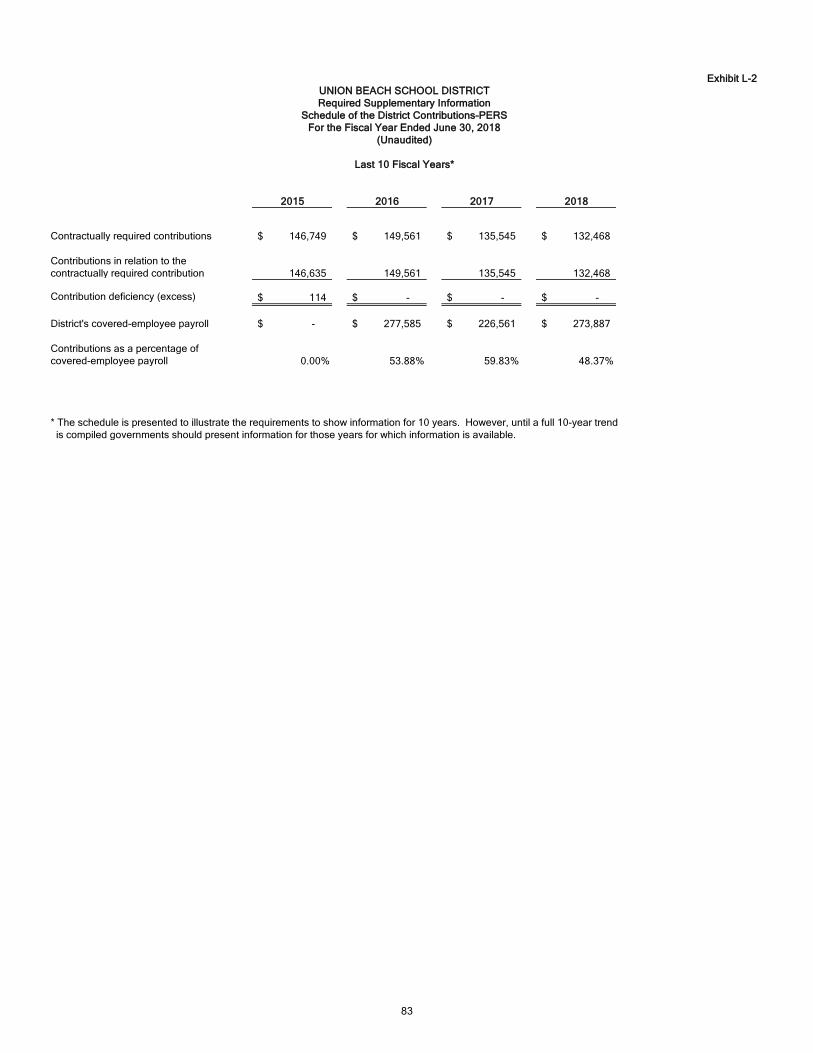
Exhibit L-2
2015 2016 2017 2018
Contractually required contributions 146,749$ 149,561$ 135,545$ 132,468$
Contributions in relation to the
contractually required contribution 146,635 149,561 135,545 132,468
Contribution deficiency (excess) 114$ -$ -$ -$
District's covered-employee payroll -$ 277,585$ 226,561$ 273,887$
Contributions as a percentage of
covered-employee payroll 0.00% 53.88% 59.83% 48.37%
* The schedule is presented to illustrate the requirements to show information for 10 years. However, until a full 10-year trend
is compiled governments should present information for those years for which information is available.
UNION BEACH SCHOOL DISTRICT
Required Supplementary Information
Schedule of the District Contributions-PERS
For the Fiscal Year Ended June 30, 2018
Last 10 Fiscal Years*
(Unaudited)
83
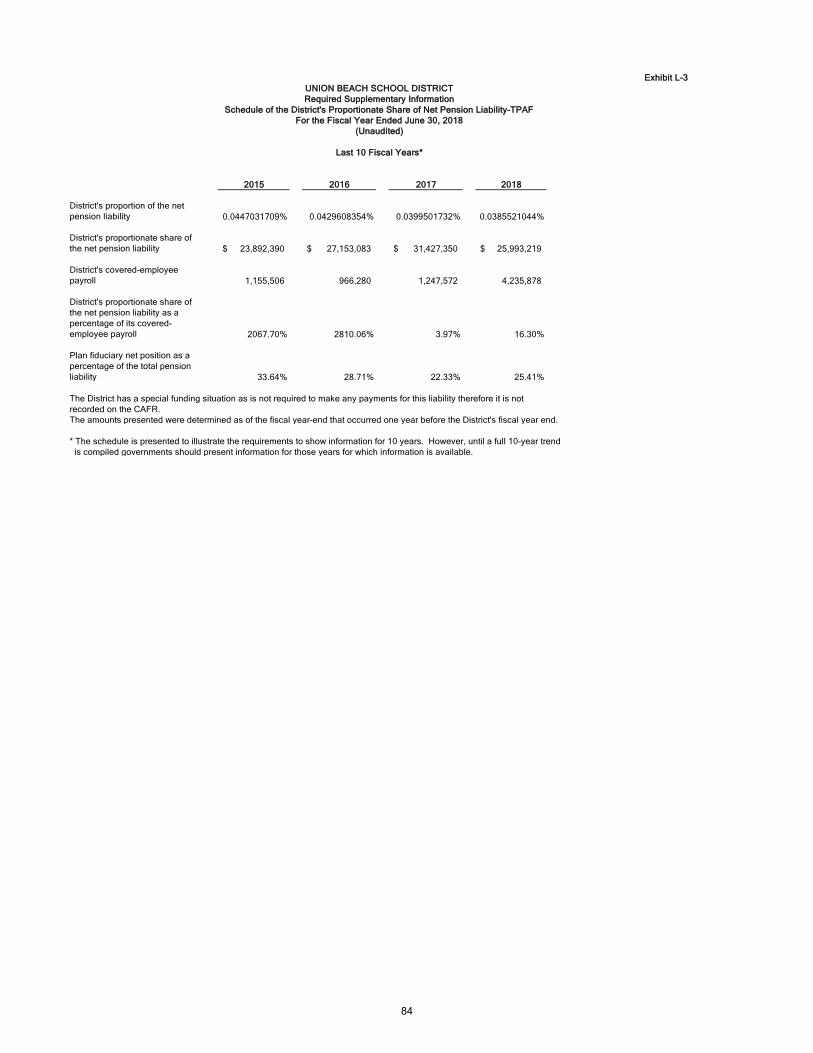
Exhibit L-3
2015 2016 2017 2018
District's proportion of the net
pension liability 0.0447031709% 0.0429608354% 0.0399501732% 0.0385521044%
District's proportionate share of
the net pension liability 23,892,390$ 27,153,083$ 31,427,350$ 25,993,219$
District's covered-employee
payroll 1,155,506 966,280 1,247,572 4,235,878
District's proportionate share of
the net pension liability as a
percentage of its covered-
employee payroll 2067.70% 2810.06% 3.97% 16.30%
Plan fiduciary net position as a
percentage of the total pension
liability 33.64% 28.71% 22.33% 25.41%
The District has a special funding situation as is not required to make any payments for this liability therefore it is not
recorded on the CAFR.
The amounts presented were determined as of the fiscal year-end that occurred one year before the District's fiscal year end.
* The schedule is presented to illustrate the requirements to show information for 10 years. However, until a full 10-year trend
is compiled governments should present information for those years for which information is available.
UNION BEACH SCHOOL DISTRICT
Required Supplementary Information
Schedule of the District's Proportionate Share of Net Pension Liability-TPAF
For the Fiscal Year Ended June 30, 2018
Last 10 Fiscal Years*
(Unaudited)
84
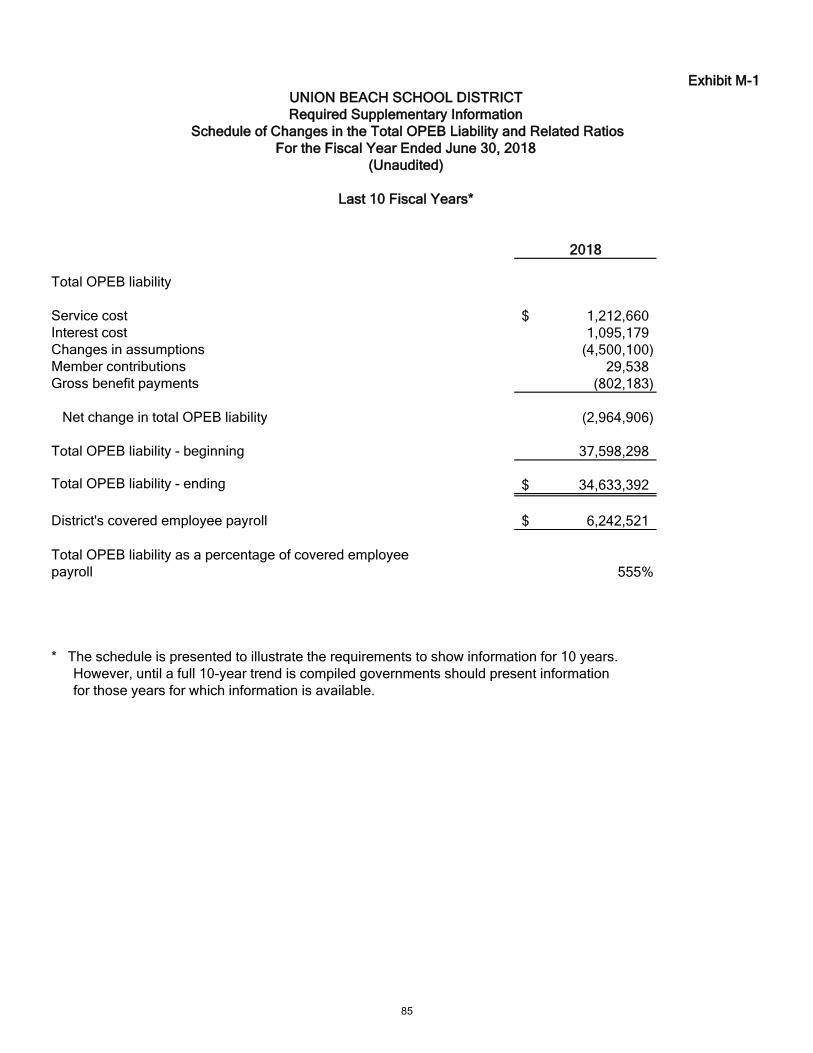
Exhibit M-1
2018
Total OPEB liability
Service cost 1,212,660$
Interest cost 1,095,179
Changes in assumptions (4,500,100)
Member contributions 29,538
Gross benefit payments (802,183)
Net change in total OPEB liability (2,964,906)
Total OPEB liability - beginning 37,598,298
Total OPEB liability - ending 34,633,392$
District's covered employee payroll 6,242,521$
Total OPEB liability as a percentage of covered employee
payroll 555%
* The schedule is presented to illustrate the requirements to show information for 10 years.
However, until a full 10-year trend is compiled governments should present information
for those years for which information is available.
UNION BEACH SCHOOL DISTRICT
Required Supplementary Information
Schedule of Changes in the Total OPEB Liability and Related Ratios
For the Fiscal Year Ended June 30, 2018
Last 10 Fiscal Years*
(Unaudited)
85
Union Beach School District
Notes to Required Supplementary Information - Part III
For the Year Ended June 30, 2018
Notes for TPAF Pension Schedules
Assumptions
The total pension liability for the June 30, 2017 measurement date was determined by anactuarial valuation as of July 1, 2016, which was rolled forward to June 30, 2017. The totalpension liability for the June 30, 2013 measurement date was determined by an actuarialvaluation as of July 1, 2013. This actuarial valuation used the following actuarial assumptions,applied to all periods in the measurement:
Inflation Rate 2.25 %
Salary increases:2012-2021
1.65 - 4.15 %based on age
Thereafter 2.65 - 5.15 %based on age
Investment rate of return 7.00 %
Pre-retirement mortality rates were based on the RP-2000 Employee Preretirement MortalityTable for male and female active participants. For State employees, mortality tables are setback 4 years for males and females. For local employees, mortality tables are set back 2 yearsfor males and 7 years for females. In addition, the tables provide for future improvements inmortality from the base year of 2013 using a generational approach based on the plan actuary'smodified MP-2014 projection scale. Post-retirement mortality rates were based on the RP-2000Combined Healthy and Female Mortality Tables (set back 1 year for males and females) forservice retirements and beneficiaries of former members and a one-year static projection basedon mortality improvement Scale AA. In addition, the tables for service retirements andbeneficiaries of former members provide for future improvements in mortality from the base yearof 2013 using a generational approach based on the plan actuary's modified MP-2014 projectionscale. Disability retirement rates used to value disabled retirees were based on the RP-2000Disabled Mortality Table (set back 3 years for males and set forward 1 year for females).
The actuarial assumptions used in the July 1, 2016 valuation were based on the results of anactuarial experience study for the period July 1, 2011 to June 30, 2014. It is likely that futureexperience will not exactly conform to these assumptions. To the extent that actual experiencedeviates from these assumptions, the emerging liabilities may be higher or lower thananticipated. The more the experience deviates, the larger the impact on future financialstatements.
Notes to OPEB Schedule
Benefit changes: NoneChanges in assumptions: The increase in the liability from June 30, 2015 to June 30, 2016 isdue to the decrease in the assumed discount rate from 3.8% as of June 30, 2015 to 2.85% as ofJune 30, 2016. The decrease in the liability from June 30, 2016 to June 30, 2017 is due to theincrease in the assumed discount rate from 2.85% as of June 30, 2016 to 3.58% as of June 30,2017.
86

OTHER SUPPLEMENTARY INFORMATION
87

D. School Based Budget SchedulesNot Applicable
88

E. Special Revenue Fund
89

Exhibit E-1
UNION BEACH SCHOOL DISTRICT
IDEA-Part
Title I Title II B-Basic
Part A Part A Reg Prog
17/18 17/18 17/18
Revenues:
Local sources -$ -$ -$
State sources - - -
Federal sources 232,494 31,635 241,673
Total revenues 232,494 31,635 241,673
Expenditures:
Instruction:
Salaries of teachers 189,718 4,250 -
Other salaries/instruction - - -
Purchased professional services - - -
General supplies 8,170 - -
Tuition - - 241,673
Textbooks - - -
Miscellaneous expenses - - -
Total instruction 197,888 4,250 241,673
Support services:
Other support services -
students - special:
Other professional
staff salaries - - -
Secretarial/Clerical
salaries - - -
Purchased professional services - 27,060 -
Other purchased professional
services - - -
Purchased technical services - - -
Employee benefits 34,606 325 -
Travel - - -
Miscellaneous purchased services - - -
General supplies - - -
Miscellaneous expenses - - -
Total other support services -
students - special 34,606 27,385 -
Total support services 34,606 27,385 -
Equipment:
Regular programs instruction - - -
Non-instructional equipment - - -
Total equipment - - -
Total expenditures 232,494$ 31,635$ 241,673$
Other financing sources
Transfer from other funds - - -
Total outflows 232,494 31,635 241,673
Excess (deficiency) of revenue over expenses -$ -$ -$
(continued on next page)
Special Revenue Fund
Combining Schedule of Program Revenues and Expenditures - Budgetary Basis
For the Fiscal Year Ended June 30, 2018
90
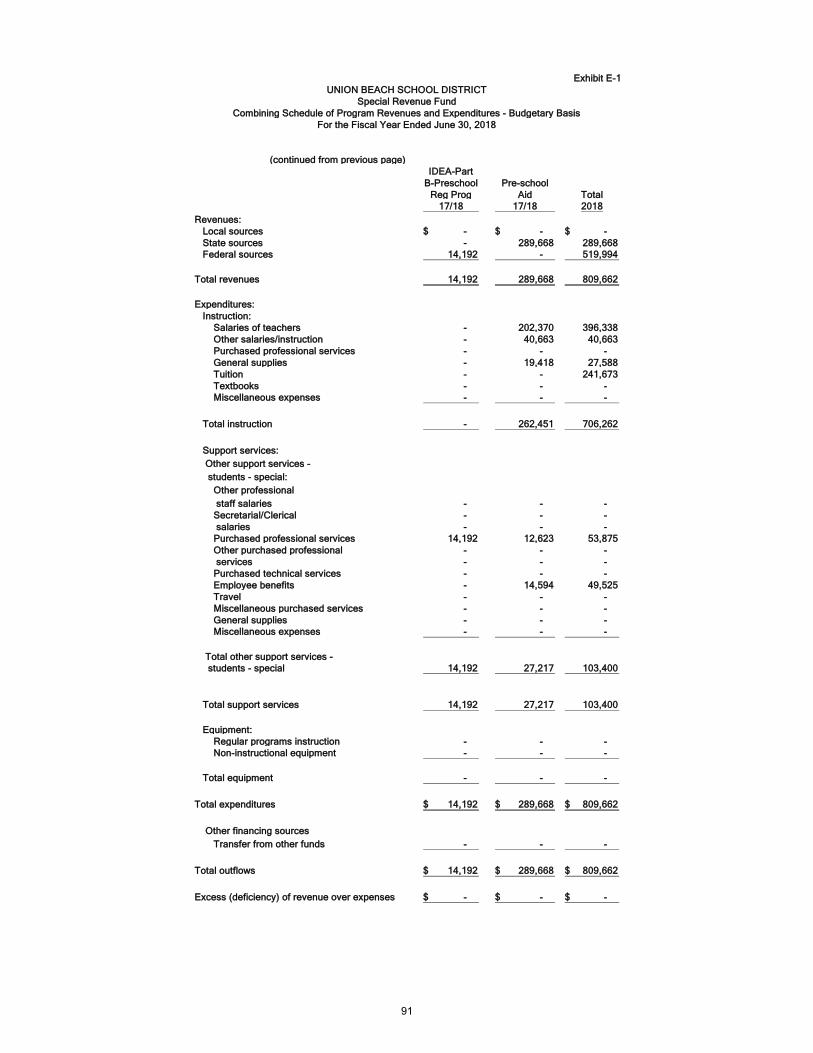
Exhibit E-1
(continued from previous page)
IDEA-Part
B-Preschool Pre-school
Reg Prog Aid Total
17/18 17/18 2018
Revenues:
Local sources -$ -$ -$
State sources - 289,668 289,668
Federal sources 14,192 - 519,994
Total revenues 14,192 289,668 809,662
Expenditures:
Instruction:
Salaries of teachers - 202,370 396,338
Other salaries/instruction - 40,663 40,663
Purchased professional services - - -
General supplies - 19,418 27,588
Tuition - - 241,673
Textbooks - - -
Miscellaneous expenses - - -
Total instruction - 262,451 706,262
Support services:
Other support services -
students - special:
Other professional
staff salaries - - -
Secretarial/Clerical - - -
salaries - - -
Purchased professional services 14,192 12,623 53,875
Other purchased professional - - -
services - - -
Purchased technical services - - -
Employee benefits - 14,594 49,525
Travel - - -
Miscellaneous purchased services - - -
General supplies - - -
Miscellaneous expenses - - -
Total other support services -
students - special 14,192 27,217 103,400
Total support services 14,192 27,217 103,400
Equipment:
Regular programs instruction - - -
Non-instructional equipment - - -
Total equipment - - -
Total expenditures 14,192$ 289,668$ 809,662$
Other financing sources
Transfer from other funds - - -
Total outflows 14,192$ 289,668$ 809,662$
Excess (deficiency) of revenue over expenses -$ -$ -$
UNION BEACH SCHOOL DISTRICT
Special Revenue Fund
Combining Schedule of Program Revenues and Expenditures - Budgetary Basis
For the Fiscal Year Ended June 30, 2018
91

Exhibit E-2
Budget Actual Variance
EXPENDITURES:
Instruction:
Salaries of Teachers 101,338$ 202,370$ (101,032)$
Other Salaries for Instruction 141,695 40,663 101,032
Purchased Professional & Technical Services - - -
Other Purchased Services (400-500 series) - - -
Tuition to Other LEAs Within the State - Regular - - -
General Supplies 27,318 19,418 7,900
Other Objects 113,175 - 113,175
Total instruction 383,526 262,451 121,075
Support services:
Salaries of Program Directors - - -
Salaries of Supervisors of Instruction - - -
Salaries of Other Professional Staff - - -
Salaries of Secr. And Clerical Assistants - - -
Other Salaries - - -
Salaries of Community Parent Involvement Spec. - - -
Salaries of Master Teachers - - -
Personal Services - Employee Benefits 14,594 14,594 -
Purchased Educational Services - Contracted Pre-K - - -
Purchased Professional - Educational Services - - -
Other Purchased Professional Services 24,215 12,623 11,592
Cleaning, Repair, and Maintenance Services - - -
Purchased Technical Services - - -
Rentals - - -
Contr. Serv.-Trans. (Bet. Home & Sch.) - - -
Contr. Serv.-Trans. (Wrap Around Services) - - -
Contr. Serv.-Trans. (Field Trips) - - -
Travel 500 - 500
Other Purchased Services (400-500 series) - - -
Supplies & Materials - - -
Other Objects - - -
Total support services 39,309 27,217 12,092
Facilities acquisition and cont. serv:
Instructional equipment - - -
Noninstructional Equipment - - -
Total Facilities acquisition and cont. serv. - - -
Contribution to Charter Schools - - -
Transfer to General Fund - - -
Total Expenditures 422,835$ 289,668$ 133,167$
CALCULATION OF BUDGET & CARRYOVER
Total 2017-18 PreK/ECPA Aid Allocation 422,835$
Add: Actual PreK/ECPA Aid Carryover June 30, 2017 -
Add: Budgeted Transfer From General Fund -
Total Funds Available for 2017-18 Budget 422,835
Less: 2017-18 Budgeted PreK/ECPA (Including
prior year budgeted carryover) (289,668)
Available & Unbudgeted Funds as of June 30, 2018 133,167
Add: June 30, 2017 Unexpended PreK Aid -
2018- Actual Carryover - PreK Aid 133,167$
2017-18 PreK Aid Carryover Budgeted in 2018-FY -$
Preschool - All Programs
UNION BEACH SCHOOL DISTRICT
For the Fiscal Year Ended June 30, 2018
Budgetary Basis
Schedule of Preschool Education Aid Expenditures
Special Revenue Fund
92
F. Capital Projects FundNot Applicable
93

G. Proprietary Funds
94
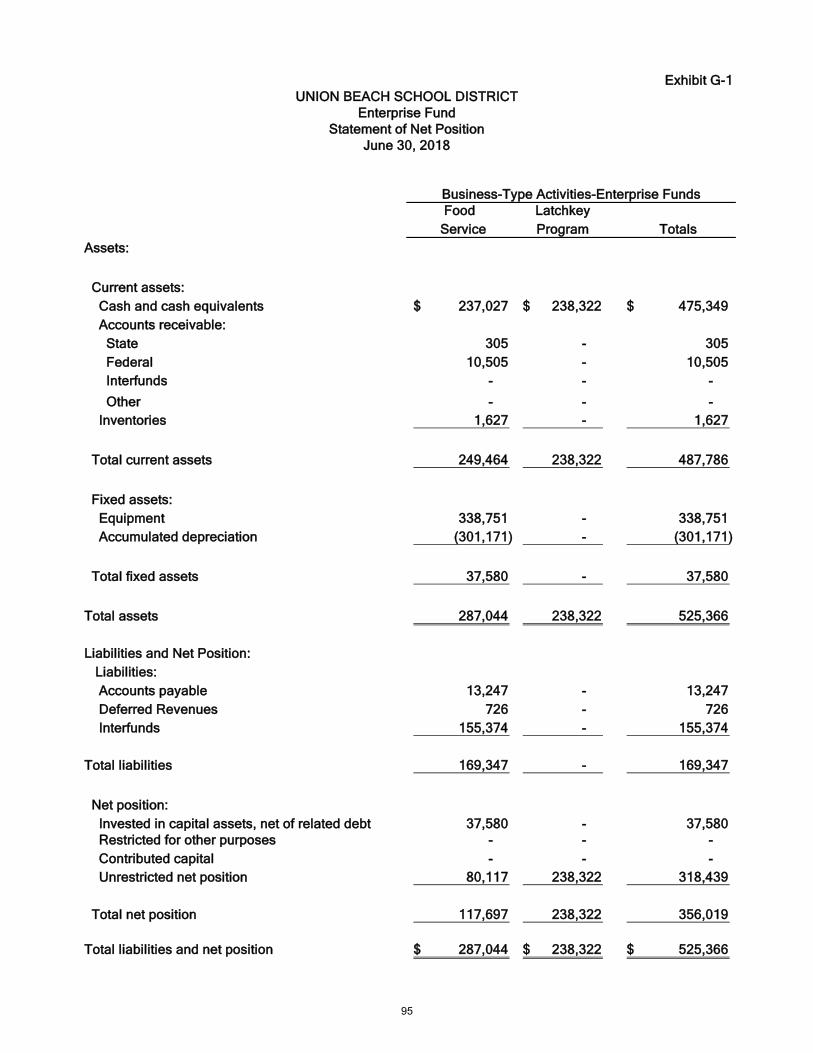
Exhibit G-1
Food Latchkey
Service Program Totals
Assets:
Current assets:
Cash and cash equivalents 237,027$ 238,322$ 475,349$
Accounts receivable:
State 305 - 305
Federal 10,505 - 10,505
Interfunds - - -
Other - - -
Inventories 1,627 - 1,627
Total current assets 249,464 238,322 487,786
Fixed assets:
Equipment 338,751 - 338,751
Accumulated depreciation (301,171) - (301,171)
Total fixed assets 37,580 - 37,580
Total assets 287,044 238,322 525,366
Liabilities and Net Position:
Liabilities:
Accounts payable 13,247 - 13,247
Deferred Revenues 726 - 726
Interfunds 155,374 - 155,374
Total liabilities 169,347 - 169,347
Net position:
Invested in capital assets, net of related debt 37,580 - 37,580
Restricted for other purposes - - -
Contributed capital - - -
Unrestricted net position 80,117 238,322 318,439
Total net position 117,697 238,322 356,019
Total liabilities and net position 287,044$ 238,322$ 525,366$
Business-Type Activities-Enterprise Funds
UNION BEACH SCHOOL DISTRICT
Enterprise Fund
Statement of Net Position
June 30, 2018
95

Exhibit G-2
Business-Type Activities-Enterprise Funds
Food Latchkey
Service Program Totals
Operating revenues:
Tuition -$ 77,865$ 77,865$
Local sources:
Daily sales-reimbursable programs:
School lunch program 120,697 - 120,697
Special milk program - - -
Total-daily sales-reimbursable programs 120,697 77,865 198,562
Daily sales non-reimbursable programs - - -
Total operating revenues 120,697 77,865 198,562
Operating expenses:
Salaries 121,131 63,744 184,875
Employee benefits 13,563 4,876 18,439
Purchased property - - -
Other purchased services 23,044 - 23,044
Supplies and materials 7,108 2,583 9,691
Depreciation 16,938 - 16,938
Cost of sales - reimbursable programs 127,873 - 127,873
Cost of sales - non-reimbursable programs - - -
Total operating expenses 309,657 71,203 380,860
Operating loss (188,960) 6,662 (182,298)
Nonoperating revenues:
Interest income 372 - 372
State sources:
State school lunch program 3,066 - 3,066
Federal sources:
National school lunch program 99,130 - 99,130
National school breakfast program 7,008 - 7,008
U.S.D.A. commodities 20,658 - 20,658
Total nonoperating revenues 130,234 - 130,234
Change in net position (58,726) 6,662 (52,064)
Total net position beginning 176,423 231,660 408,083
Total net position ending 117,697$ 238,322$ 356,019$
UNION BEACH SCHOOL DISTRICT
Food Services Enterprise Fund
Statement of Revenues, Expenses and
Changes in Net Position
for the Fiscal Year Ended June 30, 2018
96

Exhibit G-3
Food Latchkey
Service Program Totals
Cash Flows from Operating Activities:
Receipts from customers and other funds 120,697$ 77,865$ 198,562$
Payments to employees (121,131) (63,744) (184,875)
Payments for employee benefits (13,563) (4,876) (18,439)
Payments to suppliers (61,393) (2,583) (63,976)
Net cash provided by (used for) operating activities (75,390) 6,662 (68,728)
Cash Flows from Noncapital Financing Activities
State sources 2,932 - 2,932
Federal sources 102,075 - 102,075
Net cash provided by (used for) noncapital
financing activities 105,007 - 105,007
Cash Flows from Investing Activities
Interest Income 372 - 372
Net cash provided by (used for)
investing activities 372 - 372
Net increase (decrease) in cash and cash equivalents 29,989 6,662 36,651
Balances-beginning of the year 207,038 231,660 438,698
Balances-end of the year 237,027 238,322 475,349
Reconciliation of operating income (loss) to net cash provided
by (used for) operating activities:
Operating loss (188,960) 6,662 (182,298)
Adjustments to reconcile operating loss
to cash used by operating activities:
Depreciation 16,938 - 16,938
Federal commodities 20,658 - 20,658
Change in assets and liabilities: -
Decrease (increase) in interfund 65,330 - 65,330
Decrease (increase) in accounts receivable - - -
Decrease (increase) in inventory 695 - 695
Increase (decrease) in accounts payable 10,867 - 10,867
Increase (decrease) in deferred revenues (918) - (918)
Total adjustments 113,570 - 113,570
Net cash used by operating activities (75,390)$ 6,662$ (68,728)$
UNION BEACH SCHOOL DISTRICT
Food Services Enterprise Fund
Statement of Cash Flows
for the Fiscal Year ended June 30, 2018
Business-Type Activities-Enterprise Funds
97

H. Fiduciary Funds
98

Exhibit H-1
Unemployment Student Payroll Total
Compensation Trust Activity Agency
ASSETS
Cash and cash equivalents 35,338$ 35,699$ 8,090$ 79,127$
Intergovernmental Accounts Receivable - - - -
Interfund receivable - - - -
Total assets 35,338 35,699 8,090 79,127
LIABILITIES
Accounts payable -$ -$ -$ -$
Payroll deductions and withholdings - - 3,646 3,646
Payable to student groups - 35,699 - 35,699
Interfund payable 20,151 - 4,414 24,565
Other current liabilities - - 30 30
-
Total liabilities 20,151 35,699 8,090 63,940
NET POSITION
Held in trust for unemployment
claims and other purposes 15,187 - - 15,187
Reserved for scholarships - - - -
Total net position 15,187 - - 15,187
Total liabilities and net position 35,338$ 35,699$ 8,090$ 79,127$
UNION BEACH SCHOOL DISTRICT
Statement of Agency Fund Assets, Liabilities and Net Position
Fiduciary Funds
June 30, 2018
Trust Agency
99
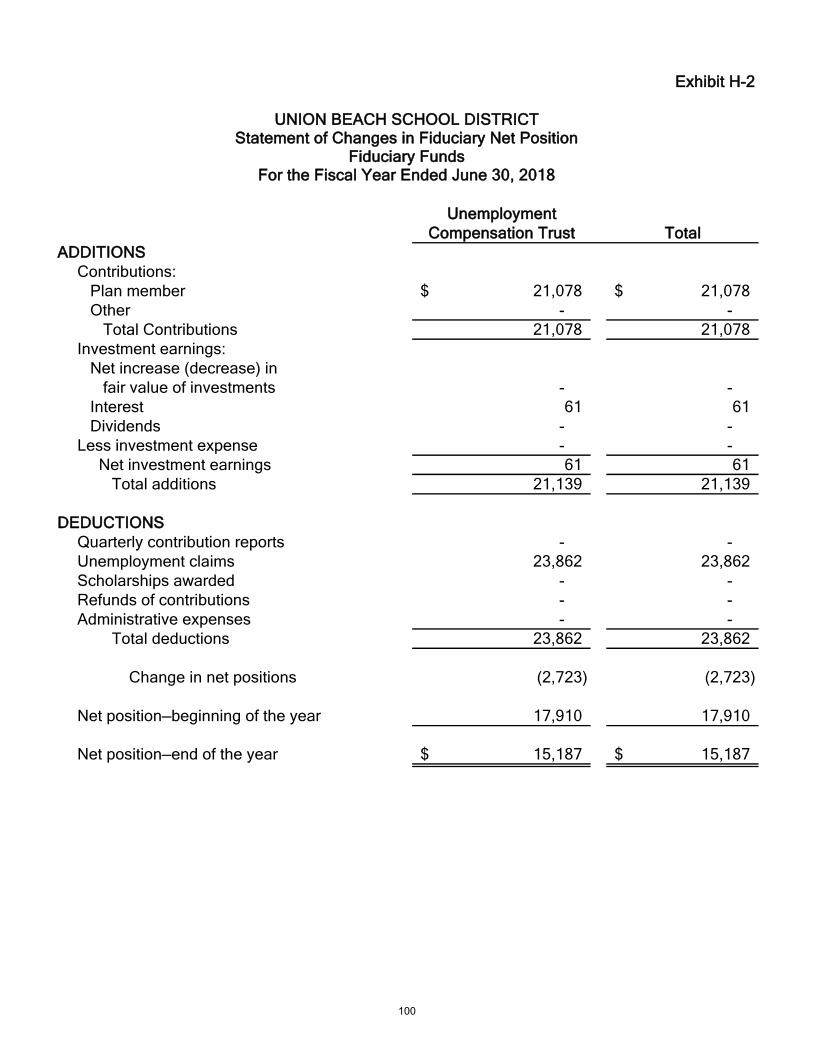
Exhibit H-2
Unemployment
Compensation Trust Total
ADDITIONS
Contributions:
Plan member 21,078$ 21,078$
Other - -
Total Contributions 21,078 21,078
Investment earnings:
Net increase (decrease) in
fair value of investments - -
Interest 61 61
Dividends - -
Less investment expense - -
Net investment earnings 61 61
Total additions 21,139 21,139
DEDUCTIONS
Quarterly contribution reports - -
Unemployment claims 23,862 23,862
Scholarships awarded - -
Refunds of contributions - -
Administrative expenses - -
Total deductions 23,862 23,862
Change in net positions (2,723) (2,723)
Net position—beginning of the year 17,910 17,910
Net position—end of the year 15,187$ 15,187$
UNION BEACH SCHOOL DISTRICTStatement of Changes in Fiduciary Net Position
Fiduciary FundsFor the Fiscal Year Ended June 30, 2018
100

Exhibit H-3
Balance Balance
July 1, 2017 Receipts Disbursements June 30, 2018
Due to Student Groups 35,243$ 70,447 69,991 35,699$
Total all schools 35,243$ 70,447 69,991 35,699$
For the Fiscal Year Ended June 30, 2018
Schedule of Receipts and Disbursements
Student Activity Agency Fund
UNION BEACH SCHOOL DISTRICT
101

Exhibit H-4
Balance Cash Cash Balance
July 1, 2017 Receipts Disbursements June 30, 2018
Interfund Accounts Payable 4,414$ - - 4,414$
Accrued Salaries and Benefits 23 6,869,715 6,869,708 30
Payroll deductions and withholdings 6,143 3,753,170 3,755,667 3,646
Total 10,580$ 10,622,885 10,625,375 8,090$
UNION BEACH SCHOOL DISTRICT
Payroll Agency and Payroll Account Funds
Schedule of Receipts and Disbursements
For the Fiscal Year Ended June 30, 2018
102

I. Long-Term Debt
103
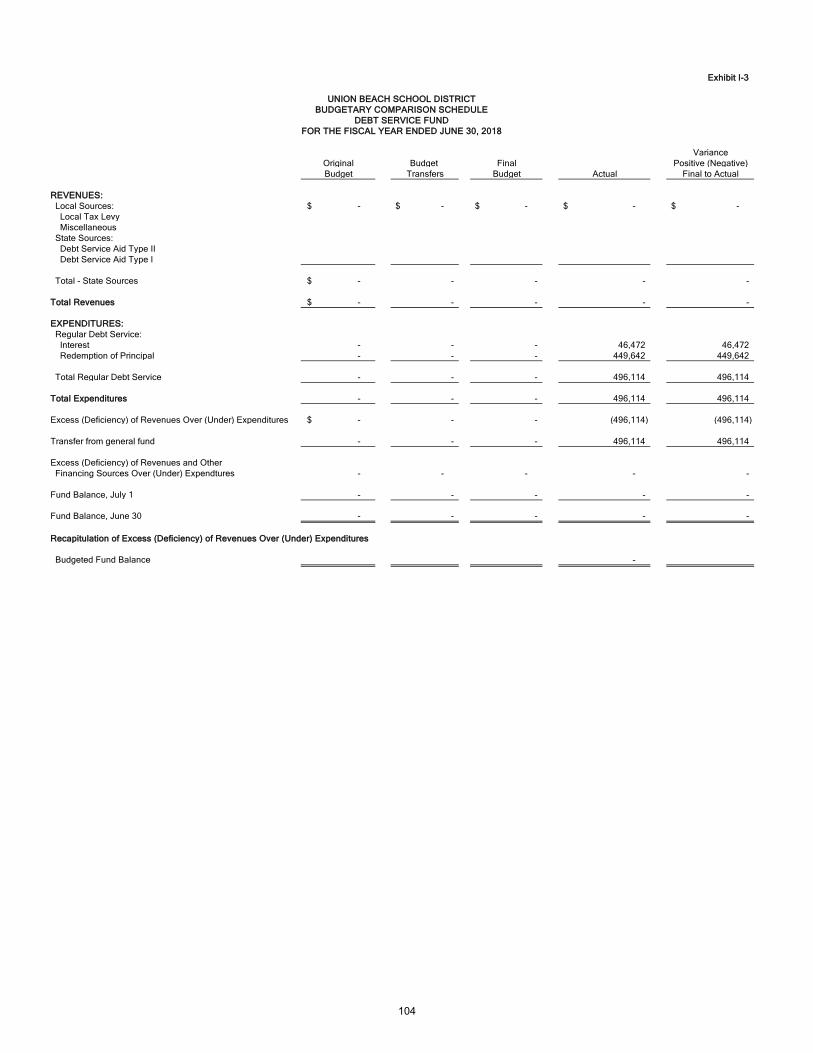
Exhibit I-3
Variance
Original Budget Final Positive (Negative)
Budget Transfers Budget Actual Final to Actual
REVENUES:
Local Sources: -$ -$ -$ -$ -$
Local Tax Levy
Miscellaneous
State Sources:
Debt Service Aid Type II
Debt Service Aid Type I
Total - State Sources -$ - - - -
Total Revenues -$ - - - -
EXPENDITURES:
Regular Debt Service:
Interest - - - 46,472 46,472
Redemption of Principal - - - 449,642 449,642
Total Regular Debt Service - - - 496,114 496,114
Total Expenditures - - - 496,114 496,114
Excess (Deficiency) of Revenues Over (Under) Expenditures -$ - - (496,114) (496,114)
Transfer from general fund - - - 496,114 496,114
Excess (Deficiency) of Revenues and Other
Financing Sources Over (Under) Expendtures - - - - -
Fund Balance, July 1 - - - - -
Fund Balance, June 30 - - - - -
Recapitulation of Excess (Deficiency) of Revenues Over (Under) Expenditures
Budgeted Fund Balance -
UNION BEACH SCHOOL DISTRICT
BUDGETARY COMPARISON SCHEDULE
DEBT SERVICE FUND
FOR THE FISCAL YEAR ENDED JUNE 30, 2018
104
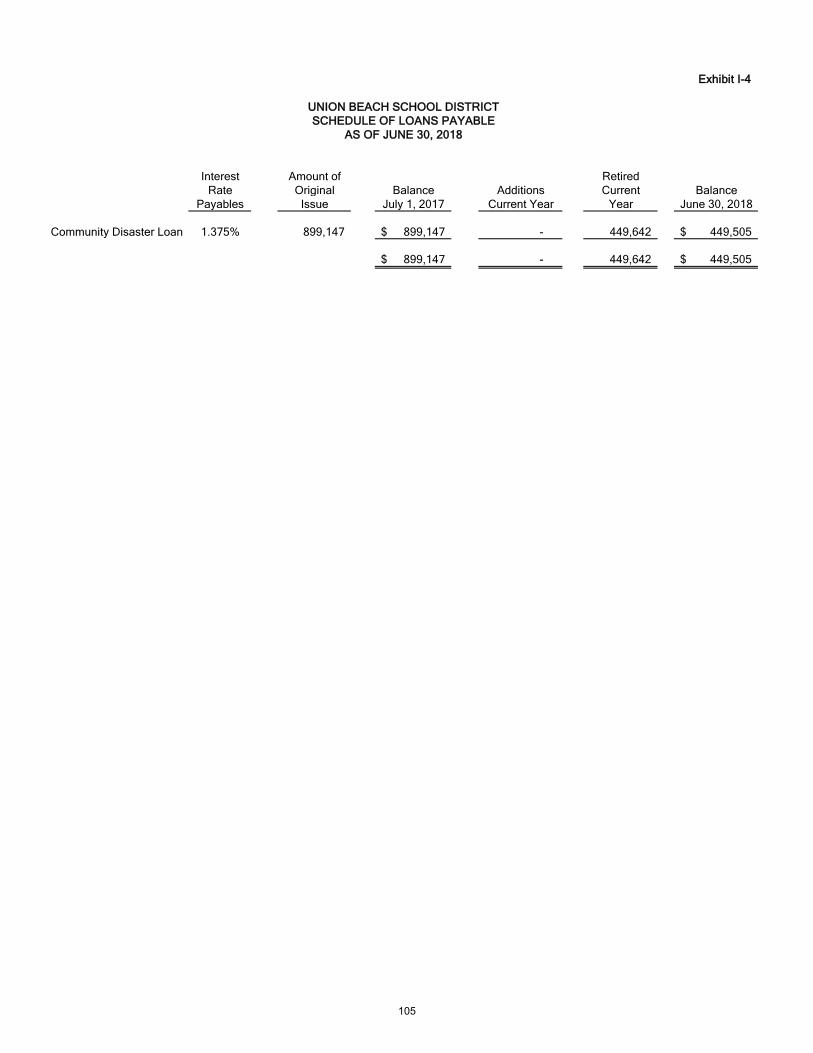
Exhibit I-4
Interest Amount of Retired
Rate Original Balance Additions Current Balance
Payables Issue July 1, 2017 Current Year Year June 30, 2018
Community Disaster Loan 1.375% 899,147 899,147$ - 449,642 449,505$
899,147$ - 449,642 449,505$
UNION BEACH SCHOOL DISTRICT
SCHEDULE OF LOANS PAYABLE
AS OF JUNE 30, 2018
105

STATISTICAL SECTION
106
J series
Contents Pages
Financial Trends 108-112
Revenue Capacity 113-116
Debt Capacity 117-120
Demographic and Economic Information 121-122
Operating Information 123-127
Union Beach School District
Statistical Section
These schedules contain service and infrastructure
data to help the reader understand how the
information in the district's financial report relates to
the services the district provides and the activities it
Sources: Unless otherwise noted, the information in these schedules is derived from the comprehensive annual financial reports (CAFR) for the relevant year. The district implemented GASB Statement 34 in the fiscal year ending June 30, 2003; schedules presenting district-wide information include information beginning in that year.
These schedules contain trend information to help
the reader understand how the district's financial
performance and well being have changed over
These schedules contain information to help the
reader assess the district's most significant local
revenue source, the property tax.
These schedules present information to help the
reader assess the affordability of the district' s
current levels of outstanding debt and the district's
These schedules offer demographic and economic
indicators to help the reader understand the
environment within which the district's financial
107
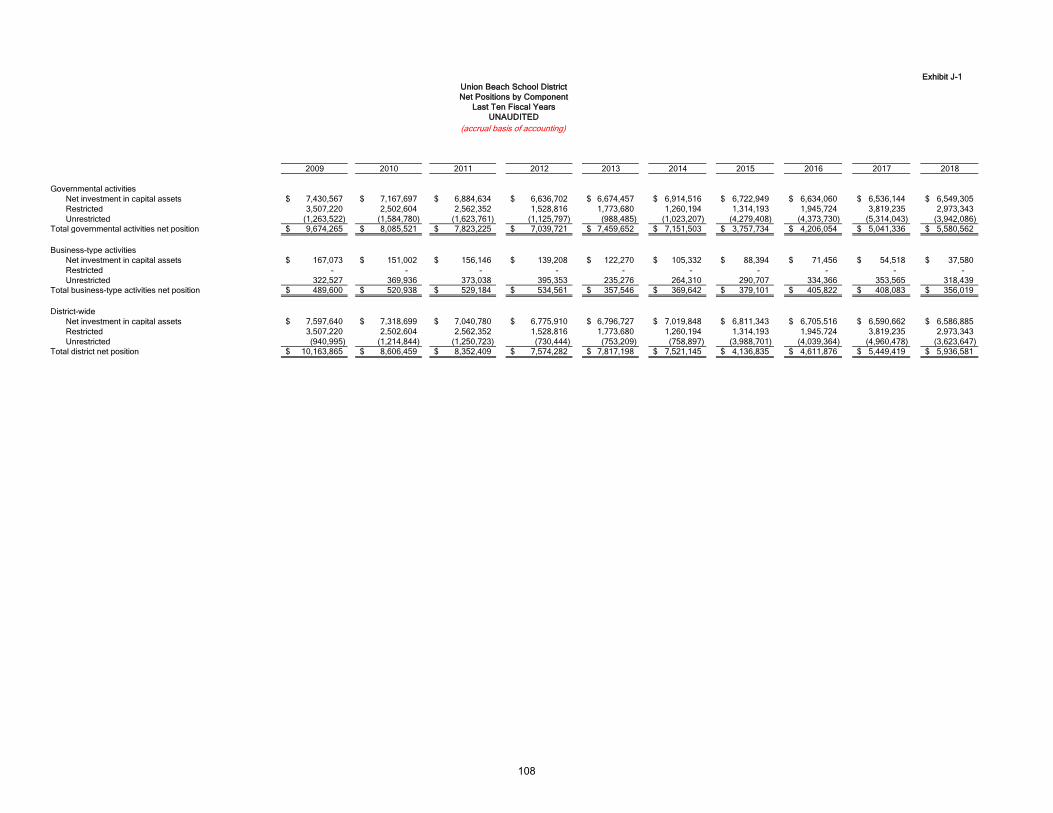
Exhibit J-1
2009 2010 2011 2012 2013 2014 2015 2016 2017 2018
Governmental activities
Net investment in capital assets 7,430,567$ 7,167,697$ 6,884,634$ 6,636,702$ 6,674,457$ 6,914,516$ 6,722,949$ 6,634,060$ 6,536,144$ 6,549,305$
Restricted 3,507,220 2,502,604 2,562,352 1,528,816 1,773,680 1,260,194 1,314,193 1,945,724 3,819,235 2,973,343
Unrestricted (1,263,522) (1,584,780) (1,623,761) (1,125,797) (988,485) (1,023,207) (4,279,408) (4,373,730) (5,314,043) (3,942,086)
Total governmental activities net position 9,674,265$ 8,085,521$ 7,823,225$ 7,039,721$ 7,459,652$ 7,151,503$ 3,757,734$ 4,206,054$ 5,041,336$ 5,580,562$
Business-type activities
Net investment in capital assets 167,073$ 151,002$ 156,146$ 139,208$ 122,270$ 105,332$ 88,394$ 71,456$ 54,518$ 37,580$
Restricted - - - - - - - - - -
Unrestricted 322,527 369,936 373,038 395,353 235,276 264,310 290,707 334,366 353,565 318,439
Total business-type activities net position 489,600$ 520,938$ 529,184$ 534,561$ 357,546$ 369,642$ 379,101$ 405,822$ 408,083$ 356,019$
District-wide
Net investment in capital assets 7,597,640$ 7,318,699$ 7,040,780$ 6,775,910$ 6,796,727$ 7,019,848$ 6,811,343$ 6,705,516$ 6,590,662$ 6,586,885$
Restricted 3,507,220 2,502,604 2,562,352 1,528,816 1,773,680 1,260,194 1,314,193 1,945,724 3,819,235 2,973,343
Unrestricted (940,995) (1,214,844) (1,250,723) (730,444) (753,209) (758,897) (3,988,701) (4,039,364) (4,960,478) (3,623,647)
Total district net position 10,163,865$ 8,606,459$ 8,352,409$ 7,574,282$ 7,817,198$ 7,521,145$ 4,136,835$ 4,611,876$ 5,449,419$ 5,936,581$
Union Beach School District
Net Positions by Component
Last Ten Fiscal Years
UNAUDITED
(accrual basis of accounting)
108
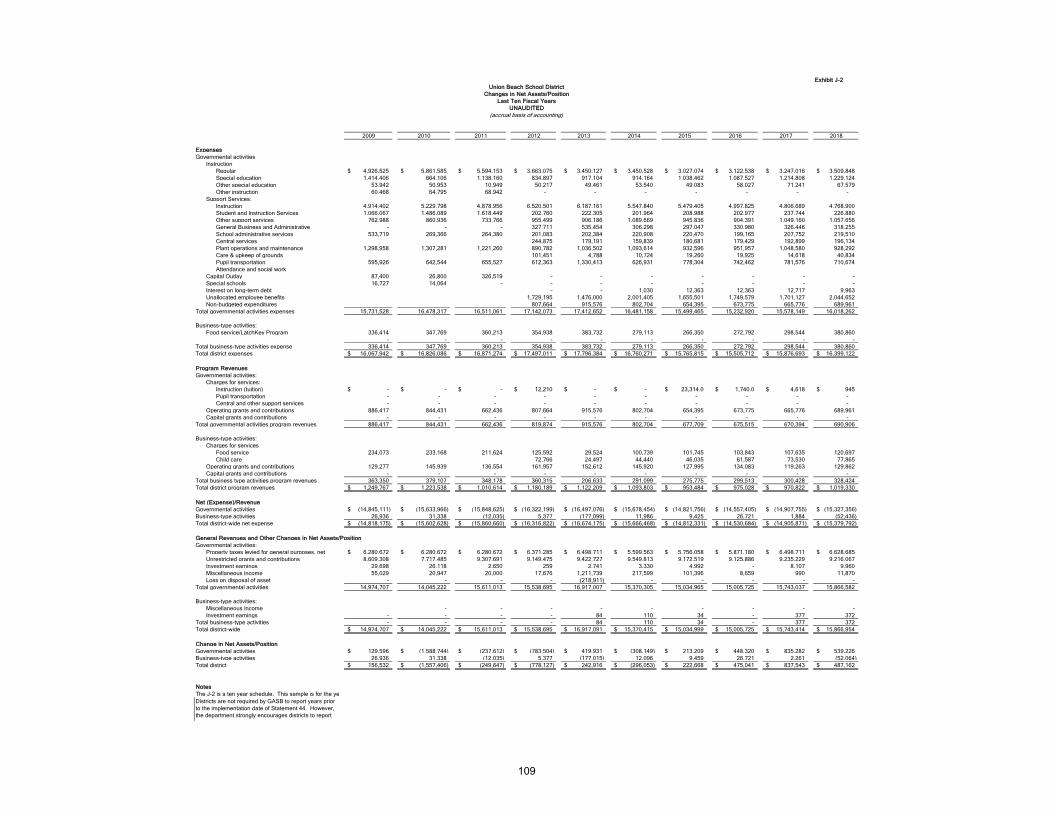
Exhibit J-2
2009 2010 2011 2012 2013 2014 2015 2016 2017 2018
Expenses
Governmental activities
Instruction
Regular 4,926,525$ 5,861,585$ 5,594,153$ 3,663,075$ 3,450,127$ 3,450,528$ 3,027,074$ 3,122,538$ 3,247,016$ 3,509,848$
Special education 1,414,406 664,106 1,138,160 834,897 917,104 914,164 1,038,462 1,087,527 1,214,808 1,229,124
Other special education 53,942 50,953 10,949 50,217 49,461 53,540 49,083 58,027 71,241 67,579
Other instruction 60,468 64,795 68,942 - - - - - - -
Support Services:
Instruction 4,914,402 5,229,798 4,878,956 6,520,501 6,187,161 5,547,840 5,479,405 4,997,825 4,806,689 4,768,900
Student and Instruction Services 1,066,067 1,486,089 1,618,449 202,760 222,305 201,964 208,988 202,977 237,744 226,880
Other support services 762,988 860,936 733,766 955,499 906,186 1,089,669 945,836 904,391 1,049,160 1,057,656
General Business and Administrative - - - 327,711 535,454 306,298 297,047 330,980 326,446 318,255
School administrative services 533,719 269,366 264,380 201,083 202,384 220,908 220,470 199,165 207,752 219,510
Central services 244,875 179,191 159,839 180,681 179,429 192,899 196,134
Plant operations and maintenance 1,298,958 1,307,281 1,221,260 890,782 1,036,502 1,093,614 932,596 951,957 1,048,580 928,292
Care & upkeep of grounds 101,451 4,788 10,724 19,260 19,925 14,618 40,834
Pupil transportation 595,926 642,544 655,527 612,363 1,330,413 626,931 778,304 742,462 781,576 710,674
Attendance and social work
Capital Outlay 87,400 26,800 326,519 - - - - - - -
Special schools 16,727 14,064 - - - - - - - -
Interest on long-term debt - - 1,030 12,363 12,363 12,717 9,963
Unallocated employee benefits 1,729,195 1,476,000 2,001,405 1,655,501 1,749,579 1,701,127 2,044,652
Non-budgeted expenditures 807,664 915,576 802,704 654,395 673,775 665,776 689,961
Total governmental activities expenses 15,731,528 16,478,317 16,511,061 17,142,073 17,412,652 16,481,158 15,499,465 15,232,920 15,578,149 16,018,262
Business-type activities:
Food service/LatchKey Program 336,414 347,769 360,213 354,938 383,732 279,113 266,350 272,792 298,544 380,860
- - - - - - - - - -
Total business-type activities expense 336,414 347,769 360,213 354,938 383,732 279,113 266,350 272,792 298,544 380,860
Total district expenses 16,067,942$ 16,826,086$ 16,871,274$ 17,497,011$ 17,796,384$ 16,760,271$ 15,765,815$ 15,505,712$ 15,876,693$ 16,399,122$
Program Revenues
Governmental activities:
Charges for services:
Instruction (tuition) -$ -$ -$ 12,210$ -$ -$ 23,314.0$ 1,740.0$ 4,618$ 945$
Pupil transportation - - - - - - - - - -
Central and other support services - - - - - - - - - -
Operating grants and contributions 886,417 844,431 662,436 807,664 915,576 802,704 654,395 673,775 665,776 689,961
Capital grants and contributions - - - - - - - - - -
Total governmental activities program revenues 886,417 844,431 662,436 819,874 915,576 802,704 677,709 675,515 670,394 690,906
Business-type activities:
Charges for services
Food service 234,073 233,168 211,624 125,592 29,524 100,739 101,745 103,843 107,635 120,697
Child care 72,766 24,497 44,440 46,035 61,587 73,530 77,865
Operating grants and contributions 129,277 145,939 136,554 161,957 152,612 145,920 127,995 134,083 119,263 129,862
Capital grants and contributions - - - - - - - - - -
Total business type activities program revenues 363,350 379,107 348,178 360,315 206,633 291,099 275,775 299,513 300,428 328,424
Total district program revenues 1,249,767$ 1,223,538$ 1,010,614$ 1,180,189$ 1,122,209$ 1,093,803$ 953,484$ 975,028$ 970,822$ 1,019,330$
Net (Expense)/Revenue
Governmental activities (14,845,111)$ (15,633,966)$ (15,848,625)$ (16,322,199)$ (16,497,076)$ (15,678,454)$ (14,821,756)$ (14,557,405)$ (14,907,755)$ (15,327,356)$
Business-type activities 26,936 31,338 (12,035) 5,377 (177,099) 11,986 9,425 26,721 1,884 (52,436)
Total district-wide net expense (14,818,175)$ (15,602,628)$ (15,860,660)$ (16,316,822)$ (16,674,175)$ (15,666,468)$ (14,812,331)$ (14,530,684)$ (14,905,871)$ (15,379,792)$
General Revenues and Other Changes in Net Assets/Position
Governmental activities:
Property taxes levied for general purposes, net 6,280,672$ 6,280,672$ 6,280,672$ 6,371,285$ 6,498,711$ 5,599,563$ 5,756,058$ 5,871,180$ 6,498,711$ 6,628,685$
Unrestricted grants and contributions 8,609,308 7,717,485 9,307,691 9,149,475 9,422,727 9,549,813 9,172,519 9,125,886 9,235,229 9,216,067
Investment earnings 29,698 26,118 2,650 259 2,741 3,330 4,992 - 8,107 9,960
Miscellaneous income 55,029 20,947 20,000 17,676 1,211,739 217,599 101,396 8,659 990 11,870
Loss on disposal of asset - - - - (218,911) - - - - -
Total governmental activities 14,974,707 14,045,222 15,611,013 15,538,695 16,917,007 15,370,305 15,034,965 15,005,725 15,743,037 15,866,582
Business-type activities:
Miscellaneous Income - - - - - - - - -
Investment earnings - - - - 84 110 34 - 377 372
Total business-type activities - - - - 84 110 34 - 377 372
Total district-wide 14,974,707$ 14,045,222$ 15,611,013$ 15,538,695$ 16,917,091$ 15,370,415$ 15,034,999$ 15,005,725$ 15,743,414$ 15,866,954$
Change in Net Assets/Position
Governmental activities 129,596$ (1,588,744)$ (237,612)$ (783,504)$ 419,931$ (308,149)$ 213,209$ 448,320$ 835,282$ 539,226$
Business-type activities 26,936 31,338 (12,035) 5,377 (177,015) 12,096 9,459 26,721 2,261 (52,064)
Total district 156,532$ (1,557,406)$ (249,647)$ (778,127)$ 242,916$ (296,053)$ 222,668$ 475,041$ 837,543$ 487,162$
Notes
Districts are not required by GASB to report years prior
to the implementation date of Statement 44. However,
the department strongly encourages districts to report
retroactively back to the year they implemented
The J-2 is a ten year schedule. This sample is for the year of implementation of GASBS 44.
Union Beach School District
Changes in Net Assets/Position
Last Ten Fiscal Years
UNAUDITED
(accrual basis of accounting)
109

Exhibit J-3
2009 2010 2011 2012 2013 2014 2015 2016 2017 2018
General Fund
Restricted -$ -$ -$ -$ -$ -$ -$ -$ 3,076,309$ 3,715,786$
Committed - - - - - - - - - -
Assigned - - - - - - - - 761,269 160,568
Unassigned - - - - - - - - (396,782) (381,652)
Reserved 3,527,967 2,522,074 2,143,918 1,575,284 1,788,149 2,182,930 2,682,507 3,006,219 - -
Unreserved (472,070) (812,556) (448,141) (400,800) (521,114) (477,956) (469,633) (497,515) - -
Total general fund 3,055,897$ 1,709,518$ 1,695,777$ 1,174,484$ 1,267,035$ 1,704,974$ 2,212,874$ 2,508,704$ 3,440,796$ 3,494,702$
All Other Governmental Funds
Reserved -$ -$ -$ -$ -$ -$ -$ -$ -$ -$
Restricted
Special revenue fund - - - - - - - - (18,343) (45,926)
Debt service fund - - - - - - - - - -
Unreserved, reported in:
Special revenue fund (20,747) (20,970) (25,681) (46,468) (14,469) (23,589) (14,850) (10,415) - -
Debt service fund - - - - - - - - - -
Total all other governmental funds (20,747)$ (20,970)$ (25,681)$ (46,468)$ (14,469)$ (23,589)$ (14,850)$ (10,415)$ (18,343)$ (45,926)$
Union Beach School District
Fund Balances, Governmental Funds,
Last Ten Fiscal Years
UNAUDITED
(modified accrual basis of accounting)
110
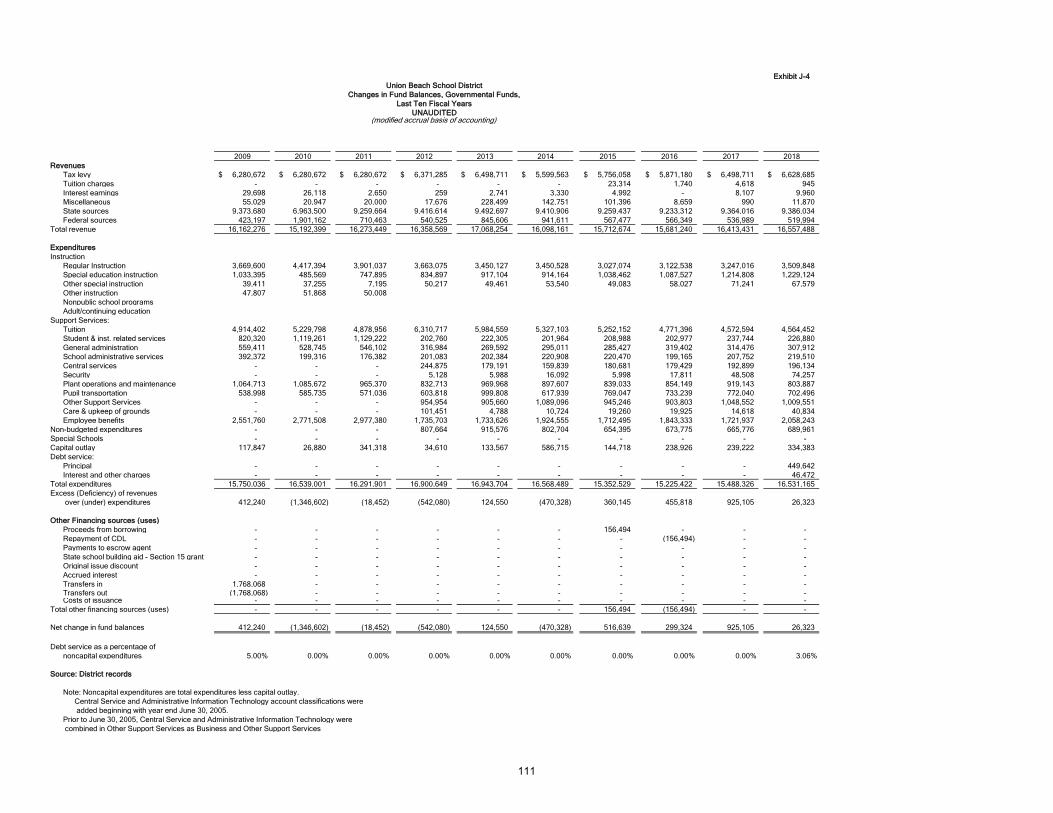
Exhibit J-4
2009 2010 2011 2012 2013 2014 2015 2016 2017 2018
Revenues
Tax levy 6,280,672$ 6,280,672$ 6,280,672$ 6,371,285$ 6,498,711$ 5,599,563$ 5,756,058$ 5,871,180$ 6,498,711$ 6,628,685$
Tuition charges - - - - - - 23,314 1,740 4,618 945
Interest earnings 29,698 26,118 2,650 259 2,741 3,330 4,992 - 8,107 9,960
Miscellaneous 55,029 20,947 20,000 17,676 228,499 142,751 101,396 8,659 990 11,870
State sources 9,373,680 6,963,500 9,259,664 9,416,614 9,492,697 9,410,906 9,259,437 9,233,312 9,364,016 9,386,034
Federal sources 423,197 1,901,162 710,463 540,525 845,606 941,611 567,477 566,349 536,989 519,994
Total revenue 16,162,276 15,192,399 16,273,449 16,358,569 17,068,254 16,098,161 15,712,674 15,681,240 16,413,431 16,557,488
Expenditures
Instruction
Regular Instruction 3,669,600 4,417,394 3,901,037 3,663,075 3,450,127 3,450,528 3,027,074 3,122,538 3,247,016 3,509,848
Special education instruction 1,033,395 485,569 747,895 834,897 917,104 914,164 1,038,462 1,087,527 1,214,808 1,229,124
Other special instruction 39,411 37,255 7,195 50,217 49,461 53,540 49,083 58,027 71,241 67,579
Other instruction 47,807 51,868 50,008
Nonpublic school programs
Adult/continuing education
Support Services:
Tuition 4,914,402 5,229,798 4,878,956 6,310,717 5,984,559 5,327,103 5,252,152 4,771,396 4,572,594 4,564,452
Student & inst. related services 820,320 1,119,261 1,129,222 202,760 222,305 201,964 208,988 202,977 237,744 226,880
General administration 559,411 528,745 546,102 316,984 269,592 295,011 285,427 319,402 314,476 307,912
School administrative services 392,372 199,316 176,382 201,083 202,384 220,908 220,470 199,165 207,752 219,510
Central services - - - 244,875 179,191 159,839 180,681 179,429 192,899 196,134
Security - - - 5,128 5,988 16,092 5,998 17,811 48,508 74,257
Plant operations and maintenance 1,064,713 1,085,672 965,370 832,713 969,968 897,607 839,033 854,149 919,143 803,887
Pupil transportation 538,998 585,735 571,036 603,818 999,808 617,939 769,047 733,239 772,040 702,496
Other Support Services - - - 954,954 905,660 1,089,096 945,246 903,803 1,048,552 1,009,551
Care & upkeep of grounds - - - 101,451 4,788 10,724 19,260 19,925 14,618 40,834
Employee benefits 2,551,760 2,771,508 2,977,380 1,735,703 1,733,626 1,924,555 1,712,495 1,843,333 1,721,937 2,058,243
Non-budgeted expenditures - - - 807,664 915,576 802,704 654,395 673,775 665,776 689,961
Special Schools - - - - - - - - - -
Capital outlay 117,847 26,880 341,318 34,610 133,567 586,715 144,718 238,926 239,222 334,383
Debt service:
Principal - - - - - - - - - 449,642
Interest and other charges - - - - - - - - - 46,472
Total expenditures 15,750,036 16,539,001 16,291,901 16,900,649 16,943,704 16,568,489 15,352,529 15,225,422 15,488,326 16,531,165
Excess (Deficiency) of revenues
over (under) expenditures 412,240 (1,346,602) (18,452) (542,080) 124,550 (470,328) 360,145 455,818 925,105 26,323
Other Financing sources (uses)
Proceeds from borrowing - - - - - - 156,494 - - -
Repayment of CDL - - - - - - - (156,494) - -
Payments to escrow agent - - - - - - - - - -
State school building aid - Section 15 grant - - - - - - - - - -
Original issue discount - - - - - - - - - -
Accrued interest - - - - - - - - - -
Transfers in 1,768,068 - - - - - - - - - Transfers out (1,768,068) - - - - - - - - - Costs of issuance - - - - - - - - - -
Total other financing sources (uses) - - - - - - 156,494 (156,494) - -
Net change in fund balances 412,240 (1,346,602) (18,452) (542,080) 124,550 (470,328) 516,639 299,324 925,105 26,323
Debt service as a percentage of
noncapital expenditures 5.00% 0.00% 0.00% 0.00% 0.00% 0.00% 0.00% 0.00% 0.00% 3.06%
Source: District records
Note: Noncapital expenditures are total expenditures less capital outlay.
Central Service and Administrative Information Technology account classifications were
added beginning with year end June 30, 2005.
Prior to June 30, 2005, Central Service and Administrative Information Technology were
combined in Other Support Services as Business and Other Support Services
Union Beach School District
Changes in Fund Balances, Governmental Funds,
Last Ten Fiscal Years
(modified accrual basis of accounting)UNAUDITED
111
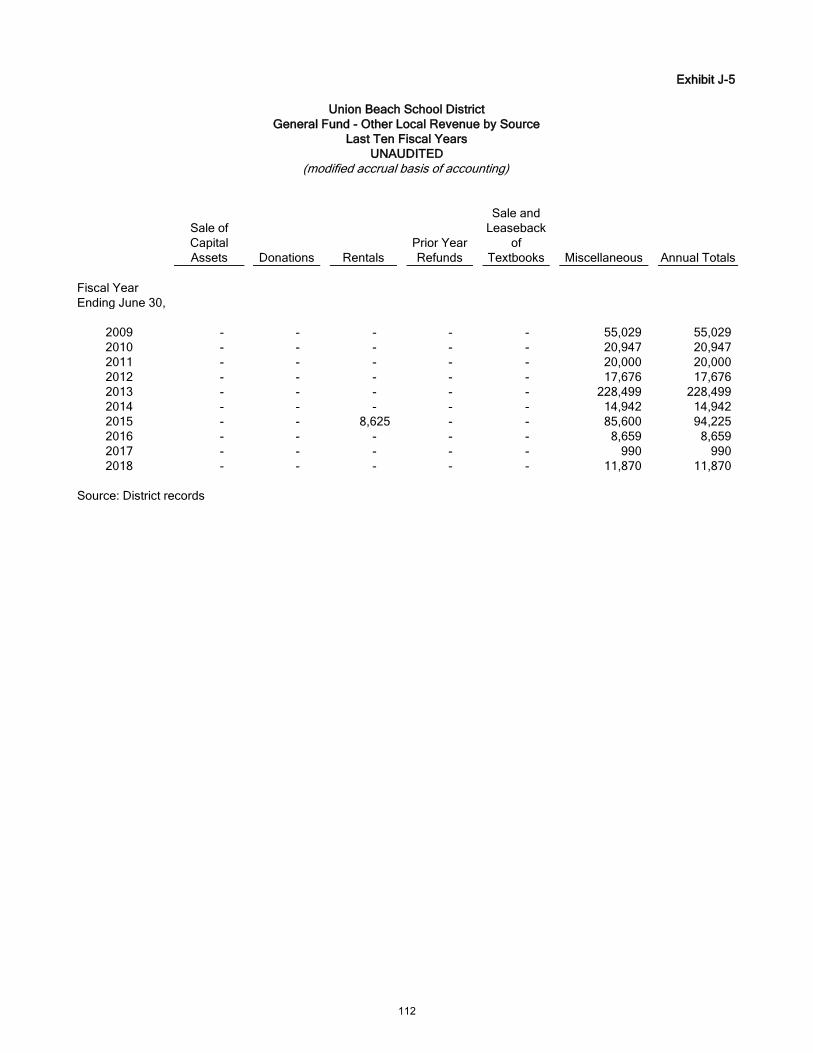
Exhibit J-5
Sale of
Capital
Assets Donations Rentals
Prior Year
Refunds
Sale and
Leaseback
of
Textbooks Miscellaneous Annual Totals
Fiscal Year
Ending June 30,
2009 - - - - - 55,029 55,029
2010 - - - - - 20,947 20,947
2011 - - - - - 20,000 20,000
2012 - - - - - 17,676 17,676
2013 - - - - - 228,499 228,499
2014 - - - - - 14,942 14,942
2015 - - 8,625 - - 85,600 94,225
2016 - - - - - 8,659 8,659
2017 - - - - - 990 990
2018 - - - - - 11,870 11,870
Source: District records
Union Beach School District
General Fund - Other Local Revenue by Source
Last Ten Fiscal Years
(modified accrual basis of accounting)UNAUDITED
112
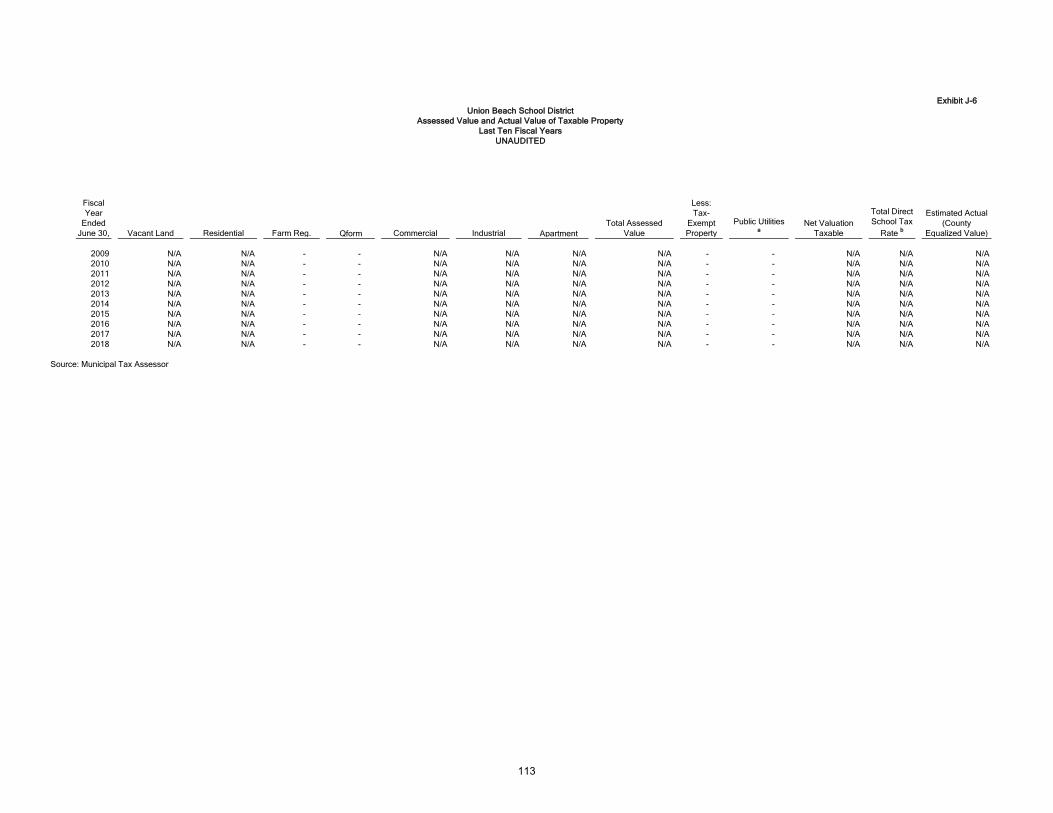
Exhibit J-6
Fiscal
Year
Ended
June 30, Vacant Land Residential Farm Reg. Qform Commercial Industrial Apartment
Total Assessed
Value
Less:
Tax-
Exempt
Property
Public Utilities a
Net Valuation
Taxable
Total Direct
School Tax
Rate b
Estimated Actual
(County
Equalized Value)
2009 N/A N/A - - N/A N/A N/A N/A - - N/A N/A N/A
2010 N/A N/A - - N/A N/A N/A N/A - - N/A N/A N/A
2011 N/A N/A - - N/A N/A N/A N/A - - N/A N/A N/A
2012 N/A N/A - - N/A N/A N/A N/A - - N/A N/A N/A
2013 N/A N/A - - N/A N/A N/A N/A - - N/A N/A N/A
2014 N/A N/A - - N/A N/A N/A N/A - - N/A N/A N/A
2015 N/A N/A - - N/A N/A N/A N/A - - N/A N/A N/A
2016 N/A N/A - - N/A N/A N/A N/A - - N/A N/A N/A
2017 N/A N/A - - N/A N/A N/A N/A - - N/A N/A N/A
2018 N/A N/A - - N/A N/A N/A N/A - - N/A N/A N/A
Source: Municipal Tax Assessor
Union Beach School District
Assessed Value and Actual Value of Taxable Property
Last Ten Fiscal Years
UNAUDITED
113

Exhibit J-7
Basic Rate a
General
Obligation Debt
Service b
Total
Direct J-7
Borough
of Union
Beach
Monmouth
County
Fiscal Year
Ended June 30,
2009 N/A 0.000 N/A N/A N/A N/A
2010 N/A 0.000 N/A N/A N/A N/A
2011 N/A 0.000 N/A N/A N/A N/A
2012 N/A 0.000 N/A N/A N/A N/A
2013 N/A 0.000 N/A N/A N/A N/A
2014 N/A 0.000 N/A N/A N/A N/A
2015 N/A 0.000 N/A N/A N/A N/A
2016 N/A 0.000 N/A N/A N/A N/A
2017 N/A 0.000 N/A N/A N/A N/A
2018 N/A 0.000 N/A N/A N/A N/A
Source: Municipal Tax Collector
Union Beach School DistrictTotal Direct
and
Overlapping
Tax Rate
Union Beach School District
Direct and Overlapping Property Tax Rates
Last Ten Fiscal Years
(rate per $100 of assessed value)
Overlapping Rates
UNAUDITED
114

Exhibit J-8
Taxable % of Total Taxable % of Total
Assessed Rank District Net Assessed Rank District Net
Taxpayer Value [Optional] Assessed Value Taxpayer Value [Optional] Assessed Value
Total -$ 0.00% Total - 0.00%
Source: Municipal Tax Assessor
Not Available
2018 2009
Union Beach School District
Principal Property Tax Payers,
Current Year and Nine Years Ago
UNAUDITED
115
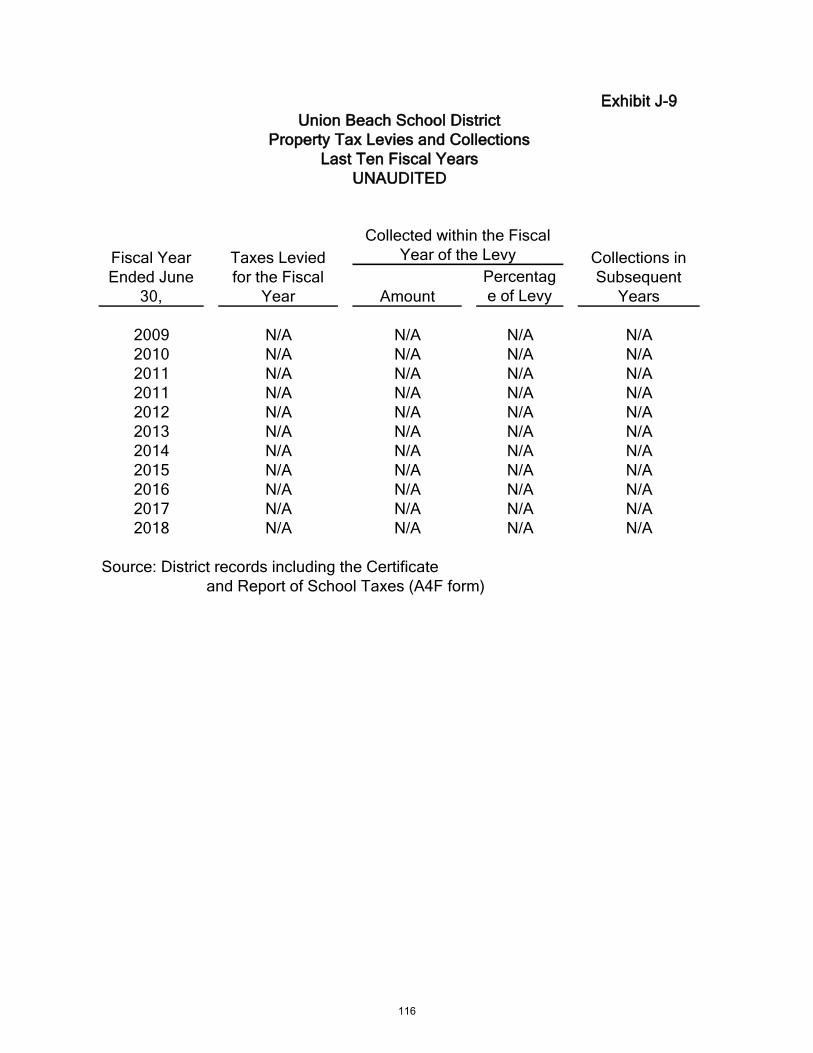
Exhibit J-9
Amount
Percentag
e of Levy
2009 N/A N/A N/A N/A
2010 N/A N/A N/A N/A
2011 N/A N/A N/A N/A
2011 N/A N/A N/A N/A
2012 N/A N/A N/A N/A
2013 N/A N/A N/A N/A
2014 N/A N/A N/A N/A
2015 N/A N/A N/A N/A
2016 N/A N/A N/A N/A
2017 N/A N/A N/A N/A
2018 N/A N/A N/A N/A
Source: District records including the Certificate
and Report of School Taxes (A4F form)
Union Beach School District
Property Tax Levies and Collections
Last Ten Fiscal Years
Fiscal Year
Ended June
30,
Collected within the Fiscal
Year of the Levy Taxes Levied
for the Fiscal
Year
Collections in
Subsequent
Years
UNAUDITED
116

Exhibit J-10
Business-
Type
Activities
Fiscal Year
Ended June
30,
General
Obligation
Bonds
Certificates of
Participation
Capital
Leases
Bond
Anticipation
Notes (BANs)
Compensated
Absences
Payable
Capital
Leases Total District
Percentage
of Personal
Income a
Per Capita a
2009 - - - - 791,452 - 791,452 0.00% -
2010 - - - - 770,724 - 770,724 0.00% -
2011 - - - - 731,505 - 731,505 0.00% -
2012 - - - - 724,997 - 724,997 0.00% -
2013 - - - - 467,371 - 467,371 0.00% -
2014 - - - - 340,747 - 340,747 0.00% -
2015 - - - - 484,415 - 484,415 0.00% -
2016 - - - - 314,008 - 314,008 0.00% -
2017 - - - - 340,747 - 340,747 0.00% -
2018 - - - - 379,682 - 379,682 0.00% -
Source: District CAFR Schedules I-1, I-2
Governmental Activities
Union Beach School District
Ratios of Outstanding Debt by Type
Last Ten Fiscal Years
UNAUDITED
117
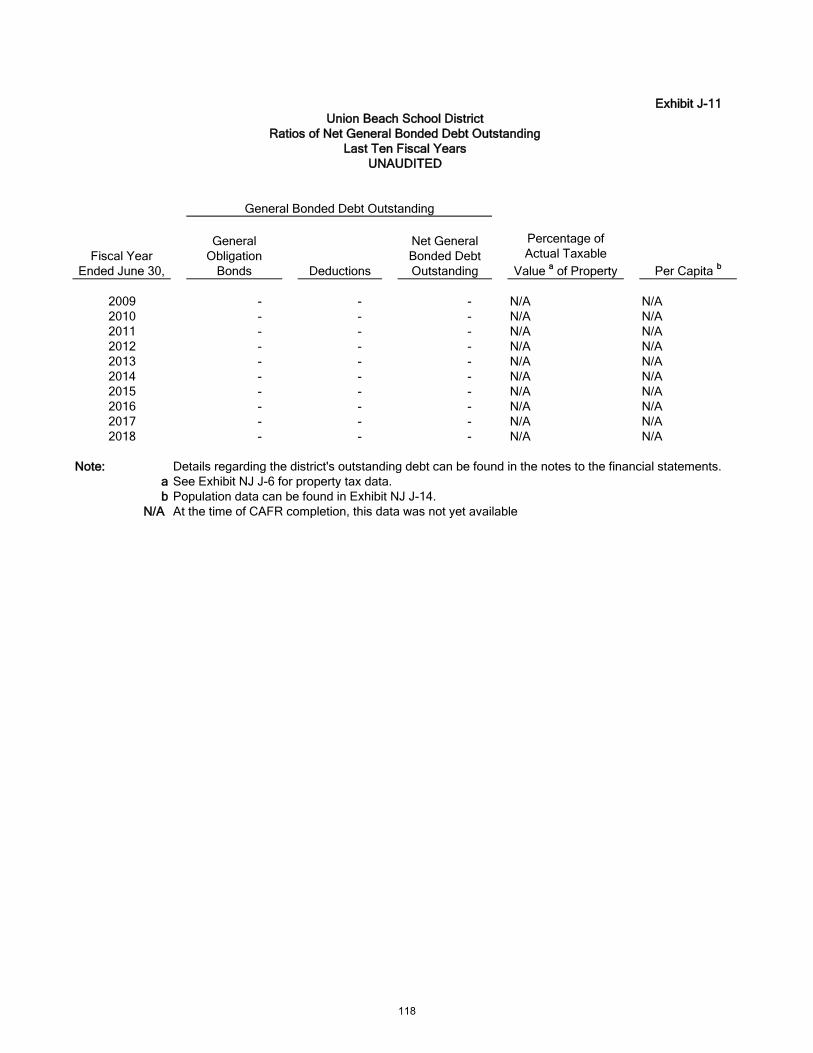
Exhibit J-11
Fiscal Year
Ended June 30,
General
Obligation
Bonds Deductions
Net General
Bonded Debt
Outstanding
Percentage of
Actual Taxable
Value a of Property Per Capita
b
2009 - - - N/A N/A
2010 - - - N/A N/A
2011 - - - N/A N/A
2012 - - - N/A N/A
2013 - - - N/A N/A
2014 - - - N/A N/A
2015 - - - N/A N/A
2016 - - - N/A N/A
2017 - - - N/A N/A
2018 - - - N/A N/A
Note: Details regarding the district's outstanding debt can be found in the notes to the financial statements.
a See Exhibit NJ J-6 for property tax data.
b Population data can be found in Exhibit NJ J-14.
N/A At the time of CAFR completion, this data was not yet available
General Bonded Debt Outstanding
Union Beach School District
Ratios of Net General Bonded Debt Outstanding
Last Ten Fiscal Years
UNAUDITED
118
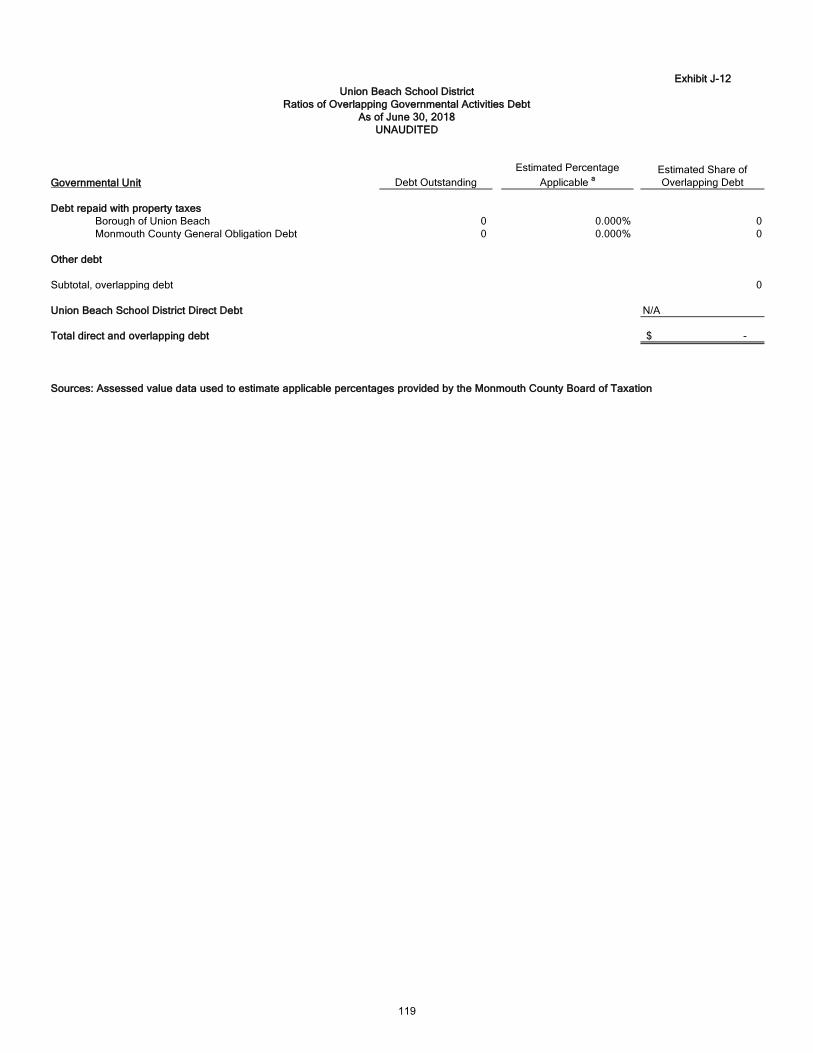
Exhibit J-12
Governmental Unit Debt Outstanding
Estimated Percentage
Applicable a
Estimated Share of
Overlapping Debt
Debt repaid with property taxes
Borough of Union Beach 0 0.000% 0
Monmouth County General Obligation Debt 0 0.000% 0
Other debt
Subtotal, overlapping debt 0
Union Beach School District Direct Debt N/A
Total direct and overlapping debt -$
Sources: Assessed value data used to estimate applicable percentages provided by the Monmouth County Board of Taxation
Union Beach School District
Ratios of Overlapping Governmental Activities Debt
As of June 30, 2018
UNAUDITED
119
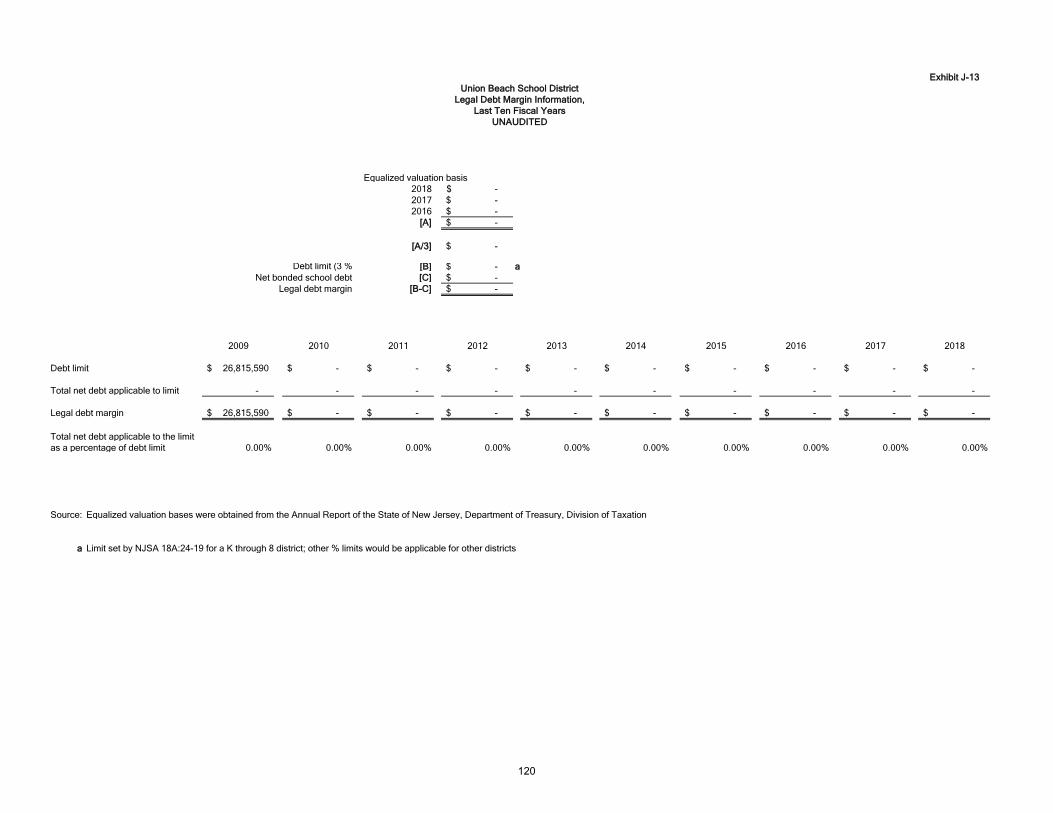
Exhibit J-13
Equalized valuation basis
2018 -$
2017 -$
2016 -$
[A] -$
[A/3] -$
Debt limit (3 % [B] -$ a
Net bonded school debt [C] -$
Legal debt margin [B-C] -$
2009 2010 2011 2012 2013 2014 2015 2016 2017 2018
Debt limit 26,815,590$ -$ -$ -$ -$ -$ -$ -$ -$ -$
Total net debt applicable to limit - - - - - - - - - -
Legal debt margin 26,815,590$ -$ -$ -$ -$ -$ -$ -$ -$ -$
Total net debt applicable to the limit
as a percentage of debt limit 0.00% 0.00% 0.00% 0.00% 0.00% 0.00% 0.00% 0.00% 0.00% 0.00%
Source: Equalized valuation bases were obtained from the Annual Report of the State of New Jersey, Department of Treasury, Division of Taxation
a Limit set by NJSA 18A:24-19 for a K through 8 district; other % limits would be applicable for other districts
Union Beach School District
Legal Debt Margin Information,
Last Ten Fiscal Years
UNAUDITED
120

Exhibit J-14
Year Population a
Personal Income
(thousands of dollars) b
Per Capita
Personal
Income c
Unemployment
Rate d
2009 6,612 368,711,568 55,764 0.0%
2010 6,250 355,968,750 56,955 0.0%
2011 6,251 N/A N/A 0.0%
2012 N/A N/A N/A 10.9%
2013 N/A N/A N/A 10.9%
2014 N/A N/A N/A 10.9%
2015 N/A N/A N/A 10.9%
2016 N/A N/A N/A 10.9%
2017 N/A N/A N/A 10.9%
2018 N/A N/A N/A 10.9%
Source: a Population information provided by the NJ Dept. of Labor and Workforce Development
b Personal income not available by municipality.c Per Capita Income not available by municipality
d Unemployment data provided by the NJ Dept. of Labor and Workforce Development
N/A At the time of CAFR completion, this data was not available
Union Beach School District
Demographic and Economic Statistics
Last Ten Fiscal Years
UNAUDITED
121

Exhibit J-15
Employer Employees
Rank
(Optional)
Percentage of
Total
Employmentb
Employees
Rank
(Optional)
Percentage of
Total
Employmentb
- 0.00%
Source: Borough of Union Beach Official Bond Statement
b Total labor force provided by U.S. Department of Labor, Bureau of Labor Statistics
N/A At the time of CAFR completion, this data was not available
Not Available
20092018
Union Beach School District
Principal Employers,
Current Year and Ten Years Ago
UNAUDITED
122
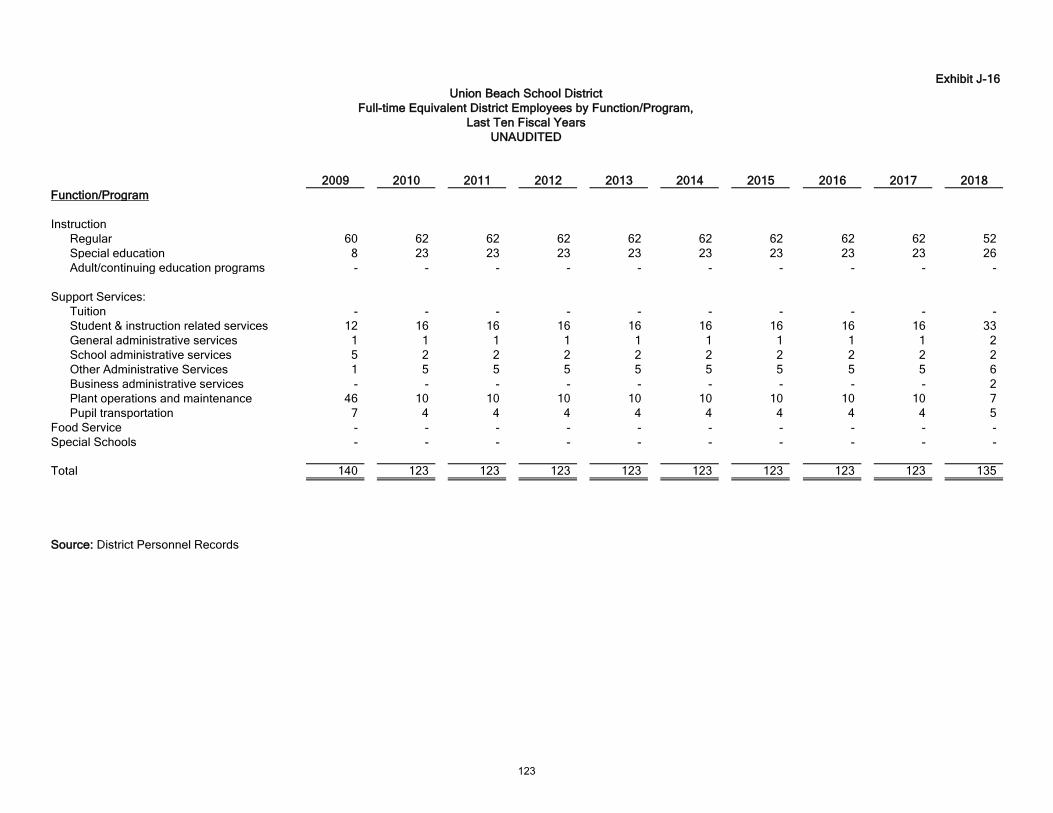
Exhibit J-16
2009 2010 2011 2012 2013 2014 2015 2016 2017 2018
Function/Program
Instruction
Regular 60 62 62 62 62 62 62 62 62 52
Special education 8 23 23 23 23 23 23 23 23 26
Adult/continuing education programs - - - - - - - - - -
Support Services:
Tuition - - - - - - - - - -
Student & instruction related services 12 16 16 16 16 16 16 16 16 33
General administrative services 1 1 1 1 1 1 1 1 1 2
School administrative services 5 2 2 2 2 2 2 2 2 2
Other Administrative Services 1 5 5 5 5 5 5 5 5 6
Business administrative services - - - - - - - - - 2
Plant operations and maintenance 46 10 10 10 10 10 10 10 10 7
Pupil transportation 7 4 4 4 4 4 4 4 4 5
Food Service - - - - - - - - - -
Special Schools - - - - - - - - - -
Total 140 123 123 123 123 123 123 123 123 135
Source: District Personnel Records
Union Beach School District
Full-time Equivalent District Employees by Function/Program,
Last Ten Fiscal Years
UNAUDITED
123
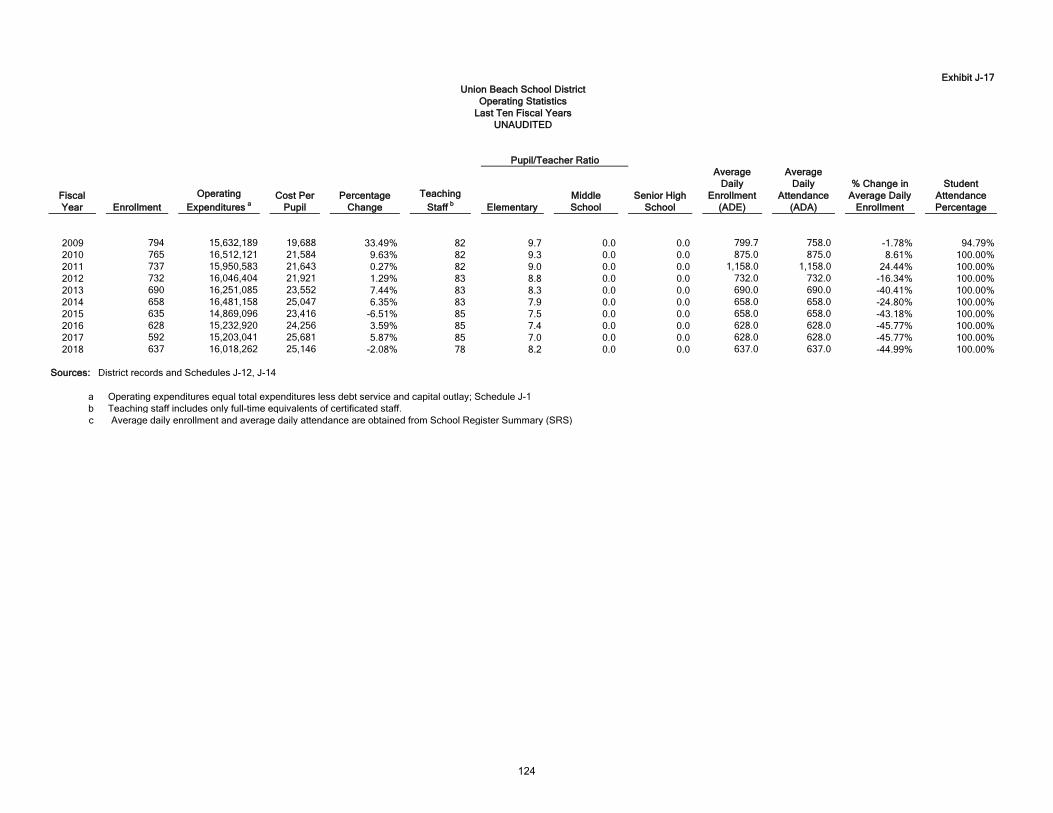
Exhibit J-17
Fiscal
Year Enrollment
Operating
Expenditures a
Cost Per
Pupil
Percentage
Change
Teaching
Staff b
Elementary
Middle
School
Senior High
School
Average
Daily
Enrollment
(ADE)
Average
Daily
Attendance
(ADA)
% Change in
Average Daily
Enrollment
Student
Attendance
Percentage
2009 794 15,632,189 19,688 33.49% 82 9.7 0.0 0.0 799.7 758.0 -1.78% 94.79%
2010 765 16,512,121 21,584 9.63% 82 9.3 0.0 0.0 875.0 875.0 8.61% 100.00%
2011 737 15,950,583 21,643 0.27% 82 9.0 0.0 0.0 1,158.0 1,158.0 24.44% 100.00%
2012 732 16,046,404 21,921 1.29% 83 8.8 0.0 0.0 732.0 732.0 -16.34% 100.00%
2013 690 16,251,085 23,552 7.44% 83 8.3 0.0 0.0 690.0 690.0 -40.41% 100.00%
2014 658 16,481,158 25,047 6.35% 83 7.9 0.0 0.0 658.0 658.0 -24.80% 100.00%
2015 635 14,869,096 23,416 -6.51% 85 7.5 0.0 0.0 658.0 658.0 -43.18% 100.00%
2016 628 15,232,920 24,256 3.59% 85 7.4 0.0 0.0 628.0 628.0 -45.77% 100.00%
2017 592 15,203,041 25,681 5.87% 85 7.0 0.0 0.0 628.0 628.0 -45.77% 100.00%
2018 637 16,018,262 25,146 -2.08% 78 8.2 0.0 0.0 637.0 637.0 -44.99% 100.00%
Sources: District records and Schedules J-12, J-14
a Operating expenditures equal total expenditures less debt service and capital outlay; Schedule J-1
b Teaching staff includes only full-time equivalents of certificated staff.
c Average daily enrollment and average daily attendance are obtained from School Register Summary (SRS)
Pupil/Teacher Ratio
Union Beach School District
Operating Statistics
Last Ten Fiscal Years
UNAUDITED
124
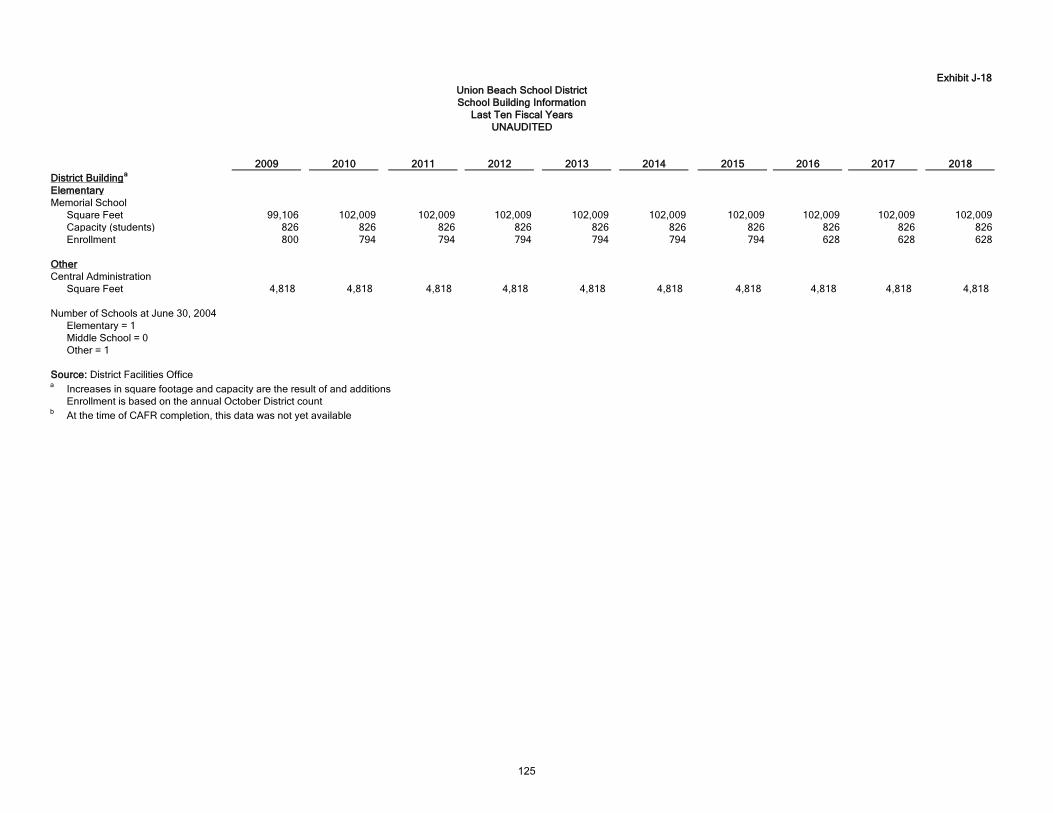
Exhibit J-18
2009 2010 2011 2012 2013 2014 2015 2016 2017 2018
District Buildinga
Elementary
Memorial School
Square Feet 99,106 102,009 102,009 102,009 102,009 102,009 102,009 102,009 102,009 102,009
Capacity (students) 826 826 826 826 826 826 826 826 826 826
Enrollment 800 794 794 794 794 794 794 628 628 628
Other
Central Administration
Square Feet 4,818 4,818 4,818 4,818 4,818 4,818 4,818 4,818 4,818 4,818
Number of Schools at June 30, 2004
Elementary = 1
Middle School = 0
Other = 1
Source: District Facilities Officea
Increases in square footage and capacity are the result of and additions
Enrollment is based on the annual October District count b
At the time of CAFR completion, this data was not yet available
Union Beach School District
School Building Information
Last Ten Fiscal Years
UNAUDITED
125
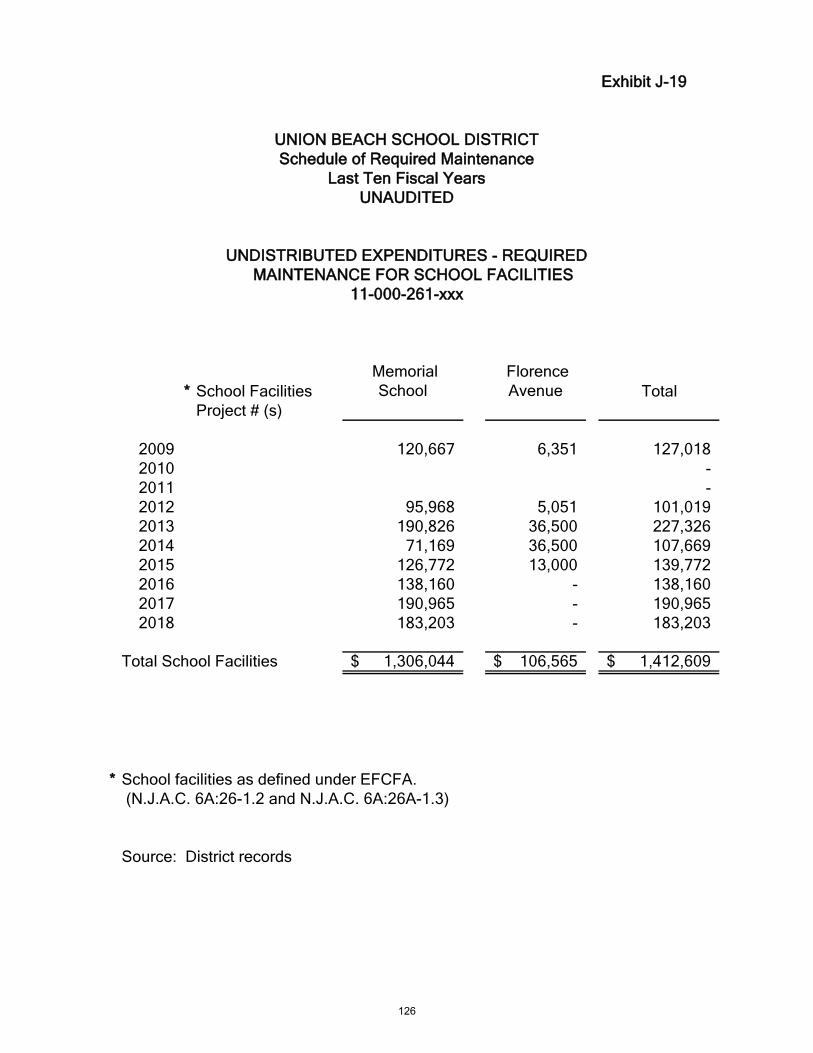
Exhibit J-19
* School Facilities
Memorial
School
Florence
Avenue Total
Project # (s)
2009 120,667 6,351 127,018
2010 -
2011 -
2012 95,968 5,051 101,019
2013 190,826 36,500 227,326
2014 71,169 36,500 107,669
2015 126,772 13,000 139,772
2016 138,160 - 138,160
2017 190,965 - 190,965
2018 183,203 - 183,203
Total School Facilities 1,306,044$ 106,565$ 1,412,609$
* School facilities as defined under EFCFA.
(N.J.A.C. 6A:26-1.2 and N.J.A.C. 6A:26A-1.3)
Source: District records
UNDISTRIBUTED EXPENDITURES - REQUIRED
MAINTENANCE FOR SCHOOL FACILITIES
11-000-261-xxx
UNION BEACH SCHOOL DISTRICT
Schedule of Required Maintenance
Last Ten Fiscal Years
UNAUDITED
126

Exhibit J-20
Company Type of Coverage Coverage Deductible
Arthur J Gallagher Property 32,658,516 5,000
Broker Blanket Building & Contents
Business Income & Extra Exp.
New Jersey School Flood 500,000 5,000
Boards Equipment Breakdown (Blanket)
Insurance Group Per Breakdown 100,000,000 5,000
Commercial Liability
Bodily Injury & Property Damage
Each Occurrence
General Aggregate
Damage to Premises Rented
Medical Payments
Personal & Advertising Injury
Employee Benefits Liability
Crime 100,000 1,000
Employee Theft
Forgery or Alteration
Computer Fraud
Business Auto
Combined Single Limit 11,000,000 1,000
Personal Injury Protection
Medical Payments
Uninsured & Underinsured
Comprehensive Deductible
Collision Deductible
School Board Legal
Limit of Liability 11,000,000 5,000
Worker's Compensation -
Each accident 2,000,000
Each employee 2,000,000
Student Accident
Maximum Benefit 100,000
Bonds
Business Adm./Board Sec'y. 250,000 1,000
Environmental Policy
Each Incident 1,000,000 25,000
Aggregate
CAP Program
Each Occurrence 50,000,000
Aggregate
Source: District Records
FOR THE FISCAL YEAR ENDED JUNE 30, 2018
UNAUDITED
UNION BEACH SCHOOL DISTRICT
INSURANCE SCHEDULE
127

SINGLE AUDIT SECTION
128
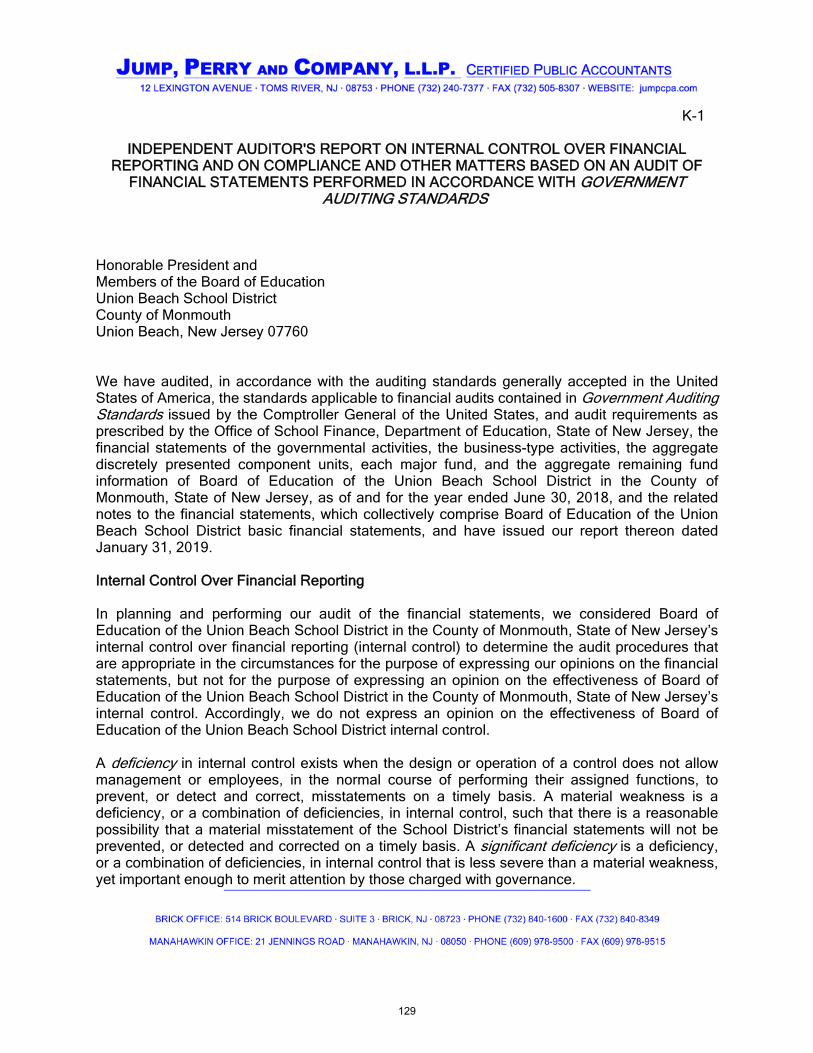
K-1
INDEPENDENT AUDITOR'S REPORT ON INTERNAL CONTROL OVER FINANCIALREPORTING AND ON COMPLIANCE AND OTHER MATTERS BASED ON AN AUDIT OF
FINANCIAL STATEMENTS PERFORMED IN ACCORDANCE WITH GOVERNMENTAUDITING STANDARDS
Honorable President andMembers of the Board of EducationUnion Beach School DistrictCounty of MonmouthUnion Beach, New Jersey 07760
We have audited, in accordance with the auditing standards generally accepted in the UnitedStates of America, the standards applicable to financial audits contained in Government AuditingStandards issued by the Comptroller General of the United States, and audit requirements asprescribed by the Office of School Finance, Department of Education, State of New Jersey, thefinancial statements of the governmental activities, the business-type activities, the aggregatediscretely presented component units, each major fund, and the aggregate remaining fundinformation of Board of Education of the Union Beach School District in the County ofMonmouth, State of New Jersey, as of and for the year ended June 30, 2018, and the relatednotes to the financial statements, which collectively comprise Board of Education of the UnionBeach School District basic financial statements, and have issued our report thereon datedJanuary 31, 2019.
Internal Control Over Financial Reporting
In planning and performing our audit of the financial statements, we considered Board ofEducation of the Union Beach School District in the County of Monmouth, State of New Jersey’sinternal control over financial reporting (internal control) to determine the audit procedures thatare appropriate in the circumstances for the purpose of expressing our opinions on the financialstatements, but not for the purpose of expressing an opinion on the effectiveness of Board ofEducation of the Union Beach School District in the County of Monmouth, State of New Jersey’sinternal control. Accordingly, we do not express an opinion on the effectiveness of Board ofEducation of the Union Beach School District internal control.
A deficiency in internal control exists when the design or operation of a control does not allowmanagement or employees, in the normal course of performing their assigned functions, toprevent, or detect and correct, misstatements on a timely basis. A material weakness is adeficiency, or a combination of deficiencies, in internal control, such that there is a reasonablepossibility that a material misstatement of the School District’s financial statements will not beprevented, or detected and corrected on a timely basis. A significant deficiency is a deficiency,or a combination of deficiencies, in internal control that is less severe than a material weakness,yet important enough to merit attention by those charged with governance.
129

K-1
Our consideration of internal control was for the limited purpose described in the first paragraphof this section and was not designed to identify all deficiencies in internal control that might bematerial weaknesses or, significant deficiencies. Given these limitations, during our audit we didnot identify any deficiencies in internal control that we consider to be material weaknesses.However, material weaknesses may exist that have not been identified.
Compliance and Other Matters
As part of obtaining reasonable assurance about whether the Board of Education of UnionBeach School District financial statements are free from material misstatement, we performedtests of its compliance with certain provisions of laws, regulations, contracts, and grantagreements, noncompliance with which could have a direct and material effect on thedetermination of financial statement amounts. However, providing an opinion on compliancewith those provisions was not an objective of our audit, and accordingly, we do not express suchan opinion. The results of our tests disclosed no instances of noncompliance or other mattersthat are required to be reported under Government Auditing Standards and audit requirementsas prescribed by the Division of Finance, Department of Education, State of New Jersey.
Purpose of this Report
The purpose of this report is solely to describe the scope of our testing of internal control andcompliance and the results of that testing, and not to provide an opinion on the effectiveness ofthe School District’s internal control or on compliance. This report is an integral part of an auditperformed in accordance with Government Auditing Standards and audit requirements asprescribed by the Office of School Finance, Department of Education, State of New Jersey inconsidering the School District’s internal control and compliance. Accordingly, thiscommunication is not suitable for any other purpose.
Respectfully Submitted
Jump, Perry and Company, LLPToms River, New Jersey
Kathryn Perry, PartnerLicensed Public School AccountantNo. CS 20CS00226400
January 31, 2019
130
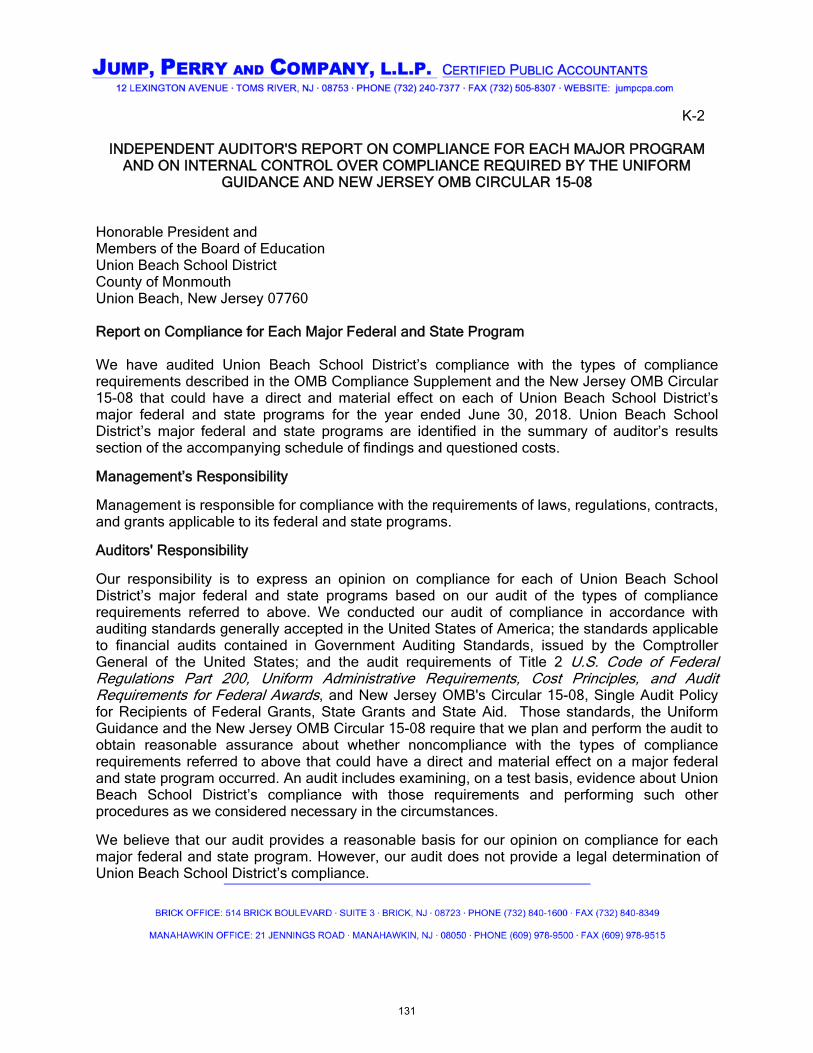
K-2
INDEPENDENT AUDITOR'S REPORT ON COMPLIANCE FOR EACH MAJOR PROGRAMAND ON INTERNAL CONTROL OVER COMPLIANCE REQUIRED BY THE UNIFORM
GUIDANCE AND NEW JERSEY OMB CIRCULAR 15-08
Honorable President andMembers of the Board of EducationUnion Beach School DistrictCounty of Monmouth Union Beach, New Jersey 07760
Report on Compliance for Each Major Federal and State Program
We have audited Union Beach School District’s compliance with the types of compliancerequirements described in the OMB Compliance Supplement and the New Jersey OMB Circular15-08 that could have a direct and material effect on each of Union Beach School District’smajor federal and state programs for the year ended June 30, 2018. Union Beach SchoolDistrict’s major federal and state programs are identified in the summary of auditor’s resultssection of the accompanying schedule of findings and questioned costs.
Management’s Responsibility
Management is responsible for compliance with the requirements of laws, regulations, contracts,and grants applicable to its federal and state programs.
Auditors' Responsibility
Our responsibility is to express an opinion on compliance for each of Union Beach SchoolDistrict’s major federal and state programs based on our audit of the types of compliancerequirements referred to above. We conducted our audit of compliance in accordance withauditing standards generally accepted in the United States of America; the standards applicableto financial audits contained in Government Auditing Standards, issued by the ComptrollerGeneral of the United States; and the audit requirements of Title 2 U.S. Code of FederalRegulations Part 200, Uniform Administrative Requirements, Cost Principles, and AuditRequirements for Federal Awards, and New Jersey OMB's Circular 15-08, Single Audit Policyfor Recipients of Federal Grants, State Grants and State Aid. Those standards, the UniformGuidance and the New Jersey OMB Circular 15-08 require that we plan and perform the audit toobtain reasonable assurance about whether noncompliance with the types of compliancerequirements referred to above that could have a direct and material effect on a major federaland state program occurred. An audit includes examining, on a test basis, evidence about UnionBeach School District’s compliance with those requirements and performing such otherprocedures as we considered necessary in the circumstances.
We believe that our audit provides a reasonable basis for our opinion on compliance for eachmajor federal and state program. However, our audit does not provide a legal determination ofUnion Beach School District’s compliance.
131
K-2
Opinion on Each Major Federal and State Program
In our opinion, Union Beach School District complied, in all material respects, with the types ofcompliance requirements referred to above that could have a direct and material effect on eachof its major federal and state programs for the year ended June 30, 2018.
Report on Internal Control Over Compliance
Management of Union Beach School District is responsible for establishing and maintainingeffective internal control over compliance with the types of compliance requirements referred toabove. In planning and performing our audit of compliance, we considered Union Beach SchoolDistrict’s internal control over compliance with the types of requirements that could have a directand material effect on each major federal and state programs to determine the auditingprocedures that are appropriate in the circumstances for the purpose of expressing an opinionon compliance for each major federal and state program and to test and report on internalcontrol over compliance in accordance with the Uniform Guidance and the New Jersey OMB 15-08, but not for the purpose of expressing an opinion on the effectiveness of internal control overcompliance. Accordingly, we do not express an opinion on the effectiveness of Union BeachSchool District’s internal control over compliance.
A deficiency in internal control over compliance exists when the design or operation of a controlover compliance does not allow management or employees, in the normal course of performingtheir assigned functions, to prevent, or detect and correct, noncompliance with a type ofcompliance requirement of a federal and state program on a timely basis. A material weaknessin internal control over compliance is a deficiency, or combination of deficiencies, in internalcontrol over compliance, such that there is a reasonable possibility that material noncompliancewith a type of compliance requirement of a federal and state program will not be prevented, ordetected and corrected, on a timely basis. A significant deficiency in internal control overcompliance is a deficiency, or a combination of deficiencies, in internal control over compliancewith a type of compliance requirement of a federal and state program that is less severe than amaterial weakness in internal control over compliance, yet important enough to merit attentionby those charged with governance.
Our consideration of internal control over compliance was for the limited purpose described inthe first paragraph of this section and was not designed to identify all deficiencies in internalcontrol over compliance that might be material weaknesses or significant deficiencies. We didnot identify any deficiencies in internal control over compliance that we consider to be materialweaknesses. However, material weaknesses may exist that have not been identified.
132
K-2
Purpose of this Report
The purpose of this report on internal control over compliance is solely to describe the scope ofour testing of internal control over compliance and the results of that testing based on therequirements of the Uniform Guidance and New Jersey State OMB Circular 15-08. Accordingly,this report is not suitable for any other purpose.
Respectfully submitted,
Jump, Perry, & Company, L.L.P.Toms River, New Jersey
Kathryn Perry,PartnerLicensed Public School AccountantNo. CS 20CS00226400
January 31, 2019
133
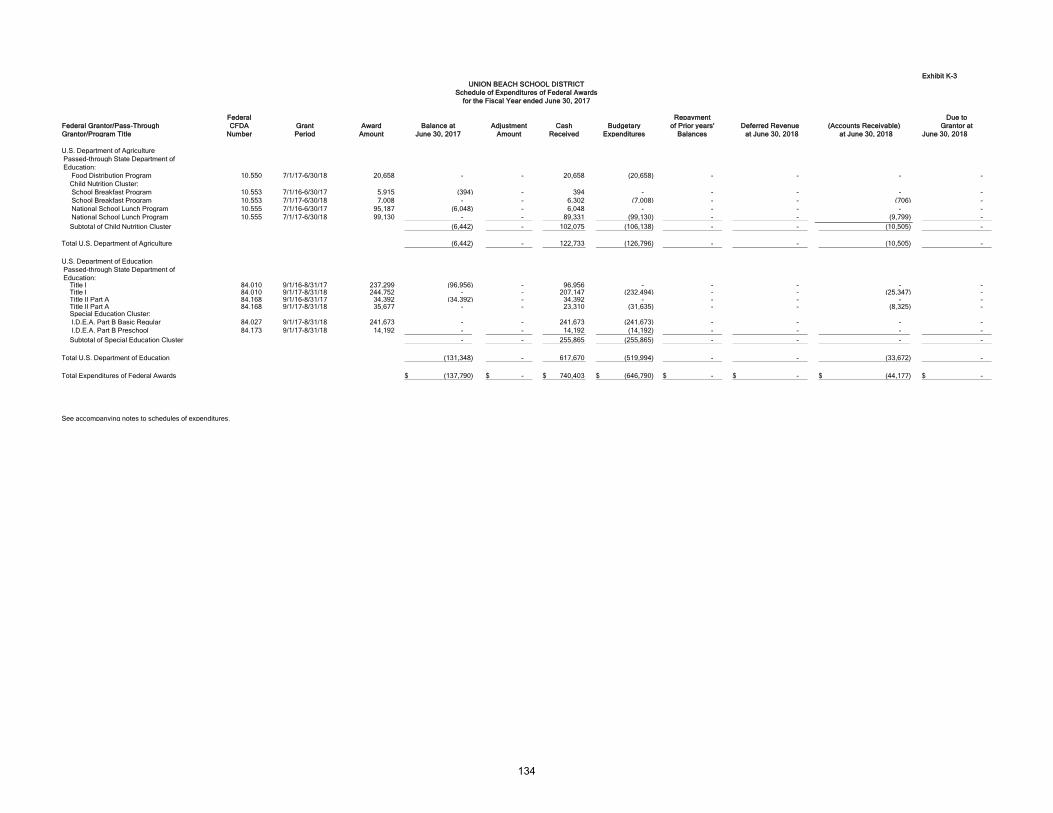
Exhibit K-3
Federal Repayment Due to
Federal Grantor/Pass-Through CFDA Grant Award Balance at Adjustment Cash Budgetary of Prior years' Deferred Revenue (Accounts Receivable) Grantor at
Grantor/Program Title Number Period Amount June 30, 2017 Amount Received Expenditures Balances at June 30, 2018 at June 30, 2018 June 30, 2018
U.S. Department of Agriculture
Passed-through State Department of
Education:
Food Distribution Program 10.550 7/1/17-6/30/18 20,658 - - 20,658 (20,658) - - - -
Child Nutrition Cluster:
School Breakfast Program 10.553 7/1/16-6/30/17 5,915 (394) - 394 - - - - -
School Breakfast Program 10.553 7/1/17-6/30/18 7,008 - - 6,302 (7,008) - - (706) -
National School Lunch Program 10.555 7/1/16-6/30/17 95,187 (6,048) - 6,048 - - - - -
National School Lunch Program 10.555 7/1/17-6/30/18 99,130 - - 89,331 (99,130) - - (9,799) -
Subtotal of Child Nutrition Cluster (6,442) - 102,075 (106,138) - - (10,505) -
Total U.S. Department of Agriculture (6,442) - 122,733 (126,796) - - (10,505) -
U.S. Department of Education
Passed-through State Department of
Education:Title I 84.010 9/1/16-8/31/17 237,299 (96,956) - 96,956 - - - - - Title I 84.010 9/1/17-8/31/18 244,752 - - 207,147 (232,494) - - (25,347) - Title II Part A 84.168 9/1/16-8/31/17 34,392 (34,392) - 34,392 - - - - - Title II Part A 84.168 9/1/17-8/31/18 35,677 - - 23,310 (31,635) - - (8,325) - Special Education Cluster:
I.D.E.A. Part B Basic Regular 84.027 9/1/17-8/31/18 241,673 - - 241,673 (241,673) - - - -
I.D.E.A. Part B Preschool 84.173 9/1/17-8/31/18 14,192 - - 14,192 (14,192) - - - -
Subtotal of Special Education Cluster - - 255,865 (255,865) - - - -
Total U.S. Department of Education (131,348) - 617,670 (519,994) - - (33,672) -
Total Expenditures of Federal Awards (137,790)$ -$ 740,403$ (646,790)$ -$ -$ (44,177)$ -$
See accompanying notes to schedules of expenditures.
UNION BEACH SCHOOL DISTRICT
Schedule of Expenditures of Federal Awards
for the Fiscal Year ended June 30, 2017
134

Exhibit K-4
Repayment
State Grantor/ Grant or State Grant Award Balance at Adjustment Cash Budgetary of Prior Years' Deferred Revenue (Accounts Receivable) Due to Grantor Budgetary Total
Program Title Project Number Period Amount June 30, 2017 Amount Received Expenditures Balances at June 30, 2018 at June 30, 2018 at June 30, 2018 Receivable Expenditures
State Department of Education
General Fund:
Transportation Aid 18-495-034-5120-014 7/1/17-6/30/18 39,173$ -$ -$ 35,278 (39,173)$ -$ -$ -$ -$ 3,895$ 39,173
Equalization Aid 18-495-034-5120-078 7/1/17-6/30/18 7,444,810 - - 6,704,620 (7,444,810) - - - - 740,190 7,444,810
Special Education Aid 18-495-034-5120-089 7/1/17-6/30/18 658,640 - - 593,156 (658,640) - - - - 65,484 658,640
Security Aid 18-495-034-5120-084 7/1/17-6/30/18 28,312 - - 25,497 (28,312) - - - - 2,815 28,312
Adjustment Aid 18-495-034-5120-085 7/1/17-6/30/18 87,352 - - 78,667 (87,352) - - - - 8,685 87,352
PARCC Readiness 18-495-034-5120-098 7/1/17-6/30/18 8,820 - 7,943 (8,820) - - - - 877 8,820
Per Pupil Growth 18-495-034-5120-097 7/1/17-6/30/18 8,820 - 7,943 (8,820) - - - - 877 8,820
Prof Learning Comm Aid 18-495-034-5120-101 7/1/17-6/30/18 7,890 - 7,106 (7,890) - - - - 784 7,890
Extraordinary Aid 17-100-034-5120-473 7/1/16-6/30/17 147,392 (147,392) - 147,392 - - - - - - -
Extraordinary Aid 18-100-034-5120-473 7/1/17-6/30/18 135,565 - - - (135,565) - - (135,565) - - 135,565
Nonpublic Transportation Aid 18-100-034-5120-068 7/1/17-6/30/18 5,759 - - - (5,759) - - (5,759) - - 5,759
Nonpublic Transportation Aid 17-100-034-5120-068 7/1/16-6/30/17 6,207 (6,207) - - - - - - - - -
On-Behalf TPAF Pension Contribution 18-100-034-5095-002 7/1/17-6/30/18 591,455 - - 591,455 (591,455) - - - - - 591,455
On-Behalf TPAF Post-Retirement Medical 18-100-034-5095-001 7/1/17-6/30/18 382,008 - - 382,008 (382,008) - - - - - 382,008
On-Behalf TPAF Long-Term Disability Insurance18-100-034-5095-004 7/1/17-6/30/18 1,267 - - 1,267 (1,267) - - - - - 1,267
Reimbursed TPAF Social
Security Contribution 17-495-034-5094-003 7/1/16-6/30/17 303,392 (14,845) - 14,845 - - - - - - -
Reimbursed TPAF Social
Security Contribution 18-495-034-5094-003 7/1/17-6/30/18 306,686 - - 291,970 (306,686) - - (14,716) - - 306,686
Total General Fund (168,444) - 8,889,147 (9,706,557) - - (156,040) - 823,607 9,706,557
Special Revenue Fund:
Preschool Education Aid 18-495-034-5120-086 7/1/17-6/30/18 422,835 - - 243,742 (289,668) - - - - 45,926 289,668
Total Special Revenue Fund - - 243,742 (289,668) - - - - 45,926 289,668
State Department of Agriculture
Enterprise Fund
State School Lunch Program 17-100-010-3350-023 7/1/16-6/30/17 2,630 (171) - 171 - - - - - - -
State School Lunch Program 18-100-010-3350-023 7/1/17-6/30/18 3,066 - - 2,761 (3,066) - - (305) - - 3,066
Total Special Revenue Fund (171) - 2,932 (3,066) - - (305) - - 3,066
Total Expenditures of State Awards (168,615)$ -$ 9,135,821$ (9,999,291)$ -$ -$ (156,345)$ -$ 869,533$ 9,999,291$
State Financial Assistance Not Subject to Single
Audit Determination - - (974,730) 974,730 - - - - - (592,722)
Total Expenditures of State Awards Subject to
Single Audit Determination (168,615)$ -$ 8,161,091$ (9,024,561)$ -$ -$ (156,345)$ -$ 869,533$ 9,406,569$
See accompanying notes to schedules of expenditures.
UNION BEACH SCHOOL DISTRICT
Schedule of Expenditures of State Financial Assistance
for the Fiscal Year ended June 30, 2018
135
K-5
Union Beach School District
Notes to Schedules of Awards and Financial Assistance
June 30, 2018
1. General
The accompanying schedules of expenditures of award present the activity of all federal andstate awards of the Board of Education, Union Beach School District. The Board of Education isdefined in Note 1(A) to the Board's general purpose financial statements. All federal and stateawards received directly from federal and state agencies, as well as federal and state awardspassed through other government agencies are included on the schedules of expenditures offederal and state awards.
2. Basis of Accounting
The accompanying schedules of expenditures of federal and state awards are presented on thebudgetary basis of accounting with the exception of programs recorded in the food service fund,which are presented using the accrual basis of accounting. These bases of accounting aredescribed in Note 1 to the Board's basic financial statements.
3. Relationship to Basic Financial Statements
The basic financial statements present the general fund and special revenue fund on a GAAPbasis. Budgetary comparison statements or schedules are presented for the general fund andspecial revenue fund to demonstrate finance-related legal compliance in which certain revenueis permitted by law or grant agreement to be recognized in the audit year, whereas for GAAPreporting, revenue is not recognized until the subsequent year or when expenditures have beenmade.
The general fund is presented in the accompanying schedules on the modified accrual basiswith the exception of the last state aid payment in the current budget year, which is mandatedpursuant to P.L. 2003, c.97.(A3521). For GAAP purposes that payment is not recognized untilthe subsequent budget year due to the state deferral and recording of the last state aid paymentin the subsequent year. The special revenue fund is presented in the accompanying scheduleson the grant accounting budgetary basis, which recognizes encumbrances as expenditures andalso recognizes the related revenues, whereas the GAAP basis does not.
136

K-5
Union Beach School District
Notes to Schedules of Awards and Financial Assistance (continued)
June 30, 2018
3. Relationship to General Purpose Financial Statements (continued)
The net adjustment to reconcile from the budgetary basis to the GAAP basis is $(582,608) forthe general fund and $(27,583) for the special revenue fund. See Exhibit C-3 for a reconciliationof the budgetary basis to the GAAP basis of accounting for the general and special revenuefund. Awards and financial assistance revenues are reported in the Board's basic financialstatements on a GAAP basis as presented below:
Federal State TotalGeneral Fund $ - 9,123,949 $ 9,123,949
Special Revenue Fund 519,994 262,085 782,079
Debt Service Fund - - -
Food Service Fund 126,796 3,066 129,862
Total awards and financial assistance $ 646,790 9,389,100 $ 10,035,890
4. Relationship to Federal and State Financial Reports
Amounts reported in the accompanying schedules agree with the amounts reported in therelated federal and state financial reports.
5. Other
TPAF Social Security Contributions represents the amount reimbursed by the State for theemployer’s share of Social Security contributions and Post Retirement/Medical Benefits forTPAF members for the year ended June 30, 2018.
The TPAF Post Retirement/Medical Benefits expenditures are not subject to New Jersey OMBCircular 15-08 and are not included in the above schedule.
6. Indirect Costs
The District has elected not to use the 10-percent de minimis indirect cost rate allowed underthe Uniform Guidance.
137

K-5
Union Beach School District
Notes to Schedules of Awards and Financial Assistance (continued)
June 30, 2018
Section I – Summary of Auditor’s Results
Financial Statements
Type of auditor's report issued: Unmodified opinion
Internal control over financial reporting:
1) Material weakness(es) identified? _____ yes X no
2) Significant deficiencies identified? _____ yes X none reported
Noncompliance material to basic financial statements noted? _____ yes X no
Federal Awards: N/A
Internal Control over major programs:
1) Material weakness(es) identified? _____ yes no
2) Significant deficiencies identified? _____ yes none reported
Type of auditor's report issued on compliance for major programs: N/A
Any audit findings disclosed that are required to be reported in accordance with 2 CFR section .516(a) of the Uniform Guidance? _____ yes no
Identification of major programs:
CFDA Number(s) Name of Federal Program or ClusterN/A
Dollar threshold used to distinguish between type A and type B programs: $750,000
Auditee qualified as low-risk auditee? yes ____no
138

K-5
Union Beach School District
Notes to Schedules of Awards and Financial Assistance (continued)
June 30, 2018
Section I – Summary of Auditor’s Results (continued)
State Awards
Dollar threshold used to distinguish between type A and type B programs: $750,000
Auditee qualified as low-risk auditee? X yes _____no
Type of auditor's report issued on compliance for major programs: Unmodified Opinion
Internal Control over major programs:
1) Material weakness(es) identified? ____yes X no
2) Significant deficiencies identified that are not considered to be material weaknesses? ____yes X none reported
Any audit findings disclosed that are required to be reported in accordance with NJOMB Circular Letter 15-08? ____ yes X no
Identification of major programs:
State grant/Project Number(s) Name of State Program
State Aid-Cluster495-034-5120-078 Equalization Aid495-034-5120-089 Special Education Aid495-034-5120-084 Security Aid495-034-5120-085 Adjustment Aid495-034-5120-085 Additional Adjustment Aid495-034-5130-098 PARCC Readiness495-034-5130-097 Per Pupil Growth495-034-5130-101 Prof. Learning Comm. Aid
139
K-6
Union Beach School District
Summary of Findings and Questioned Costs
June 30, 2018
Section II – Financial Statement Findings
No matters were reported for the period ended June 30, 2018.
Section III – State Award Findings and Questioned Costs
No matters were reported for the period ended June 30, 2018.
140
K-7
Union Beach School District
Summary Schedule of Prior Audit Findings
June 30, 2018
There were no prior year findings for the period ended June 30, 2017.
141