office of environment and heritage annual report 2014-15 · strategic goals of the office of...
TRANSCRIPT

© 2015 State of NSW and Office of Environment and Heritage
The Office of Environment and Heritage (OEH) has compiled this report in good faith, exercising all due care and attention. No representation is made about the accuracy, completeness or suitability of the information in this publication for any particular purpose. OEH shall not be liable for any damage that may occur to any person or organisation taking action or not on the basis of this publication.
With the exception of photographs, the State of NSW and Office of Environment and Heritage are pleased to allow this material to be reproduced in whole or in part for educational and non-commercial use, provided the meaning is unchanged and its source, publisher and authorship are acknowledged. Specific permission is required for the reproduction of photographs.
All content in this publication is owned by OEH and is protected by Crown Copyright. It is licensed under the Creative Commons Attribution 4.0 International (CC BY 4.0) , subject to the exemptions contained in the licence. The legal code for the licence is available at Creative Commons .
OEH asserts the right to be attributed as author of the original material in the following manner: © State of New South Wales and Office of Environment and Heritage 2015.
Published by: Office of Environment and Heritage 59 Goulburn Street, Sydney NSW 2000 PO Box A290, Sydney South NSW 1232 Phone: +61 2 9995 5000 (switchboard) Phone: 131 555 (environment information and publications requests) Phone: 1300 361 967 (national parks, general environmental enquiries, and publications requests) Fax: +61 2 9995 5999 TTY users: phone 133 677, then ask for 131 555 Speak and listen users: phone 1300 555 727, then ask for 131 555 Email: [email protected] Website: www.environment.nsw.gov.au Report pollution and environmental incidents Environment Line: 131 555 (NSW only) or [email protected] See also www.environment.nsw.gov.au ISSN 2204-0978 OEH 2015/0878 October 2015
Letter of submission .............................................................................................................................. 1
Message from the Chief Executive ....................................................................................................... 2
About OEH .............................................................................................................................................. 3
Purpose ............................................................................................................................................... 3
Vision .................................................................................................................................................. 3
Role ..................................................................................................................................................... 3
Organisation structure ......................................................................................................................... 3
Portfolio partners ................................................................................................................................. 4
2014-15 Achievements ........................................................................................................................... 5
Targets for 2015–16 ............................................................................................................................. 14
Science supporting the environment ................................................................................................. 15
OEH financial statements .................................................................................................................... 17
Notes to the financial statements ....................................................................................................... 26
Appendices ........................................................................................................................................... 85
Governance ....................................................................................................................................... 85
Legislation and legal change ............................................................................................................ 88
Human resources .............................................................................................................................. 97
Funding and expenditure ................................................................................................................ 106
Heritage Council of NSW Annual Report ......................................................................................... 115
Heritage Council financial statements ............................................................................................. 119
Notes to the Heritage Council financial statements ....................................................................... 126
Contact Us .......................................................................................................................................... 141
The Hon. Mark Speakman, MP
Minister for the Environment
Minister for Heritage 52 Martin Place SYDNEY NSW 2000
Dear Minister
I am pleased to submit to you the Annual Report of the Office of Environment and Heritage for your presentation to the New South Wales Parliament. This report provides a summary of our services and achievements and covers our performance for the period 1 July 2014 to 30 June 2015. In addition, the report contains the audited financial statements and appendices as required by legislation.
The report also incorporates the Annual Report of the Heritage Council of NSW for the year ending 30 June 2015.
The report was prepared in accordance with the provisions of the Annual Reports (Departments) Act 1985, the Public Finance and Audit Act 1983, regulations under those Acts and NSW Treasury Circular (TC10/09).
Yours sincerely
TERRY BAILEY
Chief Executive
OEH Annual Report 2014–15 2
Reflecting on a year of managing the environment and heritage in NSW is always a humbling exercise. The work of the Office of Environment and Heritage (OEH) is remarkable in its variety, challenge and outstanding achievements. But even with this high standard in mind, it is clear that this year has been particularly significant.
2014-15 will go down as a milestone year for the long term protection and management of biodiversity in NSW, with two major initiatives that set the direction for conservation management for decades to come.
In March 2015 the government committed to develop a new Biodiversity Conservation Act to create a new policy and legislative framework for biodiversity conservation in NSW. This reform will put into practice the recommendations of an independent expert panel, which reported in December 2014 on the results of their comprehensive review of the Native Vegetation Act 2003, the Threatened Species Conservation Act 1995 and
related biodiversity legislation.
With these reforms, the Government also committed to a long-term investment in biodiversity outcomes through the Saving Our Species program. This $100 million five-year conservation program has the ambitious aim to maximise the number of threatened species that can be secured in the wild for 100 years.
Together these initiatives represent a renewed commitment to biodiversity protection in NSW, revitalising the mandate of OEH to enrich life in NSW by helping the community to conserve and enjoy our environment and heritage.
This Annual Report sets out a sample of the highlights of 2014-15 across our wide-ranging responsibilities including management of national parks, celebration of the Aboriginal and non-Aboriginal heritage of NSW, engagement in the land use planning system, management of environmental water, informing and supporting local government and the community to manage the risks of coastal hazards, floods and climate change and promoting efficient use of resources. These achievements reflect the hard work, commitment and energy of a highly skilled group of staff who meet the high expectations of our organisation every day.
I am proud to present this Annual Report for the 2014-15 year.
TERRY BAILEY
Chief Executive
3 OEH Annual Report 2014–15
The Office of Environment and Heritage (OEH) is a separate agency within the Planning and Environment cluster. OEH works to enrich life in NSW by helping the community to conserve and enjoy our environment and heritage.
Our environment and heritage is valued, protected, enjoyed and supports a prosperous and healthy NSW.
The role of OEH is to:
conserve and care for national parks and reserves, biodiversity and threatened species
encourage communities to experience and enjoy national parks and value their local environment
promote, protect and share Aboriginal culture and heritage in partnership with Aboriginal people and local communities
conserve, revitalise, care for and enjoy our historic heritage
support economic development by promoting sustainable industries, tourism in protected areas, jobs and access to natural resources without devaluing the environment
advise, support and educate communities, regions, industry and landholders on the environment and heritage
help communities and businesses build resilience to climate change, environmental hazards and risks
develop and lead reforms in biodiversity, native vegetation, Aboriginal, non-Aboriginal and shared heritage, energy efficiency, air and water quality, coastal protection and sustainability
inform and provide assurance to governments, businesses, households and individuals that their activities are consistent with environmental and heritage protections
provide expertise in partnership with local, state and federal government agencies to inform and support community and government decision making.
As at 30 June 2015, the Office of Environment and Heritage consists of seven delivery areas, supported by coordination and corporate services:
Policy
National Parks and Wildlife Service (NPWS)
Customer Experience
Regional Operations
Heritage
Science
Legal Services.
Supports the Minister and OEH Executive by providing policy advice and leading the development of strategic policy. This division leads OEH’s engagement in whole-of-government policy formation, Cabinet processes, legislative reforms and intergovernmental affairs.
Manages, conserves and cares for more than seven million hectares of land in national parks and reserves. NPWS links customer, conservation and cultural outcomes in a sustainable way by building participation in the management and use of parks.
OEH Annual Report 2014–15 4
Focuses on delivering a seamless experience for OEH customers, whether they choose to phone, write an email, visit our websites or engage through social media. The division is responsible for meeting customer-oriented targets across all channels and for implementing a strategy to overhaul and improve the ways OEH engages with its customers.
Delivers integrated and customer-focused services at regional and local level to strengthen communities and partnerships across NSW. This includes services, programs and grants to support: land use planning; threatened species and biodiversity; Aboriginal cultural heritage assessment; native vegetation; education; community engagement; energy efficiency; volunteering; environmental water management; coast and flood protection; compliance and enforcement; adapting to a changing climate; and private land conservation.
Provides an integrated approach to identifying, protecting and managing Aboriginal and non-Aboriginal heritage and works with the community to list items on the State Heritage Register, declare Aboriginal places and register state shipwrecks. This division assesses applications to change listed heritage items; repatriates Aboriginal ancestral remains; administers grants for heritage conservation; provides secretariat services to the Heritage Council and the Aboriginal Cultural Heritage Advisory Committee; and develops operational policy to support these functions.
Provides scientific evidence and knowledge to underpin environmental decision-making, regulation and service delivery.
Provides advice on legislation administered by OEH and the Environment Protection Authority (EPA) relating to environment conservation and protection and matters that also affect the operations of OEH and the EPA. This division conducts litigation on behalf of both OEH and the EPA.
As well as its internal functional areas, OEH provides services and other support to its partners in the Environment and Heritage Portfolio:
Environment Protection Authority, a statutory body
Centennial Park and Moore Park Trust, a statutory body
NSW Environmental Trust, a statutory body
Historic Houses Trust, a statutory body
Parramatta Park Trust, a statutory body
Royal Botanic Gardens and Domain Trust, a statutory body
Taronga Conservation Society Australia, a statutory authority
Western Sydney Parklands Trust, a statutory body
Heritage Council of NSW, a statutory body
Jenolan Caves Reserve Trust, a statutory body.
The entities listed above that are required to produce annual reports do so separately. The annual report of the Heritage Council of NSW is included within this OEH Annual Report.
5 OEH Annual Report 2014–15
The following OEH performance highlights for the period to 30 June 2015 are grouped by according to the strategic goals of the Office of Environment and Heritage Corporate Plan 2014-17.
We are committed to maintaining and, where possible, improving the economic, social, cultural and natural values of the public reserve system in NSW. Through our actions, we will work toward ensuring that NSW’s public and private protected areas are comprehensive, adequate and representative of the full range of NSW biodiversity and protect natural systems and processes. We will also work to ensure that the natural, social and cultural values of protected areas in NSW are stable or improving.
Wianamatta Regional Park
Successfully negotiated the transfer of land to Wianamatta Regional Park, including an addition of 237 hectares in March 2015.
Establishment of Dharawal National Park
Completed a four-year government program to establish Dharawal National Park, including constructing visitor facilities at Wedderburn and Maddens Falls.
Expansion of Brisbane Water National Park
Addition of 60 hectares to Brisbane Water National Park at Bambara Road, Kariong. This culturally and environmentally significant area includes twelve known Aboriginal sites and protects two species of threatened flora and ten threatened fauna species.
Expansion of Goulburn River National Park
Worked with the local coal industry to add 23.5 hectares to Goulburn River National Park, including the unique geological formation known as ‘The Drip’.
Reservation of the Everlasting Swamp
Established Everlasting Swamp National Park, comprising 1638 hectares and one of the largest coastal floodplain wetlands in NSW. Reservation of the swamp will protect significant wildlife and habitat, ecosystem processes and natural connectivity in the landscape.
We are committed to the conservation, protection, management, maintenance, restoration and enhancement of karst and geodiverse landscapes; ecosystems; water sources; and coastal, estuarine and marine environments. Through our actions, we will work to toward ensuring that the ecosystem health of NSW landscapes, rivers and estuaries is stable or improving.
Native vegetation self-assessment codes
Released three priority self-assessment codes of practice under the Native Vegetation Regulation 2013 for clearing activities: thinning, invasive native species and paddock trees. Since the introduction of the codes in November 2014, landholders have submitted 166 notifications for code-based clearing.
Provided self-assessable codes training for more than 60 new Local Land Service (LLS) board members, and more than 80 LLS and OEH staff.
Published the NSW Report on Native Vegetation 2011-13 in July 2014.
Environmental water delivery
Completed a five-year evaluation of the Environmental Water Delivery Program. This program has delivered on average more than 750,000 megalitres of adaptive environmental water per year to NSW rivers and wetlands since 2010.
Managed the delivery of 35,000 megalitres of environmental water to the Macquarie Marshes to protect ecosystem values while enhancing conditions for native fish in the Macquarie River downstream of Burrendong Dam.
OEH Annual Report 2014–15 6
Managed the delivery of 86,000 megalitres of environmental water to the Lower Gwydir and Gingham wetlands and the Mallowa Creek, resulting in ongoing recovery of wetland vegetation and improved waterbird breeding outcomes.
Managed the delivery of more than 380,000 megalitres of environmental water across the Lachlan, Murrumbidgee and Murray River valleys. Impacts included stimulating bird breeding at Yanga National Park, managing sustained environmental water flow within the Nimmie Caira section of the Lowbidgee floodplain and commissioning Koondrook-Perricoota Forest environmental water infrastructure works.
Estuary management program
Provided guidance to local government and the community to manage and protect estuary ecosystems. 44 grants worth $3.12 million were awarded to support local government work to improve the health of NSW estuaries.
Water quality
Collaborated with the federal government and other states to progress the review of the National Water Quality Management Strategy (NWQMS) and ANZECC (Australian and New Zealand Environment Conservation Council) water quality guidelines.
Conservation on private land
Completed 12 conservation agreements protecting 913 hectares and seven wildlife refuges protecting 1,249 hectares.
We are committed to the conservation of biological diversity of native plants and animals at the community, species and genetic levels; and preventing the extinction and promoting the recovery of threatened species. Through our actions, we will work to toward ensuring that threatened species in NSW are secured in the wild for 100 years, and take all reasonable effort to ensure that no additional NSW native species become eligible for listing as endangered.
Saving Our Species (SOS) projects
Finalised 398 SOS conservation projects for threatened species. In addition OEH implemented Saving our Species projects for 75 site-managed species and five iconic species and worked on six data deficient species.
In March 2015, the government pledged an additional $100 million over five years, from 2016/17, to Saving Our Species to fund activities to protect all 970 of the state’s threatened species.
Reintroduction of locally extinct mammals
Embarked on a project and completed a public registration of interest to reintroduce locally extinct mammals to NSW national parks.
Koala Conservation
Established partnerships to aid koala conservation. These included assisting councils to survey koalas, map their habitat, and prepare comprehensive koala plans of management in Bellingen, Ballina, Byron, Campbelltown, Clarence Valley, Cooma-Monaro, Nambucca and Tweed local government areas. Since the Saving Our Species Program began in 2012-13, the NSW Government has invested $715,000 in conservation activities to secure the koala in NSW.
Flying-fox management
Released the Flying-fox Camp Management Policy in March 2015, to assist local councils and other
land managers to work with their communities to effectively manage flying-fox camps. The netting program was expanded to cover the whole of NSW and to include throw-over netting and OEH announced that from 1 July 2015, flying-fox shooting licences to protect crops will only be issued in special circumstances.
Review of Kangaroo Management Program
Conducted the review of the Kangaroo Management Program to find efficiencies and reduce red tape.
OEH consulted with landholders, harvesters and industry to determine the impacts of licensing and policies on their businesses
7 OEH Annual Report 2014–15
We are committed to the promotion, protection, sharing, conservation, revitalisation, care and enjoyment of Aboriginal and non-Aboriginal heritage. Through our actions, we will work to ensure that the State Heritage Register and Aboriginal Places represent the diversity of the history and heritage of NSW; and that the continuing practice of traditional and contemporary Aboriginal culture is integrated in the management of reserved land in NSW.
Heritage Assessments
Assessed over 1000 applications for changes to heritage items under the Heritage Act 1977 and the Environment Planning and Assessment Act 1979, for projects totalling more than $4 billion. OEH worked closely with a number of State Government agencies including Land and Housing Corporation, Sydney Harbour Foreshore Authority, Urban Growth NSW, Roads and Maritime Services and Transport for NSW to co-ordinate major projects and streamline procedures to fast-track development applications and Conservation Management Plan (CMP) endorsement processes.
Aboriginal Places
Declared seven new Aboriginal Places under the National Parks and Wildlife Act 1974 (NPWS Act),
bringing the total number of declared places to 110.
Repatriations
Established a NSW Steering Committee for the repatriation of Aboriginal ancestral remains, with members including the Australian Museum, the National Museum of Australia and the NSW Coroner's Office, resulting in 75 confirmed repatriations during 2014–15.
Aboriginal joint management
Signed three new agreements where the government and local Aboriginal people share responsibility for a national park's management. This year, three new agreements were signed, bringing the total number of agreements that have commenced to 28.
Aboriginal Park Partnerships Program
Provided $625,000 in resources across 51 projects to support Aboriginal people's connection to country, involvement in national park management and Aboriginal heritage management and promotion of Aboriginal cultural values of national parks.
Heritage listings
Assessed 86 items for their State Heritage significance, resulting in 20 new listings on the State Heritage Register. These listings included four significant sections of Cox’s Road, the earliest road built across the Blue Mountains, on the State Heritage Register. These listings fulfil a commitment made in the Western Sydney and Blue Mountains Regional Action Plan (NSW 2021) to list Cox’s Road during
its bicentenary year.
Traditional Custodians Program
Implemented the Traditional Custodians Program across southern NSW to build capacity within Aboriginal communities for increasing training participation and involvement in Aboriginal cultural heritage management works on reserved lands. The program provides a whole of government approach to Aboriginal cultural heritage issues with partnerships formed with Local Land Services, Local Aboriginal Land Councils and Traditional Owner groups.
OEH Annual Report 2014–15 8
We are committed to the protection of environmental and heritage assets and values through the land use planning system to ensure sustainable development throughout NSW.
Biodiversity reforms
In 2014 the Government commissioned an Independent Panel to undertake a comprehensive review of the Native Vegetation Act 2003, the Threatened Species Conservation Act 1995 and related biodiversity legislation. The panel's final report was released on 18 December 2014 and provides a blueprint for legislative and policy reform. A major recommendation from the review was to repeal the existing laws and replace them with a single Biodiversity Conservation Act. In March 2015 the Government announced its support for the recommendations made by the Independent Panel and OEH began work toward the design and delivery of a new policy and a new legislative framework for biodiversity conservation in NSW.
Biodiversity offsets policy
Led the development of the NSW Biodiversity Offset Policy for Major Projects and successfully negotiated its inclusion in the ‘assessment bilateral agreement’ with the Commonwealth. The policy, which commenced in October 2014, clarifies and standardises biodiversity impact assessment and offsetting for major projects, supporting economic development without devaluing the environment.
BioBanking
The NSW BioBanking Scheme is a market-based scheme for biodiversity impact assessment and offsetting. As at 30 June 2015, 13 biobanking statements had been issued for urban developments, covering 98 hectares. The most recently issued statements were in Tahmoor, West Dapto and Edgeworth in September 2014. As at 30 June 2015 there were 42 biobanking agreements resulting in the conservation of more than 5,700 hectares of native vegetation and threatened species habitat. Recently approved biobanking agreements are in Bankstown, Wollongong and Ophir.
Development assessments
Assessed over 1,900 planning matters of which 95 per cent were on time.
We are committed to managing the activation, delivery and use of OEH assets through commercial partnerships, leases, licenses, user fees or direct management. Through our actions, we will work to ensure that investment in the reserve system is sufficient to protect the natural environment and provide opportunities for everyone to enjoy it.
New visitor facilities
Expressions of Interest (EOIs) for developing and managing new visitor facilities were released for Roto House, Port Macquarie and Berowra Waters Tea House. In addition EOIs were released for existing premises at Cape Byron, Fitzroy Falls Visitor Centre café complex and Crowdy Bay Campground.
Heritage upgrades
The Bradleys Head Precinct Upgrade was completed in 2015 as part of the precinct activation program and was Highly Commended in the NSW National Trust Heritage Awards. Restoration and adaptation works were also completed to the Hilltop and Weemalah cottages in Royal National Park for use as short-term accommodation.
We are committed to encouraging people to visit and support national parks; building and operating facilities worth visiting; and providing a positive visitor experience to park visitors. Through our actions, we will work to ensure that people are increasingly visiting and enjoying NSW national parks.
9 OEH Annual Report 2014–15
State-wide visitation record
Recorded the highest ever recorded number of visitors to NSW national parks, with over 39 million visits (source 2014 Roy Morgan Parks Visitation Survey) and an increase in customer satisfaction to 94%.
World Parks Congress (WPC) 2014
The International Union for the Conservation of Nature (IUCN) World Parks Congress was held in Sydney from 9-12 November 2014, with approximately 6,000 participants from 160 different countries, twice the delegation of the last Congress held in Durban.
The WilderQuest program was presented to an international audience at the Congress. In addition to the thousands of visitors to the WilderQuest stand, and a further 3,000 visitors at the WPC PlanetFest community event, more than 800 children participated in a guided WilderQuest tour. Registrations reached over 15,000; an increase of around 45 per cent.
Wild About Whales
Achieved excellent results in the 2014 Wild About Whales national parks coastal tourism campaign,
with more than 110,000 visits to the campaign website; an engaged audience of over 25,000 across Facebook and Twitter; and approximately 7,000 downloads of the Wild About Whales mobile app, bringing total downloads to more than 25,000.
Three Sisters walking track upgrade
Undertook a $1.5 million upgrade to the Three Sisters walking track within the Three Sisters Aboriginal Place. This is one of the most visited walks in the country with over 600,000 visitors annually. The work involved pathway reconstruction, new lookout installation, improvements to visitor safety and revitalisation of the site through landscaping and improved visitor information.
Completion of the Thredbo Valley mountain bike track
The 17 km Thredbo Valley mountain bike track was completed and officially opened in January 2015, linking the Thredbo and Crackenback Resorts with a number of popular camping spots. The track features five suspension bridges and provides spectacular views of the Crackenback range and Thredbo River. 12,000 passes have been issued since it was opened, exceeding expectations.
We are committed to encouraging the community to value, understand and appreciate their environment. Through our actions, we will work to ensure that the community is engaged and involved in NSW Government environmental programs, and that the NSW community has an increased awareness of the local environment.
NPWS next generation website
Delivered the new NPWS website in May 2015, with a mobile-responsive design; major improvements in searching, navigation, mapping and other functionality; and a significant expansion in the website’s content, to cover areas such as conservation, education, volunteering, park management and venue hire.
Volunteering state-wide
Reported a 12 per cent per annum increase in volunteering over the past five years, including approximately 6,500 volunteers contributing over 130,000 hours per annum, and fostering over 20 volunteer agency partnerships.
World Parks Congress Bioblitz
Partnered with eleven other organisations to run a one day Bioblitz event at the World Parks Congress, introducing the concept to a global audience. Around 250 citizen scientists and 30 volunteers gathered scientific species data for the Sydney Olympic Park Authority. 232 unique species were recorded over the 10-hour sampling period. National Geographic produced a summary video from the day.
Newcastle Local Air Quality Monitoring Network
Constructed and opened a new air quality monitoring network in Newcastle. Funded by industry, the network includes three new monitoring stations at Carrington, Mayfield and Stockton, monitoring air quality around the Port of Newcastle. Air quality monitoring data from the new network is now incorporated into the OEH air quality web pages and updated hourly.
OEH Annual Report 2014–15 10
Rapid response air quality monitoring
Established the capability for rapid response air quality monitoring for major incidents, in response to recommendations made by the Victorian Government’s inquiry into the Hazelwood mine fire. Two portable air quality incident monitoring stations have been developed and can be deployed anywhere in NSW within 24 hours and report high quality data direct to the public within 48 hours.
We are committed to improving resource efficiency by supporting business, government, households and communities to use resources in a more productive and environmentally friendly manner. Through our actions, we will work to ensure that business, government, households and communities are supported to use resources more efficiently, saving them money and reducing their impact on the environment.
Government Resource Efficiency Policy
Launched the Government Resource Efficiency Policy to reduce operating costs for NSW Government
agencies and ensure they provide leadership in resource efficiency. Under the policy, the government will invest $290 million over the next ten years on energy efficiency and on-site renewable energy generation in its own buildings. This will lead to annual savings of up to $55 million on energy, water and waste bills, and stimulate the clean energy sector in NSW.
Energy Efficiency Action Plan
Approved $61.5 million in new funding for energy efficiency programs, including $26.8 million for a new low-income Home Energy Action program; $3.5 million for a new business Gas Efficiency Improvement Program; and $31.2 million to continue actions under the NSW Energy Efficiency Action Plan.
Energy Savings Scheme reforms
Led the review of the Energy Savings Scheme, a market-based mechanism that provides financial incentives for households and businesses to reduce electricity consumption. The scheme is expected to deliver additional bill savings to households and businesses worth a net present value of $3.2 billion and a net economic benefit of $847 million.
Community renewable energy
Provided $846,000 to 19 community groups across NSW in Growing Community Energy Grants for feasibility-stage development of community-owned renewable energy projects. These projects will produce 60,000 megawatt hours of electricity a year when completed, enough to power more than 9,000 average NSW households a year.
Energy efficient government loans
Facilitated access to $12.8 million in funding from the Government Finance Facility for nine energy efficiency projects at 39 government sites across the Departments of Health, Justice and Planning and Environment. These projects, which include lighting retrofits, solar photovoltaic (PV) and improvements to heating, ventilation and air conditioning (HVAC) systems, are estimated to save more than $2 million a year.
Sustainability Advantage
The Sustainability Advantage program was the runner up in the Circular Economy Cities/Regions award at the International Circular Economy Awards in January 2015. Members of Sustainability Advantage collectively save more than $94 million a year from improving resource productivity.
Low income households
The Home Power Savings Program received the Premier's Award for Excellence in the NSW public sector for assisting more than 225,000 low-income households reduce their energy use and collectively save more than $36 million a year on energy bills.
The Minister announced a new $26.8 million Home Energy Action Program in March 2015. OEH will partner with community organisations and industry to deliver high-return energy efficiency improvements and reduce the upfront cost of energy efficient appliances for households dealing with hardship.
11 OEH Annual Report 2014–15
We are committed to reducing the threat to biodiversity from pest animals, weeds and pathogens. Through our actions, we will work to ensure that our pest management practice is effective in protecting native biodiversity at priority sites, and that we effectively manage high priority emerging pests and pathogens to minimise impacts on the NSW environment and economy.
Pest and weed management
NPWS continued to provide targeted pest management across NSW, while optimising planning through the NPWS Regional Pest Management Strategies. The fourteen strategies prioritise pest management work in each region, and are publically available on the OEH website. The strategies identify programs based on critical, high, medium or low priority.
Across these fourteen strategies, over 1,000 programs were implemented and reported on during 2014-15. More than 70% of effort was recorded against critical programs, mostly for threatened species conservation. In 2014–15, more than 65,000 pest animals were removed and more than 70,000 dog and fox baits were laid.
We are committed to managing and mitigating risks to life, property and the environment on reserved and adjacent land, and to responding swiftly to environmental incidents. Through our actions, we will work to ensure that fire risk to people, assets and the environment is managed through a proactive program of hazard reduction burning.
Fire and incident management
On average, NPWS has treated approximately 106,000 hectares (ha) annually over the last five years, to a total 534,000 ha. This is more than double the previous five year total. The Enhanced Bushfire Management Program has enabled this dramatic increase, which will continue over the life of the program to 2016.
Approximately 1,200 NPWS and OEH staff are trained and ready to assist with fire management activities, including around 1,100 on-ground fire-fighters.
The following achievements were reported for the 2014–15 year:
Wildfires
Managed 289 wildfires, including 237 fires that burned 49,177 ha of reserved land. Of these, 206 started on-park, of which 186 were contained within park boundaries. NPWS fire fighters assisted the Rural Fire Service (RFS) and other agencies with a further 52 fires off-park.
20 wildfires (approximately 10% of the total) that started on park escaped park boundaries, while 31 (13%) escaped into parks from neighbouring lands.
Deployments
Managed the deployment of firefighters to: British Columbia, Canada (6 personnel, July-August 2014); Victoria (2 personnel, January 2015); South Australia (2 personnel, January 2015); and Western Australia (28 personnel, February 2015).
Policy
Finalised the Protecting Park, Protecting Property policy, which provides a framework for park
neighbours to maintain asset protection zones within reserves that adjoin their properties.
We are committed to helping business and the community prepare for and manage coastal erosion, storm surges and flood risks. Through our actions, we will work to ensure that local government is supported in reducing the impact of coastal hazards while accommodating population growth. We will also work to ensure that the community is supported to prepare for and manage flooding.
Coastal reforms, Stage 2
Led the development of proposals for Stage 2 of NSW coastal reforms. This resulted in government commitments to: replace the Coastal Protection Act 1979 with an improved Coastal Management Act;
OEH Annual Report 2014–15 12
prepare a new coastal management manual to better support local council decision making; and investigate more sustainable funding and financing arrangements for coastal management activities.
Coastal and floodplain management planning
Provided clear and consistent guidance and advice to support the development and implementation of coastal and floodplain management plans to help the community prepare for and manage coastal erosion and flooding. As at 30 June 2015 there were 111 coastal zone management plans adopted by local councils, covering coastal and estuarine environments, and 158 floodplain risk management plans adopted by local councils. In 2014-15, the Coastal Management Program awarded 20 grants worth $1.82 million. Under the Floodplain Management Program, 34 grants totalling around $13.8 million were awarded to deal with flood risks throughout NSW.
Hunter Valley Flood Mitigation Scheme
Managed the operation and maintenance of the Hunter Valley Flood Mitigation Scheme. A $15 million rehabilitation program has been completed within budget and on time, while $3.8 million was invested in maintenance and construction works. All components of the scheme performed well under flood conditions in April 2015.
Coastal risk assessments
Delivered state-wide assessments mapping the state’s current and future risk exposure to coastal erosion and inundation under sea level rise scenarios.
We are committed to understanding and minimising the impacts of climate change, and to enabling our economy and environment to adapt as the climate changes. Through our actions, we will ensure that our climate change data and advice is used and valued by government and business, and that this helps improve preparedness for climate change impacts.
Climate change adaptation
Launched the new AdaptNSW website - a new platform for communities to access climate change information, adaptation resources and support tools. The website was launched on time and on budget. The website showcases state-of-the-art, climate change projections provided by the NSW and ACT Regional Climate Modelling project NARCliM. Working with six NSW agencies, the ACT Government and the University of NSW, OEH has ensured that local decision makers now have access to the information that they need to be able to plan for the impacts of climate change, allowing them to adequately assess climate change impacts on human and natural systems, and to use this information to inform their adaptation planning. The models available provide projections at a resolution of 10 kilometres, giving the finest detail yet of the climate of NSW in the near future (2030) and far future (2070). The projections cover changes in over 100 climate variables including: changes in temperature, the number of hot and cold days, rainfall and severe fire weather days.
Launched the $1 million Building Resilience to Climate Change contestable grants scheme to assist NSW councils address climate change vulnerabilities to future extreme climatic events and hazards. Over 50 applications were received, and six projects involving 21 different local government areas were funded in the first round.
Released the NSW Urban Green Cover Technical Guidelines, produced in partnership with the NSW Government Architects Office. The guidelines outline strategies for increasing vegetation and including permeable and reflective surfaces in urban environments, to minimise urban heat and provide co-benefits such as reduced energy use for cooling, stormwater management, cleaner air, biodiversity habitat and increased amenity.
We are committed to enhancing the capabilities of our staff, ensuring our effective operation and governance, and providing responsive services to organisations within our portfolio.
Vehicle fleet usage savings
Identified vehicle fleet usage savings of approximately $900,000 for the upcoming financial year, following an analysis of use requirements. The leases of approximately 70% of the leased fleet have since been renegotiated with StateFleet, ensuring a cost saving with no loss of operational capability.
13 OEH Annual Report 2014–15
Strategic procurement
Delivered value-for-money procurement initiatives, resulting in annual savings of $2 million.
Facilities management
Transitioned to an electronic document management system, leading to a significant reduction of paper based storage at the Goulburn St site. This provided seven additional meeting rooms and multiple new work points to better meet the needs of the almost 900 people located at this facility.
Zero in Parks launch
Launched Zero in Parks, a new safety initiative aimed at raising the safety profile within NPWS, improving our safety behaviour and safety culture.
OEH Annual Report 2014–15 14
OEH targets for 2015–16 in line with our strategic goals:
Continue to implement the existing Saving Our Species program.
Planning for the expansion of the Saving Our Species program, which will be provided with an additional $100 million over five years from 1 July 2016. This includes continuing to work with existing and new partners through the provision of resources and knowledge.
Effectively implement the Flying-Fox Camp Management Policy, and expand the flying fox netting subsidy program.
Work with Environmental Water Advisory groups to manage environmental water in the Gwydir, Macquarie, Lachlan, Murrumbidgee and Murray-Lower Darling. Develop long term environmental watering plans for the Macquarie-Castlereagh and Gwydir catchments.
Recommend Aboriginal themed places for listing on the State Heritage Register.
Commence delivery of the ‘Heritage Near Me’ app.
Deliver the Aboriginal Park Partnerships project.
Continue programs for capacity building, employment and park management.
Provide input into Regional Growth Plans by coordinating and supplying biodiversity and Aboriginal cultural heritage content.
Deliver fine-scale mapping of priority threatened ecological communities on Crown forest land.
Deliver biodiversity and heritage outcomes through regional planning and assessment, including timely and effective delivery of strategic assessments and bio-certification.
Deliver the Energy Efficiency Action Plan, incorporating financial mechanisms to facilitate new opportunities for energy efficiency across the business and residential sectors by June 2016.
Work with government, industry and communities to deliver the Government’s renewable energy commitments, including opportunities to foster innovative delivery models for energy efficiency and renewable energy, particularly in regional NSW.
Implement the state-wide strategy for visitor centres and Discovery.
Strengthen volunteering and deliver new participation initiatives.
Enhance identified high-value visitor precincts.
Assess the level of climate change preparedness of NSW government agencies and identify actions to improve resilience of services, assets and operations.
Implement critical priority pest management programs.
Continue to implement the Government Sector Employment Act 2013 reforms.
15 OEH Annual Report 2014–15
OEH is continuing to research and develop initiatives to ensure the best possible outcomes for the environment and heritage of NSW. Some of the key scientific projects being developed and implemented to support the environment are outlined below.
In May 2015, OEH published an Adaptive Management Position Statement, which defines and describes adaptive management. This is a procedure for implementing management practices, while learning which management actions are most effective at achieving specified objectives. OEH is committed to using adaptive management to improve on-ground management decisions for ecological, social and/or economic outcomes.
In July 2014, OEH launched eSPADE, an OEH Google Maps-based information system that allows free, easy, map-based access to soil and land information from across NSW. It includes soil mapping covering more than 60 per cent of the state and almost 40,000 soil profile descriptions. State-wide maps of important soil and land characteristics are also available via eSPADE, including the maps that provide the foundation for Biophysical Strategic Agricultural Land (BSAL), a key component of the NSW Government's Strategic Regional Land Use Policy.
As part of the Native Vegetation Information Strategy 2014-18, OEH has commenced work to produce fine-scale maps of Threatened Ecological Communities across 1.4 million hectares of NSW State Forest for the NSW Environment Protection Authority (EPA). In 2014-15 over 1,000 full floristic or rapid sample plots in Threatened Ecological Communities were assessed. The acquired data underpins distribution models, provides classification reference and informs aerial photography interpretation. This substantial body of floristic data was incorporated into the NSW Vegetation Information System, ensuring the data is accessible to other state-wide mapping programs and initiatives.
OEH environmental forensics laboratory undertook almost 300 projects for the EPA. Each project provides the EPA with information it needs to respond to incidents and emergencies, regulate industry and waste management, and undertake investigations that support compliance activities. Significant investigations included the Bluescope Steel Sinter Plant Fire and the Georges River fish kill.
The final report from a three year study assessing the potential environmental risks associated with mixed organic outputs from alternative waste treatment (AWT) was completed. This examined the risks associated with land application of AWT organic output from chemicals in solid material, as well as contaminants that might be released in leachate generated by rainfall. Recommendations were made to the EPA to assist future regulation of land application of AWT outputs.
The BioNet Web Service makes data held in the BioNet Atlas of NSW Wildlife open to App developers. BioNet is the principal source of biodiversity data for the state of NSW, and in this first release over 7 million species sightings have been made available. This data will benefit a wide range of applications such as decision support tools used by state government agencies for the review and approval of private forestry applications, through to not-for-profit organisations developing tailored electronic field guides enabling people to better connect with the nature around them.
Woody vegetation is a key feature of our landscape. OEH released the most detailed map of NSW woody vegetation extent to date with a resolution of 5 metre pixels, showing the location, extent, and density of foliage cover for stands of woody vegetation. The map identifies small features, such as trees in paddocks and scattered woodlands, as well as the state’s largest expanses of forest.
OEH Annual Report 2014–15 16
During 2014-15 OEH scientists worked in partnership with Environmental Water managers to support the NSW OEH Environmental Water Delivery Program. OEH monitored the response of water-dependent vegetation communities to the delivery of environmental water in the Gwydir Wetlands, Lower Lachlan and Macquarie Marshes. OEH monitored waterbird diversity across the Gwydir Wetlands, Macquarie Marshes, Narran Lakes, Mid-Murrumbidgee and Lowbidgee wetlands and small-scale waterbird breeding in the Lowbidgee and Gwydir wetlands. OEH also monitored inundation extents across the landscape for the Gwydir, Lowbidgee and Macquarie Marshes wetlands during the 2014-15 environmental watering period. This was analysed respective to the floodplain, regions, water management areas and vegetation types. Findings from this monitoring program underpinned OEH environmental water management. In 2014-15 the first 5 year assessment of Macquarie Marshes wetland scale changes in vegetation community was completed, revealing changes in the extent and condition of these water dependent vegetation communities. During 2014-15, changes in flooding regimes and inundation extents in the Macquarie Marshes was analysed over 25 years (1988-2013), demonstrating the changes which have occurred across the landscape before and since environmental watering commenced.
During 2014-15 OEH continued to increase its citizen science projects. New projects included Warrumbungle Snap where the public were able to upload photos online to show change since the fire in Warrumbungle National Park; and Nest Box Quests in which the community reports species use of artificial nest boxes. The Measuring Wetland Extent project is a partnership between the OEH, the Earthwatch Institute and the HSBC bank, which supports its employees to participate in this project as a “scientist for a day”. This project is now in its third year. To date over 140 HSBC employees have participated. The information gathered will be used to help ground-truth wetland extent mapped from aerial photos and satellite images. Other OEH-led citizen science projects included DustWatch, a long-running project which raises awareness of the effects of wind erosion and impacts of dust on the community.
17 OEH Annual Report 2014–15
OEH Annual Report 2014–15 18

19 OEH Annual Report 2014–15
OEH Annual Report 2014–15 20
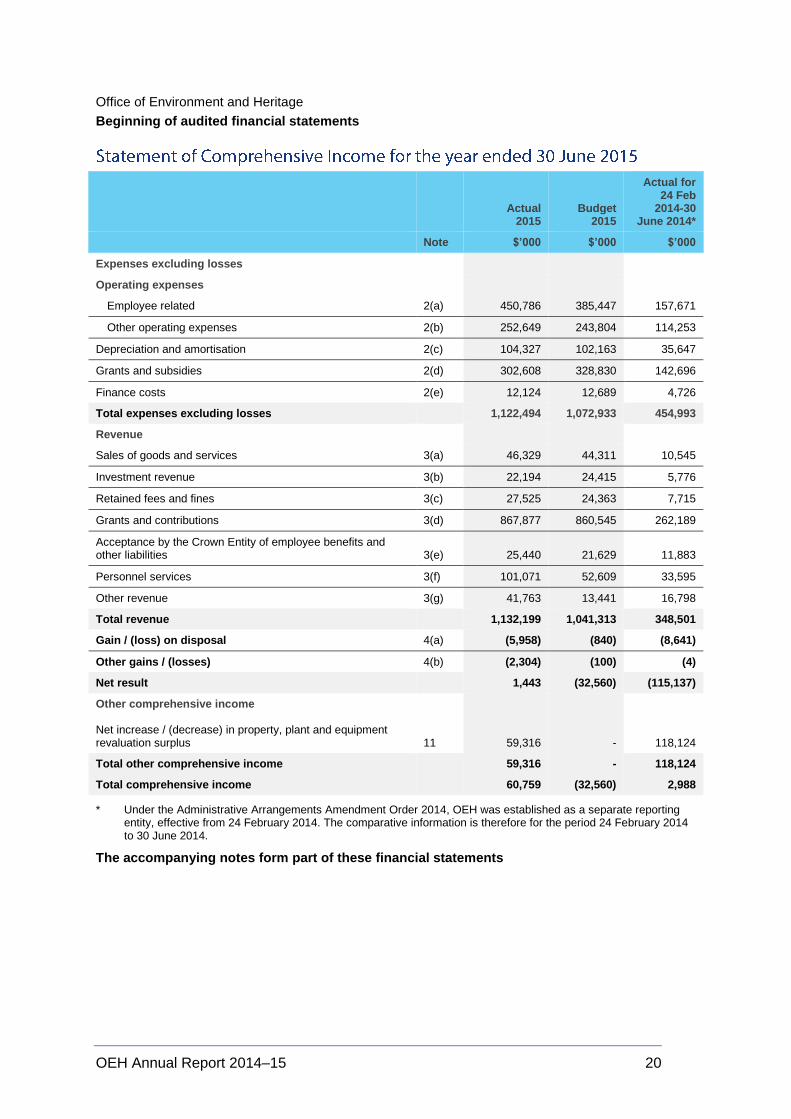
Office of Environment and Heritage
Beginning of audited financial statements
Actual
2015 Budget
2015
Actual for 24 Feb
2014-30 June 2014*
Note $’000 $’000 $’000
Expenses excluding losses
Operating expenses
Employee related 2(a) 450,786 385,447 157,671
Other operating expenses 2(b) 252,649 243,804 114,253
Depreciation and amortisation 2(c) 104,327 102,163 35,647
Grants and subsidies 2(d) 302,608 328,830 142,696
Finance costs 2(e) 12,124 12,689 4,726
Total expenses excluding losses 1,122,494 1,072,933 454,993
Revenue
Sales of goods and services 3(a) 46,329 44,311 10,545
Investment revenue 3(b) 22,194 24,415 5,776
Retained fees and fines 3(c) 27,525 24,363 7,715
Grants and contributions 3(d) 867,877 860,545 262,189
Acceptance by the Crown Entity of employee benefits and other liabilities 3(e) 25,440 21,629 11,883
Personnel services 3(f) 101,071 52,609 33,595
Other revenue 3(g) 41,763 13,441 16,798
Total revenue 1,132,199 1,041,313 348,501
Gain / (loss) on disposal 4(a) (5,958) (840) (8,641)
Other gains / (losses) 4(b) (2,304) (100) (4)
Net result 1,443 (32,560) (115,137)
Other comprehensive income
Net increase / (decrease) in property, plant and equipment revaluation surplus 11 59,316 - 118,124
Total other comprehensive income 59,316 - 118,124
Total comprehensive income 60,759 (32,560) 2,988
* Under the Administrative Arrangements Amendment Order 2014, OEH was established as a separate reporting entity, effective from 24 February 2014. The comparative information is therefore for the period 24 February 2014 to 30 June 2014.
The accompanying notes form part of these financial statements
21 OEH Annual Report 2014–15
Actual
2015 Budget
2015 Actual
2014
Note $’000 $’000 $’000
Assets
Current assets
Cash and cash equivalents 7 237,077 240,021 208,405
Receivables 8 91,949 71,490 79,575
Inventories 9 705 707 887
Other financial assets 10 17 17 17
Total current assets 329,748 312,235 288,884
Non-current assets
Property, plant and equipment
Land and buildings 11 2,293,545 2,220,185 2,233,073
Plant and equipment 11 65,224 65,622 63,488
Infrastructure systems 11 1,432,147 1,427,164 1,473,024
Total property, plant and equipment 3,790,916 3,712,971 3,769,585
Intangible assets 12 192,898 192,117 197,533
Total non-current assets 3,983,814 3,905,088 3,967,118
Total assets 4,313,562 4,217,323 4,256,002
Liabilities
Current Liabilities
Payables 15 99,908 150,194 90,743
Borrowings 16 56,458 52,624 32,605
Provisions 17 67,631 41,733 62,121
Other 18 1,189 71 49
Total current liabilities 225,186 244,622 185,518
Non-current liabilities
Borrowings 16 188,539 205,030 239,135
Provisions 17 6,936 7,455 6,384
Total non-current liabilities 195,475 212,485 245,519
Total liabilities 420,661 457,107 431,037
Net assets 3,892,901 3,760,216 3,824,965
Equity
Reserves 177,441 108,220 118,125
Accumulated funds 19 3,715,460 3,651,996 3,706,840
Total equity 3,892,901 3,760,216 3,824,965
The accompanying notes form part of these financial statements
OEH Annual Report 2014–15 22
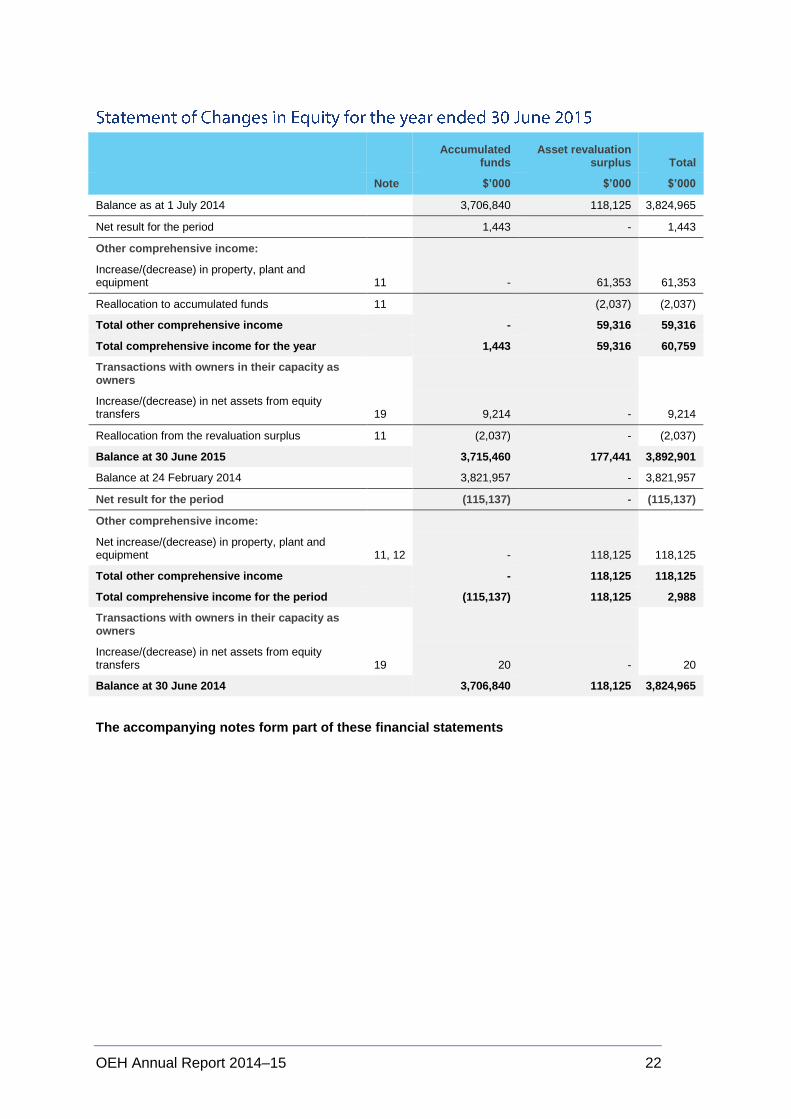
Accumulated
funds Asset revaluation
surplus Total
Note $’000 $’000 $’000
Balance as at 1 July 2014 3,706,840 118,125 3,824,965
Net result for the period 1,443 - 1,443
Other comprehensive income:
Increase/(decrease) in property, plant and equipment 11 - 61,353 61,353
Reallocation to accumulated funds 11 (2,037) (2,037)
Total other comprehensive income - 59,316 59,316
Total comprehensive income for the year 1,443 59,316 60,759
Transactions with owners in their capacity as owners
Increase/(decrease) in net assets from equity transfers 19 9,214 - 9,214
Reallocation from the revaluation surplus 11 (2,037) - (2,037)
Balance at 30 June 2015 3,715,460 177,441 3,892,901
Balance at 24 February 2014 3,821,957 - 3,821,957
Net result for the period (115,137) - (115,137)
Other comprehensive income:
Net increase/(decrease) in property, plant and equipment 11, 12 - 118,125 118,125
Total other comprehensive income - 118,125 118,125
Total comprehensive income for the period (115,137) 118,125 2,988
Transactions with owners in their capacity as owners
Increase/(decrease) in net assets from equity transfers 19 20 - 20
Balance at 30 June 2014 3,706,840 118,125 3,824,965
The accompanying notes form part of these financial statements

23 OEH Annual Report 2014–15
Actual 2015
Budget 2015
Actual for 24 Feb 2014-30 June 2014*
Note $’000 $'000 $'000
Cash flows from operating activities
Payments
Employee related (435,434) (363,818) (140,111)
Grants and subsidies (301,925) (328,830) (182,618)
Finance costs (3,360) (3,810) (3,396)
Other (274,320) (250,504) (156,094)
Total payments (1,015,039) (946,962) (482,219)
Receipts
Reimbursements from the Crown Entity / (Transfers to the Crown Entity) 11,152 - 2,091
Sale of goods and services 46,768 81,764 12,880
Interest received 7,932 7,796 3,733
Retained taxes, fees and fines 27,525 - 7,715
Grants and contributions 867,877 858,995 261,614
Personnel services 99,832 52,609 27,633
Other 64,969 24,420 36,618
Total receipts 1,126,055 1,025,584 352,284
Net cash flows from operating activities 23 111,016 78,622 (129,935)
Cash flows from investing activities
Proceeds from sale of land and buildings, plant and equipment and infrastructure systems 925 995 196
Purchases of land and buildings, plant and equipment and infrastructure systems (35,371) (38,084) (24,218)
Purchases of intangible assets (12,498) (10,921) (9,761)
Net cash flows from investing activities (46,944) (48,010) (33,783)
Cash flows from financing activities
Proceeds from borrowings and advances (5,000) 3,371 -
Repayment of borrowings and advances (30,400) (30,400) (35,972)
Net cash flows from financing activities (35,400) (27,029) (35,972)
Net increase / (decrease) in cash 28,672 3,583 (199,690)
Opening cash and cash equivalents 7 208,405 236,438 -
Cash transferred in / (out) as a result of administrative restructuring - - 408,095
Closing cash and cash equivalents 7 237,077 240,021 208,405
* Under Administrative Arrangements Amendment Order 2014, OEH was established as a separate reporting entity, effective from 24 February 2014. The comparative information is therefore for the period 24 February 2014 to 30 June 2014.
The accompanying notes form part of these financial statements
24 OEH Annual Report 2014–15
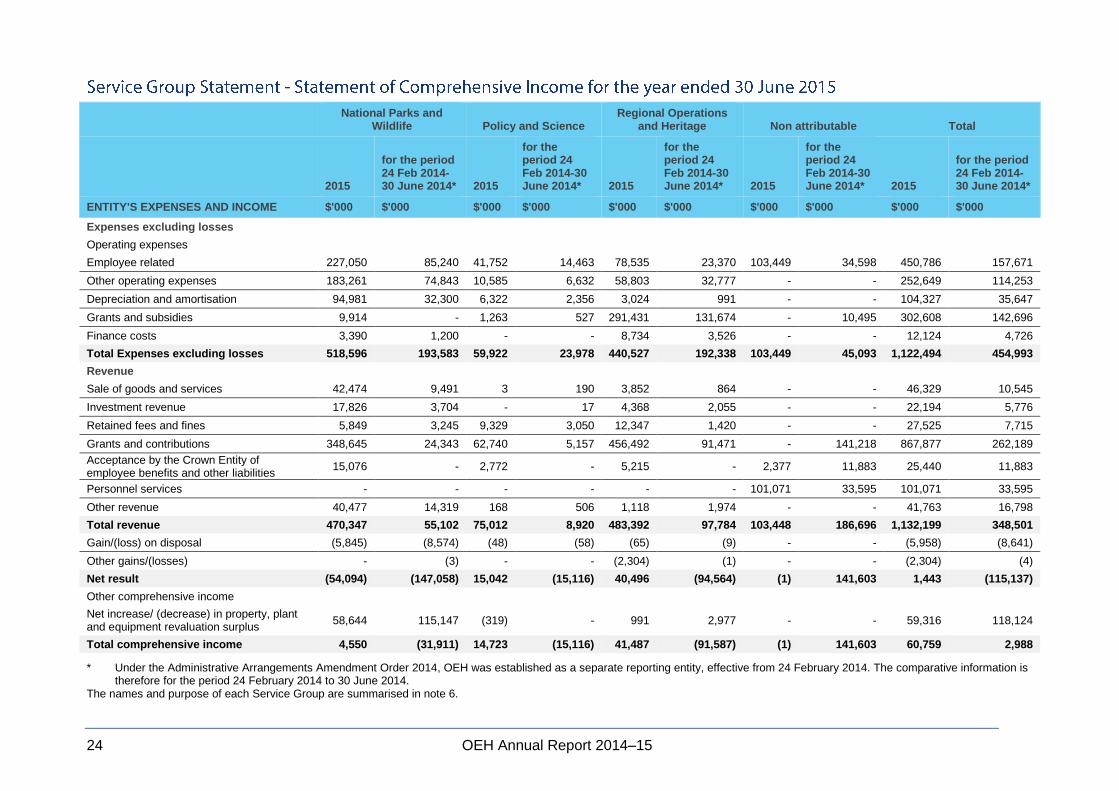
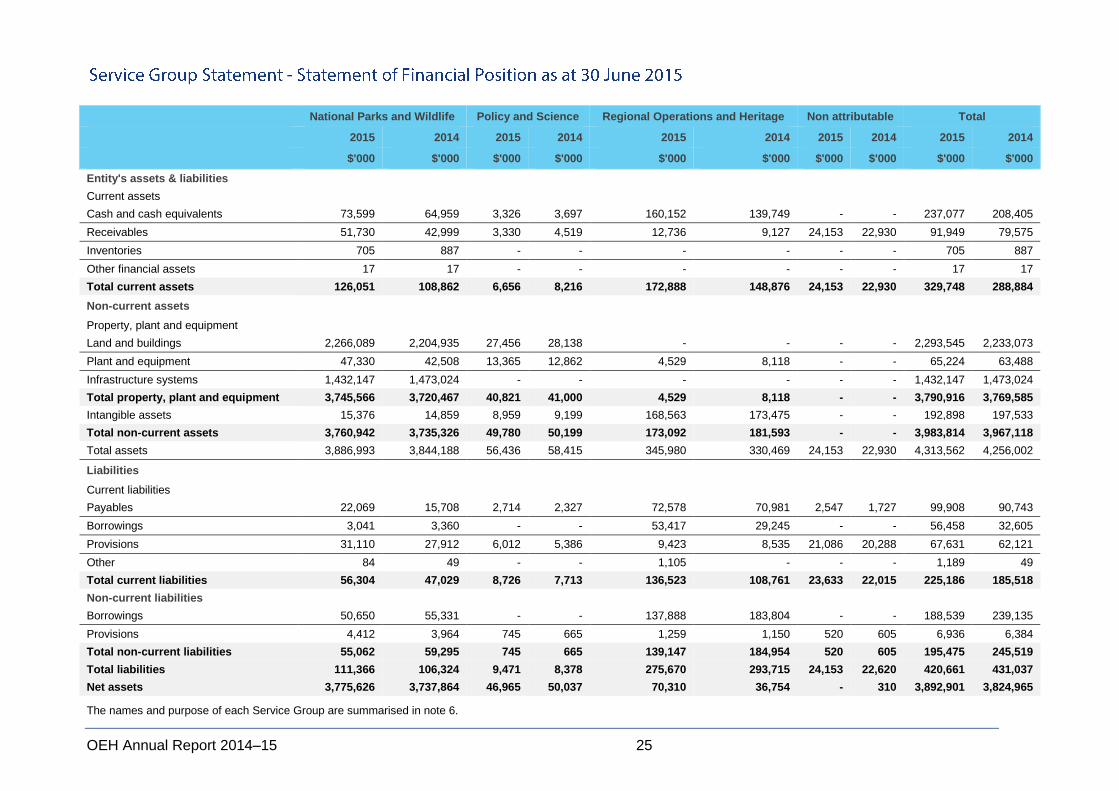
National Parks and
Wildlife Policy and Science Regional Operations
and Heritage Non attributable Total
2015
for the period 24 Feb 2014-30 June 2014* 2015
for the period 24 Feb 2014-30 June 2014* 2015
for the period 24 Feb 2014-30 June 2014* 2015
for the period 24 Feb 2014-30 June 2014* 2015
for the period 24 Feb 2014-30 June 2014*
ENTITY'S EXPENSES AND INCOME $'000 $'000 $'000 $'000 $'000 $'000 $'000 $'000 $'000 $'000
Expenses excluding losses
Operating expenses
Employee related 227,050 85,240 41,752 14,463 78,535 23,370 103,449 34,598 450,786 157,671
Other operating expenses 183,261 74,843 10,585 6,632 58,803 32,777 - - 252,649 114,253
Depreciation and amortisation 94,981 32,300 6,322 2,356 3,024 991 - - 104,327 35,647
Grants and subsidies 9,914 - 1,263 527 291,431 131,674 - 10,495 302,608 142,696
Finance costs 3,390 1,200 - - 8,734 3,526 - - 12,124 4,726
Total Expenses excluding losses 518,596 193,583 59,922 23,978 440,527 192,338 103,449 45,093 1,122,494 454,993
Revenue
Sale of goods and services 42,474 9,491 3 190 3,852 864 - - 46,329 10,545
Investment revenue 17,826 3,704 - 17 4,368 2,055 - - 22,194 5,776
Retained fees and fines 5,849 3,245 9,329 3,050 12,347 1,420 - - 27,525 7,715
Grants and contributions 348,645 24,343 62,740 5,157 456,492 91,471 - 141,218 867,877 262,189
Acceptance by the Crown Entity of employee benefits and other liabilities
15,076 - 2,772 - 5,215 - 2,377 11,883 25,440 11,883
Personnel services - - - - - - 101,071 33,595 101,071 33,595
Other revenue 40,477 14,319 168 506 1,118 1,974 - - 41,763 16,798
Total revenue 470,347 55,102 75,012 8,920 483,392 97,784 103,448 186,696 1,132,199 348,501
Gain/(loss) on disposal (5,845) (8,574) (48) (58) (65) (9) - - (5,958) (8,641)
Other gains/(losses) - (3) - - (2,304) (1) - - (2,304) (4)
Net result (54,094) (147,058) 15,042 (15,116) 40,496 (94,564) (1) 141,603 1,443 (115,137)
Other comprehensive income
Net increase/ (decrease) in property, plant and equipment revaluation surplus
58,644 115,147 (319) - 991 2,977 - - 59,316 118,124
Total comprehensive income 4,550 (31,911) 14,723 (15,116) 41,487 (91,587) (1) 141,603 60,759 2,988
* Under the Administrative Arrangements Amendment Order 2014, OEH was established as a separate reporting entity, effective from 24 February 2014. The comparative information is therefore for the period 24 February 2014 to 30 June 2014.
The names and purpose of each Service Group are summarised in note 6.
OEH Annual Report 2014–15 25
National Parks and Wildlife Policy and Science Regional Operations and Heritage Non attributable Total
2015 2014 2015 2014 2015 2014 2015 2014 2015 2014
$'000 $'000 $'000 $'000 $'000 $'000 $'000 $'000 $'000 $'000
Entity's assets & liabilities
Current assets
Cash and cash equivalents 73,599 64,959 3,326 3,697 160,152 139,749 - - 237,077 208,405
Receivables 51,730 42,999 3,330 4,519 12,736 9,127 24,153 22,930 91,949 79,575
Inventories 705 887 - - - - - - 705 887
Other financial assets 17 17 - - - - - - 17 17
Total current assets 126,051 108,862 6,656 8,216 172,888 148,876 24,153 22,930 329,748 288,884
Non-current assets
Property, plant and equipment
Land and buildings 2,266,089 2,204,935 27,456 28,138 - - - - 2,293,545 2,233,073
Plant and equipment 47,330 42,508 13,365 12,862 4,529 8,118 - - 65,224 63,488
Infrastructure systems 1,432,147 1,473,024 - - - - - - 1,432,147 1,473,024
Total property, plant and equipment 3,745,566 3,720,467 40,821 41,000 4,529 8,118 - - 3,790,916 3,769,585
Intangible assets 15,376 14,859 8,959 9,199 168,563 173,475 - - 192,898 197,533
Total non-current assets 3,760,942 3,735,326 49,780 50,199 173,092 181,593 - - 3,983,814 3,967,118
Total assets 3,886,993 3,844,188 56,436 58,415 345,980 330,469 24,153 22,930 4,313,562 4,256,002
Liabilities
Current liabilities
Payables 22,069 15,708 2,714 2,327 72,578 70,981 2,547 1,727 99,908 90,743
Borrowings 3,041 3,360 - - 53,417 29,245 - - 56,458 32,605
Provisions 31,110 27,912 6,012 5,386 9,423 8,535 21,086 20,288 67,631 62,121
Other 84 49 - - 1,105 - - - 1,189 49
Total current liabilities 56,304 47,029 8,726 7,713 136,523 108,761 23,633 22,015 225,186 185,518
Non-current liabilities
Borrowings 50,650 55,331 - - 137,888 183,804 - - 188,539 239,135
Provisions 4,412 3,964 745 665 1,259 1,150 520 605 6,936 6,384
Total non-current liabilities 55,062 59,295 745 665 139,147 184,954 520 605 195,475 245,519
Total liabilities 111,366 106,324 9,471 8,378 275,670 293,715 24,153 22,620 420,661 431,037
Net assets 3,775,626 3,737,864 46,965 50,037 70,310 36,754 - 310 3,892,901 3,824,965
The names and purpose of each Service Group are summarised in note 6.
26 OEH Annual Report 2014–15
The Office of Environment and Heritage (OEH) is a New South Wales (NSW) government entity. While OEH has certain revenue generating units, it is a not for profit entity as profit is not its principal objective.
OEH is consolidated as part of the NSW total state sector accounts.
OEH includes employee-related expenses and provisions for the Royal Botanic Gardens and Domain Trust, Western Sydney Parklands Trust, Historic Houses Trust, Centennial Park and Moore Park Trust, Parramatta Park Trust, Taronga Conservation Society Australia and Jenolan Caves Reserve Trust. These employee-related expenses and provisions are offset by income and receivables. These entities are independent statutory authorities and their operations are not consolidated with OEH’s financial statements.
The financial statements for the period ended 30 June 2015 have been authorised for issue by the Chief Executive on 17 September 2015.
OEH’s financial statements are general purpose financial statements, which have been prepared on an accrual basis and in accordance with:
applicable Australian Accounting Standards (which include Australian Accounting Interpretations)
the requirements of the Public Finance and Audit Act 1983 and Public Finance and Audit Regulation 2015
the Financial Reporting Directions published in the Financial Reporting Code for NSW General Government Sector Entities or issued by the Treasurer.
Property, plant and equipment and intangible assets are measured at fair value. Other financial statement items are prepared in accordance with the historical cost convention.
Judgements, key assumptions and estimations made by management are disclosed in the relevant notes to the financial statements.
All amounts are rounded to the nearest one thousand dollars and are expressed in Australian currency.
The financial statements and notes comply with the Australian Accounting Standards, which include Australian Accounting Interpretations.
Borrowing costs are recognised as expenses in the period in which they are incurred, in accordance with the Treasury’s Mandate for not-for-profit general government sector entities.
OEH’s insurance activities are conducted through the NSW Treasury Managed Fund Scheme of self-insurance for Government entities. The expense (premium) is determined by the Fund Manager based on past claim experience.
Income, expenses and assets are recognised net of the GST, except where GST incurred by OEH as a purchaser is not recoverable from the Australian Taxation Office, and receivables and payables are disclosed inclusive of GST.
The GST component of cash flows arising from investing and financing activities, which are recoverable from, or payable to, the Australian Taxation Office, are classified as operating cash flows.
OEH Annual Report 2014–15 27
Income is measured at the fair value of the consideration or contribution received or receivable.
i. Parliamentary appropriations, grants and contributions
Except as specified below, parliamentary appropriations (received as grants from the principal department in the cluster) and contributions from other bodies (including grants and donations) are generally recognised as income when OEH obtains control over the assets comprising the appropriations and contributions. Control over appropriations, grants and contributions is normally obtained upon the receipt of cash.
However, unspent appropriations are recognised as liabilities rather than grant income, as the authority to spend the money lapses and the unspent amount must be repaid to the consolidated fund, via the principal department.
ii. Sale of goods
Revenue from the sale of goods is recognised as revenue when OEH transfers the significant risks and rewards of ownership of the assets.
iii. Rendering of services
Revenue is recognised when the service is provided or by reference to the stage of completion (based on labour hours incurred to date and/or milestones achieved).
iv. Investment revenue
Interest revenue is recognised using the effective interest method as set out in AASB 139 financial instruments: recognition and measurement. Rental revenue from operating leases is recognised in accordance with AASB 117 leases on a straight-line basis over the lease term.
v. Retained fees and fines
Revenue from retained fees and fines is recognised as revenue when cash is received by OEH.
i. Acquisition of assets
Assets acquired are initially recognised at cost. Cost is the amount of cash or cash equivalents paid or the fair value of the other consideration given to acquire the asset at the time of its acquisition or construction or, where applicable, the amount attributed to that asset when initially recognised in accordance with the requirements of other Australian Accounting Standards.
Assets acquired at no cost, or for nominal consideration during the year, are initially recognised as assets and revenues at their fair value at the date of acquisition (see also assets transferred as a result of an equity transfer- note 1 (l)).
Fair value is the price that would be received to sell an asset in an orderly transaction between market participants at measurement date.
Where payment for an asset is deferred beyond normal credit terms, its cost is the cash price equivalent i.e. deferred payment amount is effectively discounted over the period of credit.
ii. Capitalisation thresholds
Property, plant and equipment and intangible assets costing $5000 and above individually (or forming part of a network costing more than $5000) are capitalised.
iii. Revaluation of property, plant and equipment
Physical non-current assets are valued in accordance with the ‘valuation of physical non-current assets at fair value’ policy and guidelines paper (TPP 14-01). This policy adopts fair value in accordance with AASB 13 fair value measurement and AASB 116 property, plant and equipment.
Property, plant and equipment is measured at the highest and best use by market participants that is physically possible, legally permissible and financially feasible. The highest and best use must be available at a period that is not remote and take into account the characteristics of the asset being measured, including any socio-political restrictions. In most cases, after taking into account these considerations, the highest and best use is the existing use. In limited circumstances, the highest and best use may be a feasible alternative use, where there are no restrictions on use or where there is a feasible higher restricted alternative use.
Fair value of property, plant and equipment is based on a market participants’ perspective, using valuation techniques (market approach and cost approach) that maximise relevant observable inputs and minimise unobservable inputs. Also refer to note 11, note 12 and note 13 for further information regarding fair value. OEH revalues each class of property, plant and equipment at least every five years or with sufficient regularity to ensure that the carrying amount of each asset in the class does not differ materially from its fair value at reporting date. Land and buildings are revalued every three years.
28 OEH Annual Report 2014–15
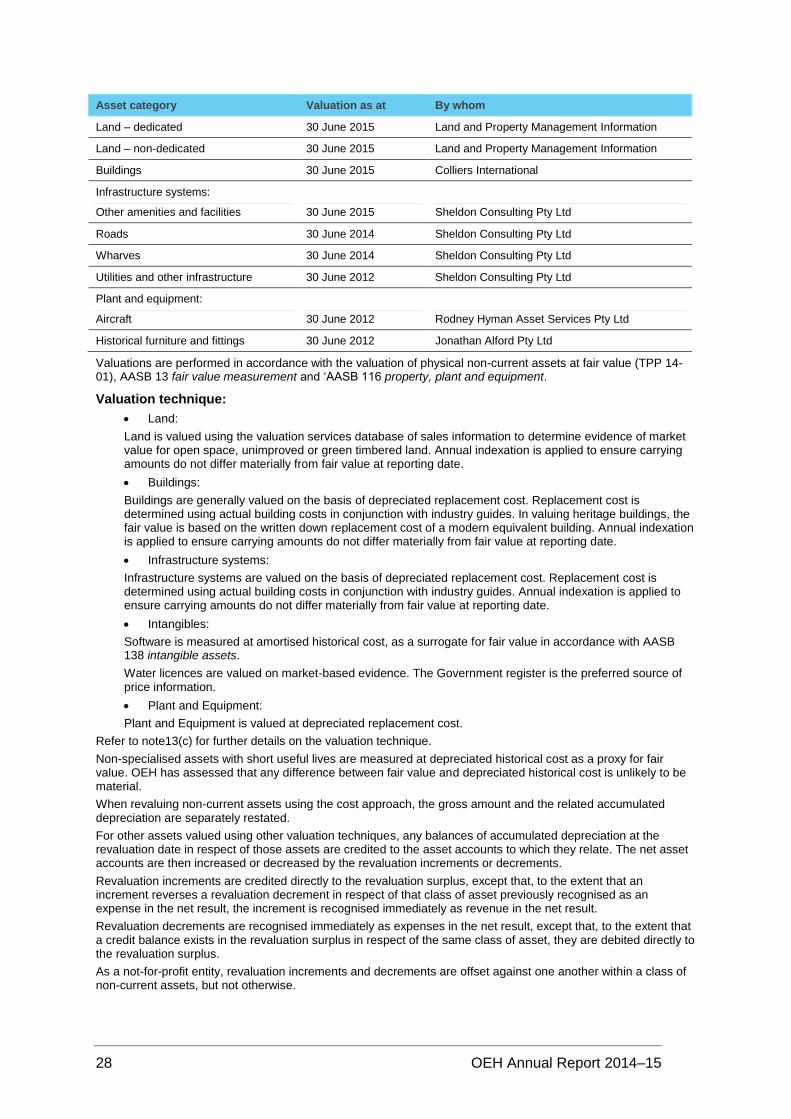
Asset category Valuation as at By whom
Land – dedicated 30 June 2015 Land and Property Management Information
Land – non-dedicated 30 June 2015 Land and Property Management Information
Buildings 30 June 2015 Colliers International
Infrastructure systems:
Other amenities and facilities
30 June 2015
Sheldon Consulting Pty Ltd
Roads 30 June 2014 Sheldon Consulting Pty Ltd
Wharves 30 June 2014 Sheldon Consulting Pty Ltd
Utilities and other infrastructure 30 June 2012 Sheldon Consulting Pty Ltd
Plant and equipment:
Aircraft
30 June 2012
Rodney Hyman Asset Services Pty Ltd
Historical furniture and fittings 30 June 2012 Jonathan Alford Pty Ltd
Valuations are performed in accordance with the valuation of physical non-current assets at fair value (TPP 14-01), AASB 13 fair value measurement and ‘AASB 116 property, plant and equipment.
Valuation technique:
Land:
Land is valued using the valuation services database of sales information to determine evidence of market value for open space, unimproved or green timbered land. Annual indexation is applied to ensure carrying amounts do not differ materially from fair value at reporting date.
Buildings:
Buildings are generally valued on the basis of depreciated replacement cost. Replacement cost is determined using actual building costs in conjunction with industry guides. In valuing heritage buildings, the fair value is based on the written down replacement cost of a modern equivalent building. Annual indexation is applied to ensure carrying amounts do not differ materially from fair value at reporting date.
Infrastructure systems:
Infrastructure systems are valued on the basis of depreciated replacement cost. Replacement cost is determined using actual building costs in conjunction with industry guides. Annual indexation is applied to ensure carrying amounts do not differ materially from fair value at reporting date.
Intangibles:
Software is measured at amortised historical cost, as a surrogate for fair value in accordance with AASB 138 intangible assets.
Water licences are valued on market-based evidence. The Government register is the preferred source of price information.
Plant and Equipment:
Plant and Equipment is valued at depreciated replacement cost.
Refer to note13(c) for further details on the valuation technique.
Non-specialised assets with short useful lives are measured at depreciated historical cost as a proxy for fair value. OEH has assessed that any difference between fair value and depreciated historical cost is unlikely to be material.
When revaluing non-current assets using the cost approach, the gross amount and the related accumulated depreciation are separately restated.
For other assets valued using other valuation techniques, any balances of accumulated depreciation at the revaluation date in respect of those assets are credited to the asset accounts to which they relate. The net asset accounts are then increased or decreased by the revaluation increments or decrements.
Revaluation increments are credited directly to the revaluation surplus, except that, to the extent that an increment reverses a revaluation decrement in respect of that class of asset previously recognised as an expense in the net result, the increment is recognised immediately as revenue in the net result.
Revaluation decrements are recognised immediately as expenses in the net result, except that, to the extent that a credit balance exists in the revaluation surplus in respect of the same class of asset, they are debited directly to the revaluation surplus.
As a not-for-profit entity, revaluation increments and decrements are offset against one another within a class of non-current assets, but not otherwise.
OEH Annual Report 2014–15 29
Where an asset that has previously been revalued is disposed, any balance remaining in the revaluation surplus for that asset is transferred to accumulated funds.
iv. Impairment of property, plant and equipment
As a not-for-profit entity with no cash generating units, impairment under AASB 136 impairment of assets is
unlikely to arise. As property, plant and equipment is carried at fair value, impairment can only arise in the rare circumstances where the costs of disposal are material. Specifically, impairment is unlikely for not-for-profit entities given that AASB 136 modifies the recoverable amount test for non-cash generating assets of not-for-profit entities to the higher of fair value less costs of disposal and depreciated replacement cost, where depreciated replacement cost is also fair value. Selling costs for OEH are regarded as immaterial.
v. Assets not able to be reliably measured
OEH holds certain assets that have not been recognised in the statement of financial position because the value of these assets cannot be measured reliably, due to absence of a reliable market. These assets include a range of cultural artefacts and historic infrastructure.
vi. Depreciation of property, plant and equipment
Except for certain heritage assets, depreciation is provided for on a straight-line basis for all depreciable assets so as to write-off the depreciable amount of each asset as it is consumed over its useful life to OEH.
All material separately identifiable components of assets are depreciated separately over their useful lives.
Land is not a depreciable asset. Certain heritage assets including original artworks and collections may not have a limited useful life because appropriate curatorial and preservation policies are adopted. Such assets are not subject to depreciation. The decision not to recognise depreciation for these assets is reviewed annually.
Buildings and improvements
The construction type of OEH buildings is used to determine the asset’s useful life (from which a depreciation rate is derived).
The following depreciation rates have been adopted:
Historic buildings 1.0 – 2.5%
Visitor centres and staff residences 1.25 – 2.5%
Roads and other access; utilities and other infrastructure
The following depreciation rates have been adopted:
Roads; car parks, fire trails, management trails and walking tracks:
Earthworks
Pavement
0%
5%
Bridges 2%
Boat ramps and wharves, utilities and other infrastructure 5%
Except where bridges, boat ramps, wharves and utilities have been independently valued, an assessment of the useful life of each asset was carried out and the depreciation rate was derived accordingly.
Plant and equipment 6.67–25%
Amortisation of intangible assets
The following depreciation rates have been adopted:
Software 25%
Water licences Nil
vii. Major inspection costs
When each major inspection is performed, the labour cost of performing major inspections for faults is recognised in the carrying amount of an asset as a replacement of a part, if the recognition criteria are satisfied.
viii. Restoration costs
The estimated cost of dismantling and removing an asset and restoring the site is included in the cost of an asset, to the extent it is recognised as a liability.
ix. Maintenance
Day-to-day servicing costs or maintenance are charged as expenses as incurred, except where they relate to the replacement of a part or component of an asset, in which case the costs are capitalised and depreciated. Refer to note 2(b).
30 OEH Annual Report 2014–15
x. Leased assets
Under certain leases granted by OEH, the lessee will maintain or improve the leased property, which at the expiry of the lease, reverts to the ownership of OEH. Where land is leased, property may be built on the land by the lessee and at the expiry of the lease, ownership of the property transfers to OEH.
Assets and improvements are brought to account by OEH upon expiry of the lease, when actual ownership and control reverts to OEH. Upon assumption of ownership, the asset will be included in the OEH asset register at its fair value. Examples of such prospective assets include commercial buildings and infrastructure, such as marinas and ski lifts built by lessees on OEH property.
A distinction is made between finance leases, which effectively transfer from the lessor to the lessee substantially all the risks and benefits incidental to the ownership of the leased assets, and operating leases under which the lessor does not transfer substantially all the risks and rewards.
Currently OEH does not have any finance leases.
Operating lease payments are charged to the statement of comprehensive income in the periods in which they are incurred. Operating lease payments are recognised as an expense on a straight-line basis over the lease term.
xi. Intangible assets
OEH recognises intangible assets only if it is probable that future economic benefit will flow to OEH and the cost of the asset can be measured reliably. Intangible assets are measured initially at cost. Where an asset is acquired at no or nominal cost, the cost is its fair value as at the date of acquisition.
All research costs are expensed. Development costs are only capitalised when certain criteria are met.
Software
The useful lives of intangible software assets are assessed to be finite.
Intangible assets are subsequently measured at fair value only if there is an active market. As there is no active market for OEH’s intangible software assets, the assets are carried at cost less any accumulated amortisation and impairment losses.
OEH's intangible software assets are amortised using the straight line method over a period of four years.
Water licences
OEH recognises water licences issued under the Water Management Act 2000. Purchased licences are initially recorded at cost and are valued regularly based on market evidence.
OEH’s water licence assets are not amortised.
Intangible assets are tested for impairment where an indicator of impairment exists. If the recoverable amount is less than its carrying amount, the carrying amount is reduced to recoverable amount and the reduction is recognised as an impairment loss.
xii. Loans and receivables
Loans and receivables are non-derivative financial assets with fixed or determinable payments that are not quoted in an active market. These financial assets are recognised initially at fair value, usually based on the transaction cost, or face value. Subsequent measurement is at amortised cost using the effective interest method, less an allowance for any impairment of receivables. Any changes are recognised in the net result for the year when impaired, derecognised or through the amortisation process.
Short-term receivables with no stated interest rate are measured at the original invoice amount where the effect of discounting is immaterial.
xiii. Inventories
Inventories held for distribution are stated at cost, adjusted when applicable, for any loss of service potential. A loss of service potential is identified and measured based on the existence of a current replacement cost that is lower than the carrying amount. Inventories (other than those held for distribution) are stated at the lower of cost and net realisable value. Cost is calculated using the weighted average cost or ‘first in first out’ method.
Net realisable value is the estimated selling price in the ordinary course of business less the estimated costs of completion and the estimated costs necessary to make the sale.
The cost of inventories acquired for nil cost or for nominal consideration is the current replacement cost as at the date of acquisition. Current replacement cost is the cost OEH would incur to acquire the asset.
Shop stocks held for 12 months or more and considered unsaleable are treated as obsolete and expensed in the net result for the year.
Generally, the amount of inventory held is small. OEH relies on annual stock takes to identify shop stocks and inventory held for distribution for reporting purposes.
OEH Annual Report 2014–15 31
xiv. Impairment of financial assets
All financial assets, except those measured at fair value through profit and loss, are subject to an annual review for impairment. An allowance for impairment is established when there is objective evidence that the entity will not be able to collect all amounts due.
For financial assets carried at amortised cost, the amount of the allowance is the difference between the asset’s carrying amount and the present value of estimated future cash flows, discounted at the effective interest rate. The amount of the impairment loss is recognised in the net result for the year.
When an available-for-sale financial asset is impaired, the amount of the cumulative loss is removed from equity and recognised in the net result for the year, based on the difference between the acquisition cost (net of any principal repayment and amortisation) and current fair value, less any impairment previously recognised in the net result for the year.
Any reversals of prior year impairment losses are captured through the net result for the current year. Reversals cannot result in a carrying amount that exceeds what the carrying amount would have been had there not been an impairment loss.
xv. Derecognition of financial assets and financial liabilities
A financial asset is derecognised when the contractual rights to the cash flows from the financial assets expire or if OEH transfers the financial asset:
where substantially all the risks and rewards have been transferred, or
where OEH has not transferred substantially all the risks and rewards, if OEH has not retained control.
Where OEH has neither transferred nor retained substantially all the risks and rewards or transferred control, the asset is recognised to the extent of OEH’s continuing involvement in the asset.
A financial liability is derecognised when the obligation specified in the contract is discharged, cancelled or expires.
i. Payables
These amounts represent liabilities for goods and services provided to OEH and other amounts. Payables are recognised initially at fair value, usually based on the transaction cost or face value. Subsequent measurement is at amortised cost using the effective interest method. Short-term payables with no stated interest are measured at the original invoice amount where the effect of discounting is immaterial.
ii. Borrowings
Borrowings are not held for trading or designated at fair value through profit or loss and are recognised at amortised cost using the effective interest method.
iii. Financial guarantees
A financial guarantee is a contract that requires the issuer to make specified payments to reimburse the holder for loss it incurred when a specified debtor fails to make payment when due in accordance with the original or modified terms of a debt instrument.
A financial guarantee is recognised as a liability at the time the guarantee is issued and initially measured at fair value, where material. After initial recognition, the liability is measured at the higher of the amount determined in accordance with AASB 137 provisions, contingent liabilities and contingent assets and the amount initially recognised, less accumulated amortisation, where appropriate.
OEH has reviewed its financial guarantees and determined that there is no material liability to be recognised as at 30 June 2015. However, refer to note 21 for disclosure on contingent liabilities.
iv. Employee benefits and other provisions
a) Salaries and wages, annual leave, sick leave and on-costs
Salaries and wages (including non-monetary benefits), and paid sick leave that are expected to be settled wholly within 12 months after the end of the period in which the employees render the service are recognised and measured at the undiscounted amounts of the benefits.
Annual leave is not expected to be settled wholly before twelve months after the end of the annual reporting period in which the employees render the related service. As such, it is required to be measured at present value in accordance with AASB 119 employee benefits, although short-cut methods are permitted. Actuarial advice obtained by Treasury has confirmed that the use of an approach using nominal annual leave plus annual leave on the nominal liability (using 7.9% of the nominal value of annual leave) can be used to approximate the present value of the annual leave liability. OEH has assessed the actuarial advice based on its circumstances and has determined that the effect of discounting is immaterial to annual leave.
Unused non-vesting sick leave does not give rise to a liability as it is not considered probable that sick leave taken in the future will be greater than the benefits accrued in the future.
32 OEH Annual Report 2014–15
b) Long service leave and superannuation
Apart from the staff assigned to Taronga Conservation Society Australia and Jenolan Caves Reserve Trust, liabilities for long service leave and defined benefit superannuation for all other employees are assumed by the Crown Entity. OEH accounts for the liability as having been extinguished resulting in the amount assumed being shown as part of the non-monetary revenue item described as ‘acceptance by the Crown Entity of employee benefits and other liabilities’.
Long service leave is measured at present value in accordance with AASB 119 employee benefits. This is based on the application of certain factors (specified in NSWTC 15-09) to employees with five or more years of service, using current rates of pay. These factors were determined on an actuarial review to approximate present value.
The superannuation expense for the financial year is determined using the formulae specified in the Treasurer’s Directions. The expense for certain superannuation schemes, (i.e. Basic Benefit and First State Super) is calculated as a percentage of the employees’ salary. For other superannuation schemes (i.e. State Superannuation Scheme and State Authorities Superannuation Scheme) the expense is calculated as a multiple of the employees’ superannuation contributions. For employees where superannuation liability is not assumed by the Crown, the expenses relating to defined benefits are reflected by the movement in estimated liability.
All superannuation funds are administered by the Superannuation Administration Corporation trading as Pillar Administration.
For employees where the liability for superannuation and long service leave is not assumed by the Crown, OEH has a receivable equivalent to the amount of estimated provision, from the agencies to which these staff are assigned i.e. Taronga Conservation Society Australia and Jenolan Caves Reserve Trust.
c) Consequential on-costs
Consequential costs to employment are recognised as liabilities and expenses where the employee benefits to which they relate have been recognised. This includes outstanding amounts of payroll tax, workers’ compensation insurance premiums and fringe benefits tax.
v. Other provisions
Other provisions exist when OEH has a present legal or constructive obligation as a result of a past event, it is probable that an outflow of resources will be required to settle the obligation and a reliable estimate can be made of the amount of the obligation.
Provision for restructuring is recognised only when OEH has a detailed formal plan, has raised a valid expectation in those affected by the restructuring that it will carry out the restructure and has started to implement the plan or announced its main features to those affected.
Where the impact is material, provisions are discounted at the current cash rate, which is a pre-tax rate that reflects the current market assessment of the time value of money and the risks specific to the liability.
A number of OEH’s accounting policies and disclosures require the measurement of fair values, for both financial and non-financial assets and liabilities. When measuring fair value, the valuation technique used maximises the use of relevant observable inputs and minimises the use of unobservable inputs. Under AASB 13, OEH categorises, for disclosure purposes, the valuation techniques based on the inputs used as follows:
i. Level 1: quoted prices in active markets for identical assets/liabilities that OEH can access at the measurement date
ii. Level 2: inputs other than quoted prices included within level 1 that are observable, either directly or indirectly
iii. Level 3: inputs that are not based on observable market data (unobservable inputs).
OEH recognises transfers between levels of the fair value hierarchy at the end of the reporting period during which the change has occurred.
Refer to note 13 and note 24 for further disclosures regarding fair value measurements of non-financial and financial assets.
i. Revaluation surplus
The reserve is used to record increments and decrements on the revaluation of non-current assets. This accords with OEH’s policy on the revaluation of property, plant and equipment as discussed in note 1(h) (iii).
ii. Accumulated funds
The category ‘accumulated funds’ includes all current and prior period retained funds.
OEH Annual Report 2014–15 33
iii. Reserves
Separate reserve accounts are recognised in the financial statements only if such accounts are required by specific legislation or Australian Accounting Standards (e.g. revaluation reserve).
The transfer of net assets between entities as a result of an administrative restructure, transfers of programs/functions and parts thereof between NSW public sector entities and 'equity appropriations' are designated or required by the Accounting Standards to be treated as contributions by owners and recognised as an adjustment to 'accumulated funds'. This treatment is consistent with AASB 1004 contributions and Australian interpretation 1038 contributions by owners made to wholly-owned public sector entities.
Transfers arising from an administrative restructure involving not-for-profit and for-profit government entities are recognised at the amount at which the assets and liabilities were recognised by the transferor immediately prior to the restructure. Subject to below, in most instances this will approximate fair value.
All other equity transfers are recognised at fair value, except for intangibles. Where an intangible has been recognised at (amortised) cost by the transferor because there is no active market, the entity recognises the asset at the transferor’s carrying amount. Where the transferor is prohibited from recognising internally generated intangibles, the entity does not recognise that asset.
Except when an Australian Accounting Standard permits or requires otherwise, comparative information is disclosed in respect to the previous period for all amounts reported in the financial statements.
Under the Administrative Arrangements Amendment Order 2014, OEH was established as a separate reporting entity, effective from 24 February 2014. The comparative disclosed in the statement of comprehensive income
and in related notes is from 24 February 2014 to 30 June 2014.
The budgeted amounts are drawn from the original budgeted financial statements presented to Parliament in respect to the reporting period. Subsequent amendments to the original budget (e.g. adjustment for transfer of functions between entities as a result of Administrative Arrangements Orders) are not reflected in the budgeted amounts. Major variances between the original budgeted amounts and the actual amounts, disclosed in the primary financial statements are explained in note 22.
i. Issued but not yet effective
NSW public sector entities are not permitted to early adopt new Australian Accounting Standards, unless Treasury determines otherwise.
The following new Accounting Standards have not been applied and are not yet effective (NSW Treasury mandate TC 15/03):
AASB 9, AASB 2010-7, AASB 2013-9 (Part C), AASB 2014-1 (Part E), AASB 2014-7 and AASB 2014-8 regarding financial instruments
AASB 10, AASB 12 and AASB 128 regarding investment entities
AASB 10, AASB 124 and AASB 1049 regarding extending related part disclosures to not-for-profit entities
AASB 13 related to fair value disclosures of not-for-profit entities
AASB 14 and AASB 2014-1(Part D) regarding regulatory deferral accounts
AASB 15 and AASB 2014-5 regarding revenue from contracts with customers
AASB 1056 superannuation entities
AASB 2014-3 regarding accounting for acquisitions of interests in joint operations
AASB 2014-4 regarding acceptable methods of depreciation and amortisation
AASB 2014-6 regarding bearer plants
AASB 2014-9 regarding equity method in separate financial statements
AASB 2014-10 regarding sale or contribution of assets between and investor and its associate or joint venture
AASB 2015-1 regarding annual improvements to Australian Accounting Standards 2012-2014 cycle
AASB 2015-2 regarding amendments to AASB 101 disclosure initiatives
AASB 2015-3 regarding materiality
AASB 2015-7 regarding amendments to Australian Accounting Standards, Fair Value Disclosures of Not for Profit Public Sector Entities.
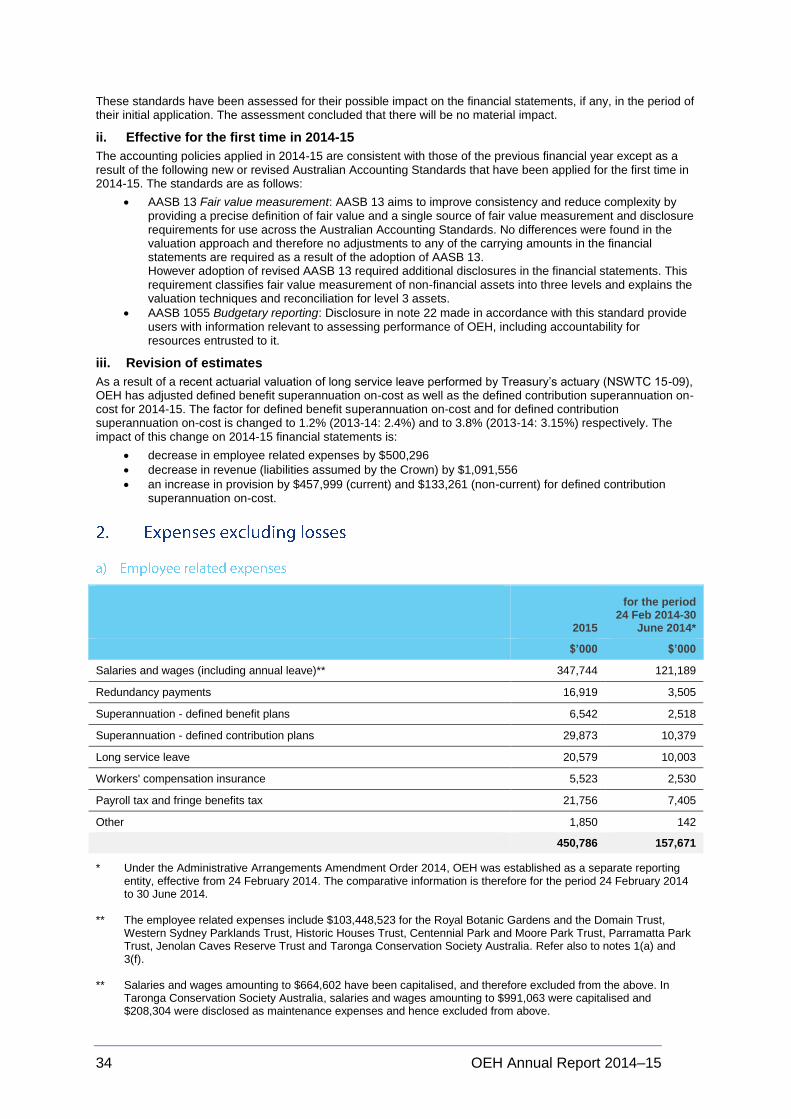
34 OEH Annual Report 2014–15
These standards have been assessed for their possible impact on the financial statements, if any, in the period of their initial application. The assessment concluded that there will be no material impact.
ii. Effective for the first time in 2014-15
The accounting policies applied in 2014-15 are consistent with those of the previous financial year except as a result of the following new or revised Australian Accounting Standards that have been applied for the first time in 2014-15. The standards are as follows:
AASB 13 Fair value measurement: AASB 13 aims to improve consistency and reduce complexity by providing a precise definition of fair value and a single source of fair value measurement and disclosure requirements for use across the Australian Accounting Standards. No differences were found in the valuation approach and therefore no adjustments to any of the carrying amounts in the financial statements are required as a result of the adoption of AASB 13. However adoption of revised AASB 13 required additional disclosures in the financial statements. This requirement classifies fair value measurement of non-financial assets into three levels and explains the valuation techniques and reconciliation for level 3 assets.
AASB 1055 Budgetary reporting: Disclosure in note 22 made in accordance with this standard provide users with information relevant to assessing performance of OEH, including accountability for resources entrusted to it.
iii. Revision of estimates
As a result of a recent actuarial valuation of long service leave performed by Treasury’s actuary (NSWTC 15-09), OEH has adjusted defined benefit superannuation on-cost as well as the defined contribution superannuation on-cost for 2014-15. The factor for defined benefit superannuation on-cost and for defined contribution superannuation on-cost is changed to 1.2% (2013-14: 2.4%) and to 3.8% (2013-14: 3.15%) respectively. The impact of this change on 2014-15 financial statements is:
decrease in employee related expenses by $500,296
decrease in revenue (liabilities assumed by the Crown) by $1,091,556
an increase in provision by $457,999 (current) and $133,261 (non-current) for defined contribution superannuation on-cost.
2015
for the period 24 Feb 2014-30
June 2014*
$’000 $’000
Salaries and wages (including annual leave)** 347,744 121,189
Redundancy payments 16,919 3,505
Superannuation - defined benefit plans 6,542 2,518
Superannuation - defined contribution plans 29,873 10,379
Long service leave 20,579 10,003
Workers' compensation insurance 5,523 2,530
Payroll tax and fringe benefits tax 21,756 7,405
Other 1,850 142
450,786 157,671
* Under the Administrative Arrangements Amendment Order 2014, OEH was established as a separate reporting entity, effective from 24 February 2014. The comparative information is therefore for the period 24 February 2014 to 30 June 2014.
** The employee related expenses include $103,448,523 for the Royal Botanic Gardens and the Domain Trust,
Western Sydney Parklands Trust, Historic Houses Trust, Centennial Park and Moore Park Trust, Parramatta Park Trust, Jenolan Caves Reserve Trust and Taronga Conservation Society Australia. Refer also to notes 1(a) and 3(f).
** Salaries and wages amounting to $664,602 have been capitalised, and therefore excluded from the above. In
Taronga Conservation Society Australia, salaries and wages amounting to $991,063 were capitalised and $208,304 were disclosed as maintenance expenses and hence excluded from above.

OEH Annual Report 2014–15 35
2015
for the period 24 Feb 2014-
30 June 2014*
$’000 $’000
Contractor - projects 57,382 26,648
Consultants 531 402
Maintenance* 39,156 19,574
Fees and services 18,290 7,447
Payments to NSW Government agencies 21,284 17,496
Stores and minor assets 12,630 8,333
Fleet costs 33,596 11,706
Purchase of water allocation 608 204
Operating lease rental expenses (minimum lease payments) 13,145 4,047
Insurance 17,988 5,874
Information dissemination 3,548 1,387
Travel costs 6,767 2,316
Other occupancy costs 11,626 3,201
Training 7,101 2,763
Communication costs 4,575 1,722
Legal costs 1,493 653
Cost of sales 1,487 165
Energy costs 423 120
Auditor's remuneration (audit of the financial statements) 385 331
Impairment of assets and bad debts 608 62
Other 637 311
Expenses capitalised (611) (509)
252,649 114,253
* Reconciliation - total maintenance
Maintenance expense - contracted labour and other (non-employee related), as above
39,156 19,574
Employee related maintenance expense included in note 2(a) 38,573 4,451
Total maintenance expenses included in note 2(a) + 2(b) 77,729 24,025
* Under the Administrative Arrangements Amendment Order 2014, OEH was established as a separate reporting entity, effective from 24 February 2014. The comparative information is therefore for the period 24 February 2014 to 30 June 2014.
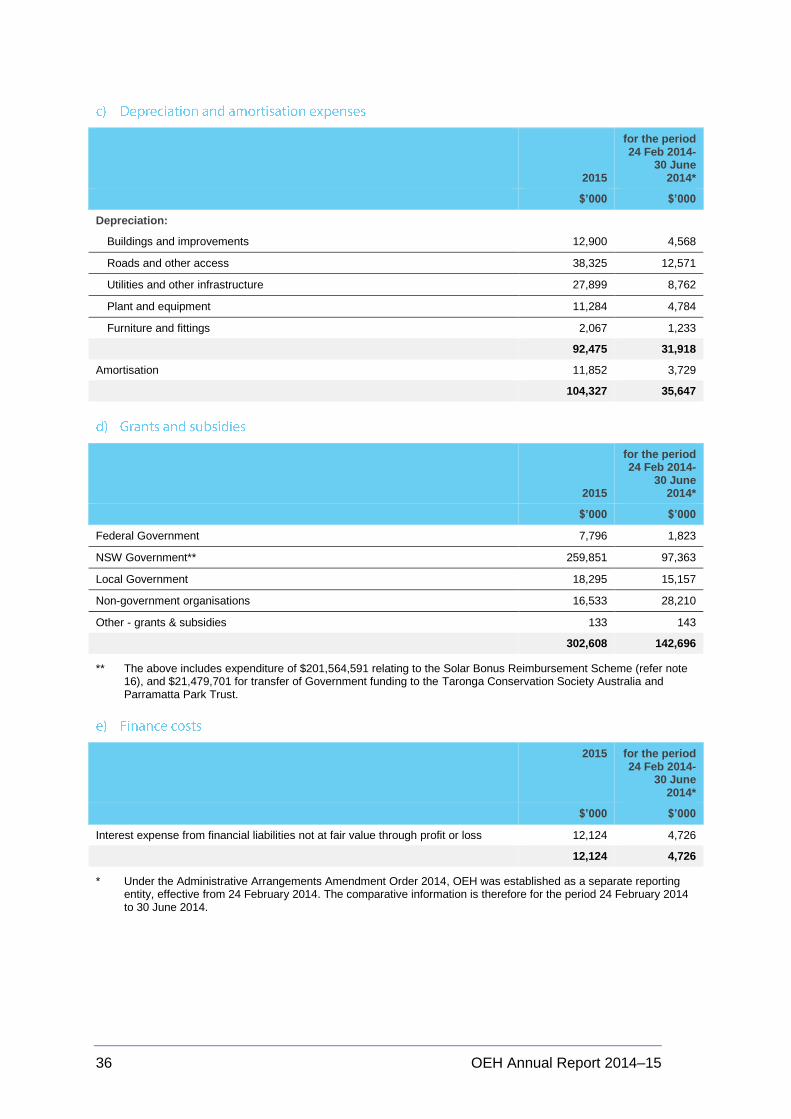
36 OEH Annual Report 2014–15
2015
for the period 24 Feb 2014-
30 June 2014*
$’000 $’000
Depreciation:
Buildings and improvements 12,900 4,568
Roads and other access 38,325 12,571
Utilities and other infrastructure 27,899 8,762
Plant and equipment 11,284 4,784
Furniture and fittings 2,067 1,233
92,475 31,918
Amortisation 11,852 3,729
104,327 35,647
2015
for the period 24 Feb 2014-
30 June 2014*
$’000 $’000
Federal Government 7,796 1,823
NSW Government** 259,851 97,363
Local Government 18,295 15,157
Non-government organisations 16,533 28,210
Other - grants & subsidies 133 143
302,608 142,696
** The above includes expenditure of $201,564,591 relating to the Solar Bonus Reimbursement Scheme (refer note 16), and $21,479,701 for transfer of Government funding to the Taronga Conservation Society Australia and Parramatta Park Trust.
2015 for the period 24 Feb 2014-
30 June 2014*
$’000 $’000
Interest expense from financial liabilities not at fair value through profit or loss 12,124 4,726
12,124 4,726
* Under the Administrative Arrangements Amendment Order 2014, OEH was established as a separate reporting entity, effective from 24 February 2014. The comparative information is therefore for the period 24 February 2014 to 30 June 2014.
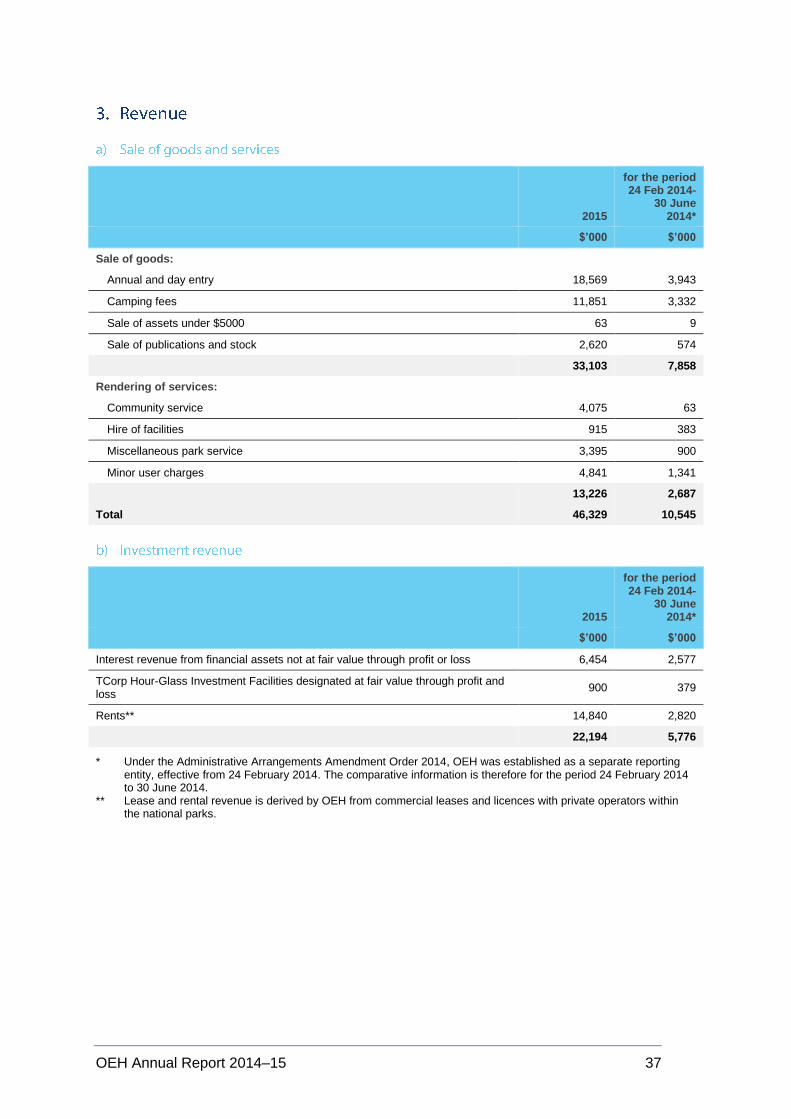
OEH Annual Report 2014–15 37
2015
for the period 24 Feb 2014-
30 June 2014*
$’000 $’000
Sale of goods:
Annual and day entry 18,569 3,943
Camping fees 11,851 3,332
Sale of assets under $5000 63 9
Sale of publications and stock 2,620 574
33,103 7,858
Rendering of services:
Community service 4,075 63
Hire of facilities 915 383
Miscellaneous park service 3,395 900
Minor user charges 4,841 1,341
13,226 2,687
Total 46,329 10,545
2015
for the period 24 Feb 2014-
30 June 2014*
$’000 $’000
Interest revenue from financial assets not at fair value through profit or loss 6,454 2,577
TCorp Hour-Glass Investment Facilities designated at fair value through profit and loss
900 379
Rents** 14,840 2,820
22,194 5,776
* Under the Administrative Arrangements Amendment Order 2014, OEH was established as a separate reporting entity, effective from 24 February 2014. The comparative information is therefore for the period 24 February 2014 to 30 June 2014.
** Lease and rental revenue is derived by OEH from commercial leases and licences with private operators within the national parks.
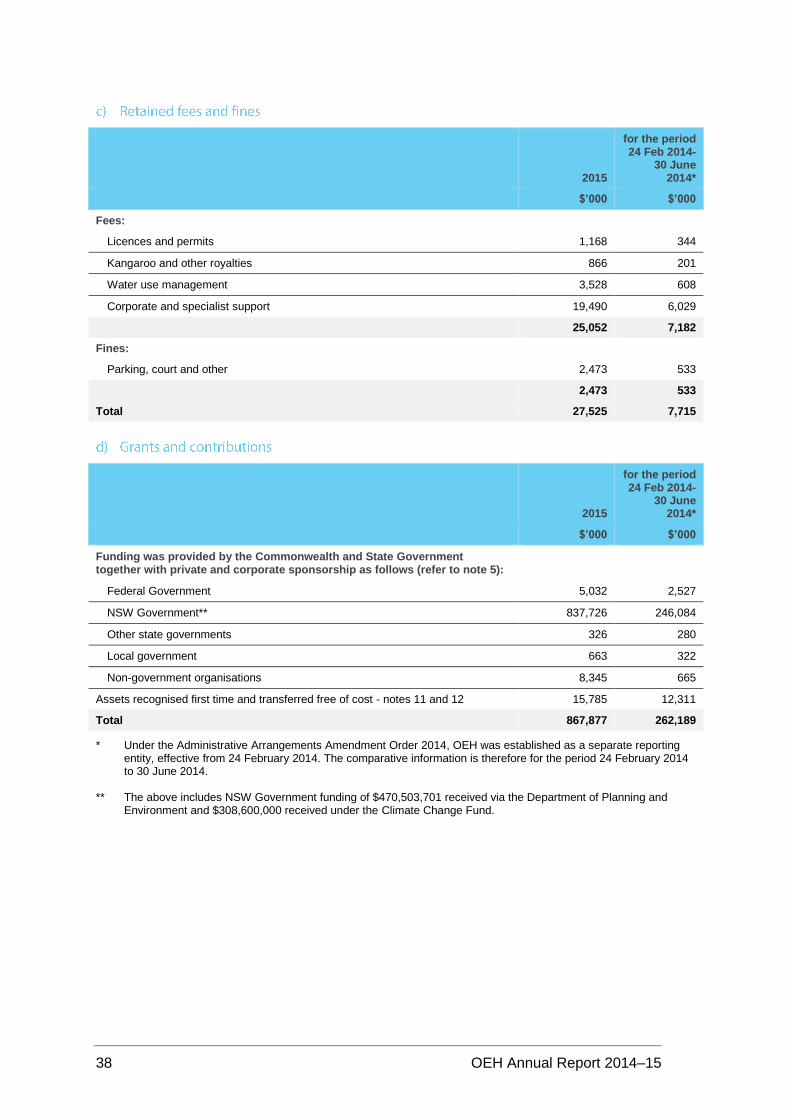
38 OEH Annual Report 2014–15
2015
for the period 24 Feb 2014-
30 June 2014*
$’000 $’000
Fees:
Licences and permits 1,168 344
Kangaroo and other royalties 866 201
Water use management 3,528 608
Corporate and specialist support 19,490 6,029
25,052 7,182
Fines:
Parking, court and other 2,473 533
2,473 533
Total 27,525 7,715
2015
for the period 24 Feb 2014-
30 June 2014*
$’000 $’000
Funding was provided by the Commonwealth and State Government together with private and corporate sponsorship as follows (refer to note 5):
Federal Government 5,032 2,527
NSW Government** 837,726 246,084
Other state governments 326 280
Local government 663 322
Non-government organisations 8,345 665
Assets recognised first time and transferred free of cost - notes 11 and 12 15,785 12,311
Total 867,877 262,189
* Under the Administrative Arrangements Amendment Order 2014, OEH was established as a separate reporting entity, effective from 24 February 2014. The comparative information is therefore for the period 24 February 2014 to 30 June 2014.
** The above includes NSW Government funding of $470,503,701 received via the Department of Planning and
Environment and $308,600,000 received under the Climate Change Fund.
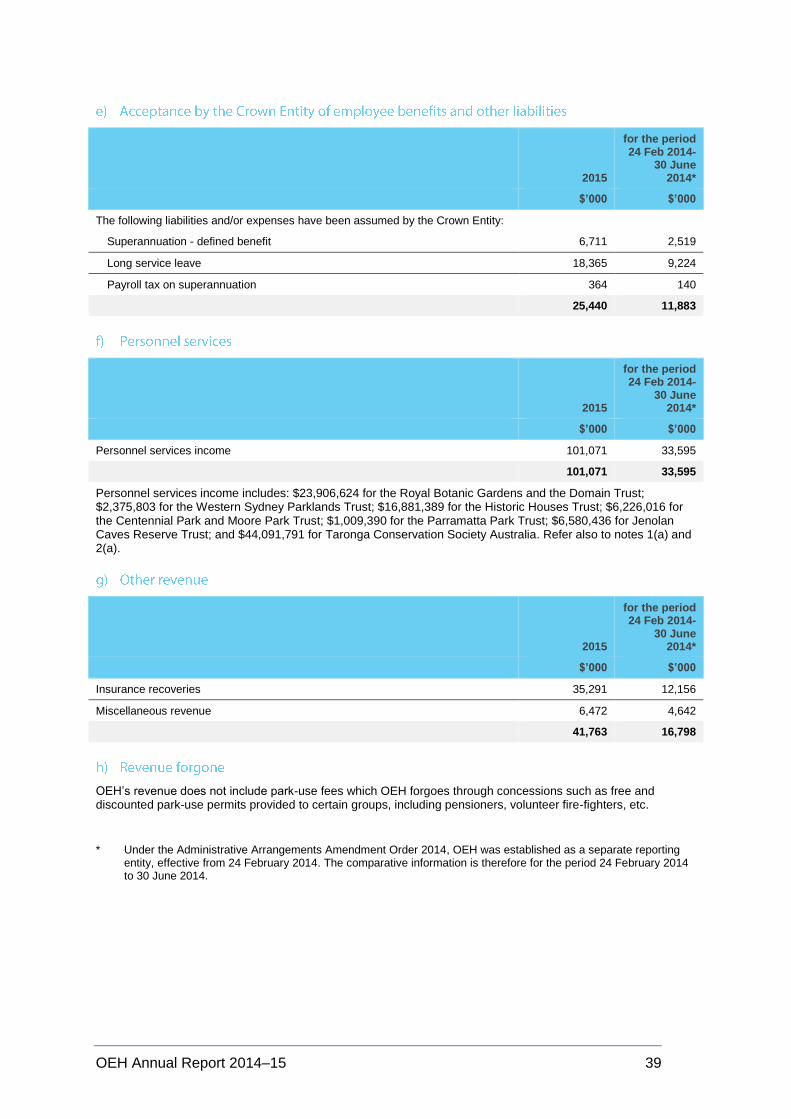
OEH Annual Report 2014–15 39
2015
for the period 24 Feb 2014-
30 June 2014*
$’000 $’000
The following liabilities and/or expenses have been assumed by the Crown Entity:
Superannuation - defined benefit 6,711 2,519
Long service leave 18,365 9,224
Payroll tax on superannuation 364 140
25,440 11,883
2015
for the period 24 Feb 2014-
30 June 2014*
$’000 $’000
Personnel services income 101,071 33,595
101,071 33,595
Personnel services income includes: $23,906,624 for the Royal Botanic Gardens and the Domain Trust; $2,375,803 for the Western Sydney Parklands Trust; $16,881,389 for the Historic Houses Trust; $6,226,016 for the Centennial Park and Moore Park Trust; $1,009,390 for the Parramatta Park Trust; $6,580,436 for Jenolan Caves Reserve Trust; and $44,091,791 for Taronga Conservation Society Australia. Refer also to notes 1(a) and 2(a).
2015
for the period 24 Feb 2014-
30 June 2014*
$’000 $’000
Insurance recoveries 35,291 12,156
Miscellaneous revenue 6,472 4,642
41,763 16,798
OEH’s revenue does not include park-use fees which OEH forgoes through concessions such as free and discounted park-use permits provided to certain groups, including pensioners, volunteer fire-fighters, etc.
* Under the Administrative Arrangements Amendment Order 2014, OEH was established as a separate reporting entity, effective from 24 February 2014. The comparative information is therefore for the period 24 February 2014 to 30 June 2014.
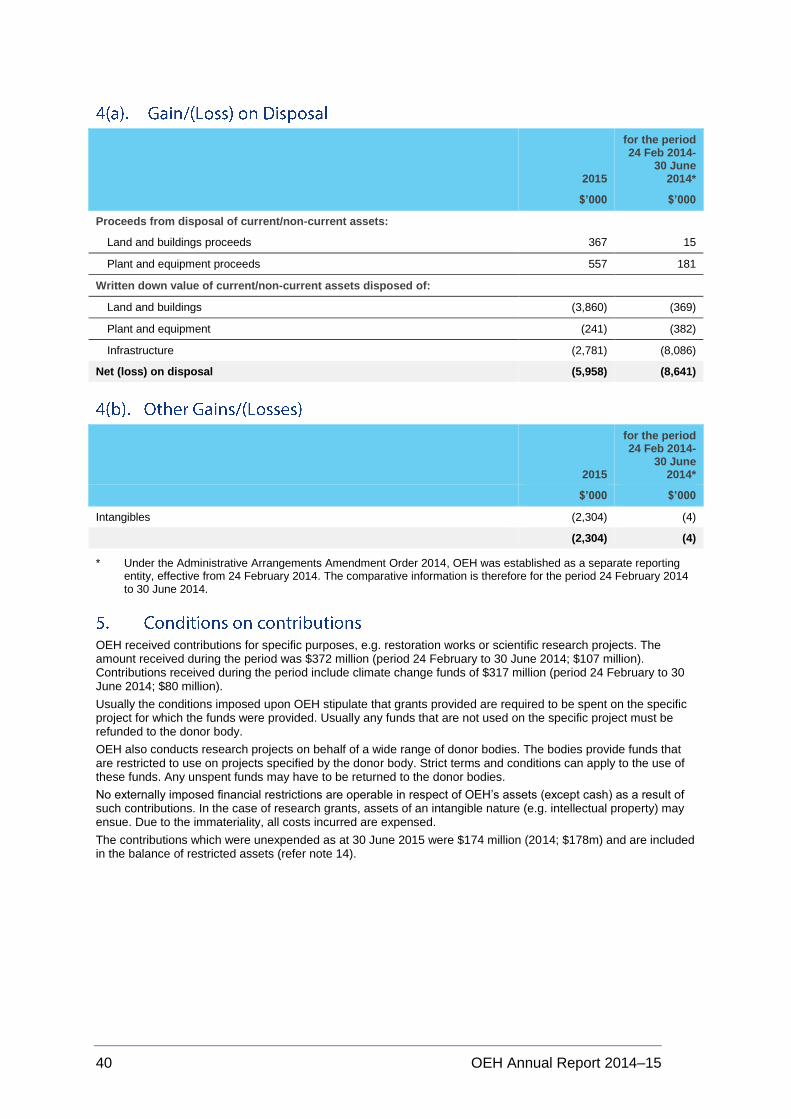
40 OEH Annual Report 2014–15
2015
for the period 24 Feb 2014-
30 June 2014*
$’000 $’000
Proceeds from disposal of current/non-current assets:
Land and buildings proceeds 367 15
Plant and equipment proceeds 557 181
Written down value of current/non-current assets disposed of:
Land and buildings (3,860) (369)
Plant and equipment (241) (382)
Infrastructure (2,781) (8,086)
Net (loss) on disposal (5,958) (8,641)
2015
for the period 24 Feb 2014-
30 June 2014*
$’000 $’000
Intangibles (2,304) (4)
(2,304) (4)
* Under the Administrative Arrangements Amendment Order 2014, OEH was established as a separate reporting entity, effective from 24 February 2014. The comparative information is therefore for the period 24 February 2014 to 30 June 2014.
OEH received contributions for specific purposes, e.g. restoration works or scientific research projects. The amount received during the period was $372 million (period 24 February to 30 June 2014; $107 million). Contributions received during the period include climate change funds of $317 million (period 24 February to 30 June 2014; $80 million).
Usually the conditions imposed upon OEH stipulate that grants provided are required to be spent on the specific project for which the funds were provided. Usually any funds that are not used on the specific project must be refunded to the donor body.
OEH also conducts research projects on behalf of a wide range of donor bodies. The bodies provide funds that are restricted to use on projects specified by the donor body. Strict terms and conditions can apply to the use of these funds. Any unspent funds may have to be returned to the donor bodies.
No externally imposed financial restrictions are operable in respect of OEH’s assets (except cash) as a result of such contributions. In the case of research grants, assets of an intangible nature (e.g. intellectual property) may ensue. Due to the immateriality, all costs incurred are expensed.
The contributions which were unexpended as at 30 June 2015 were $174 million (2014; $178m) and are included in the balance of restricted assets (refer note 14).
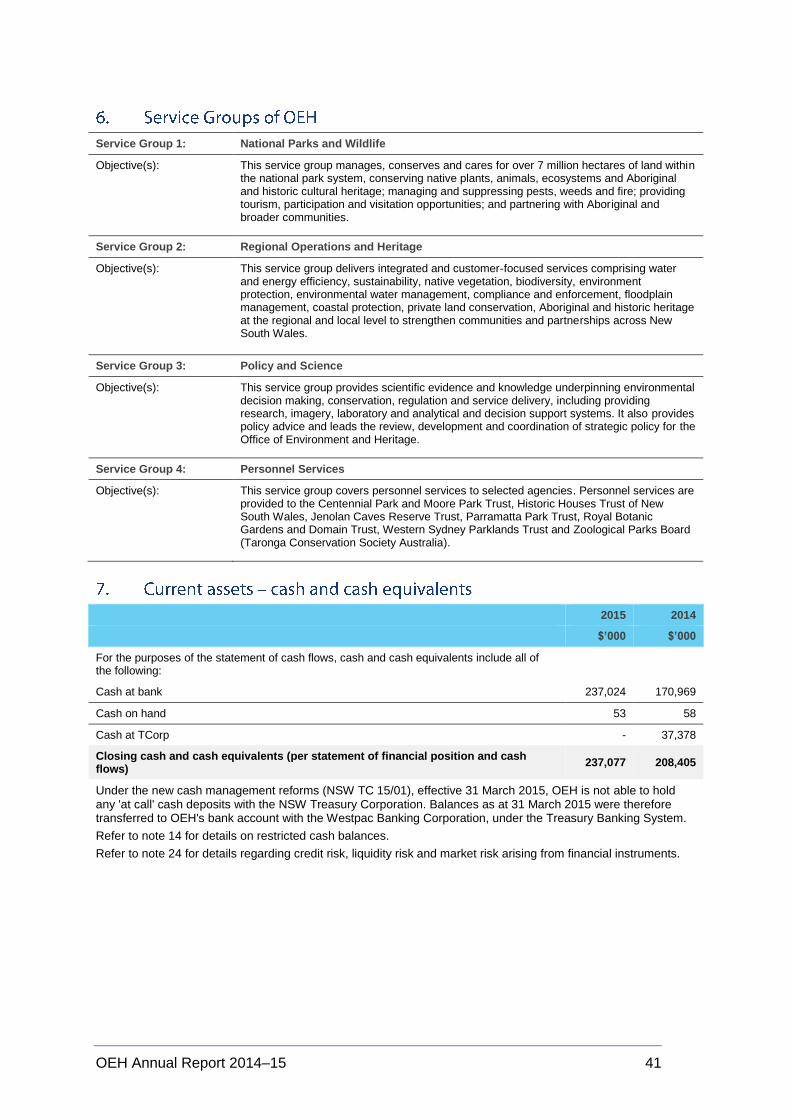
OEH Annual Report 2014–15 41
Service Group 1: National Parks and Wildlife
Objective(s): This service group manages, conserves and cares for over 7 million hectares of land within the national park system, conserving native plants, animals, ecosystems and Aboriginal and historic cultural heritage; managing and suppressing pests, weeds and fire; providing tourism, participation and visitation opportunities; and partnering with Aboriginal and broader communities.
Service Group 2: Regional Operations and Heritage
Objective(s): This service group delivers integrated and customer-focused services comprising water and energy efficiency, sustainability, native vegetation, biodiversity, environment protection, environmental water management, compliance and enforcement, floodplain management, coastal protection, private land conservation, Aboriginal and historic heritage at the regional and local level to strengthen communities and partnerships across New South Wales.
Service Group 3: Policy and Science
Objective(s): This service group provides scientific evidence and knowledge underpinning environmental decision making, conservation, regulation and service delivery, including providing research, imagery, laboratory and analytical and decision support systems. It also provides policy advice and leads the review, development and coordination of strategic policy for the Office of Environment and Heritage.
Service Group 4: Personnel Services
Objective(s): This service group covers personnel services to selected agencies. Personnel services are provided to the Centennial Park and Moore Park Trust, Historic Houses Trust of New South Wales, Jenolan Caves Reserve Trust, Parramatta Park Trust, Royal Botanic Gardens and Domain Trust, Western Sydney Parklands Trust and Zoological Parks Board (Taronga Conservation Society Australia).
2015 2014
$’000 $’000
For the purposes of the statement of cash flows, cash and cash equivalents include all of the following:
Cash at bank 237,024 170,969
Cash on hand 53 58
Cash at TCorp - 37,378
Closing cash and cash equivalents (per statement of financial position and cash flows)
237,077 208,405
Under the new cash management reforms (NSW TC 15/01), effective 31 March 2015, OEH is not able to hold any 'at call' cash deposits with the NSW Treasury Corporation. Balances as at 31 March 2015 were therefore transferred to OEH's bank account with the Westpac Banking Corporation, under the Treasury Banking System.
Refer to note 14 for details on restricted cash balances.
Refer to note 24 for details regarding credit risk, liquidity risk and market risk arising from financial instruments.
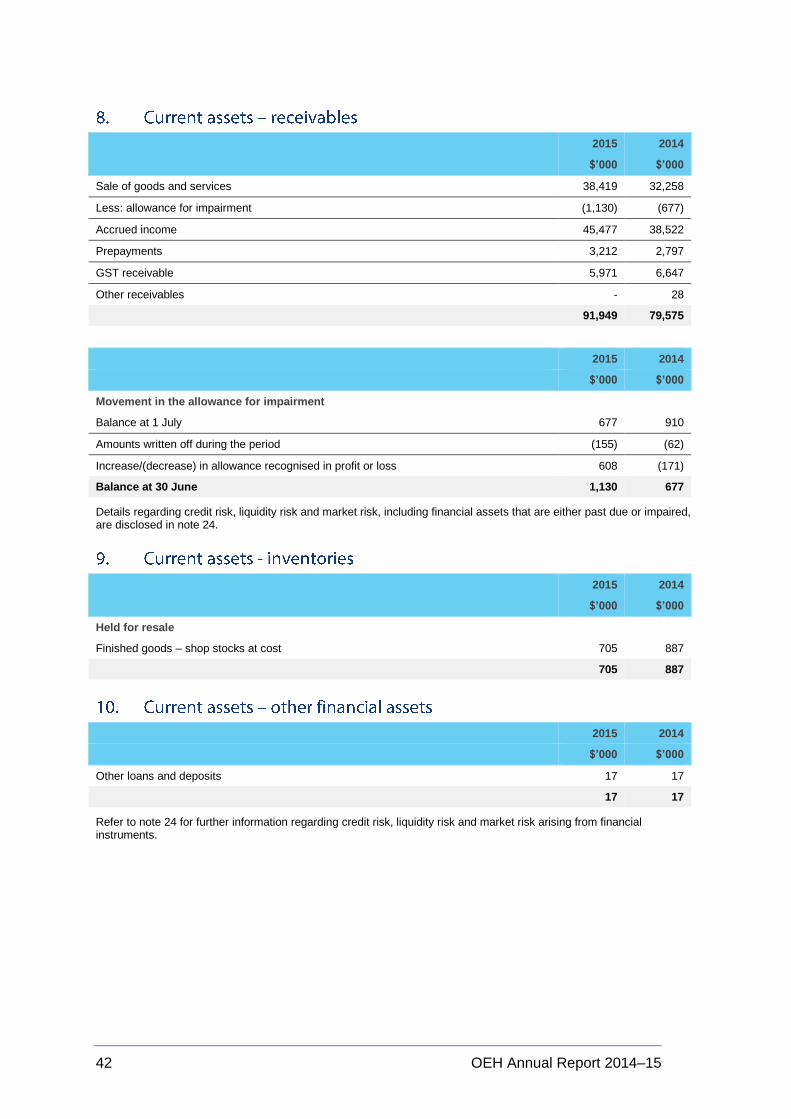
42 OEH Annual Report 2014–15
2015 2014
$’000 $’000
Sale of goods and services 38,419 32,258
Less: allowance for impairment (1,130) (677)
Accrued income 45,477 38,522
Prepayments 3,212 2,797
GST receivable 5,971 6,647
Other receivables - 28
91,949 79,575
2015 2014
$’000 $’000
Movement in the allowance for impairment
Balance at 1 July 677 910
Amounts written off during the period (155) (62)
Increase/(decrease) in allowance recognised in profit or loss 608 (171)
Balance at 30 June 1,130 677
Details regarding credit risk, liquidity risk and market risk, including financial assets that are either past due or impaired, are disclosed in note 24.
2015 2014
$’000 $’000
Held for resale
Finished goods – shop stocks at cost 705 887
705 887
2015 2014
$’000 $’000
Other loans and deposits 17 17
17 17
Refer to note 24 for further information regarding credit risk, liquidity risk and market risk arising from financial instruments.

OEH Annual Report 2014–15 43
Land and buildings*
Plant and equipment
Infrastructure systems Total
$'000 $'000 $'000 $'000
At 1 July 2014 - fair value
Gross carrying amount 2,520,046 176,522 2,251,010 4,947,578
Accumulated depreciation and impairment (286,973) (113,034) (777,986) (1,177,993)
Net carrying amount 2,233,073 63,488 1,473,024 3,769,585
At 30 June 2015 - fair value
Gross carrying amount 2,608,198 187,162 2,287,090 5,082,450
Accumulated depreciation and impairment (314,653) (121,938) (854,943) (1,291,534)
Net carrying amount 2,293,545 65,224 1,432,147 3,790,916
* Includes land managed under Part 4a of the National Parks and Wildlife Act 1974
A reconciliation of the carrying amount of each class of property, plant and equipment at the beginning and end of the current reporting period is set out below.
Land and buildings
$'000
Plant and equipment
$'000
Infrastructure systems
$'000
Total
$'000
Period ended 30 June 2015
Net carrying amount at start of year 2,233,073 63,488 1,473,024 3,769,585
Additions 11,732 13,274 10,815 35,820
Disposals (5,897)) (241) (2,781) (8,919)
Acquisitions/transfers through administrative restructures
9,586 - - 9,586
Net revaluation increment less revaluation decrements
48,577 - 13,716 62,293
Asset recognised first time 985 - 5,020 6,005
Depreciation expense (12,900) (13,351) (66,224) (92,475)
Transfers between asset categories (631) 2,054 (1,423) -
Assets transferred free of cost 9,021 - - 9,021
Net carrying amount at end of year 2,293,545 65,224 1,432,147 3,790,916
For additional details regarding impairment losses-refer AASB 136.126-137
OEH recognises impairment loss on land that it acquires/purchases and writes it down to its fair value that reflects restricted use of land as a national park.

44 OEH Annual Report 2014–15
Land and
buildings* Plant and
equipment Infrastructure
systems Total
$'000 $'000 $'000 $'000
At 24 February 2014 - fair value
Gross carrying amount 2,488,910 185,544 2,178,081 4,852,535
Accumulated depreciation and impairment (272,978) (120,594) (798,190) (1,191,762)
Net carrying amount 2,215,932 64,950 1,379,891 3,660,773
At 30 June 2014 - fair value
Gross carrying amount 2,520,046 176,522 2,251,010 4,947,578
Accumulated depreciation and impairment (286,973) (113,034) (777,986) (1,177,993)
Net carrying amount 2,233,073 63,488 1,473,024 3,769,585
* Includes land managed under Part 4a of the National Parks and Wildlife Act 1974
Land and buildings
Plant and equipment
Infrastructure systems Total
$'000 $'000 $'000 $'000
Period ended 30 June 2014
Net carrying amount at 24 February 2014 2,215,932 64,950 1,379,891 3,660,773
Additions 7,440 4,921 9,629 21,990
Disposals (369) (382) (8,086) (8,837)
Acquisitions/transfers through administrative restructures
20 - - 20
Net revaluation increment less revaluation decrements
4,196 - 112,540 116,736
Impairment losses* (1,589) - - (1,589)
Asset recognised first time 12,394 - - 12,394
Depreciation expense (4,568) (6,017) (21,333) (31,918)
Transfers between asset categories (399) 16 383 -
Other movements – free of cost 16 - - 16
Net carrying amount 2,233,073 63,488 1,473,024 3,769,585
For additional details regarding impairment losses-refer AASB 136.126-137
OEH recognises impairment loss on land that it acquires/purchases and writes it down to its fair value that reflects restricted use of land as a national park.
Software
$'000
Water licences
$'000 Total
At 1 July 2014
Cost (gross carrying amount) 90,839 168,161 259,000
Accumulated amortisation and impairment (61,467) - (61,467)
Net carrying amount 29,372 168,161 197,533
At 30 June 2015
Cost (Gross carrying amount) 100,798 163,879 264,677
Accumulated amortisation and impairment (71,779) - (71,779)
Net carrying amount 29,019 163,879 192,898
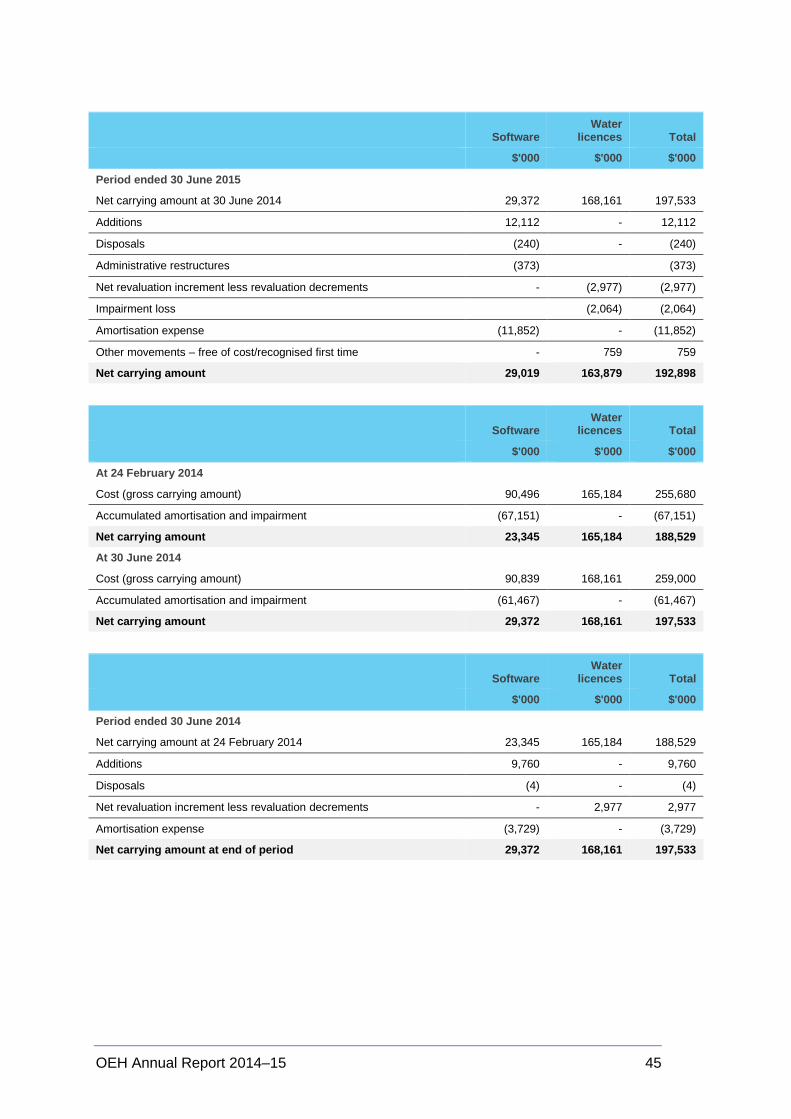
OEH Annual Report 2014–15 45
Software Water
licences Total
$'000 $'000 $'000
Period ended 30 June 2015
Net carrying amount at 30 June 2014 29,372 168,161 197,533
Additions 12,112 - 12,112
Disposals (240) - (240)
Administrative restructures (373) (373)
Net revaluation increment less revaluation decrements - (2,977) (2,977)
Impairment loss (2,064) (2,064)
Amortisation expense (11,852) - (11,852)
Other movements – free of cost/recognised first time - 759 759
Net carrying amount 29,019 163,879 192,898
Software Water
licences Total
$'000 $'000 $'000
At 24 February 2014
Cost (gross carrying amount) 90,496 165,184 255,680
Accumulated amortisation and impairment (67,151) - (67,151)
Net carrying amount 23,345 165,184 188,529
At 30 June 2014
Cost (gross carrying amount) 90,839 168,161 259,000
Accumulated amortisation and impairment (61,467) - (61,467)
Net carrying amount 29,372 168,161 197,533
Software Water
licences Total
$'000 $'000 $'000
Period ended 30 June 2014
Net carrying amount at 24 February 2014 23,345 165,184 188,529
Additions 9,760 - 9,760
Disposals (4) - (4)
Net revaluation increment less revaluation decrements - 2,977 2,977
Amortisation expense (3,729) - (3,729)
Net carrying amount at end of period 29,372 168,161 197,533

46 OEH Annual Report 2014–15
2015
Level 1 Level 2 Level 3 Total fair value
$’000 $’000 $’000 $’000
Property, plant and equipment (note 11)
Land and buildings - - 2,293,545 2,293,545
Plant and equipment - 65,224 - 65,224
Infrastructure systems - - 1,432,147 1,432,147
Intangible assets (note 12) - - 192,898 192,898
- 65,224 3,918,590 3,983,814
2014
Level 1 Level 2 Level 3 Total fair value
$’000 $’000 $’000 $’000
Property, plant and equipment (note 11)
Land and buildings - - 2,233,073 2,233,073
Plant and equipment - 63,488 - 63,488
Infrastructure systems - - 1,473,024 1,473,024
Intangible assets (note 12) - - 197,533 197,533
- 63,488 3,903,630 3,967,118
There were no transfers between Level 1 or 2 during the period.
i. Valuation techniques and inputs:
Fair value for non-financial assets are calculated on the following basis:
Asset Class Valuation technique Comments
Land Market Based on market evidence for open space, unimproved or green timbered land
Buildings Cost Based on depreciated replacement cost
Plant and equipment Cost Based on depreciated historical cost
Infrastructure systems Cost Based on depreciated replacement cost
Intangible assets-water licences Market Market evidence, normally based on a rolling three-year average
Intangible assets-software Cost Based on amortised historical cost
ii. Highest and best Use:
Non financial assets are valued on a highest and best use basis.
iii. Level 3 measurements
OEH non-financial assets classed as Level 3 in the fair value hierarchy are valued using a cost approach, given that their use is specialised in nature and they are not actively traded in the marketplace. Cost has been derived using actual costs plus reference to industry costing guides based on the characteristics of the relevant asset.
Full external valuations are conducted at least every five years. Land and buildings are valued every three years. The last valuation for land and buildings was conducted in 2014-15. The fair value of Level 3 assets are adjusted
OEH Annual Report 2014–15 47
annually for movement in relevant publicly available indices. OEH engages independent, qualified valuers with appropriate experience in the relevant Level 3 category to conduct valuations.
Annual movements in industry costing guides or relevant indices will result in corresponding changes to the fair value of OEH Level 3 assets.
13(c) Valuation techniques, inputs and relationship of unobservable inputs to fair value
Type Valuation Technique Inputs Relationship of unobservable inputs to fair value
Level 3- Intangible assets - Water licences
Arche Consulting Pty Ltd used market value to measure water licences. Water licences are identifiable as registered licences and deemed intangible assets in that they provide future control over, rather than a physical volume of the water made available for extraction, and the resulting future economic benefits derived from that access.
The input to this valuation process is the price information on the Government register and the annually assessed volume of water that can be extracted.
At least every two years, a review is performed to update the fair value of licences. The fair value is determined based on trading data for liquid markets. The volume weighted average price is calculated based on trades reported on the register, published by the New South Wales Office of Water. This register is the preferred source of price information where private water exchange listings are made available to member participants. The volume is assessed at least every two years to arrive at the fair value. The fair value would increase/ (decrease), if the assessed volume increases/ (decreases).
Level 3- Land
OEH engaged the services of Land and Property Management Information (LPI) to provide fair value based on current market prices. A discount factor was applied to reflect the restrictive use of land by OEH.
Current market prices, and the discount factor for the restrictions on the use of the OEH land by virtue of the National Parks and Wildlife Act 1974.
National Parks and Reserves are valued using market evidence with consideration made for condition, location, comparability etc. Land values are derived from the analysis of sales of comparable lands, i.e. grazing lands, unimproved rural land, urban fringe bushland sites and urban parklands. Adjustment to market evidence to reflect restricted use has been made by applying discount factors, arrived by valuers based on the analysis of market evidence, experience and court precedent. All land values are on a rate per hectare, except relating to non-dedicated land, such as workshops and depots, which have a total site value on a market basis, incorporating highest and best use considerations.
48 OEH Annual Report 2014–15
Type Valuation Technique Inputs Relationship of unobservable inputs to fair value
Level 3- Buildings
OEH engaged the services of Colliers International Valuation & Advisory Services (CIVAS) to provide a comprehensive valuation using depreciated replacement cost (DRC) as the main valuation input.
The replacement cost ($/m2), gross floor area, total useful life, and remaining useful life are the inputs considered in deriving DRC.
There are a number of unobservable inputs affecting the fair value assessment of buildings. The fair value of buildings will increase if the cost of construction of the modern day equivalent of the building has increased. The fair value will decrease upon obsolescence or deteriorating condition of buildings. The fair value of buildings will also increase if the total useful life of the building has increased.
For heritage buildings, the replacement cost is based using modern day equivalent materials and assets with the same size, design and function as the existing buildings, after taking into consideration any obsolescence.
The replacement cost has been determined by reference to costs for constructing buildings of the type by reviewing OEH's recent cost of construction, analysis of costs of similar buildings located on other properties, indices such as the consumer price index published by the Australian Bureau of Statistics and the building price index published in Rawlinson Handbook 2015.
Full revaluation of all building assets was undertaken based on detailed asset attributes stored in OEH's asset maintenance system, recent assessment by OEH staff of the condition of buildings and detailed assessment of all building assets undertaken in 2006-07 financial year. Sampling of a total of 146 assets out of 2,413 was undertaken to provide assurance on the quality of data provided by OEH to the valuer to minimise the risk of error. Assets in the sample were selected based on their high value and were divided into groups based on their similarity in nature, i.e. residence, commercial, amenities, depots and historic properties.

OEH Annual Report 2014–15 49
Type Valuation Technique Inputs Relationship of unobservable inputs to fair value
Level 3
Other amenities and facilities
Sheldon Consulting Pty Ltd used DRC to assess the fair value of the other amenities and facilities.
In 2014-15, a comprehensive valuation was performed using DRC for amenities as main valuation input. The cost of construction, condition and obsolescence of amenities is considered in deriving DRC.
The fair value will increase if the cost of replacing the modern equivalent of amenities and facilities increases. Fair value will decrease upon obsolescence or deteriorating condition of buildings.
Rawlinson rates have been used to develop amenity asset unit rates, indexed to 30 June 2015 using the producer price index for non-residential building construction, published by the Australian Bureau of Statistics. These rates have been adjusted for regional indices (documented by Rawlinson) and for site factor. Rawlinson's rates are for normal building sites with good road access. These therefore required further adjustment to reflect site difficulties within national parks, where they may be at a significant distance from towns.
Level 3-
Infrastructure Systems (includes utilities and access assets)
Sheldon Consulting Pty Ltd used DRC to assess the fair value of the roads, wharves, other access assets and utilities.
In 2013-14, a comprehensive valuation was performed for roads, wharves and other access assets, using DRC. For current year fair value measurement, movement in the roads and bridge construction index, published by the Australian Bureau of Statistics, is used.
In 2011-12, a comprehensive valuation was performed for utilities, using DRC. For current year fair value measurement, movement in non-residential building construction cost index, published by the Australian Bureau of Statistics, is used.
The fair value will increase if the cost of replacing the modern equivalent of infrastructure assets increases. Fair value will decrease upon obsolescence or deteriorating condition of infrastructure assets.
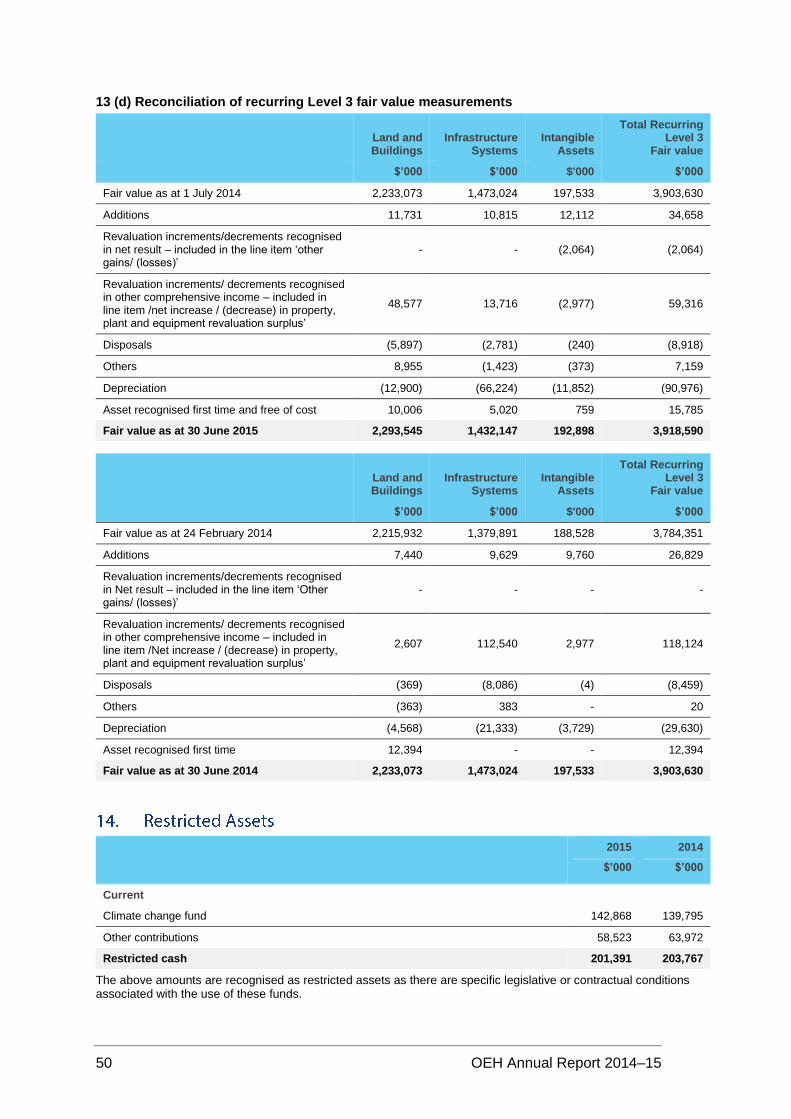
50 OEH Annual Report 2014–15
13 (d) Reconciliation of recurring Level 3 fair value measurements
Land and Buildings
Infrastructure Systems
Intangible Assets
Total Recurring Level 3
Fair value
$’000 $’000 $'000 $’000
Fair value as at 1 July 2014 2,233,073 1,473,024 197,533 3,903,630
Additions 11,731 10,815 12,112 34,658
Revaluation increments/decrements recognised in net result – included in the line item ‘other gains/ (losses)’
- - (2,064) (2,064)
Revaluation increments/ decrements recognised in other comprehensive income – included in line item /net increase / (decrease) in property, plant and equipment revaluation surplus’
48,577 13,716 (2,977) 59,316
Disposals (5,897) (2,781) (240) (8,918)
Others 8,955 (1,423) (373) 7,159
Depreciation (12,900) (66,224) (11,852) (90,976)
Asset recognised first time and free of cost 10,006 5,020 759 15,785
Fair value as at 30 June 2015 2,293,545 1,432,147 192,898 3,918,590
Land and Buildings
Infrastructure Systems
Intangible Assets
Total Recurring Level 3
Fair value
$’000 $’000 $'000 $’000
Fair value as at 24 February 2014 2,215,932 1,379,891 188,528 3,784,351
Additions 7,440 9,629 9,760 26,829
Revaluation increments/decrements recognised in Net result – included in the line item ‘Other gains/ (losses)’
- - - -
Revaluation increments/ decrements recognised in other comprehensive income – included in line item /Net increase / (decrease) in property, plant and equipment revaluation surplus’
2,607 112,540 2,977 118,124
Disposals (369) (8,086) (4) (8,459)
Others (363) 383 - 20
Depreciation (4,568) (21,333) (3,729) (29,630)
Asset recognised first time 12,394 - - 12,394
Fair value as at 30 June 2014 2,233,073 1,473,024 197,533 3,903,630
2015
$’000
2014
$’000
Current
Climate change fund 142,868 139,795
Other contributions 58,523 63,972
Restricted cash 201,391 203,767
The above amounts are recognised as restricted assets as there are specific legislative or contractual conditions associated with the use of these funds.

OEH Annual Report 2014–15 51
OEH has under its control a wide range of assets, such as historic buildings, dedicated land and specified sites, which are subject to restrictions on their use by virtue of the National Parks and Wildlife Act 1974. These
restrictions include disposal of the asset or, under certain circumstances, exploitation for financial or economic gain. Additional restrictions may be imposed by OEH’s stakeholders as well as other legislation governing the use of historic sites, sites of cultural significance and buildings.
2015 2014
$’000 $’000
Accrued salaries, wages and on-costs 11,417 9,394
Creditors 80,638 75,163
Unearned revenue 5,319 4,974
Redundancies 2,534 1,212
99,908 90,743
Details regarding credit risk, liquidity risk and market risk, including a maturity analysis of the above payables, are disclosed in note 24.
2015 2014
$’000 $’000
Current
Treasury advances repayable - interest bearing 3,041 3,360
Treasury advances repayable - non-interest bearing-Solar Bonus Reimbursement Scheme 53,417 29,245
56,458 32,605
Non-current
Treasury advances repayable - interest bearing 50,650 55,331
Treasury advances repayable - non-interest bearing-Solar Bonus Reimbursement Scheme 137,889 183,804
188,539 239,135
244,997 271,740
Included in the Treasury advances repayable interest bearing is $26.5 million of cumulative interest.
The Solar Bonus Reimbursement Scheme (SBS) promotes small-scale renewable energy infrastructure across NSW. The scheme is administered by the Department of Industry, Skills and Regional Development and delivered by electricity Distribution Network Services Providers (DNSPs) under the Electricity Supply Act 1995. The DNSPs (through electricity retailers) are responsible for the metering and payments to the owners of the small scale renewable energy infrastructure. Government decision during 2011 has seen the Climate Change Fund (CCF), administered by OEH under the Energy and Utilities Administration Act 1987, as the mechanism for reimbursing the DNSPs costs incurred under SBS. In order to meet the cost reimbursement requirements, Treasury loan has been provided by the NSW Crown. This was in the form of an interest free advance for funding requirements from 2010-11 to 2013-14. The advance will then be fully repaid by 30 June 2017 from additional CCF contributions levied on utility bills.
Treasury advance repayable (non-interest bearing) is recognised at fair value, which is the present value of future repayments, discounted by using 10-year government bond rate. Additional amount borrowed, i.e. difference between the amount borrowed and the present value, is recognised as grant revenue. Unwinding of discount will be recognised as finance cost.
Details regarding credit risk, liquidity risk and market risk, including a maturity analysis of the above borrowings, are disclosed in note 24.
While OEH did not have the powers to borrow funds (i.e. loans) under the Public Authorities (Financial Arrangements) Act 1987, specific approval was given by the NSW Treasurer in December 2002 and in January 2011 respectively for Perisher and the SBS advances.

52 OEH Annual Report 2014–15
2015
$’000
2014
$’000
(a) Current
Employee benefits and related oncosts 1
Recreation leave 2 30,808 34,636
Recreation leave on-costs 2 3,371 3,265
Superannuation-Defined Benefits 6,995 5,856
Long service leave on-costs 3 19,588 18,364
Other current provisions
Provision for restructuring 4 3,904 -
General 2,965 -
Total current 67,631 62,121
Non-current
Employee benefits and related oncosts 1
Long service leave on-costs 3 1,570 1,188
1,570 1,188
Other non-current provisions
Restoration costs 5 5,366 5,196
5,366 5,196
Total non-current 6,936 6,384
Total provisions 74,567 68,505
Aggregate employee benefits and related on-costs
Provisions – current 64,666 62,121
Provisions – non-current 1,570 1,189
Accrued salaries, wages and on-costs (note 15) 11,417 9,394
77,653 72,704
1. Includes employee benefits and related on-costs for Royal Botanic Gardens and Domain Trust, Western Sydney Parklands Trust, Historic Houses Trust, Centennial Park and Moore Park Trust, Parramatta Park, Taronga Conservation Society Australia and Jenolan Caves Reserve Trust (refer note 1(a)).
2. The value of recreation leave and related on-costs expected to be paid after 12 months is $1,511,188. 3. OEH's liabilities for long service leave are assumed by the Crown Entity. However OEH has an obligation to meet
the long service related on-costs. 4. Restructuring provision is an estimate of direct cost associated with implementing the Government Sector
Employment (GSE) Act reforms. 5. Restoration costs are costs associated with leased properties to place the property back to its original state at
some time in the future, depending on the terms of the lease.

OEH Annual Report 2014–15 53
Movements in the restoration costs provision during the financial year are set out below:
Total
$’000
Carrying amount on 1 July 2014 5,196
Additional provisions recognised 7,571
Write back of provision (659)
Unwinding/change in the discount rate 127
Carrying amount at the end of the year 12,235
Nature of the benefits provided by the fund – Para 139(a)(i)
The Pooled Fund holds in trust the investments of the closed NSW public sector superannuation schemes:
State Authorities Superannuation Scheme (SASS)
State Superannuation Scheme (SSS)
Police Superannuation Scheme (PSS)
State Authorities Non-contributory Superannuation Scheme (SANCS)
“These schemes are all defined benefit schemes – at least a component of the final benefit is derived from a multiple of member salary and years of membership. Members receive lump sum or pension benefits on retirement, death, disablement and withdrawal.
All the Schemes are closed to new members.
Description of the regulatory framework - Para 139(a)(ii)
The schemes in the Pooled Fund are established and governed by the following NSW legislation: Superannuation Act 1916, State Authorities Superannuation Act 1987, Police Regulation (Superannuation) Act 1906, State Authorities Non-Contributory Superannuation Scheme Act 1987, and their associated regulations.
The schemes in the Pooled Fund are exempt public sector superannuation schemes under the Commonwealth Superannuation Industry (Supervision) Act 1993 (SIS). The SIS Legislation treats exempt public sector superannuation funds as complying funds for concessional taxation and superannuation guarantee purposes.
Under a Heads of Government agreement, the New South Wales Government undertakes to ensure that the Pooled Fund will conform with the principles of the Commonwealth’s retirement incomes policy relating to preservation, vesting and reporting to members and that members’ benefits are adequately protected.
The New South Wales Government prudentially monitors and audits the Pooled Fund and the Trustee Board activities in a manner consistent with the prudential controls of the SIS legislation. These provisions are in addition to other legislative obligations on the Trustee Board and internal processes that monitor the Trustee Board’s adherence to the principles of the Commonwealth’s retirement incomes policy.
An actuarial investigation of the Pooled Fund is performed every three years. The last actuarial investigation was performed as at 30 June 2012. The next actuarial investigation is due as at 30 June 2015 and the report is expected to be released by the end of 2015.
Description of other entities' responsibilities for the governance of the fund - Para 139(a)(iii)
The Fund's Trustee is responsible for the governance of the Fund. The Trustee has a legal obligation to act solely in the best interests of fund beneficiaries. The Trustee has the following roles:
Administration of the fund and payment to the beneficiaries from fund assets when required in accordance with the fund rules;
Management and investment of the fund assets; and
Compliance with other applicable regulations.
Description of risks - Para 139(b)
There are a number of risks to which the Fund exposes the Employer. The more significant risks relating to the defined benefits are:
Investment risk - The risk that investment returns will be lower than assumed and the Employer will
need to increase contributions to offset this shortfall.
Longevity risk – The risk that pensioners live longer than assumed, increasing future pensions.
54 OEH Annual Report 2014–15
Pension indexation risk – The risk that pensions will increase at a rate greater than assumed,
increasing future pensions.
Salary growth risk - The risk that wages or salaries (on which future benefit amounts for active
members will be based) will rise more rapidly than assumed, increasing defined benefit amounts and thereby requiring additional employer contributions.
Legislative risk - The risk is that legislative changes could be made which increase the cost of
providing the defined benefits.
The defined benefit fund assets are invested with independent fund managers and have a diversified asset mix. The Fund has no significant concentration of investment risk or liquidity risk.
Description of significant events - Para 139(c)
There were no fund amendments, curtailments or settlements during the year.
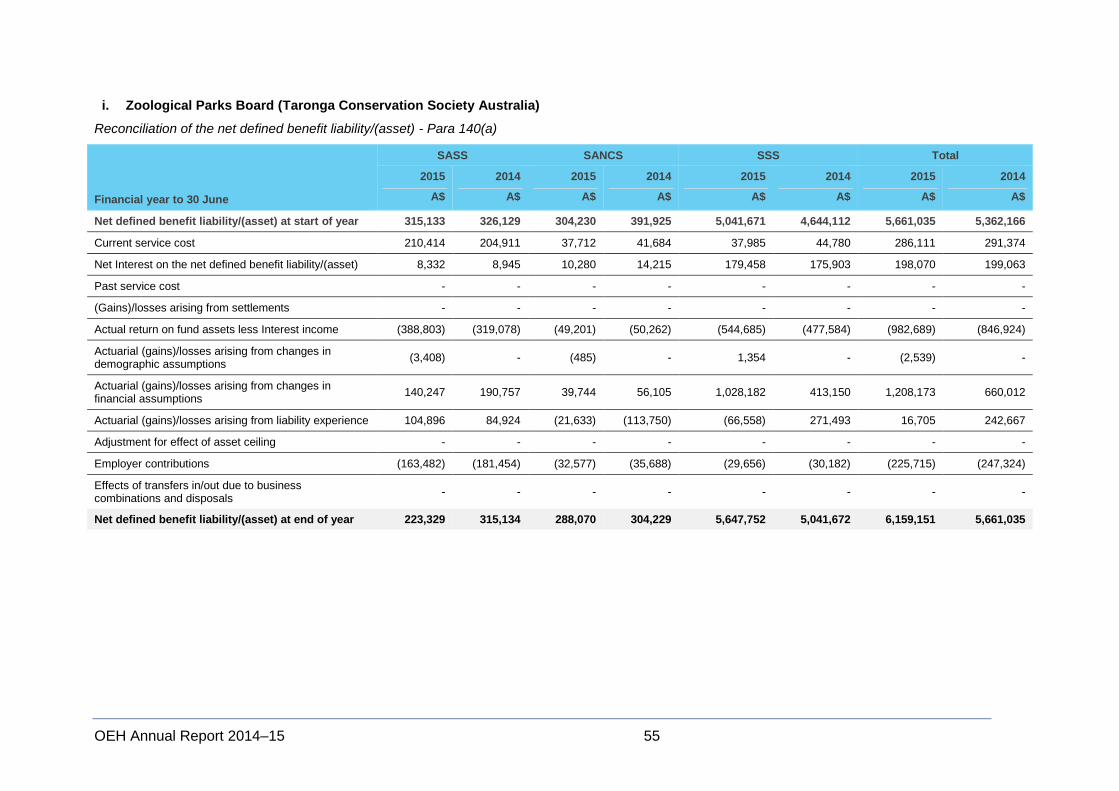
OEH Annual Report 2014–15 55
i. Zoological Parks Board (Taronga Conservation Society Australia)
Reconciliation of the net defined benefit liability/(asset) - Para 140(a)
Financial year to 30 June
SASS SANCS SSS Total
2015
A$
2014
A$
2015
A$
2014
A$
2015
A$
2014
A$
2015
A$
2014
A$
Net defined benefit liability/(asset) at start of year 315,133 326,129 304,230 391,925 5,041,671 4,644,112 5,661,035 5,362,166
Current service cost 210,414 204,911 37,712 41,684 37,985 44,780 286,111 291,374
Net Interest on the net defined benefit liability/(asset) 8,332 8,945 10,280 14,215 179,458 175,903 198,070 199,063
Past service cost - - - - - - - -
(Gains)/losses arising from settlements - - - - - - - -
Actual return on fund assets less Interest income (388,803) (319,078) (49,201) (50,262) (544,685) (477,584) (982,689) (846,924)
Actuarial (gains)/losses arising from changes in demographic assumptions
(3,408) - (485) - 1,354 - (2,539) -
Actuarial (gains)/losses arising from changes in financial assumptions
140,247 190,757 39,744 56,105 1,028,182 413,150 1,208,173 660,012
Actuarial (gains)/losses arising from liability experience 104,896 84,924 (21,633) (113,750) (66,558) 271,493 16,705 242,667
Adjustment for effect of asset ceiling - - - - - - - -
Employer contributions (163,482) (181,454) (32,577) (35,688) (29,656) (30,182) (225,715) (247,324)
Effects of transfers in/out due to business combinations and disposals
- - - - - - - -
Net defined benefit liability/(asset) at end of year 223,329 315,134 288,070 304,229 5,647,752 5,041,672 6,159,151 5,661,035
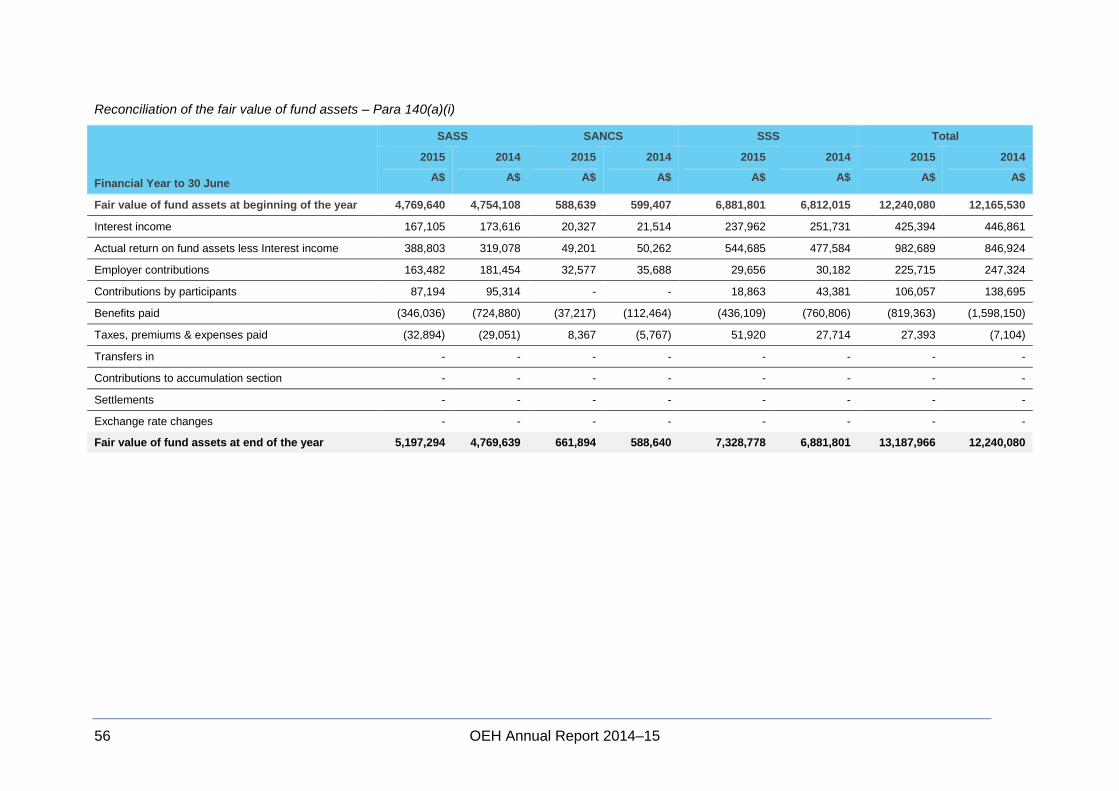
56 OEH Annual Report 2014–15
Reconciliation of the fair value of fund assets – Para 140(a)(i)
Financial Year to 30 June
SASS SANCS SSS Total
2015
A$
2014
A$
2015
A$
2014
A$
2015
A$
2014
A$
2015
A$
2014
A$
Fair value of fund assets at beginning of the year 4,769,640 4,754,108 588,639 599,407 6,881,801 6,812,015 12,240,080 12,165,530
Interest income 167,105 173,616 20,327 21,514 237,962 251,731 425,394 446,861
Actual return on fund assets less Interest income 388,803 319,078 49,201 50,262 544,685 477,584 982,689 846,924
Employer contributions 163,482 181,454 32,577 35,688 29,656 30,182 225,715 247,324
Contributions by participants 87,194 95,314 - - 18,863 43,381 106,057 138,695
Benefits paid (346,036) (724,880) (37,217) (112,464) (436,109) (760,806) (819,363) (1,598,150)
Taxes, premiums & expenses paid (32,894) (29,051) 8,367 (5,767) 51,920 27,714 27,393 (7,104)
Transfers in - - - - - - - -
Contributions to accumulation section - - - - - - - -
Settlements - - - - - - - -
Exchange rate changes - - - - - - - -
Fair value of fund assets at end of the year 5,197,294 4,769,639 661,894 588,640 7,328,778 6,881,801 13,187,966 12,240,080
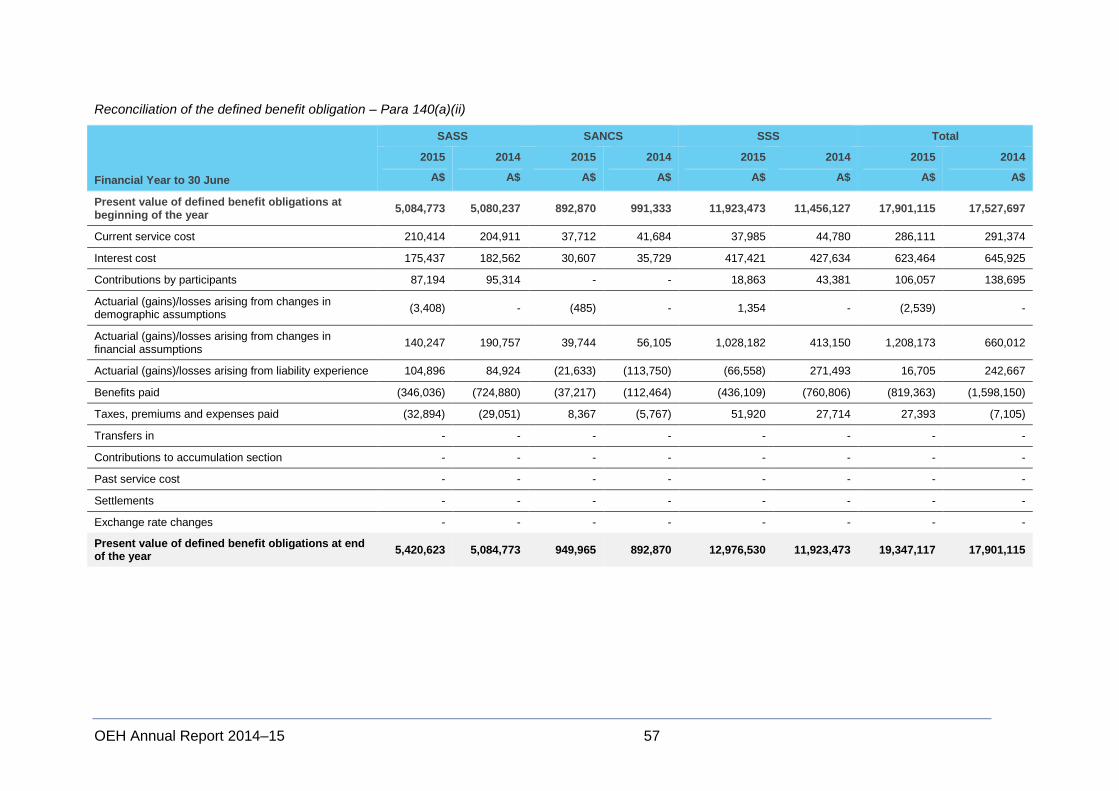
OEH Annual Report 2014–15 57
Reconciliation of the defined benefit obligation – Para 140(a)(ii)
Financial Year to 30 June
SASS SANCS SSS Total
2015
A$
2014
A$
2015
A$
2014
A$
2015
A$
2014
A$
2015
A$
2014
A$
Present value of defined benefit obligations at beginning of the year
5,084,773 5,080,237 892,870 991,333 11,923,473 11,456,127 17,901,115 17,527,697
Current service cost 210,414 204,911 37,712 41,684 37,985 44,780 286,111 291,374
Interest cost 175,437 182,562 30,607 35,729 417,421 427,634 623,464 645,925
Contributions by participants 87,194 95,314 - - 18,863 43,381 106,057 138,695
Actuarial (gains)/losses arising from changes in demographic assumptions
(3,408) - (485) - 1,354 - (2,539) -
Actuarial (gains)/losses arising from changes in financial assumptions
140,247 190,757 39,744 56,105 1,028,182 413,150 1,208,173 660,012
Actuarial (gains)/losses arising from liability experience 104,896 84,924 (21,633) (113,750) (66,558) 271,493 16,705 242,667
Benefits paid (346,036) (724,880) (37,217) (112,464) (436,109) (760,806) (819,363) (1,598,150)
Taxes, premiums and expenses paid (32,894) (29,051) 8,367 (5,767) 51,920 27,714 27,393 (7,105)
Transfers in - - - - - - - -
Contributions to accumulation section - - - - - - - -
Past service cost - - - - - - - -
Settlements - - - - - - - -
Exchange rate changes - - - - - - - -
Present value of defined benefit obligations at end of the year
5,420,623 5,084,773 949,965 892,870 12,976,530 11,923,473 19,347,117 17,901,115
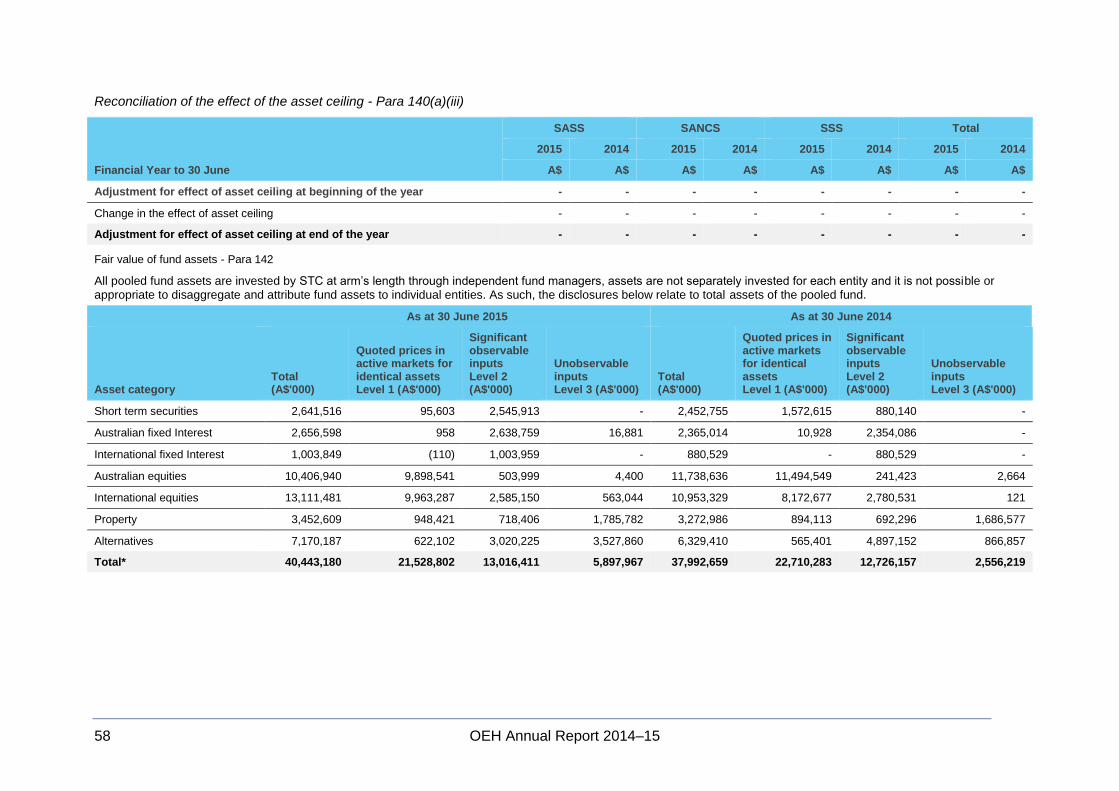
58 OEH Annual Report 2014–15
Reconciliation of the effect of the asset ceiling - Para 140(a)(iii)
Financial Year to 30 June
SASS SANCS SSS Total
2015 2014 2015 2014 2015 2014 2015 2014
A$ A$ A$ A$ A$ A$ A$ A$
Adjustment for effect of asset ceiling at beginning of the year - - - - - - - -
Change in the effect of asset ceiling - - - - - - - -
Adjustment for effect of asset ceiling at end of the year - - - - - - - -
Fair value of fund assets - Para 142
All pooled fund assets are invested by STC at arm’s length through independent fund managers, assets are not separately invested for each entity and it is not possible or appropriate to disaggregate and attribute fund assets to individual entities. As such, the disclosures below relate to total assets of the pooled fund.
As at 30 June 2015 As at 30 June 2014
Asset category Total (A$'000)
Quoted prices in active markets for identical assets Level 1 (A$'000)
Significant observable inputs Level 2 (A$'000)
Unobservable inputs Level 3 (A$'000)
Total (A$'000)
Quoted prices in active markets for identical assets Level 1 (A$'000)
Significant observable inputs Level 2 (A$'000)
Unobservable inputs Level 3 (A$'000)
Short term securities 2,641,516 95,603 2,545,913 - 2,452,755 1,572,615 880,140 -
Australian fixed Interest 2,656,598 958 2,638,759 16,881 2,365,014 10,928 2,354,086 -
International fixed Interest 1,003,849 (110) 1,003,959 - 880,529 - 880,529 -
Australian equities 10,406,940 9,898,541 503,999 4,400 11,738,636 11,494,549 241,423 2,664
International equities 13,111,481 9,963,287 2,585,150 563,044 10,953,329 8,172,677 2,780,531 121
Property 3,452,609 948,421 718,406 1,785,782 3,272,986 894,113 692,296 1,686,577
Alternatives 7,170,187 622,102 3,020,225 3,527,860 6,329,410 565,401 4,897,152 866,857
Total* 40,443,180 21,528,802 13,016,411 5,897,967 37,992,659 22,710,283 12,726,157 2,556,219
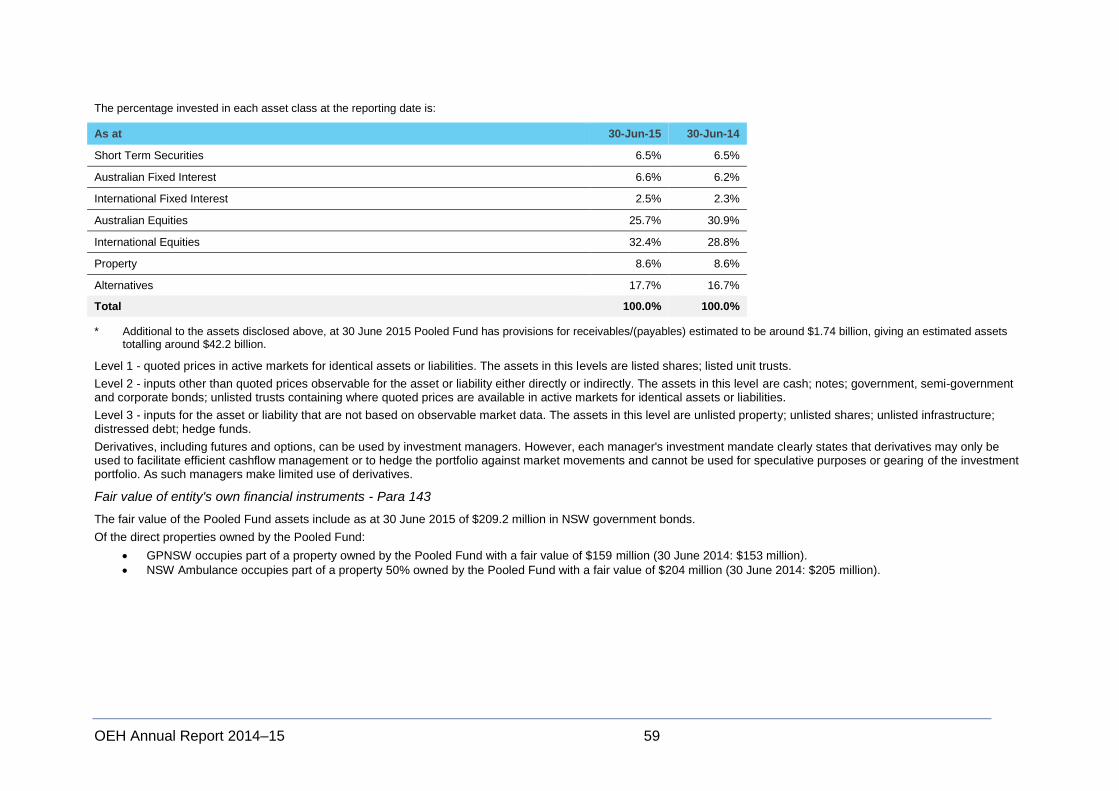
OEH Annual Report 2014–15 59
The percentage invested in each asset class at the reporting date is:
As at 30-Jun-15 30-Jun-14
Short Term Securities 6.5% 6.5%
Australian Fixed Interest 6.6% 6.2%
International Fixed Interest 2.5% 2.3%
Australian Equities 25.7% 30.9%
International Equities 32.4% 28.8%
Property 8.6% 8.6%
Alternatives 17.7% 16.7%
Total 100.0% 100.0%
* Additional to the assets disclosed above, at 30 June 2015 Pooled Fund has provisions for receivables/(payables) estimated to be around $1.74 billion, giving an estimated assets totalling around $42.2 billion.
Level 1 - quoted prices in active markets for identical assets or liabilities. The assets in this levels are listed shares; listed unit trusts.
Level 2 - inputs other than quoted prices observable for the asset or liability either directly or indirectly. The assets in this level are cash; notes; government, semi-government and corporate bonds; unlisted trusts containing where quoted prices are available in active markets for identical assets or liabilities.
Level 3 - inputs for the asset or liability that are not based on observable market data. The assets in this level are unlisted property; unlisted shares; unlisted infrastructure; distressed debt; hedge funds.
Derivatives, including futures and options, can be used by investment managers. However, each manager's investment mandate clearly states that derivatives may only be used to facilitate efficient cashflow management or to hedge the portfolio against market movements and cannot be used for speculative purposes or gearing of the investment portfolio. As such managers make limited use of derivatives.
Fair value of entity's own financial instruments - Para 143
The fair value of the Pooled Fund assets include as at 30 June 2015 of $209.2 million in NSW government bonds.
Of the direct properties owned by the Pooled Fund:
GPNSW occupies part of a property owned by the Pooled Fund with a fair value of $159 million (30 June 2014: $153 million).
NSW Ambulance occupies part of a property 50% owned by the Pooled Fund with a fair value of $204 million (30 June 2014: $205 million).
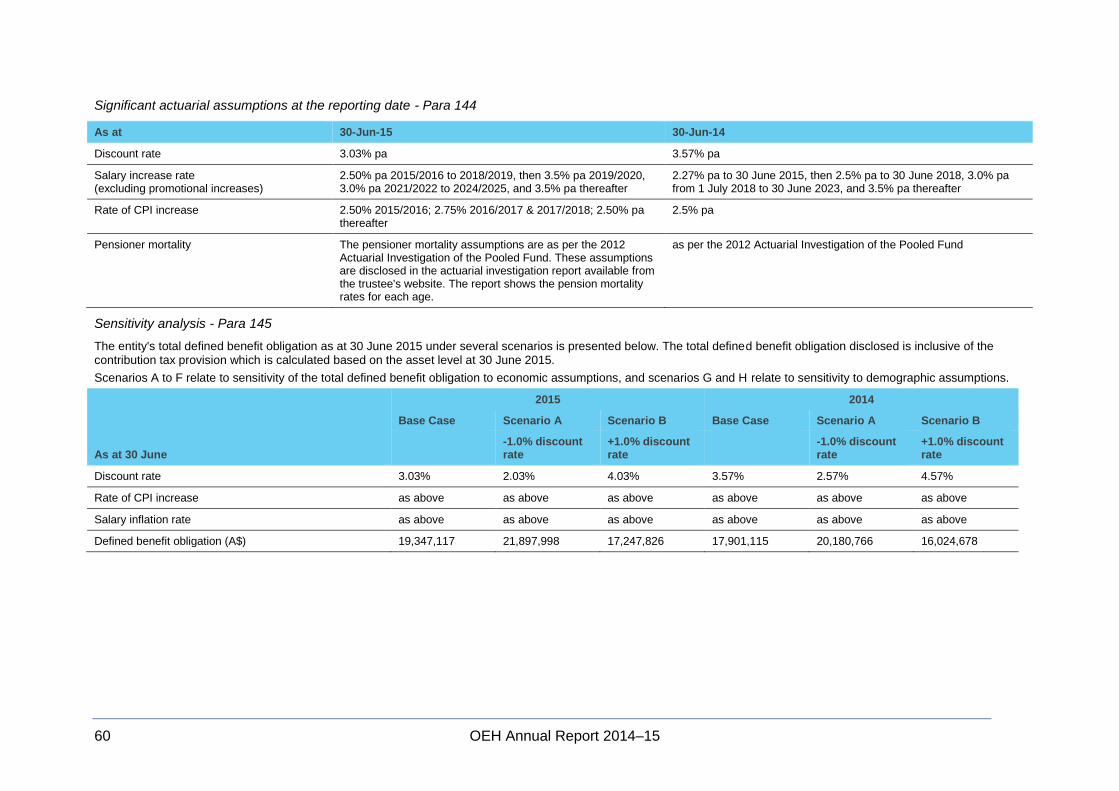
60 OEH Annual Report 2014–15
Significant actuarial assumptions at the reporting date - Para 144
As at 30-Jun-15 30-Jun-14
Discount rate 3.03% pa 3.57% pa
Salary increase rate (excluding promotional increases)
2.50% pa 2015/2016 to 2018/2019, then 3.5% pa 2019/2020, 3.0% pa 2021/2022 to 2024/2025, and 3.5% pa thereafter
2.27% pa to 30 June 2015, then 2.5% pa to 30 June 2018, 3.0% pa from 1 July 2018 to 30 June 2023, and 3.5% pa thereafter
Rate of CPI increase 2.50% 2015/2016; 2.75% 2016/2017 & 2017/2018; 2.50% pa thereafter
2.5% pa
Pensioner mortality The pensioner mortality assumptions are as per the 2012 Actuarial Investigation of the Pooled Fund. These assumptions are disclosed in the actuarial investigation report available from the trustee's website. The report shows the pension mortality rates for each age.
as per the 2012 Actuarial Investigation of the Pooled Fund
Sensitivity analysis - Para 145
The entity's total defined benefit obligation as at 30 June 2015 under several scenarios is presented below. The total defined benefit obligation disclosed is inclusive of the contribution tax provision which is calculated based on the asset level at 30 June 2015.
Scenarios A to F relate to sensitivity of the total defined benefit obligation to economic assumptions, and scenarios G and H relate to sensitivity to demographic assumptions.
As at 30 June
2015 2014
Base Case Scenario A Scenario B Base Case Scenario A Scenario B
-1.0% discount rate
+1.0% discount rate
-1.0% discount rate
+1.0% discount rate
Discount rate 3.03% 2.03% 4.03% 3.57% 2.57% 4.57%
Rate of CPI increase as above as above as above as above as above as above
Salary inflation rate as above as above as above as above as above as above
Defined benefit obligation (A$) 19,347,117 21,897,998 17,247,826 17,901,115 20,180,766 16,024,678
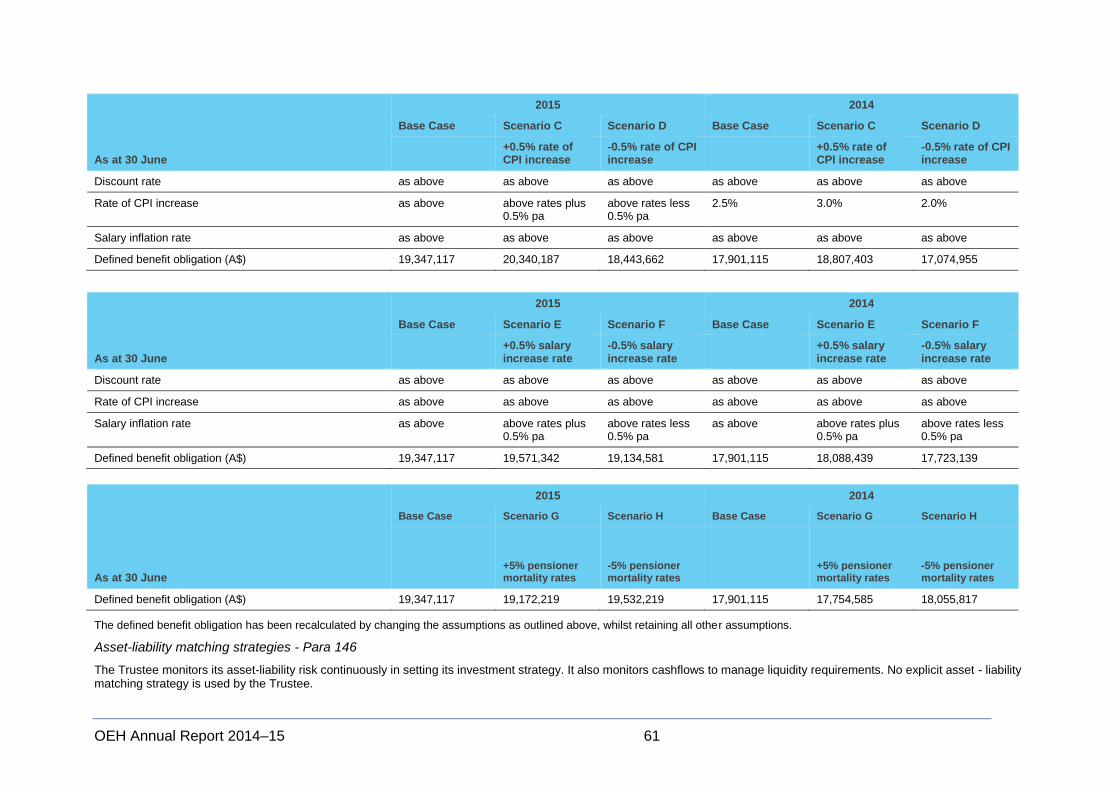
OEH Annual Report 2014–15 61
As at 30 June
2015 2014
Base Case Scenario C Scenario D Base Case Scenario C Scenario D
+0.5% rate of CPI increase
-0.5% rate of CPI increase
+0.5% rate of CPI increase
-0.5% rate of CPI increase
Discount rate as above as above as above as above as above as above
Rate of CPI increase as above above rates plus 0.5% pa
above rates less 0.5% pa
2.5% 3.0% 2.0%
Salary inflation rate as above as above as above as above as above as above
Defined benefit obligation (A$) 19,347,117 20,340,187 18,443,662 17,901,115 18,807,403 17,074,955
As at 30 June
2015 2014
Base Case Scenario E Scenario F Base Case Scenario E Scenario F
+0.5% salary increase rate
-0.5% salary increase rate
+0.5% salary increase rate
-0.5% salary increase rate
Discount rate as above as above as above as above as above as above
Rate of CPI increase as above as above as above as above as above as above
Salary inflation rate as above above rates plus 0.5% pa
above rates less 0.5% pa
as above above rates plus 0.5% pa
above rates less 0.5% pa
Defined benefit obligation (A$) 19,347,117 19,571,342 19,134,581 17,901,115 18,088,439 17,723,139
As at 30 June
2015 2014
Base Case Scenario G Scenario H Base Case Scenario G Scenario H
+5% pensioner mortality rates
-5% pensioner mortality rates
+5% pensioner mortality rates
-5% pensioner mortality rates
Defined benefit obligation (A$) 19,347,117 19,172,219 19,532,219 17,901,115 17,754,585 18,055,817
The defined benefit obligation has been recalculated by changing the assumptions as outlined above, whilst retaining all other assumptions.
Asset-liability matching strategies - Para 146
The Trustee monitors its asset-liability risk continuously in setting its investment strategy. It also monitors cashflows to manage liquidity requirements. No explicit asset - liability matching strategy is used by the Trustee.
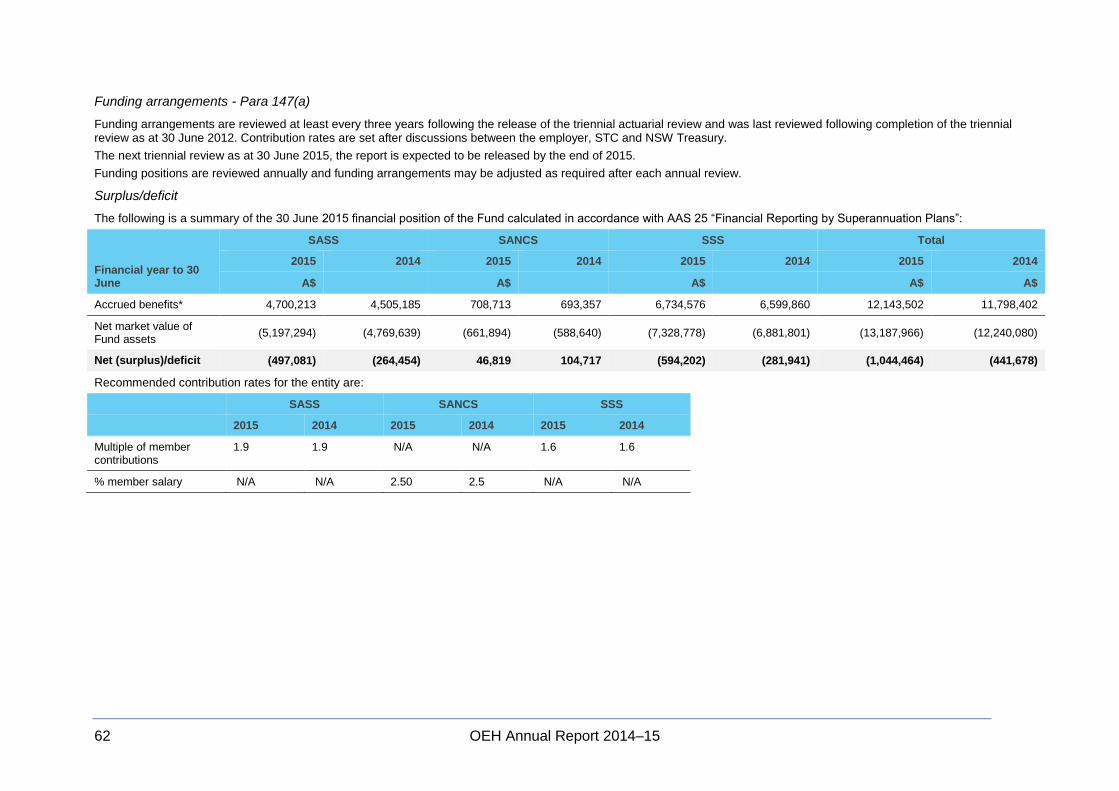
62 OEH Annual Report 2014–15
Funding arrangements - Para 147(a)
Funding arrangements are reviewed at least every three years following the release of the triennial actuarial review and was last reviewed following completion of the triennial review as at 30 June 2012. Contribution rates are set after discussions between the employer, STC and NSW Treasury.
The next triennial review as at 30 June 2015, the report is expected to be released by the end of 2015.
Funding positions are reviewed annually and funding arrangements may be adjusted as required after each annual review.
Surplus/deficit
The following is a summary of the 30 June 2015 financial position of the Fund calculated in accordance with AAS 25 “Financial Reporting by Superannuation Plans”:
Financial year to 30 June
SASS SANCS SSS Total
2015 2014 2015 2014 2015 2014 2015 2014
A$ A$ A$ A$ A$
Accrued benefits* 4,700,213 4,505,185 708,713 693,357 6,734,576 6,599,860 12,143,502 11,798,402
Net market value of Fund assets
(5,197,294) (4,769,639) (661,894) (588,640) (7,328,778) (6,881,801) (13,187,966) (12,240,080)
Net (surplus)/deficit (497,081) (264,454) 46,819 104,717 (594,202) (281,941) (1,044,464) (441,678)
Recommended contribution rates for the entity are:
SASS SANCS SSS
2015 2014 2015 2014 2015 2014
Multiple of member contributions
1.9 1.9 N/A N/A 1.6 1.6
% member salary N/A N/A 2.50 2.5 N/A N/A
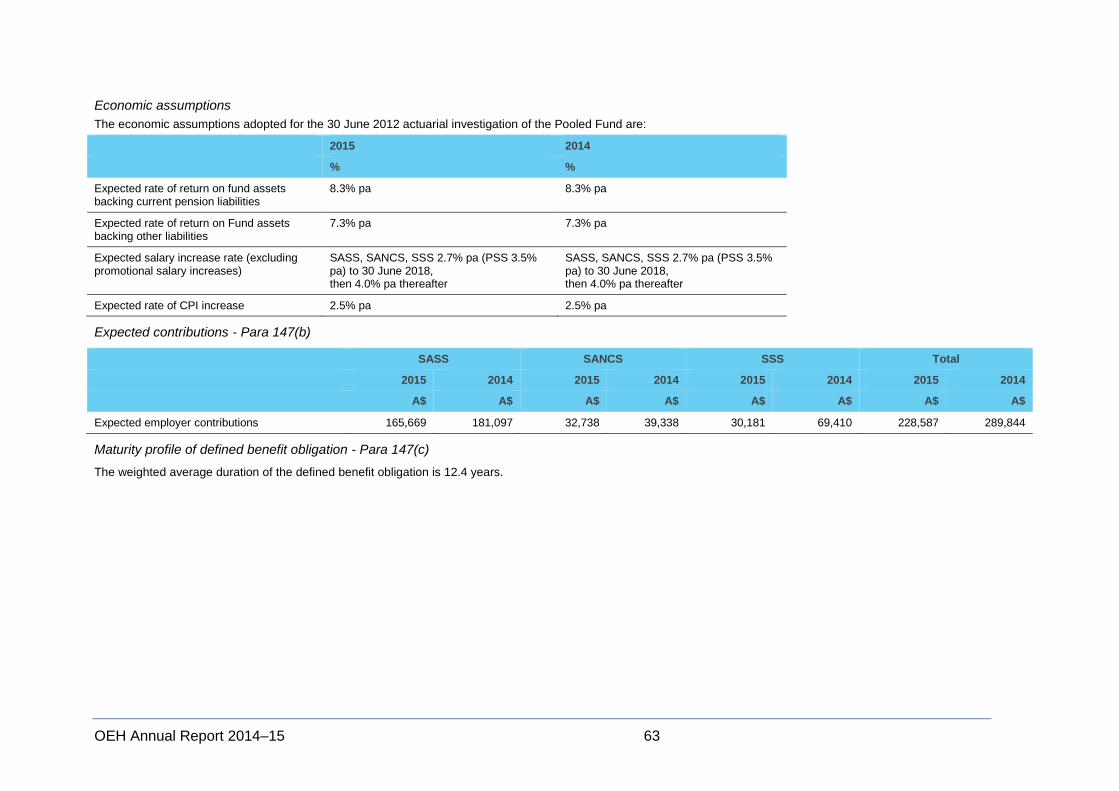
OEH Annual Report 2014–15 63
Economic assumptions
The economic assumptions adopted for the 30 June 2012 actuarial investigation of the Pooled Fund are:
2015 2014
% %
Expected rate of return on fund assets backing current pension liabilities
8.3% pa 8.3% pa
Expected rate of return on Fund assets backing other liabilities
7.3% pa 7.3% pa
Expected salary increase rate (excluding promotional salary increases)
SASS, SANCS, SSS 2.7% pa (PSS 3.5% pa) to 30 June 2018, then 4.0% pa thereafter
SASS, SANCS, SSS 2.7% pa (PSS 3.5% pa) to 30 June 2018, then 4.0% pa thereafter
Expected rate of CPI increase 2.5% pa 2.5% pa
Expected contributions - Para 147(b)
SASS SANCS SSS Total
2015 2014 2015 2014 2015 2014 2015 2014
A$ A$ A$ A$ A$ A$ A$ A$
Expected employer contributions 165,669 181,097 32,738 39,338 30,181 69,410 228,587 289,844
Maturity profile of defined benefit obligation - Para 147(c)
The weighted average duration of the defined benefit obligation is 12.4 years.
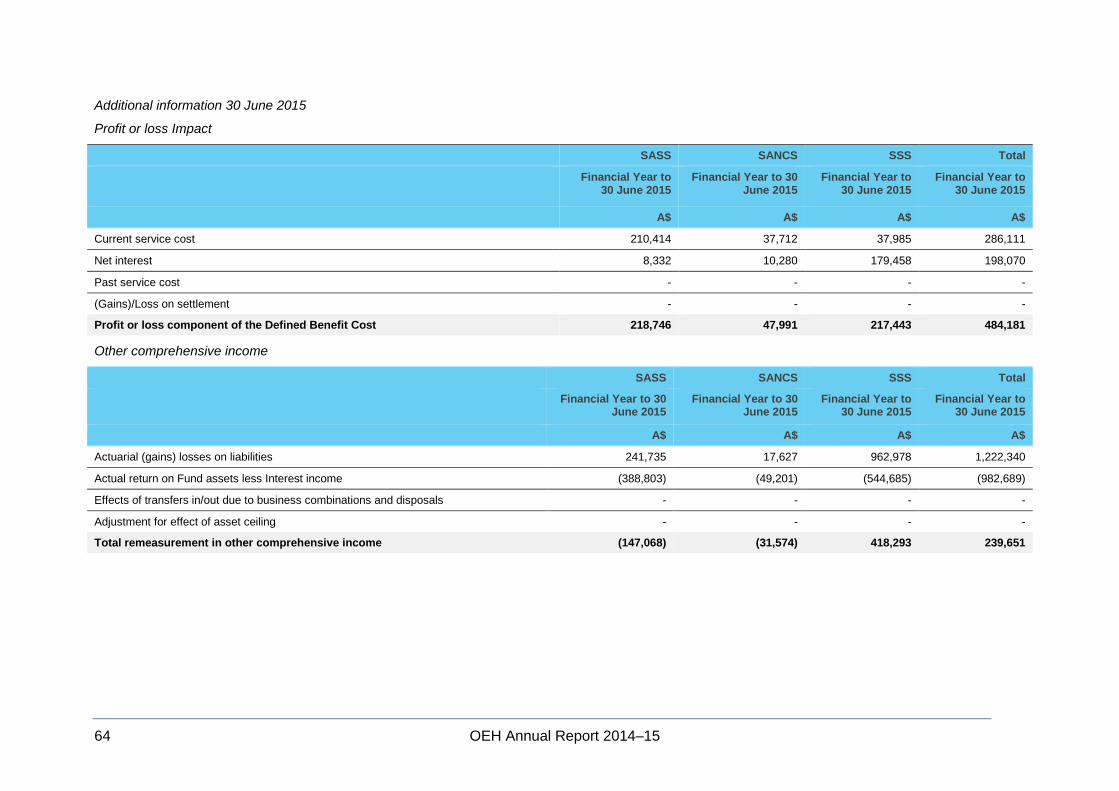
64 OEH Annual Report 2014–15
Additional information 30 June 2015
Profit or loss Impact
SASS SANCS SSS Total
Financial Year to 30 June 2015
Financial Year to 30 June 2015
Financial Year to 30 June 2015
Financial Year to 30 June 2015
A$ A$ A$ A$
Current service cost 210,414 37,712 37,985 286,111
Net interest 8,332 10,280 179,458 198,070
Past service cost - - - -
(Gains)/Loss on settlement - - - -
Profit or loss component of the Defined Benefit Cost 218,746 47,991 217,443 484,181
Other comprehensive income
SASS SANCS SSS Total
Financial Year to 30 June 2015
Financial Year to 30 June 2015
Financial Year to 30 June 2015
Financial Year to 30 June 2015
A$ A$ A$ A$
Actuarial (gains) losses on liabilities 241,735 17,627 962,978 1,222,340
Actual return on Fund assets less Interest income (388,803) (49,201) (544,685) (982,689)
Effects of transfers in/out due to business combinations and disposals - - - -
Adjustment for effect of asset ceiling - - - -
Total remeasurement in other comprehensive income (147,068) (31,574) 418,293 239,651
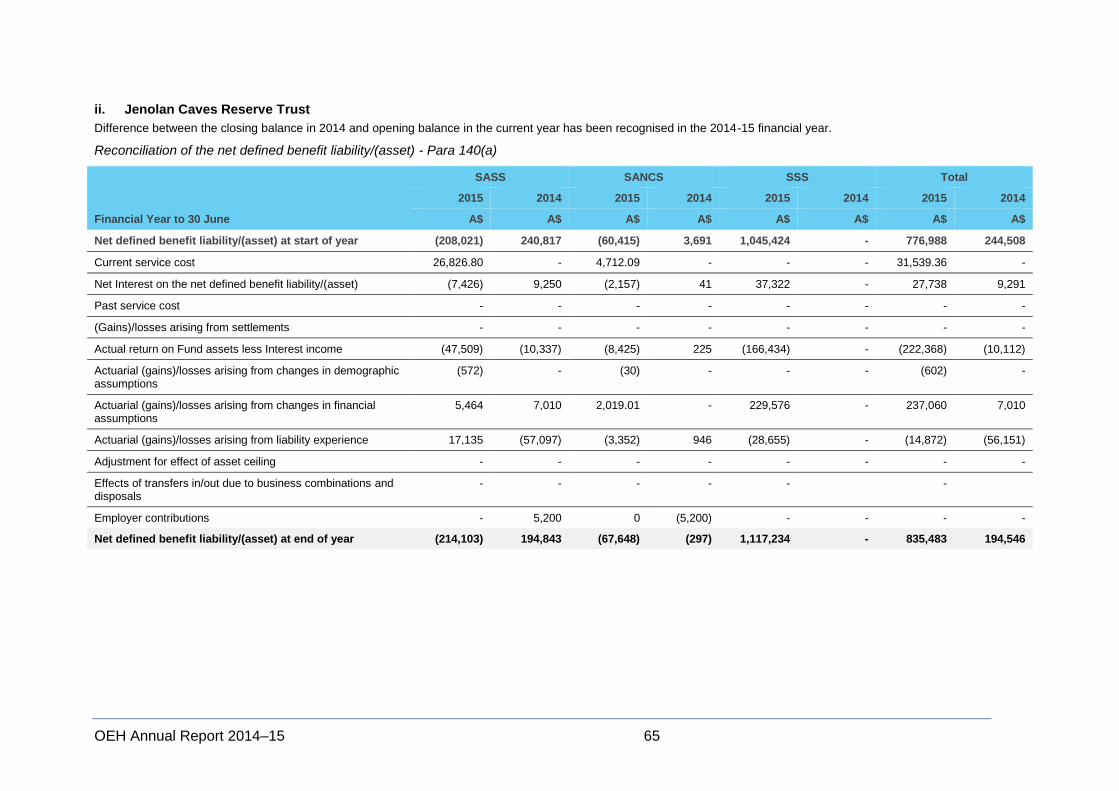
OEH Annual Report 2014–15 65
ii. Jenolan Caves Reserve Trust
Difference between the closing balance in 2014 and opening balance in the current year has been recognised in the 2014-15 financial year.
Reconciliation of the net defined benefit liability/(asset) - Para 140(a)
Financial Year to 30 June
SASS SANCS SSS Total
2015 2014 2015 2014 2015 2014 2015 2014
A$ A$ A$ A$ A$ A$ A$ A$
Net defined benefit liability/(asset) at start of year (208,021) 240,817 (60,415) 3,691 1,045,424 - 776,988 244,508
Current service cost 26,826.80 - 4,712.09 - - - 31,539.36 -
Net Interest on the net defined benefit liability/(asset) (7,426) 9,250 (2,157) 41 37,322 - 27,738 9,291
Past service cost - - - - - - - -
(Gains)/losses arising from settlements - - - - - - - -
Actual return on Fund assets less Interest income (47,509) (10,337) (8,425) 225 (166,434) - (222,368) (10,112)
Actuarial (gains)/losses arising from changes in demographic assumptions
(572) - (30) - - - (602) -
Actuarial (gains)/losses arising from changes in financial assumptions
5,464 7,010 2,019.01 - 229,576 - 237,060 7,010
Actuarial (gains)/losses arising from liability experience 17,135 (57,097) (3,352) 946 (28,655) - (14,872) (56,151)
Adjustment for effect of asset ceiling - - - - - - - -
Effects of transfers in/out due to business combinations and disposals
- - - - - -
Employer contributions - 5,200 0 (5,200) - - - -
Net defined benefit liability/(asset) at end of year (214,103) 194,843 (67,648) (297) 1,117,234 - 835,483 194,546
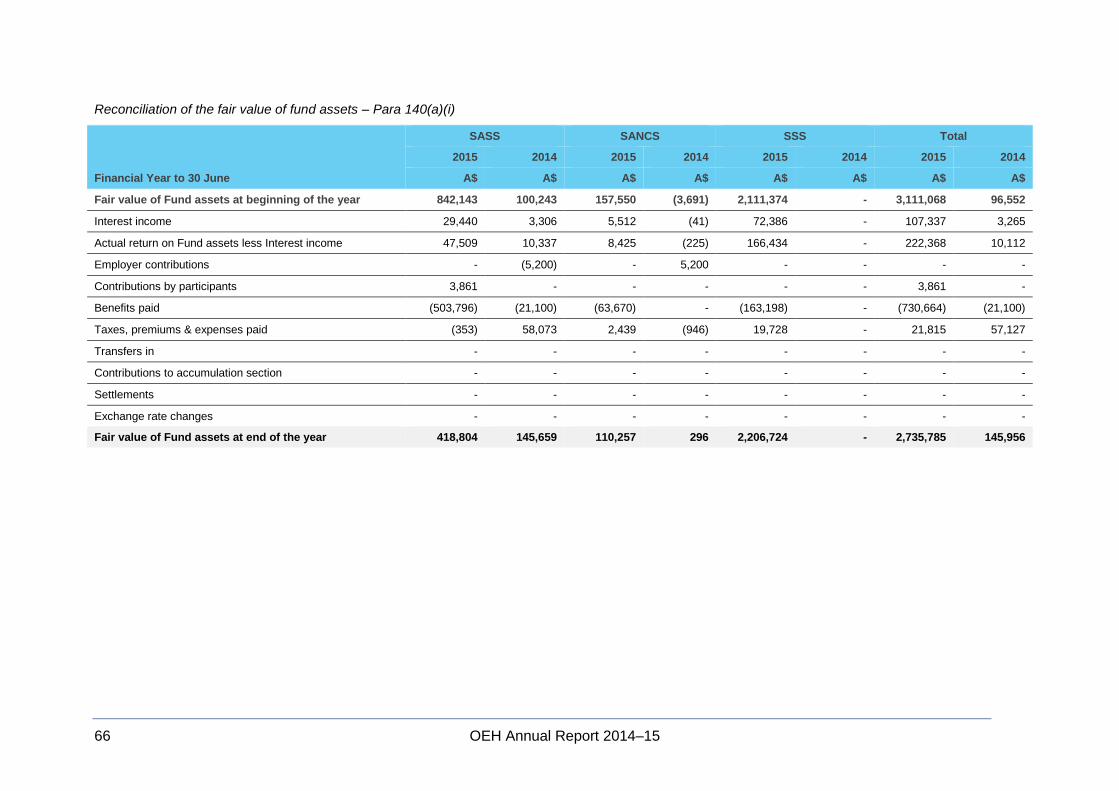
66 OEH Annual Report 2014–15
Reconciliation of the fair value of fund assets – Para 140(a)(i)
Financial Year to 30 June
SASS SANCS SSS Total
2015 2014 2015 2014 2015 2014 2015 2014
A$ A$ A$ A$ A$ A$ A$ A$
Fair value of Fund assets at beginning of the year 842,143 100,243 157,550 (3,691) 2,111,374 - 3,111,068 96,552
Interest income 29,440 3,306 5,512 (41) 72,386 - 107,337 3,265
Actual return on Fund assets less Interest income 47,509 10,337 8,425 (225) 166,434 - 222,368 10,112
Employer contributions - (5,200) - 5,200 - - - -
Contributions by participants 3,861 - - - - - 3,861 -
Benefits paid (503,796) (21,100) (63,670) - (163,198) - (730,664) (21,100)
Taxes, premiums & expenses paid (353) 58,073 2,439 (946) 19,728 - 21,815 57,127
Transfers in - - - - - - - -
Contributions to accumulation section - - - - - - - -
Settlements - - - - - - - -
Exchange rate changes - - - - - - - -
Fair value of Fund assets at end of the year 418,804 145,659 110,257 296 2,206,724 - 2,735,785 145,956
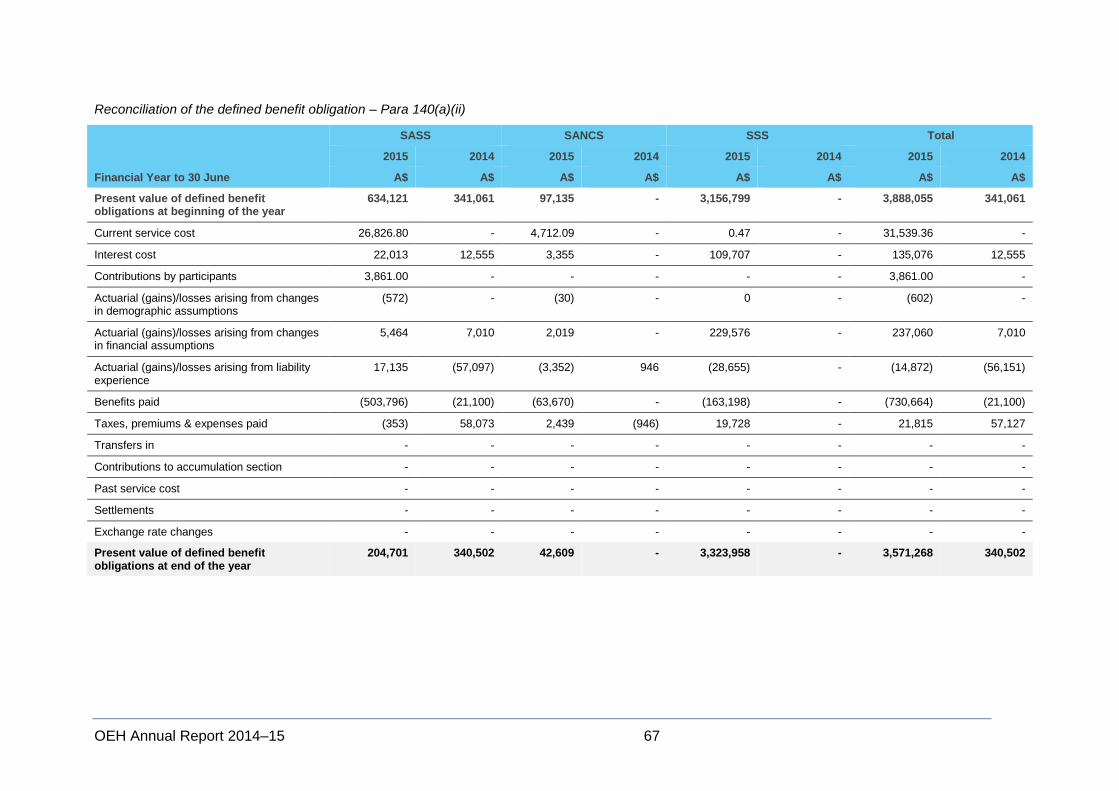
OEH Annual Report 2014–15 67
Reconciliation of the defined benefit obligation – Para 140(a)(ii)
Financial Year to 30 June
SASS SANCS SSS Total
2015 2014 2015 2014 2015 2014 2015 2014
A$ A$ A$ A$ A$ A$ A$ A$
Present value of defined benefit obligations at beginning of the year
634,121 341,061 97,135 - 3,156,799 - 3,888,055 341,061
Current service cost 26,826.80 - 4,712.09 - 0.47 - 31,539.36 -
Interest cost 22,013 12,555 3,355 - 109,707 - 135,076 12,555
Contributions by participants 3,861.00 - - - - - 3,861.00 -
Actuarial (gains)/losses arising from changes in demographic assumptions
(572) - (30) - 0 - (602) -
Actuarial (gains)/losses arising from changes in financial assumptions
5,464 7,010 2,019 - 229,576 - 237,060 7,010
Actuarial (gains)/losses arising from liability experience
17,135 (57,097) (3,352) 946 (28,655) - (14,872) (56,151)
Benefits paid (503,796) (21,100) (63,670) - (163,198) - (730,664) (21,100)
Taxes, premiums & expenses paid (353) 58,073 2,439 (946) 19,728 - 21,815 57,127
Transfers in - - - - - - - -
Contributions to accumulation section - - - - - - - -
Past service cost - - - - - - - -
Settlements - - - - - - - -
Exchange rate changes - - - - - - - -
Present value of defined benefit obligations at end of the year
204,701 340,502 42,609 - 3,323,958 - 3,571,268 340,502
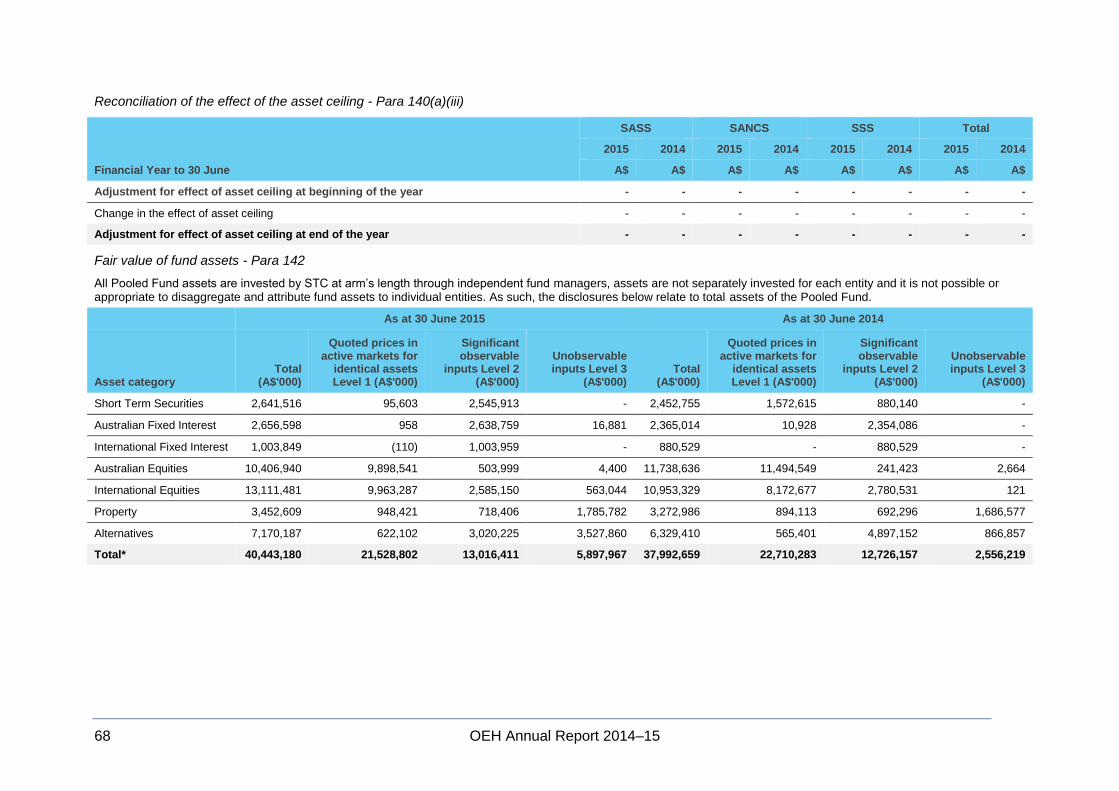
68 OEH Annual Report 2014–15
Reconciliation of the effect of the asset ceiling - Para 140(a)(iii)
Financial Year to 30 June
SASS SANCS SSS Total
2015 2014 2015 2014 2015 2014 2015 2014
A$ A$ A$ A$ A$ A$ A$ A$
Adjustment for effect of asset ceiling at beginning of the year - - - - - - - -
Change in the effect of asset ceiling - - - - - - - -
Adjustment for effect of asset ceiling at end of the year - - - - - - - -
Fair value of fund assets - Para 142
All Pooled Fund assets are invested by STC at arm’s length through independent fund managers, assets are not separately invested for each entity and it is not possible or appropriate to disaggregate and attribute fund assets to individual entities. As such, the disclosures below relate to total assets of the Pooled Fund.
As at 30 June 2015 As at 30 June 2014
Asset category Total
(A$'000)
Quoted prices in active markets for
identical assets Level 1 (A$'000)
Significant observable
inputs Level 2 (A$'000)
Unobservable inputs Level 3
(A$'000) Total
(A$'000)
Quoted prices in active markets for
identical assets Level 1 (A$'000)
Significant observable
inputs Level 2 (A$'000)
Unobservable inputs Level 3
(A$'000)
Short Term Securities 2,641,516 95,603 2,545,913 - 2,452,755 1,572,615 880,140 -
Australian Fixed Interest 2,656,598 958 2,638,759 16,881 2,365,014 10,928 2,354,086 -
International Fixed Interest 1,003,849 (110) 1,003,959 - 880,529 - 880,529 -
Australian Equities 10,406,940 9,898,541 503,999 4,400 11,738,636 11,494,549 241,423 2,664
International Equities 13,111,481 9,963,287 2,585,150 563,044 10,953,329 8,172,677 2,780,531 121
Property 3,452,609 948,421 718,406 1,785,782 3,272,986 894,113 692,296 1,686,577
Alternatives 7,170,187 622,102 3,020,225 3,527,860 6,329,410 565,401 4,897,152 866,857
Total* 40,443,180 21,528,802 13,016,411 5,897,967 37,992,659 22,710,283 12,726,157 2,556,219

OEH Annual Report 2014–15 69
The percentage invested in each asset class at the reporting date is:
As at 30 June 15 30 June 14
Short Term Securities 6.5% 6.5%
Australian Fixed Interest 6.6% 6.2%
International Fixed Interest 2.5% 2.3%
Australian Equities 25.7% 30.9%
International Equities 32.4% 28.8%
Property 8.6% 8.6%
Alternatives 17.7% 16.7%
Total 100.0% 100.0%
* Additional to the assets disclosed above, at 30 June 2015 Pooled Fund has provisions for receivables/(payables) estimated to be around $1.74 billion, giving an estimated assets totalling around $42.2 billion.
Level 1 - quoted prices in active markets for identical assets or liabilities. The assets in this levels are listed shares; listed unit trusts.
Level 2 - inputs other than quoted prices observable for the asset or liability either directly or indirectly. The assets in this level are cash; notes; government, semi-government and corporate bonds; unlisted trusts containing where quoted prices are available in active markets for identical assets or liabilities.
Level 3 - inputs for the asset or liability that are not based on observable market data. The assets in this level are unlisted property; unlisted shares; unlisted infrastructure; distressed debt; hedge funds.
Derivatives, including futures and options, can be used by investment managers. However, each manager's investment mandate clearly states that derivatives may only be used to facilitate efficient cashflow management or to hedge the portfolio against market movements and cannot be used for speculative purposes or gearing of the investment portfolio. As such managers make limited use of derivatives.
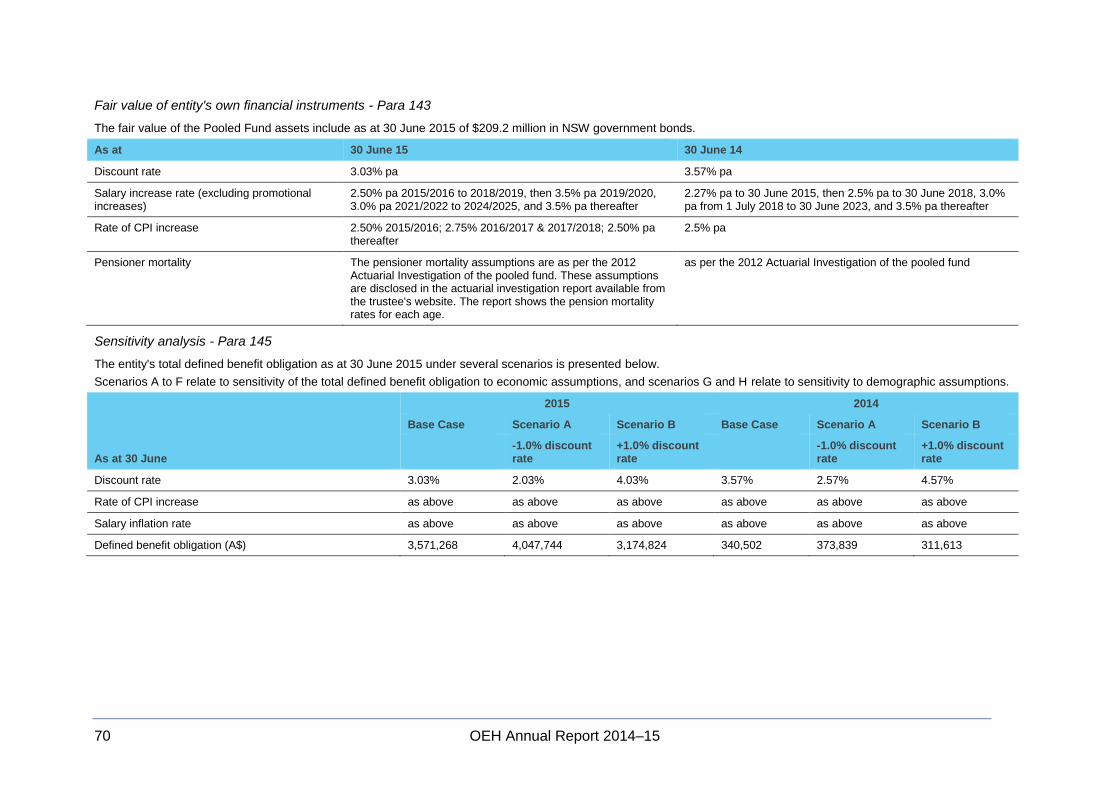
70 OEH Annual Report 2014–15
Fair value of entity's own financial instruments - Para 143
The fair value of the Pooled Fund assets include as at 30 June 2015 of $209.2 million in NSW government bonds.
As at 30 June 15 30 June 14
Discount rate 3.03% pa 3.57% pa
Salary increase rate (excluding promotional increases)
2.50% pa 2015/2016 to 2018/2019, then 3.5% pa 2019/2020, 3.0% pa 2021/2022 to 2024/2025, and 3.5% pa thereafter
2.27% pa to 30 June 2015, then 2.5% pa to 30 June 2018, 3.0% pa from 1 July 2018 to 30 June 2023, and 3.5% pa thereafter
Rate of CPI increase 2.50% 2015/2016; 2.75% 2016/2017 & 2017/2018; 2.50% pa thereafter
2.5% pa
Pensioner mortality The pensioner mortality assumptions are as per the 2012 Actuarial Investigation of the pooled fund. These assumptions are disclosed in the actuarial investigation report available from the trustee's website. The report shows the pension mortality rates for each age.
as per the 2012 Actuarial Investigation of the pooled fund
Sensitivity analysis - Para 145
The entity's total defined benefit obligation as at 30 June 2015 under several scenarios is presented below.
Scenarios A to F relate to sensitivity of the total defined benefit obligation to economic assumptions, and scenarios G and H relate to sensitivity to demographic assumptions.
As at 30 June
2015 2014
Base Case Scenario A Scenario B Base Case Scenario A Scenario B
-1.0% discount rate
+1.0% discount rate
-1.0% discount rate
+1.0% discount rate
Discount rate 3.03% 2.03% 4.03% 3.57% 2.57% 4.57%
Rate of CPI increase as above as above as above as above as above as above
Salary inflation rate as above as above as above as above as above as above
Defined benefit obligation (A$) 3,571,268 4,047,744 3,174,824 340,502 373,839 311,613

OEH Annual Report 2014–15 71
As at 30 June
2015 2014
Base Case Scenario C Scenario D Base Case Scenario C Scenario D
+0.5% rate of CPI increase
-0.5% rate of CPI increase
+0.5% rate of CPI increase
-0.5% rate of CPI increase
Discount rate as above as above as above as above as above as above
Rate of CPI increase as above above rates plus 0.5% pa
above rates less 0.5% pa 2.5% 3.0% 2.0%
Salary inflation rate as above as above as above as above as above as above
Defined benefit obligation (A$) 3,571,268 3,792,406 3,367,871 340,502 357,099 324,924
As at 30 June
2015 2014
Base Case Scenario E Scenario F Base Case Scenario E Scenario F
+0.5% salary increase rate
-0.5% salary increase rate
+0.5% salary increase rate
-0.5% salary increase rate
Discount rate as above as above as above as above as above as above
Rate of CPI increase as above as above as above as above as above as above
Salary inflation rate as above
above rates plus 0.5% pa
above rates less 0.5% pa as above
above rates less 0.5% pa
above rates less 0.5% pa
Defined benefit obligation (A$) 3,571,268 3,579,129 3,563,695 340,502 340,502 340,502
As at 30 June
2015 2014
Base Case Scenario G Scenario H Base Case Scenario G Scenario H
+5% pensioner mortality rates
-5% pensioner mortality rates
+5% pensioner mortality rates
-5% pensioner mortality rates
Defined benefit obligation (A$) 3,571,268 3,518,832 3,626,876 340,502 334,265 347,123
The defined benefit obligation has been recalculated by changing the assumptions as outlined above, whilst retaining all other assumptions.
Asset-Liability matching strategies - Para 146
The Trustee monitors its asset-liability risk continuously in setting its investment strategy. It also monitors cashflows to manage liquidity requirements. No explicit asset-liability matching strategy is used by the Trustee.
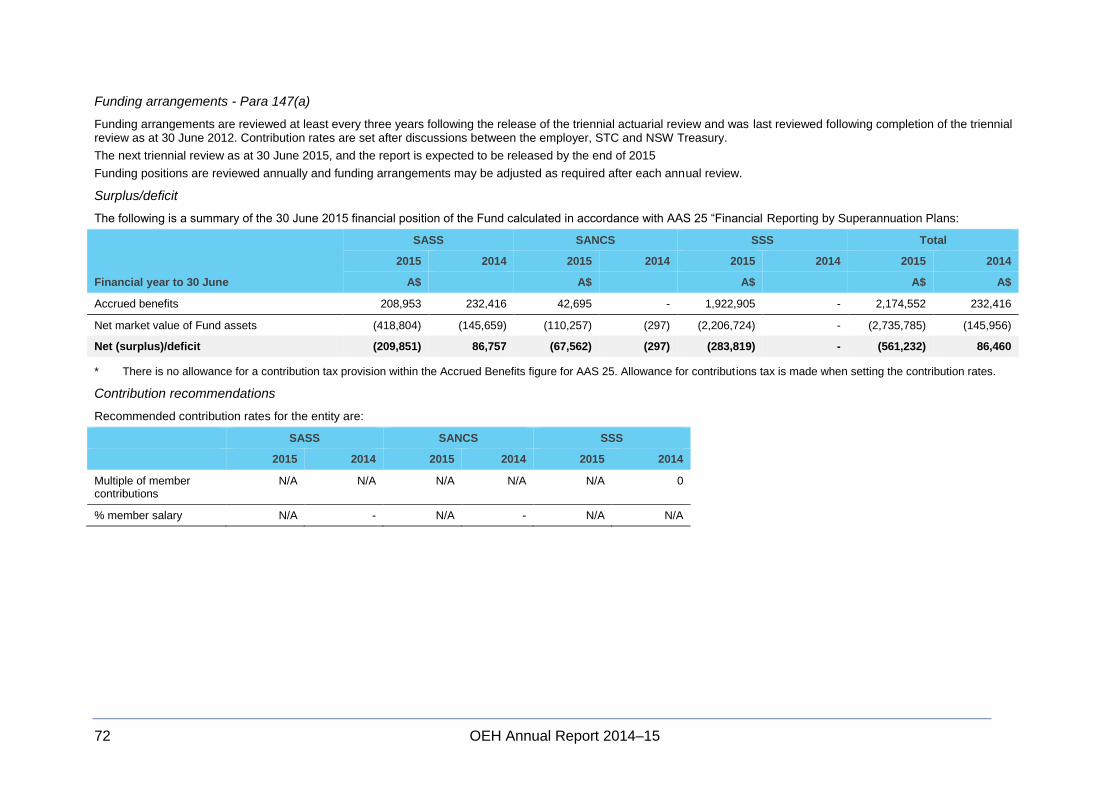
72 OEH Annual Report 2014–15
Funding arrangements - Para 147(a)
Funding arrangements are reviewed at least every three years following the release of the triennial actuarial review and was last reviewed following completion of the triennial review as at 30 June 2012. Contribution rates are set after discussions between the employer, STC and NSW Treasury.
The next triennial review as at 30 June 2015, and the report is expected to be released by the end of 2015
Funding positions are reviewed annually and funding arrangements may be adjusted as required after each annual review.
Surplus/deficit
The following is a summary of the 30 June 2015 financial position of the Fund calculated in accordance with AAS 25 “Financial Reporting by Superannuation Plans:
Financial year to 30 June
SASS SANCS SSS Total
2015 2014 2015 2014 2015 2014 2015 2014
A$ A$ A$ A$ A$
Accrued benefits 208,953 232,416 42,695 - 1,922,905 - 2,174,552 232,416
Net market value of Fund assets (418,804) (145,659) (110,257) (297) (2,206,724) - (2,735,785) (145,956)
Net (surplus)/deficit (209,851) 86,757 (67,562) (297) (283,819) - (561,232) 86,460
* There is no allowance for a contribution tax provision within the Accrued Benefits figure for AAS 25. Allowance for contributions tax is made when setting the contribution rates.
Contribution recommendations
Recommended contribution rates for the entity are:
SASS SANCS SSS
2015 2014 2015 2014 2015 2014
Multiple of member contributions
N/A N/A N/A N/A N/A 0
% member salary N/A - N/A - N/A N/A
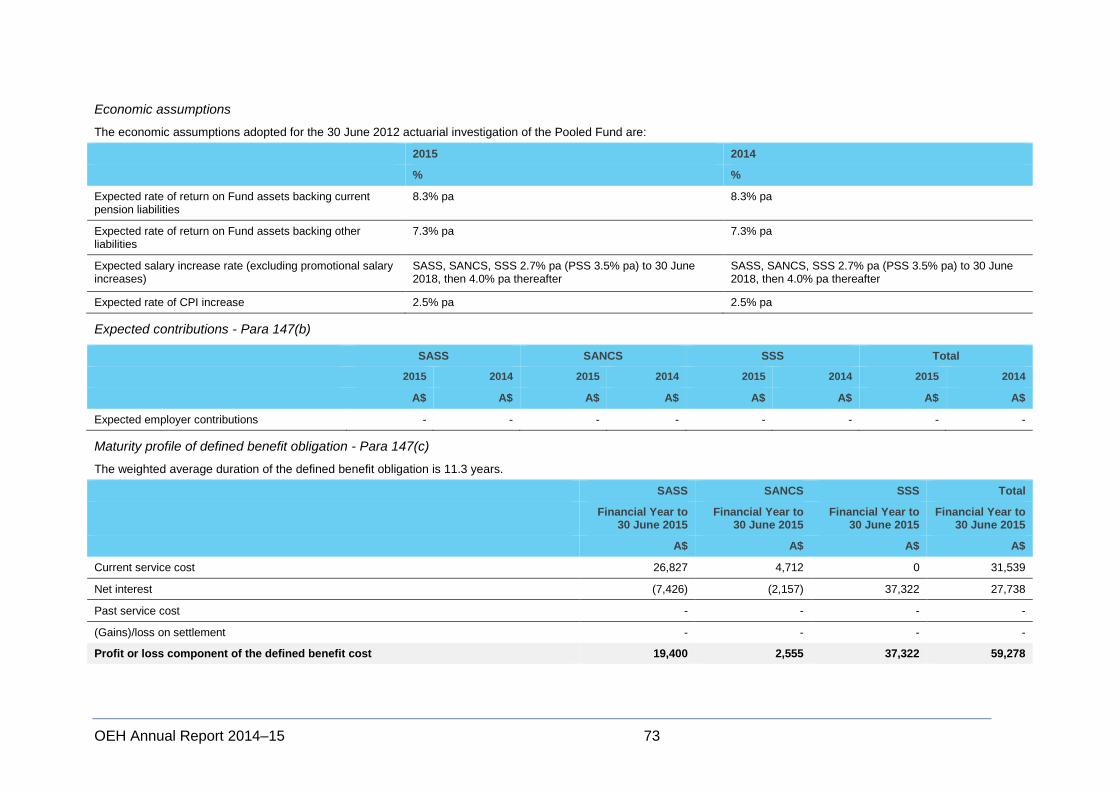
OEH Annual Report 2014–15 73
Economic assumptions
The economic assumptions adopted for the 30 June 2012 actuarial investigation of the Pooled Fund are:
2015 2014
% %
Expected rate of return on Fund assets backing current pension liabilities
8.3% pa 8.3% pa
Expected rate of return on Fund assets backing other liabilities
7.3% pa 7.3% pa
Expected salary increase rate (excluding promotional salary increases)
SASS, SANCS, SSS 2.7% pa (PSS 3.5% pa) to 30 June 2018, then 4.0% pa thereafter
SASS, SANCS, SSS 2.7% pa (PSS 3.5% pa) to 30 June 2018, then 4.0% pa thereafter
Expected rate of CPI increase 2.5% pa 2.5% pa
Expected contributions - Para 147(b)
SASS SANCS SSS Total
2015 2014 2015 2014 2015 2014 2015 2014
A$ A$ A$ A$ A$ A$ A$ A$
Expected employer contributions - - - - - - - -
Maturity profile of defined benefit obligation - Para 147(c)
The weighted average duration of the defined benefit obligation is 11.3 years.
SASS SANCS SSS Total
Financial Year to 30 June 2015
Financial Year to 30 June 2015
Financial Year to 30 June 2015
Financial Year to 30 June 2015
A$ A$ A$ A$
Current service cost 26,827 4,712 0 31,539
Net interest (7,426) (2,157) 37,322 27,738
Past service cost - - - -
(Gains)/loss on settlement - - - -
Profit or loss component of the defined benefit cost 19,400 2,555 37,322 59,278
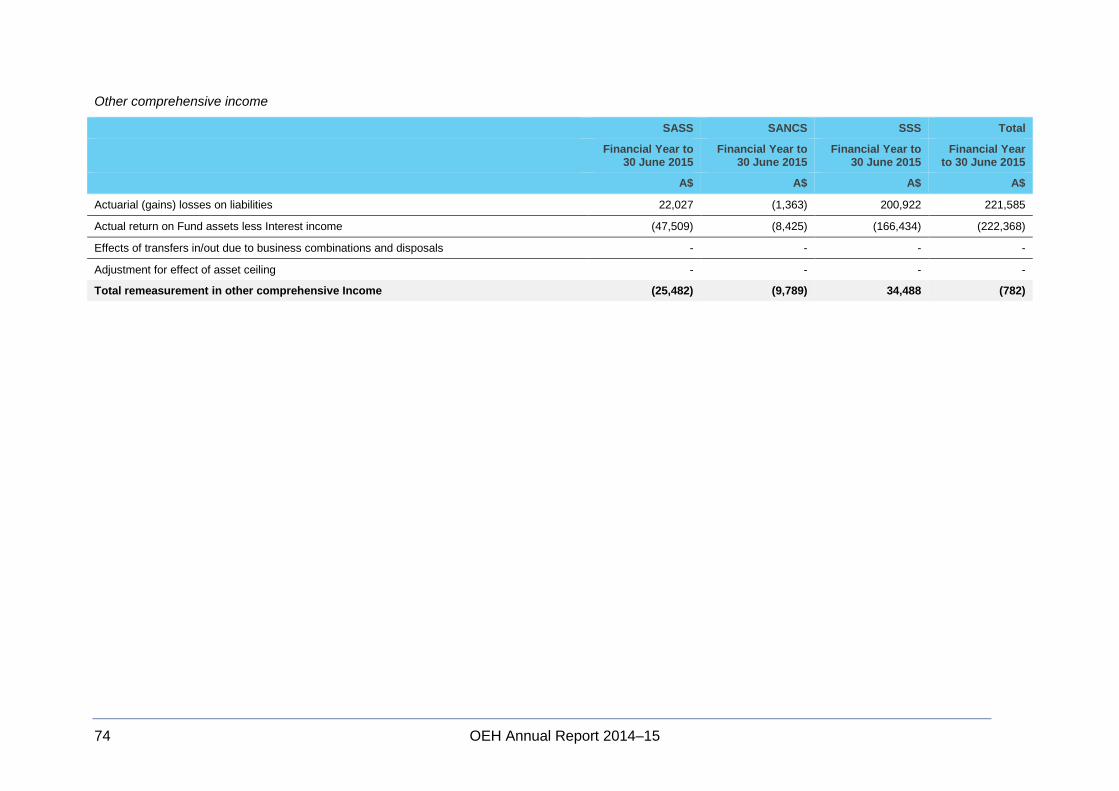
74 OEH Annual Report 2014–15
Other comprehensive income
SASS SANCS SSS Total
Financial Year to 30 June 2015
Financial Year to 30 June 2015
Financial Year to 30 June 2015
Financial Year to 30 June 2015
A$ A$ A$ A$
Actuarial (gains) losses on liabilities 22,027 (1,363) 200,922 221,585
Actual return on Fund assets less Interest income (47,509) (8,425) (166,434) (222,368)
Effects of transfers in/out due to business combinations and disposals - - - -
Adjustment for effect of asset ceiling - - - -
Total remeasurement in other comprehensive Income (25,482) (9,789) 34,488 (782)
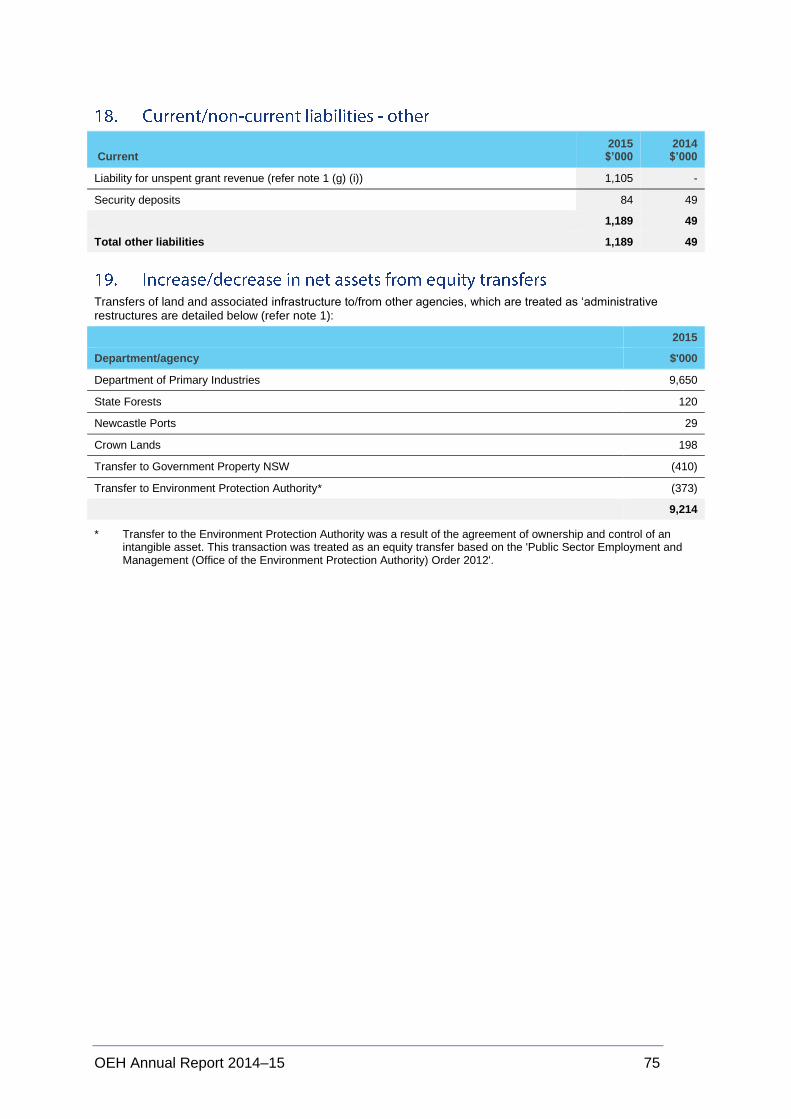
OEH Annual Report 2014–15 75
Current 2015 $’000
2014 $’000
Liability for unspent grant revenue (refer note 1 (g) (i)) 1,105 -
Security deposits 84 49
1,189 49
Total other liabilities 1,189 49
Transfers of land and associated infrastructure to/from other agencies, which are treated as ‘administrative restructures are detailed below (refer note 1):
2015
Department/agency $'000
Department of Primary Industries 9,650
State Forests 120
Newcastle Ports 29
Crown Lands 198
Transfer to Government Property NSW (410)
Transfer to Environment Protection Authority* (373)
9,214
* Transfer to the Environment Protection Authority was a result of the agreement of ownership and control of an intangible asset. This transaction was treated as an equity transfer based on the 'Public Sector Employment and Management (Office of the Environment Protection Authority) Order 2012'.
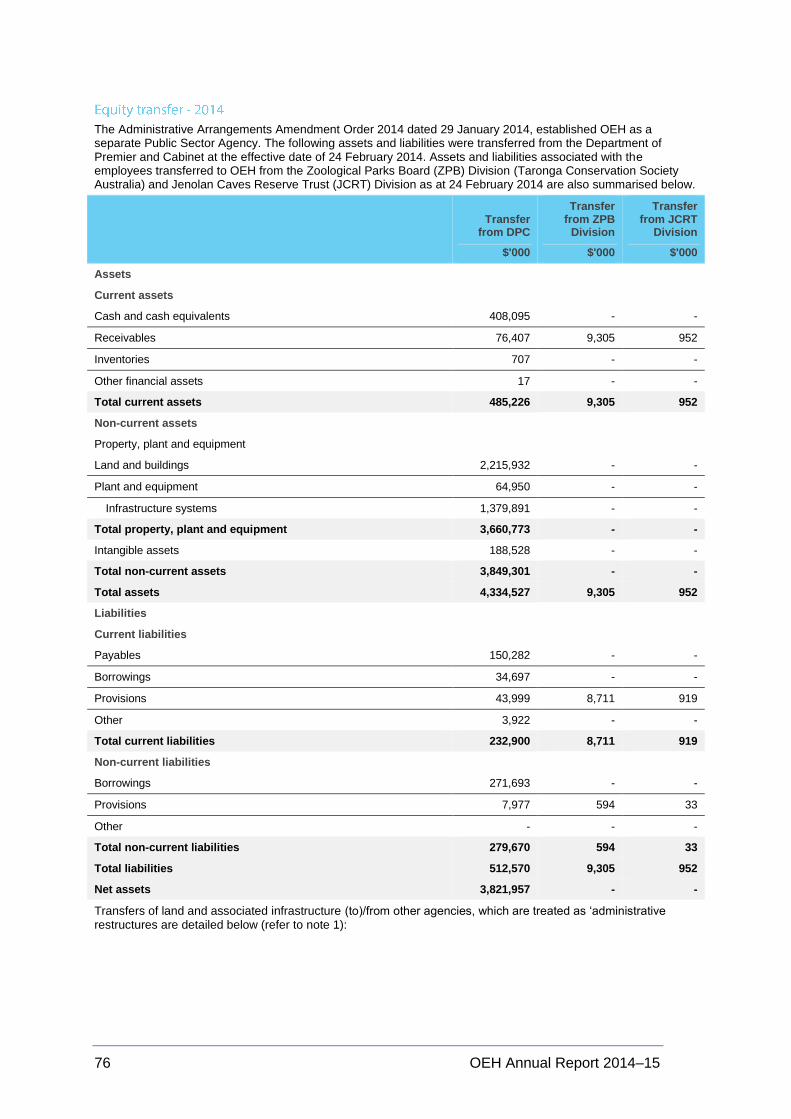
76 OEH Annual Report 2014–15
The Administrative Arrangements Amendment Order 2014 dated 29 January 2014, established OEH as a separate Public Sector Agency. The following assets and liabilities were transferred from the Department of Premier and Cabinet at the effective date of 24 February 2014. Assets and liabilities associated with the employees transferred to OEH from the Zoological Parks Board (ZPB) Division (Taronga Conservation Society Australia) and Jenolan Caves Reserve Trust (JCRT) Division as at 24 February 2014 are also summarised below.
Transfer from DPC
$'000
Transfer from ZPB
Division
$'000
Transfer from JCRT
Division
$'000
Assets
Current assets
Cash and cash equivalents 408,095 - -
Receivables 76,407 9,305 952
Inventories 707 - -
Other financial assets 17 - -
Total current assets 485,226 9,305 952
Non-current assets
Property, plant and equipment
Land and buildings 2,215,932 - -
Plant and equipment 64,950 - -
Infrastructure systems 1,379,891 - -
Total property, plant and equipment 3,660,773 - -
Intangible assets 188,528 - -
Total non-current assets 3,849,301 - -
Total assets 4,334,527 9,305 952
Liabilities
Current liabilities
Payables 150,282 - -
Borrowings 34,697 - -
Provisions 43,999 8,711 919
Other 3,922 - -
Total current liabilities 232,900 8,711 919
Non-current liabilities
Borrowings 271,693 - -
Provisions 7,977 594 33
Other - - -
Total non-current liabilities 279,670 594 33
Total liabilities 512,570 9,305 952
Net assets 3,821,957 - -
Transfers of land and associated infrastructure (to)/from other agencies, which are treated as ‘administrative restructures are detailed below (refer to note 1):
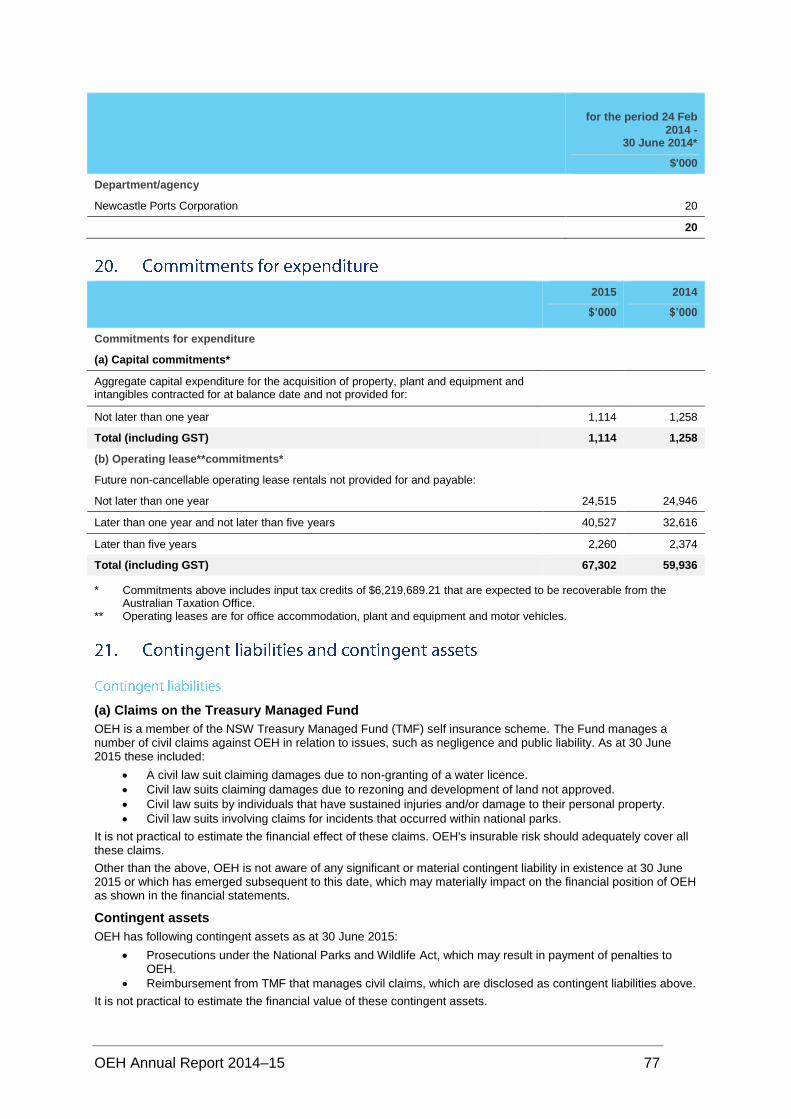
OEH Annual Report 2014–15 77
for the period 24 Feb
2014 - 30 June 2014*
$'000
Department/agency
Newcastle Ports Corporation 20
20
2015
$’000
2014
$’000
Commitments for expenditure
(a) Capital commitments*
Aggregate capital expenditure for the acquisition of property, plant and equipment and intangibles contracted for at balance date and not provided for:
Not later than one year 1,114 1,258
Total (including GST) 1,114 1,258
(b) Operating lease**commitments*
Future non-cancellable operating lease rentals not provided for and payable:
Not later than one year 24,515 24,946
Later than one year and not later than five years 40,527 32,616
Later than five years 2,260 2,374
Total (including GST) 67,302 59,936
* Commitments above includes input tax credits of $6,219,689.21 that are expected to be recoverable from the Australian Taxation Office.
** Operating leases are for office accommodation, plant and equipment and motor vehicles.
(a) Claims on the Treasury Managed Fund
OEH is a member of the NSW Treasury Managed Fund (TMF) self insurance scheme. The Fund manages a number of civil claims against OEH in relation to issues, such as negligence and public liability. As at 30 June 2015 these included:
A civil law suit claiming damages due to non-granting of a water licence.
Civil law suits claiming damages due to rezoning and development of land not approved.
Civil law suits by individuals that have sustained injuries and/or damage to their personal property.
Civil law suits involving claims for incidents that occurred within national parks.
It is not practical to estimate the financial effect of these claims. OEH's insurable risk should adequately cover all these claims.
Other than the above, OEH is not aware of any significant or material contingent liability in existence at 30 June 2015 or which has emerged subsequent to this date, which may materially impact on the financial position of OEH as shown in the financial statements.
Contingent assets
OEH has following contingent assets as at 30 June 2015:
Prosecutions under the National Parks and Wildlife Act, which may result in payment of penalties to OEH.
Reimbursement from TMF that manages civil claims, which are disclosed as contingent liabilities above.
It is not practical to estimate the financial value of these contingent assets.
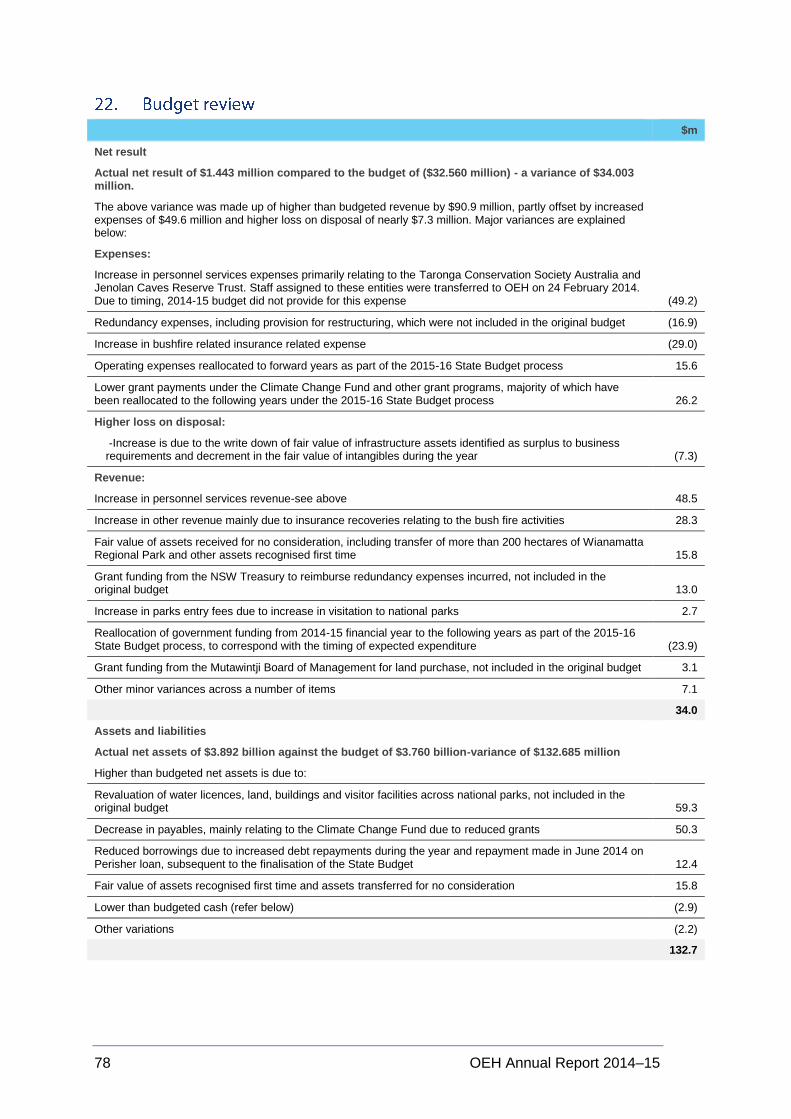
78 OEH Annual Report 2014–15
$m
Net result
Actual net result of $1.443 million compared to the budget of ($32.560 million) - a variance of $34.003 million.
The above variance was made up of higher than budgeted revenue by $90.9 million, partly offset by increased expenses of $49.6 million and higher loss on disposal of nearly $7.3 million. Major variances are explained below:
Expenses:
Increase in personnel services expenses primarily relating to the Taronga Conservation Society Australia and Jenolan Caves Reserve Trust. Staff assigned to these entities were transferred to OEH on 24 February 2014. Due to timing, 2014-15 budget did not provide for this expense (49.2)
Redundancy expenses, including provision for restructuring, which were not included in the original budget (16.9)
Increase in bushfire related insurance related expense (29.0)
Operating expenses reallocated to forward years as part of the 2015-16 State Budget process 15.6
Lower grant payments under the Climate Change Fund and other grant programs, majority of which have been reallocated to the following years under the 2015-16 State Budget process 26.2
Higher loss on disposal:
-Increase is due to the write down of fair value of infrastructure assets identified as surplus to business requirements and decrement in the fair value of intangibles during the year (7.3)
Revenue:
Increase in personnel services revenue-see above 48.5
Increase in other revenue mainly due to insurance recoveries relating to the bush fire activities 28.3
Fair value of assets received for no consideration, including transfer of more than 200 hectares of Wianamatta Regional Park and other assets recognised first time 15.8
Grant funding from the NSW Treasury to reimburse redundancy expenses incurred, not included in the original budget 13.0
Increase in parks entry fees due to increase in visitation to national parks 2.7
Reallocation of government funding from 2014-15 financial year to the following years as part of the 2015-16 State Budget process, to correspond with the timing of expected expenditure (23.9)
Grant funding from the Mutawintji Board of Management for land purchase, not included in the original budget 3.1
Other minor variances across a number of items 7.1
34.0
Assets and liabilities
Actual net assets of $3.892 billion against the budget of $3.760 billion-variance of $132.685 million
Higher than budgeted net assets is due to:
Revaluation of water licences, land, buildings and visitor facilities across national parks, not included in the original budget 59.3
Decrease in payables, mainly relating to the Climate Change Fund due to reduced grants 50.3
Reduced borrowings due to increased debt repayments during the year and repayment made in June 2014 on Perisher loan, subsequent to the finalisation of the State Budget 12.4
Fair value of assets recognised first time and assets transferred for no consideration 15.8
Lower than budgeted cash (refer below) (2.9)
Other variations (2.2)
132.7
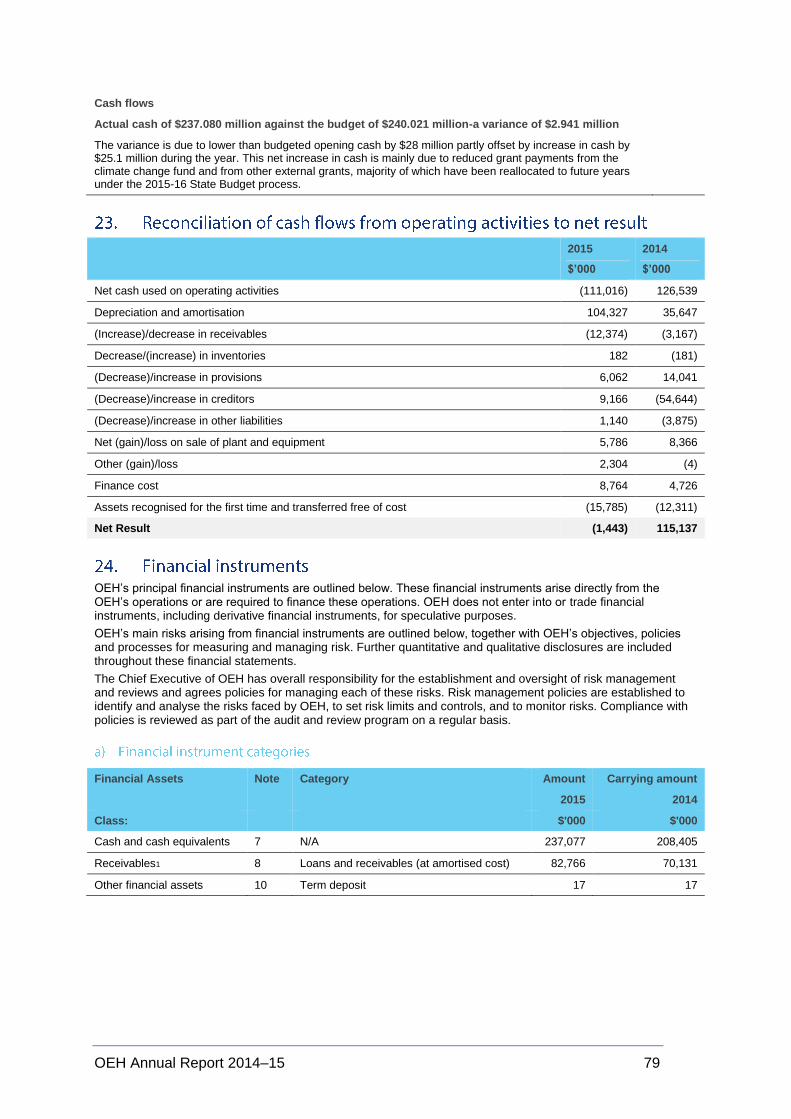
OEH Annual Report 2014–15 79
Cash flows
Actual cash of $237.080 million against the budget of $240.021 million-a variance of $2.941 million
The variance is due to lower than budgeted opening cash by $28 million partly offset by increase in cash by $25.1 million during the year. This net increase in cash is mainly due to reduced grant payments from the climate change fund and from other external grants, majority of which have been reallocated to future years under the 2015-16 State Budget process.
2015
$’000
2014
$’000
Net cash used on operating activities (111,016) 126,539
Depreciation and amortisation 104,327 35,647
(Increase)/decrease in receivables (12,374) (3,167)
Decrease/(increase) in inventories 182 (181)
(Decrease)/increase in provisions 6,062 14,041
(Decrease)/increase in creditors 9,166 (54,644)
(Decrease)/increase in other liabilities 1,140 (3,875)
Net (gain)/loss on sale of plant and equipment 5,786 8,366
Other (gain)/loss 2,304 (4)
Finance cost 8,764 4,726
Assets recognised for the first time and transferred free of cost (15,785) (12,311)
Net Result (1,443) 115,137
OEH’s principal financial instruments are outlined below. These financial instruments arise directly from the OEH’s operations or are required to finance these operations. OEH does not enter into or trade financial instruments, including derivative financial instruments, for speculative purposes.
OEH’s main risks arising from financial instruments are outlined below, together with OEH’s objectives, policies and processes for measuring and managing risk. Further quantitative and qualitative disclosures are included throughout these financial statements.
The Chief Executive of OEH has overall responsibility for the establishment and oversight of risk management and reviews and agrees policies for managing each of these risks. Risk management policies are established to identify and analyse the risks faced by OEH, to set risk limits and controls, and to monitor risks. Compliance with policies is reviewed as part of the audit and review program on a regular basis.
Financial Assets Note Category Amount Carrying amount
2015 2014
Class: $'000 $'000
Cash and cash equivalents 7 N/A 237,077 208,405
Receivables1 8 Loans and receivables (at amortised cost) 82,766 70,131
Other financial assets 10 Term deposit 17 17
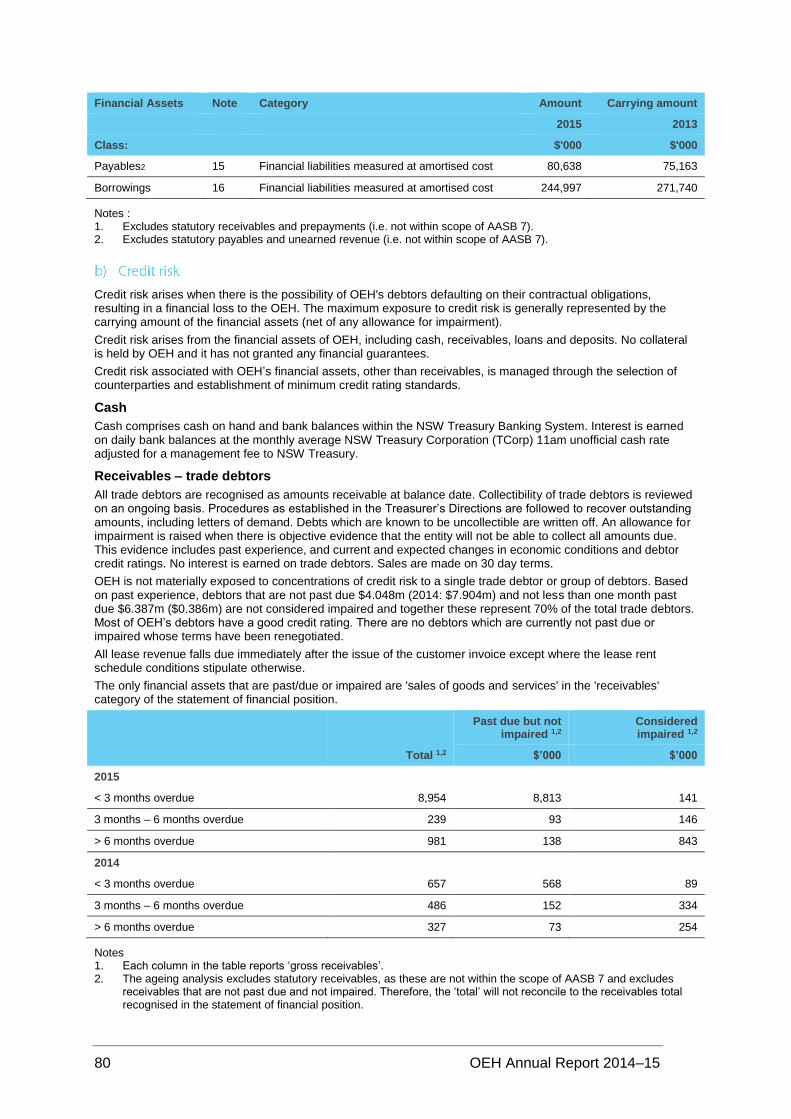
80 OEH Annual Report 2014–15
Financial Assets Note Category Amount Carrying amount
2015 2013
Class: $'000 $'000
Payables2 15 Financial liabilities measured at amortised cost 80,638 75,163
Borrowings 16 Financial liabilities measured at amortised cost 244,997 271,740
Notes : 1. Excludes statutory receivables and prepayments (i.e. not within scope of AASB 7). 2. Excludes statutory payables and unearned revenue (i.e. not within scope of AASB 7).
Credit risk arises when there is the possibility of OEH's debtors defaulting on their contractual obligations, resulting in a financial loss to the OEH. The maximum exposure to credit risk is generally represented by the carrying amount of the financial assets (net of any allowance for impairment).
Credit risk arises from the financial assets of OEH, including cash, receivables, loans and deposits. No collateral is held by OEH and it has not granted any financial guarantees.
Credit risk associated with OEH’s financial assets, other than receivables, is managed through the selection of counterparties and establishment of minimum credit rating standards.
Cash
Cash comprises cash on hand and bank balances within the NSW Treasury Banking System. Interest is earned on daily bank balances at the monthly average NSW Treasury Corporation (TCorp) 11am unofficial cash rate adjusted for a management fee to NSW Treasury.
Receivables – trade debtors
All trade debtors are recognised as amounts receivable at balance date. Collectibility of trade debtors is reviewed on an ongoing basis. Procedures as established in the Treasurer’s Directions are followed to recover outstanding amounts, including letters of demand. Debts which are known to be uncollectible are written off. An allowance for impairment is raised when there is objective evidence that the entity will not be able to collect all amounts due. This evidence includes past experience, and current and expected changes in economic conditions and debtor credit ratings. No interest is earned on trade debtors. Sales are made on 30 day terms.
OEH is not materially exposed to concentrations of credit risk to a single trade debtor or group of debtors. Based on past experience, debtors that are not past due $4.048m (2014: $7.904m) and not less than one month past due $6.387m ($0.386m) are not considered impaired and together these represent 70% of the total trade debtors. Most of OEH’s debtors have a good credit rating. There are no debtors which are currently not past due or impaired whose terms have been renegotiated.
All lease revenue falls due immediately after the issue of the customer invoice except where the lease rent schedule conditions stipulate otherwise.
The only financial assets that are past/due or impaired are 'sales of goods and services' in the 'receivables' category of the statement of financial position.
Total 1,2
Past due but not impaired 1,2
Considered impaired 1,2
$’000 $’000
2015
< 3 months overdue 8,954 8,813 141
3 months – 6 months overdue 239 93 146
> 6 months overdue 981 138 843
2014
< 3 months overdue 657 568 89
3 months – 6 months overdue 486 152 334
> 6 months overdue 327 73 254
Notes 1. Each column in the table reports ‘gross receivables’. 2. The ageing analysis excludes statutory receivables, as these are not within the scope of AASB 7 and excludes
receivables that are not past due and not impaired. Therefore, the ‘total’ will not reconcile to the receivables total recognised in the statement of financial position.
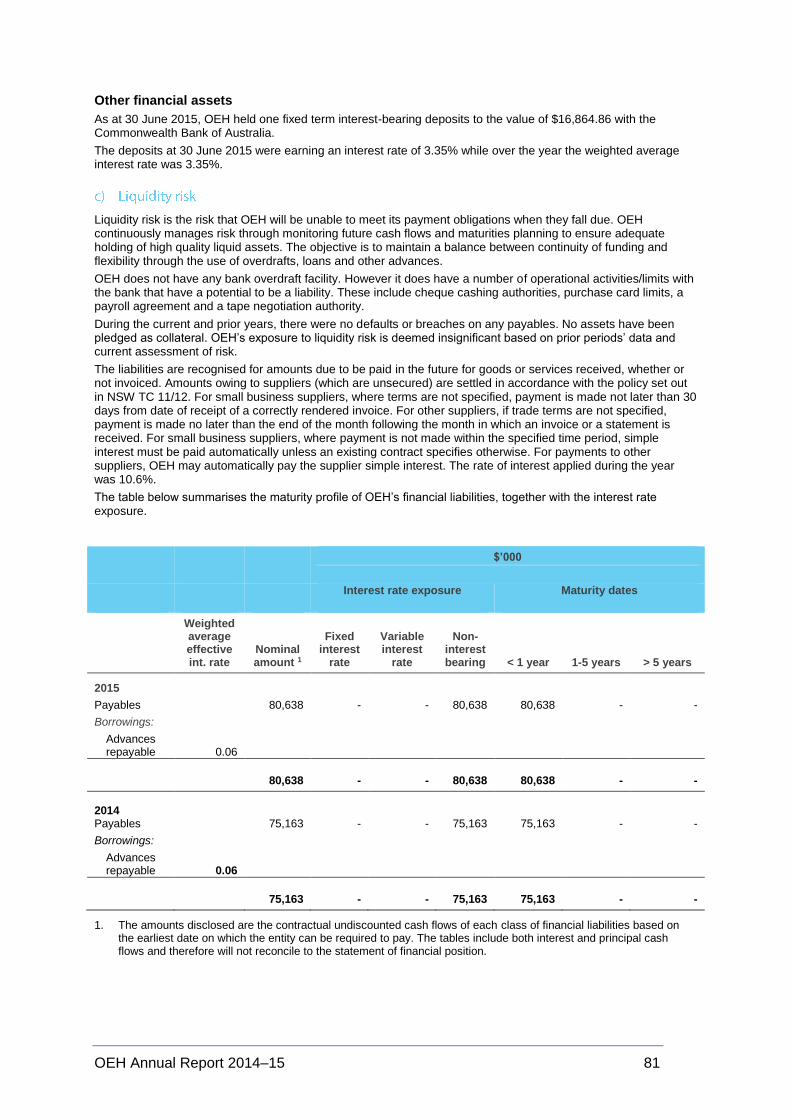
OEH Annual Report 2014–15 81
Other financial assets
As at 30 June 2015, OEH held one fixed term interest-bearing deposits to the value of $16,864.86 with the Commonwealth Bank of Australia.
The deposits at 30 June 2015 were earning an interest rate of 3.35% while over the year the weighted average interest rate was 3.35%.
Liquidity risk is the risk that OEH will be unable to meet its payment obligations when they fall due. OEH continuously manages risk through monitoring future cash flows and maturities planning to ensure adequate holding of high quality liquid assets. The objective is to maintain a balance between continuity of funding and flexibility through the use of overdrafts, loans and other advances.
OEH does not have any bank overdraft facility. However it does have a number of operational activities/limits with the bank that have a potential to be a liability. These include cheque cashing authorities, purchase card limits, a payroll agreement and a tape negotiation authority.
During the current and prior years, there were no defaults or breaches on any payables. No assets have been pledged as collateral. OEH’s exposure to liquidity risk is deemed insignificant based on prior periods’ data and current assessment of risk.
The liabilities are recognised for amounts due to be paid in the future for goods or services received, whether or not invoiced. Amounts owing to suppliers (which are unsecured) are settled in accordance with the policy set out in NSW TC 11/12. For small business suppliers, where terms are not specified, payment is made not later than 30 days from date of receipt of a correctly rendered invoice. For other suppliers, if trade terms are not specified, payment is made no later than the end of the month following the month in which an invoice or a statement is received. For small business suppliers, where payment is not made within the specified time period, simple interest must be paid automatically unless an existing contract specifies otherwise. For payments to other suppliers, OEH may automatically pay the supplier simple interest. The rate of interest applied during the year was 10.6%.
The table below summarises the maturity profile of OEH’s financial liabilities, together with the interest rate exposure.
$’000
Interest rate exposure Maturity dates
Weighted average effective int. rate
Nominal amount 1
Fixed interest
rate
Variable interest
rate
Non-interest bearing < 1 year 1-5 years > 5 years
2015
Payables 80,638 - - 80,638 80,638 - -
Borrowings:
Advances repayable 0.06
80,638 - - 80,638 80,638 - -
2014
Payables 75,163 - - 75,163 75,163 - -
Borrowings:
Advances repayable 0.06
75,163 - - 75,163 75,163 - -
1. The amounts disclosed are the contractual undiscounted cash flows of each class of financial liabilities based on the earliest date on which the entity can be required to pay. The tables include both interest and principal cash flows and therefore will not reconcile to the statement of financial position.
82 OEH Annual Report 2014–15
Market risk is the risk that the fair value or future cash flows of a financial instrument will fluctuate because of changes in market prices. OEH’s exposures to market risk are primarily through interest rate risk on OEH’s borrowings. OEH has no exposure to foreign currency risk and does not enter into commodity contracts.
The effect on profit and equity due to a reasonably possible change in risk variable is outlined in the information below, for interest rate risk and other price risk. A reasonably possible change in risk variable has been determined after taking into account the economic environment in which OEH operates and the time frame for the assessment (i.e. until the end of the next annual reporting period). The sensitivity analysis is based on risk exposures in existence at the balance date. The analysis is performed on the same basis as for 2014. The analysis assumes that all other variables remain constant.
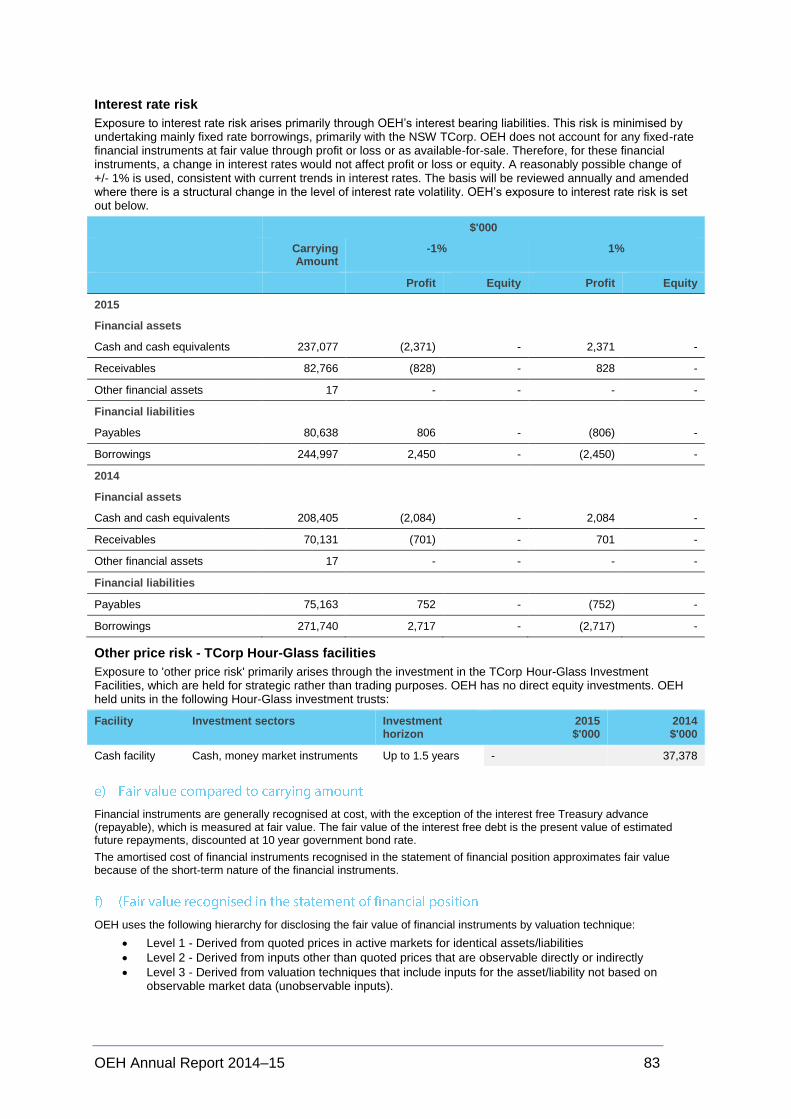
OEH Annual Report 2014–15 83
Interest rate risk
Exposure to interest rate risk arises primarily through OEH’s interest bearing liabilities. This risk is minimised by undertaking mainly fixed rate borrowings, primarily with the NSW TCorp. OEH does not account for any fixed-rate financial instruments at fair value through profit or loss or as available-for-sale. Therefore, for these financial instruments, a change in interest rates would not affect profit or loss or equity. A reasonably possible change of +/- 1% is used, consistent with current trends in interest rates. The basis will be reviewed annually and amended where there is a structural change in the level of interest rate volatility. OEH’s exposure to interest rate risk is set out below.
$'000
Carrying Amount
-1% 1%
Profit Equity Profit Equity
2015
Financial assets
Cash and cash equivalents 237,077 (2,371) - 2,371 -
Receivables 82,766 (828) - 828 -
Other financial assets 17 - - - -
Financial liabilities
Payables 80,638 806 - (806) -
Borrowings 244,997 2,450 - (2,450) -
2014
Financial assets
Cash and cash equivalents 208,405 (2,084) - 2,084 -
Receivables 70,131 (701) - 701 -
Other financial assets 17 - - - -
Financial liabilities
Payables 75,163 752 - (752) -
Borrowings 271,740 2,717 - (2,717) -
Other price risk - TCorp Hour-Glass facilities
Exposure to 'other price risk' primarily arises through the investment in the TCorp Hour-Glass Investment Facilities, which are held for strategic rather than trading purposes. OEH has no direct equity investments. OEH held units in the following Hour-Glass investment trusts:
Facility Investment sectors Investment horizon
2015 $'000
2014 $'000
Cash facility Cash, money market instruments Up to 1.5 years - 37,378
Financial instruments are generally recognised at cost, with the exception of the interest free Treasury advance (repayable), which is measured at fair value. The fair value of the interest free debt is the present value of estimated future repayments, discounted at 10 year government bond rate.
The amortised cost of financial instruments recognised in the statement of financial position approximates fair value because of the short-term nature of the financial instruments.
OEH uses the following hierarchy for disclosing the fair value of financial instruments by valuation technique:
Level 1 - Derived from quoted prices in active markets for identical assets/liabilities
Level 2 - Derived from inputs other than quoted prices that are observable directly or indirectly
Level 3 - Derived from valuation techniques that include inputs for the asset/liability not based on observable market data (unobservable inputs).
84 OEH Annual Report 2014–15
OEH is not aware of any circumstances that occurred after balance date which would render particulars included in the financial statements to be misleading.
OEH Annual Report 2014–15 85
1. Governance
2. Legislation and legal changes
3. Human resources
4. Funding and expenditure
The Chief Executive of OEH is accountable to the Minister for the effective strategic and operational performance of OEH. A transparent corporate governance framework supports the Chief Executive in discharging his responsibilities.
OEH’s governance arrangements are overseen by the Executive, who are responsible for ensuring the effective and efficient performance of the agency, providing the Chief Executive with strategic advice and ensuring that decisions are implemented.
OEH provides a variety of corporate, essential and shared services to the Environment and Heritage Portfolio agencies. Agencies in the portfolio are: the Environment Protection Authority; Centennial Park and Moore Park Trust; Heritage Council of NSW; Historic Houses Trust; Parramatta Park Trust; Royal Botanic Gardens and Domain Trust; Taronga Conservation Society Australia; Western Sydney Parklands Trust and the Jenolan Caves Reserve Trust. For more information please refer to the individual annual reports.
Information on OEH’s key corporate and essential services and governance functions also cover the Environmental Trust as the trust’s support staff is employed within OEH.
OEH is committed to complying with legislative requirements and NSW public sector policies and procedures. The organisation regularly reviews, updates and develops new policies to improve its governance and performance. All OEH policies and procedures are available on the OEH intranet.
OEH is proud to work with a number of boards and committees. A sample of these is provided below.
NPW Advisory Council
The National Parks and Wildlife (NPW) Advisory Council advises the Minister for the Environment on a range of topics - particularly those relating to the operation and management of parks and reserves. It has a particular role in considering representations received on draft plans of management.
The NSW Coastal Panel
The NSW Coastal Panel is a statutory authority under Part 2A of the Coastal Protection Act 1979, with membership comprising local government and public authority nominees. The panel’s role is to provide expert advice to the Minister administering the Act and to local councils. The Minister may also refer draft coastal zone management plans to the panel for review.
Under Division 25 of Part 3 of the Infrastructure State Environmental Planning Policy (SEPP), the Coastal Panel has statutory roles in relation to coastal protection works on the open coast or at the entrance to estuaries. In addition, public authorities proposing new works must notify the panel before carrying out these works and take the panel’s response into consideration. This role does not apply where the proposed works are in an area subject to a coastal zone management plan or in relation to emergency coastal protection works.
Aboriginal Cultural Heritage Advisory Committee
The Aboriginal Cultural Heritage Advisory Committee (ACHAC) was established under the NSW National Parks and Wildlife Act 1974 to advise the Minister for the Environment and the Chief Executive of the Office of Environment and Heritage (OEH) on any matter relating to identification, assessment and management of Aboriginal cultural heritage in NSW, including strategic advice on Plans of Management, heritage impact permit processes whether or not the matter has been referred to the ACHAC by the Minister or the Chief-Executive. The Committee was established in 2006.
Committee members have a broad range of knowledge, experience and understandings of Aboriginal culture and heritage management and its conservation. The members knowledge is unique as it comes from their own personal experiences of working on Country in their local communities. The membership reflects the diversity of the Aboriginal population of NSW and achieves a gender balance as an important component of the cultural
86 OEH Annual Report 2014–15
consistency of the committee. Membership includes nominees from the NSW Aboriginal Land Council (NSWALC), Heritage Council of NSW, NTSCORP Limited, members of Local Aboriginal Land Councils, Aboriginal Elders Groups, registered Aboriginal owners under the NSW Aboriginal Land Rights Act 1983 and
registered Native Title Claimants and or Holders.
The NSW Scientific Committee
The NSW Scientific Committee is established under the Threatened Species Conservation Act. It is an independent committee of scientists appointed by the Minister for the Environment. The committee's main functions include:
deciding which species should be listed as critically endangered, endangered, vulnerable or presumed extinct in NSW
deciding which populations should be listed as endangered in NSW
deciding which ecological communities should be listed as critically endangered, endangered or vulnerable
deciding which threats to native plants and animals should be declared key threatening processes under the Act
reviewing and updating the lists of threatened species, populations and communities and key threatening processes in the schedules of the Act.
The NSW Scientific Committee does not make decisions about threatened fish and marine plants. This is the responsibility of the NSW Fisheries Scientific Committee.
NPWS Aboriginal Joint Management Boards and Committees
The Office of Environment and Heritage (OEH) and the National Parks and Wildlife Service (NPWS) work with Aboriginal peoples; from across the State on a range of Aboriginal joint management and partnership agreements. These partnerships promote and support the continuation of the Aboriginal Peoples’ connections and access to their traditional lands and engage in the management of cultural landscapes known as Country.
The Chairpersons and representatives of the NSW NPWS Aboriginal Joint Management Boards and Committees are known as the Aboriginal Joint Management Custodians of NSW. The custodians meet regularly to exchange information, counsel and make recommendations to the OEH Chief Executive and the Minister for the Environment and Heritage on matters relating to the Aboriginal joint management of NSW national parks and reserves. The Aboriginal Joint Management Custodians of NSW are informed by and provide information to the broader network of Aboriginal communities involved in Aboriginal joint management of parks in NSW. NPWS Aboriginal Joint Management Boards and Committees are established under various formal and informal Aboriginal Joint Management agreements and its processes are outlined below:
Part 4A Aboriginal ownership and lease-back Boards of management
The National Parks and Wildlife Act 1974 and the Aboriginal Land Rights Act 1983 set up a process by which some parks can be listed on Schedule 14 of the NPW Act for return to a local Aboriginal land council to hold on behalf of the Aboriginal owners. The park can then leased back to the NSW Government under mutually agreed conditions, with the lease payments to be spent on the care, control and management of the park. A board of management cares for the park. The Aboriginal owners have a majority representation on the board, but there are also representatives of the NPWS, the Local Aboriginal Land Council/s, local government, a conservation group and adjoining landholders. The Part 4A Aboriginal ownership and lease-back Boards of management are:
Biamanga National Park Board of Management
Gaagal Wanggaan (South Beach) National Park Board of Management
Gulaga National Park Board of Management
Mt Grenfell Historic Site Board of Management
Mutawintji Board of Management
Worimi Board of Management.
Indigenous Land Use Agreement Advisory Committees
NSW Native title claimants and native title holders can negotiate an Aboriginal joint management partnership in the management of the national parks reserves covered by a native title claim with the NSW Government through an Indigenous Land Use Agreement (ILUA). An ILUA is a voluntary agreement between a native title claim group and other key stakeholders on the use and management of land, waters and its resources. NSW Native title claimants and holders can use an ILUA to negotiate and establish a joint management arrangement for a park with the NSW Government. ILUAs can establish an advisory committee to oversee Aboriginal joint management.
The Indigenous Land Use Agreement Advisory Committees are:
Arakwal National Park Joint Management Committee (Arakwal ILUA 1)
Byron Coast Area Management Committee (Arakwal ILUA 2)
Bundjalung Womens Committee - Ti Tree Lake ILUA (Arakwal ILUA 3)
Gundungurra Consultative Committee (Gundungurra ILUA).
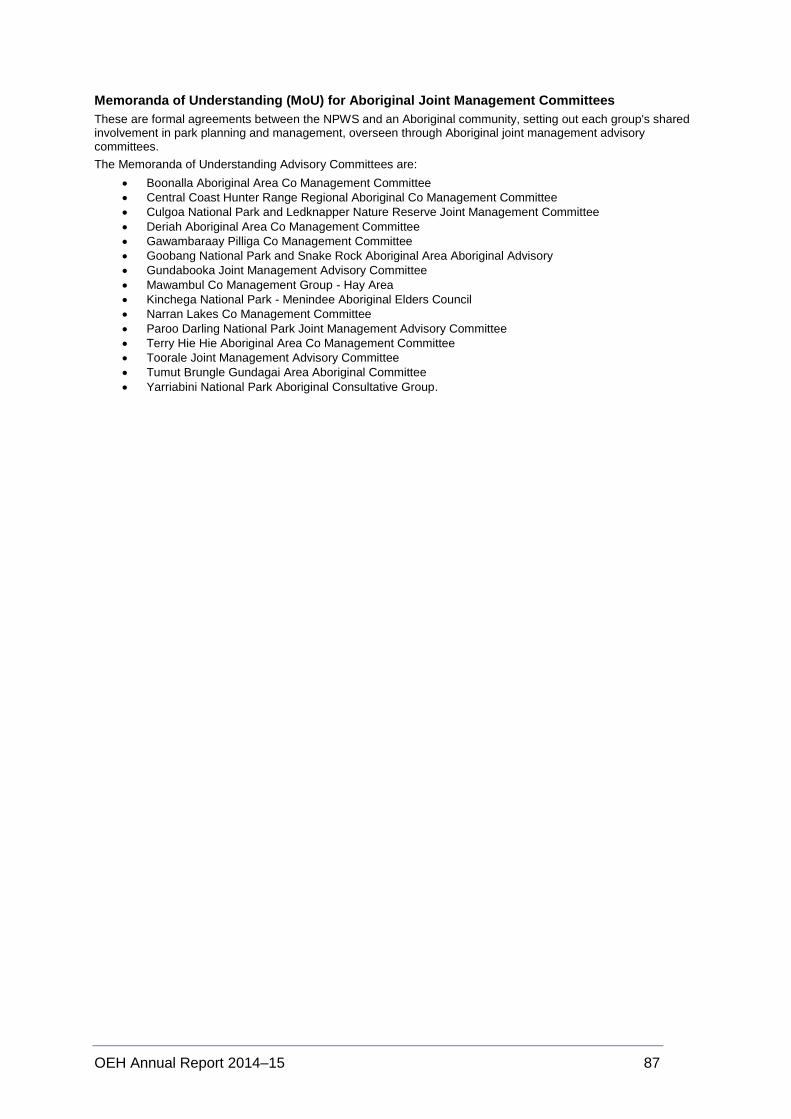
OEH Annual Report 2014–15 87
Memoranda of Understanding (MoU) for Aboriginal Joint Management Committees
These are formal agreements between the NPWS and an Aboriginal community, setting out each group's shared involvement in park planning and management, overseen through Aboriginal joint management advisory committees.
The Memoranda of Understanding Advisory Committees are:
Boonalla Aboriginal Area Co Management Committee
Central Coast Hunter Range Regional Aboriginal Co Management Committee
Culgoa National Park and Ledknapper Nature Reserve Joint Management Committee
Deriah Aboriginal Area Co Management Committee
Gawambaraay Pilliga Co Management Committee
Goobang National Park and Snake Rock Aboriginal Area Aboriginal Advisory
Gundabooka Joint Management Advisory Committee
Mawambul Co Management Group - Hay Area
Kinchega National Park - Menindee Aboriginal Elders Council
Narran Lakes Co Management Committee
Paroo Darling National Park Joint Management Advisory Committee
Terry Hie Hie Aboriginal Area Co Management Committee
Toorale Joint Management Advisory Committee
Tumut Brungle Gundagai Area Aboriginal Committee
Yarriabini National Park Aboriginal Consultative Group.
88 OEH Annual Report 2014–15
(as at 30 June 2015)
OEH has responsibilities, powers, duties and functions under legislation administered by the Minister for the Environment and the Minister for Heritage.
Brigalow and Nandewar Community Conservation Area Act 2005 No 56
Callan Park (Special Provisions) Act 2002 No 139 (from 29 May 2015 – previously administered by the
Minister for Planning)
Coastal Protection Act 1979 No 13 (administered by the Minister for Planning from 29 May 2015)
Energy and Utilities Administration Act 1987 No 103 Part 6A; section 40 (1A); and section 45 in so far
as it relates to Part 6A and to section 40 (1A)
Environmental Trust Act 1998 No 82
Filming Approval Act 2004 No 38
Forestry Restructuring and Nature Conservation Act 1995 No 50
Forestry Revocation and National Park Reservation Act 1996 No 131
Forestry Revocation and National Parks Reservation Act 1983 No 37
Forestry Revocation and National Parks Reservation Act 1984 No 85
Heritage Act 1977 No 136
Lane Cove National Park (Sugarloaf Point Additions) Act 1996 No 71
Local Government Act 1993 No 30, Part 2A of Chapter 6
Marine Estate Management Act 2014 No 72, jointly with the Minister for Primary Industries
National Park Estate (Land Transfers) Act 1998 No 163
National Park Estate (Lower Hunter Region Reservations) Act 2006 No 90
National Park Estate (Reservations) Act 2002 No 137
National Park Estate (Reservations) Act 2003 No 24
National Park Estate (Reservations) Act 2005 No 84
National Park Estate (Riverina Red Gum Reservations) Act 2010 No 22
National Park Estate (South-Western Cypress Reservations) Act 2010 No 112
National Park Estate (Southern Region Reservations) Act 2000 No 103
National Parks and Wildlife Act 1974 No 80
National Parks and Wildlife (Adjustment of Areas) Act 2005 No 27
Native Vegetation Act 2003 No 103
Nature Conservation Trust Act 2001 No 10
Soil Conservation Act 1938 No 10, Parts 2A, 3 and 4, and sections 15 and 30A in so far as they relate
to Parts 2A, 3 or 4, jointly with the Minister for Lands and Water
Threatened Species Conservation Act 1995 No 101
Wilderness Act 1987 No 196.
The following Act was assented to in 2014–15:
Marine Estate Management Act 2014 No 72.
The following regulation was made or re-made in 2014–15:
National Parks and Wildlife Amendment (Leases) Regulation 2014.
OEH administers the Threatened Species Conservation Act 1995, which aims to conserve biodiversity in NSW. During 2014-15:
Over $2.2 million was allocated to deliver threatened species projects through Saving Our Species. Individual species at risk of extinction were assisted through targeted projects. More information on Saving Our Species programs can be found on the OEH Website: http://www.environment.nsw.gov.au/savingourspecies/about.htm.
The NSW Government released the Flying-fox Camp Management Policy 2015 which empowers land managers, primarily local councils, to work with their communities to manage flying-fox camps effectively.
OEH Annual Report 2014–15 89
The NSW Government embarked on a project to reintroduce locally extinct mammals to national parks. During the year the government announced the Australian Wildlife Conservancy and the Wildlife Restoration and Management Partnership, led by the University of NSW, as the two successful partners on this project. The project will establish exclusion zones in NSW National Parks which are several thousand hectares in size and free of introduced predators so native species can flourish.
The Wilderness Act 1987 provides the legislative framework for the nomination, assessment, identification and
declaration of wilderness and its subsequent management. There are over two million hectares of declared wilderness in NSW, representing about 2.6 per cent of the state and 30 percent of all OEH reserves.
Wilderness protection is in a phase of consolidation. Wilderness is being added in locations where it will improve reserve management or in remote landscapes where incompatible activities will not be affected.
Two wilderness additions were declared by the Minister in 2014–15. The North Ettrema wilderness addition in Morton National Park (252 ha) protects a densely vegetated valley with old growth elements surrounded by steep sandstone cliffs. The Wollemi Wilderness addition incorporates a 24 ha inholding and consolidates the park boundary.
OEH seeks to expand opportunities for public enjoyment and appreciation of wilderness areas without compromising wilderness values. As a result, OEH continues to monitor the potential impacts of commercial tours in these areas. There are currently 9 commercial tour operators licenced for activities in 10 different wilderness areas. In 2014-15, 3 of these operators undertook activities in 5 wilderness areas.
Plans to increase public enjoyment and appreciation of wilderness areas also include a pilot program to trial horse riding in four locations, with a fifth planned. Usage and environmental effects are being monitored over two years. OEH is now half way through this study and the data collected to date will be publically available by December 2015.
OEH prosecutes offences under parks, wildlife, threatened species, native vegetation and Aboriginal heritage provisions. OEH Legal Services Division also supports the Environment Protection Authority (EPA) in its prosecution function.
OEH commenced 43 prosecutions in 2014–15. Of these, the 28 completed prosecutions resulted in:
27 convictions
1 acquittal.
The EPA commenced 50 prosecutions and completed 80 prosecutions in 2014-15. The 80 completed prosecutions resulted in 79 convictions, 1 matter where the offence was proved but a conviction was not recorded and no acquittals.
Details of prosecutions completed during 2014–15 are recorded below. Details of prosecutions completed under EPA legislation can be found in the EPA Annual Report Appendices.
LEC = Land and Environment Court
LC = Local Court
s.10 = Under section 10 of the Crimes (Sentencing Procedure) Act 1999 the Court, although finding the defendant guilty of the offences charged, did not record a conviction or impose a penalty.
Note: Unless otherwise stated, the dollar amount referred to in the Result/ Penalty column is a fine.
Prosecutions completed under parks, wildlife, threatened species, Aboriginal heritage and related legislation
Non-tier offences
Defendant Charge Result/penalty Court
National Parks and Wildlife Act 1974
Baker, Aaron Maxwell Possess threatened species $6,000 Port Kembla LC
Baker, Aaron Maxwell Breach licence condition $1,000 Port Kembla LC
Goo, Jerry Sell protected fauna Three months' imprisonment
Burwood LC
Goo, Jerry Possess protected fauna Three months' imprisonment
Burwood LC
Goo, Jerry Possess protected fauna Three months' imprisonment
Burwood LC
90 OEH Annual Report 2014–15
Defendant Charge Result/penalty Court
Mark Moore’s Earthmoving Pty Ltd
Damage reserved land $15,000 Coffs Harbour LC
Moras, Vicki Anne Damage reserved land Acquitted Coffs Harbour LC
Orica Australia Pty Ltd Damage reserved land $60,000 LEC
Salm, Dirk Damage reserved land $2,000
Ordered to build 15 artificial nest boxes by 1 October 2015
Port Macquarie LC
Vacik Distributors Pty Ltd Breach licence condition $1,000 Moree LC
Vacik Distributors Pty Ltd Breach licence condition $1,000 Moree LC
Vacik Distributors Pty Ltd Breach licence condition $1,000 Moree LC
Vacik Distributors Pty Ltd Breach licence condition $1,000 Moree LC
Vacik Distributors Pty Ltd Breach licence condition $1,000 Moree LC
Vacik Distributors Pty Ltd Breach licence condition $1,000 Moree LC
Vander Meulen, Joshua Dylan Punch
Discharge prohibited weapon in park
$3,000 Coffs Harbour LC
Vander Meulen, Joshua Dylan Punch
Harm an animal in park $3,000 Coffs Harbour LC
National Parks and Wildlife Regulation 2009
Assadi, Farid Park vehicle without valid pass displayed
$75 Sutherland LC
Ayish, Mahmoud Husam Park vehicle without valid pass displayed
$100 Manly LC
Dufty, Stewart Robert Conduct commercial activity in park
$800 Toronto LC
Jocic, Briona Bozica Park vehicle without valid pass displayed
$20 Sutherland LC
Prykaza, Matthew Drive vehicle otherwise than on an authorised road
$800 Port Kembla LC
Reitano, Douglas Brian Cut vegetation in the park $400 Griffith LC
Reitano, Douglas Brian Cut vegetation in the park $400 Griffith LC
Reitano, Douglas Brian Possess vegetation in park for removal
$400 Griffith LC
Reitano, Douglas Brian Possess vegetation in park for removal
$400 Griffith LC
Sedgwick, Bruce John Park vehicle without valid pass displayed
$200 Hornsby LC
Total prosecutions under parks wildlife, threatened species, Aboriginal heritage and related legislation
Fines $99,595
Other financial penalties $0
Total fines and other financial penalties $99,595
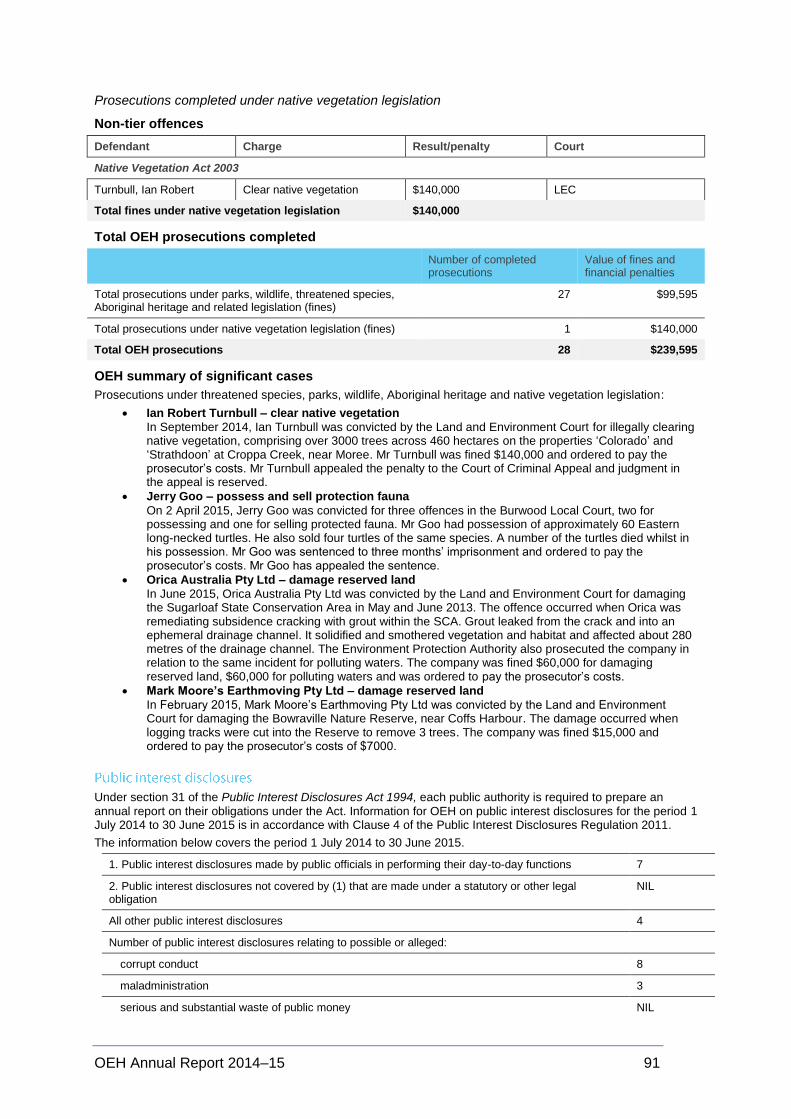
OEH Annual Report 2014–15 91
Prosecutions completed under native vegetation legislation
Non-tier offences
Defendant Charge Result/penalty Court
Native Vegetation Act 2003
Turnbull, Ian Robert Clear native vegetation $140,000 LEC
Total fines under native vegetation legislation $140,000
Total OEH prosecutions completed
Number of completed prosecutions
Value of fines and financial penalties
Total prosecutions under parks, wildlife, threatened species, Aboriginal heritage and related legislation (fines)
27 $99,595
Total prosecutions under native vegetation legislation (fines) 1 $140,000
Total OEH prosecutions 28 $239,595
OEH summary of significant cases
Prosecutions under threatened species, parks, wildlife, Aboriginal heritage and native vegetation legislation:
Ian Robert Turnbull – clear native vegetation
In September 2014, Ian Turnbull was convicted by the Land and Environment Court for illegally clearing native vegetation, comprising over 3000 trees across 460 hectares on the properties ‘Colorado’ and ‘Strathdoon’ at Croppa Creek, near Moree. Mr Turnbull was fined $140,000 and ordered to pay the prosecutor’s costs. Mr Turnbull appealed the penalty to the Court of Criminal Appeal and judgment in the appeal is reserved.
Jerry Goo – possess and sell protection fauna
On 2 April 2015, Jerry Goo was convicted for three offences in the Burwood Local Court, two for possessing and one for selling protected fauna. Mr Goo had possession of approximately 60 Eastern long-necked turtles. He also sold four turtles of the same species. A number of the turtles died whilst in his possession. Mr Goo was sentenced to three months’ imprisonment and ordered to pay the prosecutor’s costs. Mr Goo has appealed the sentence.
Orica Australia Pty Ltd – damage reserved land
In June 2015, Orica Australia Pty Ltd was convicted by the Land and Environment Court for damaging the Sugarloaf State Conservation Area in May and June 2013. The offence occurred when Orica was remediating subsidence cracking with grout within the SCA. Grout leaked from the crack and into an ephemeral drainage channel. It solidified and smothered vegetation and habitat and affected about 280 metres of the drainage channel. The Environment Protection Authority also prosecuted the company in relation to the same incident for polluting waters. The company was fined $60,000 for damaging reserved land, $60,000 for polluting waters and was ordered to pay the prosecutor’s costs.
Mark Moore’s Earthmoving Pty Ltd – damage reserved land
In February 2015, Mark Moore’s Earthmoving Pty Ltd was convicted by the Land and Environment Court for damaging the Bowraville Nature Reserve, near Coffs Harbour. The damage occurred when logging tracks were cut into the Reserve to remove 3 trees. The company was fined $15,000 and ordered to pay the prosecutor’s costs of $7000.
Under section 31 of the Public Interest Disclosures Act 1994, each public authority is required to prepare an
annual report on their obligations under the Act. Information for OEH on public interest disclosures for the period 1 July 2014 to 30 June 2015 is in accordance with Clause 4 of the Public Interest Disclosures Regulation 2011.
The information below covers the period 1 July 2014 to 30 June 2015.
1. Public interest disclosures made by public officials in performing their day-to-day functions 7
2. Public interest disclosures not covered by (1) that are made under a statutory or other legal obligation
NIL
All other public interest disclosures 4
Number of public interest disclosures relating to possible or alleged:
corrupt conduct 8
maladministration 3
serious and substantial waste of public money NIL

92 OEH Annual Report 2014–15
Total number of public interest disclosures received 11
Total number of public interest disclosures finalised 9
OEH has established an internal reporting policy which is consistent with the NSW Ombudsman’s model policy. OEH takes action to ensure that the staff awareness responsibilities under section 6E(1)(b) of the Public Interest Disclosures Act are met by providing links on the OEH intranet and staff attending NSW Ombudsman training.
Clause 6 of the Annual Reports (Departments) Regulation 2010 requires a statement of the action taken by OEH in complying with the requirements of the Privacy and Personal Information Protection Act 1998 (the PPIP Act), and statistical details of any review conducted by or on behalf of OEH under Part 5 of that Act.
OEH’s Privacy Management Plan and Guidelines which was reviewed this year, outlines how we comply with the principles of the PPIP Act and the Health Records and Information Privacy Act 2002.
The plan is published on OEH’s website:
www.environment.nsw.gov.au/resources/whoweare/150239privacy-plan.pdf
The updated Privacy Management Plan, which covers both OEH and the Environment Protection Authority, was announced at a morning tea event to launch and celebrate Privacy Awareness Week. The Privacy Commissioner attended this event and gave a presentation on privacy matters.
In the past 12 months, OEH received one concern about privacy; however, it did not proceed to a complaint or a request for an internal review under section 15 of the PPIP Act.
Review of proactive release program – Clause 7(a)
Under section 7 of the Government Information (Public Access) Act 2009 (GIPA Act), agencies must review their programs for the release of government information to identify the kinds of information that can be made publicly available. This review must be undertaken at least once every 12 months.
The OEH program for the proactive release of information requires each OEH division to look at information that has been informally released, information that has been formally requested under the GIPA Act as well as information held that may be of interest to members of the public that can be proactively released and made available for public use.
During the reporting period, each division reviewed their information as outlined above and provide details of what information has been proactively released and what has been considered suitable for future publication. OEH is also currently working on a proactive release framework to assist staff.
As a result of this review, information was proactively released on the OEH website. Below are a few examples:
Submissions made in response to the Phase 3 proposed Government model for reforming the Aboriginal
cultural heritage legislation www.environment.nsw.gov.au/achreform/ACHsubmission.htm
A case study of the Walgett Cluster PVP
www.environment.nsw.gov.au/resources/biodiversity/reviewsubmissions/WalgettClusterPVP1MB.pdf
Information about biodiversity www.environment.nsw.gov.au/biodivoffsets/index.htm
The ASDST (Aboriginal Sites Decision Support Tool) data was added to the OEH data portal mapdata.environment.nsw.gov.au/geonetwork/srv/en/main.home
Information about the Scientific Committee, its determinations and other related information
www.environment.nsw.gov.au/committee/AboutTheNSWScientificCommittee.htm
Details about native vegetation www.environment.nsw.gov.au/vegetation/vinfo.htm.
OEH regularly provides information with respect to environmental issues, climate change, nature conservation, culture and heritage, and provides opportunities for members of the public to take action www.environment.nsw.gov.au/action-matters.htm.
Adapt NSW website: www.climatechange.environment.nsw.gov.au. This website provides the public with easy access to the information on climate change held by OEH in response to a NSW 2021 commitment to develop fine-scale climate projections for NSW and make these available to the public. In addition, OEH has gone beyond the NSW 2021 commitment by also making the data used to develop the projections available, along with other climate change information.
A total of 97 metadata records were added to the OEH data catalogue: mapdata.environment.nsw.gov.au/geonetwork/
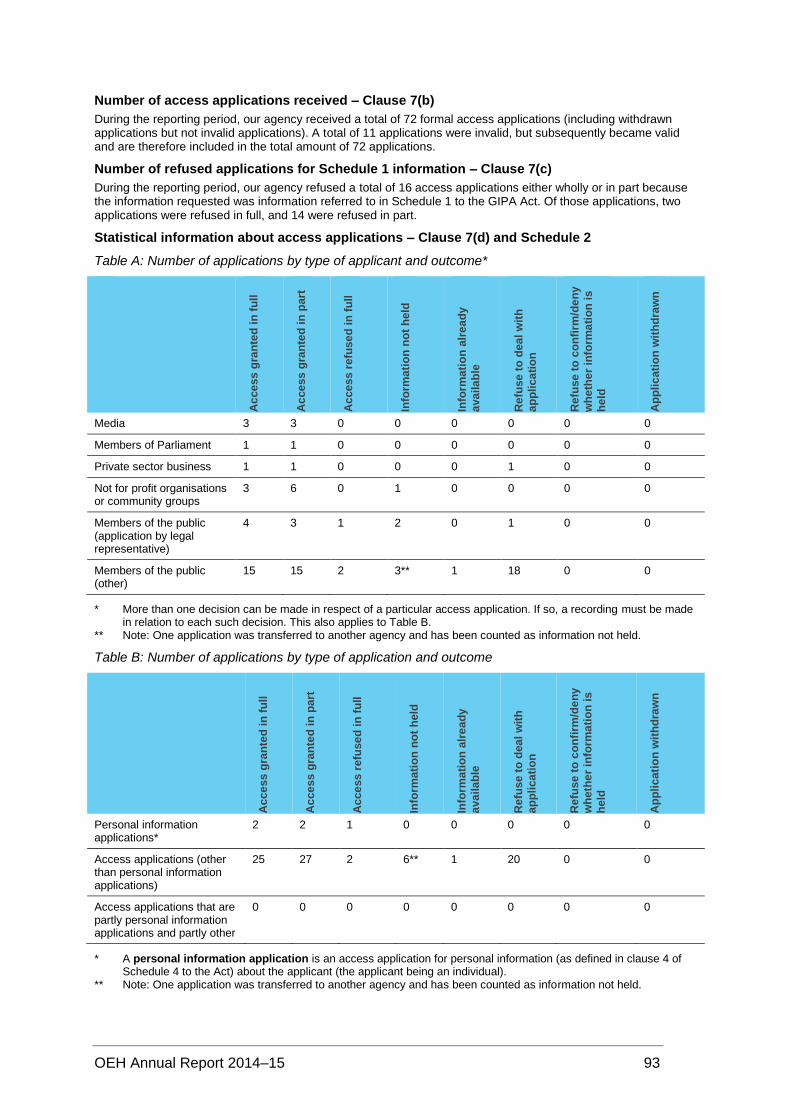
OEH Annual Report 2014–15 93
Number of access applications received – Clause 7(b)
During the reporting period, our agency received a total of 72 formal access applications (including withdrawn applications but not invalid applications). A total of 11 applications were invalid, but subsequently became valid and are therefore included in the total amount of 72 applications.
Number of refused applications for Schedule 1 information – Clause 7(c)
During the reporting period, our agency refused a total of 16 access applications either wholly or in part because the information requested was information referred to in Schedule 1 to the GIPA Act. Of those applications, two applications were refused in full, and 14 were refused in part.
Statistical information about access applications – Clause 7(d) and Schedule 2
Table A: Number of applications by type of applicant and outcome*
Ac
ce
ss
gra
nte
d i
n f
ull
Ac
ce
ss
gra
nte
d i
n p
art
Ac
ce
ss
refu
se
d i
n f
ull
Info
rmati
on
no
t h
eld
Info
rmati
on
alr
ea
dy
ava
ila
ble
Re
fuse
to
dea
l w
ith
ap
pli
ca
tio
n
Re
fuse
to
co
nfi
rm/d
en
y
wh
eth
er
info
rma
tio
n i
s
he
ld
Ap
pli
cati
on
wit
hd
raw
n
Media 3 3 0 0 0 0 0 0
Members of Parliament 1 1 0 0 0 0 0 0
Private sector business 1 1 0 0 0 1 0 0
Not for profit organisations or community groups
3 6 0 1 0 0 0 0
Members of the public (application by legal representative)
4 3 1 2 0 1 0 0
Members of the public (other)
15 15 2 3** 1 18 0 0
* More than one decision can be made in respect of a particular access application. If so, a recording must be made in relation to each such decision. This also applies to Table B.
** Note: One application was transferred to another agency and has been counted as information not held.
Table B: Number of applications by type of application and outcome
Ac
ce
ss
gra
nte
d i
n f
ull
Ac
ce
ss
gra
nte
d i
n p
art
Ac
ce
ss
refu
se
d i
n f
ull
Info
rmati
on
no
t h
eld
Info
rmati
on
alr
ea
dy
ava
ila
ble
Re
fuse
to
dea
l w
ith
ap
pli
ca
tio
n
Re
fuse
to
co
nfi
rm/d
en
y
wh
eth
er
info
rma
tio
n i
s
he
ld
Ap
pli
cati
on
wit
hd
raw
n
Personal information applications*
2 2 1 0 0 0 0 0
Access applications (other than personal information applications)
25 27 2 6** 1 20 0 0
Access applications that are partly personal information applications and partly other
0 0 0 0 0 0 0 0
* A personal information application is an access application for personal information (as defined in clause 4 of Schedule 4 to the Act) about the applicant (the applicant being an individual).
** Note: One application was transferred to another agency and has been counted as information not held.
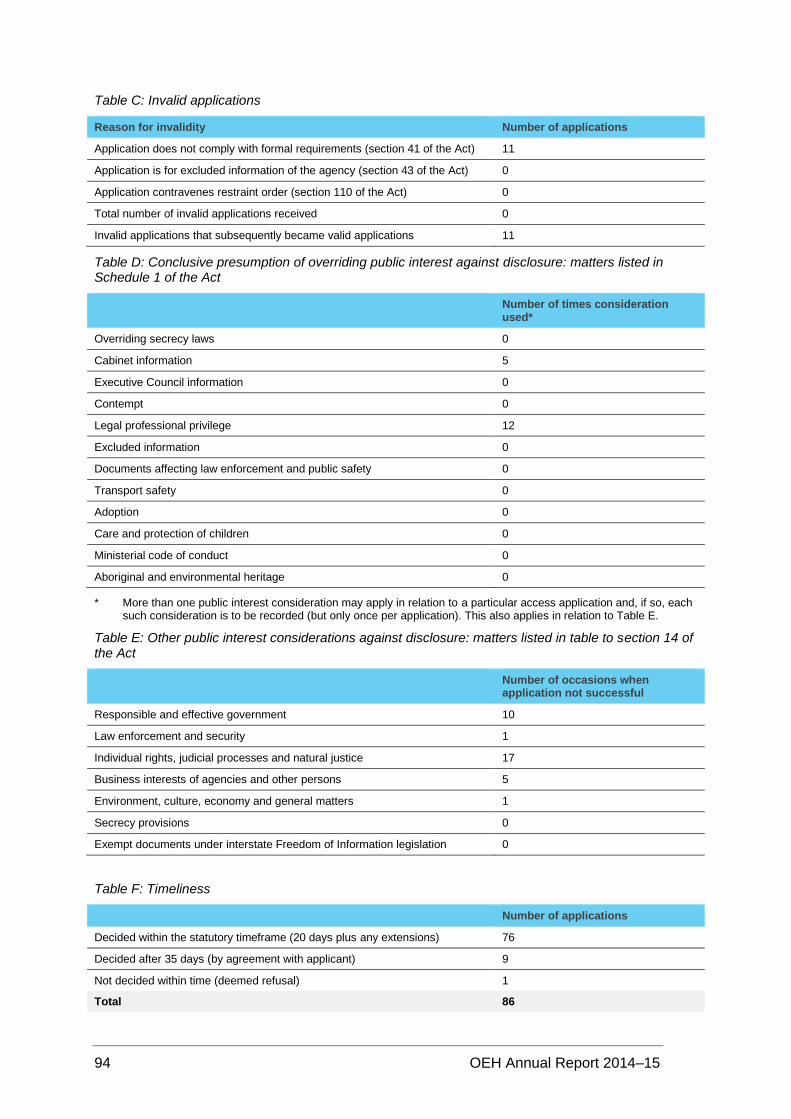
94 OEH Annual Report 2014–15
Table C: Invalid applications
Reason for invalidity Number of applications
Application does not comply with formal requirements (section 41 of the Act) 11
Application is for excluded information of the agency (section 43 of the Act) 0
Application contravenes restraint order (section 110 of the Act) 0
Total number of invalid applications received 0
Invalid applications that subsequently became valid applications 11
Table D: Conclusive presumption of overriding public interest against disclosure: matters listed in Schedule 1 of the Act
Number of times consideration used*
Overriding secrecy laws 0
Cabinet information 5
Executive Council information 0
Contempt 0
Legal professional privilege 12
Excluded information 0
Documents affecting law enforcement and public safety 0
Transport safety 0
Adoption 0
Care and protection of children 0
Ministerial code of conduct 0
Aboriginal and environmental heritage 0
* More than one public interest consideration may apply in relation to a particular access application and, if so, each such consideration is to be recorded (but only once per application). This also applies in relation to Table E.
Table E: Other public interest considerations against disclosure: matters listed in table to section 14 of the Act
Number of occasions when application not successful
Responsible and effective government 10
Law enforcement and security 1
Individual rights, judicial processes and natural justice 17
Business interests of agencies and other persons 5
Environment, culture, economy and general matters 1
Secrecy provisions 0
Exempt documents under interstate Freedom of Information legislation 0
Table F: Timeliness
Number of applications
Decided within the statutory timeframe (20 days plus any extensions) 76
Decided after 35 days (by agreement with applicant) 9
Not decided within time (deemed refusal) 1
Total 86
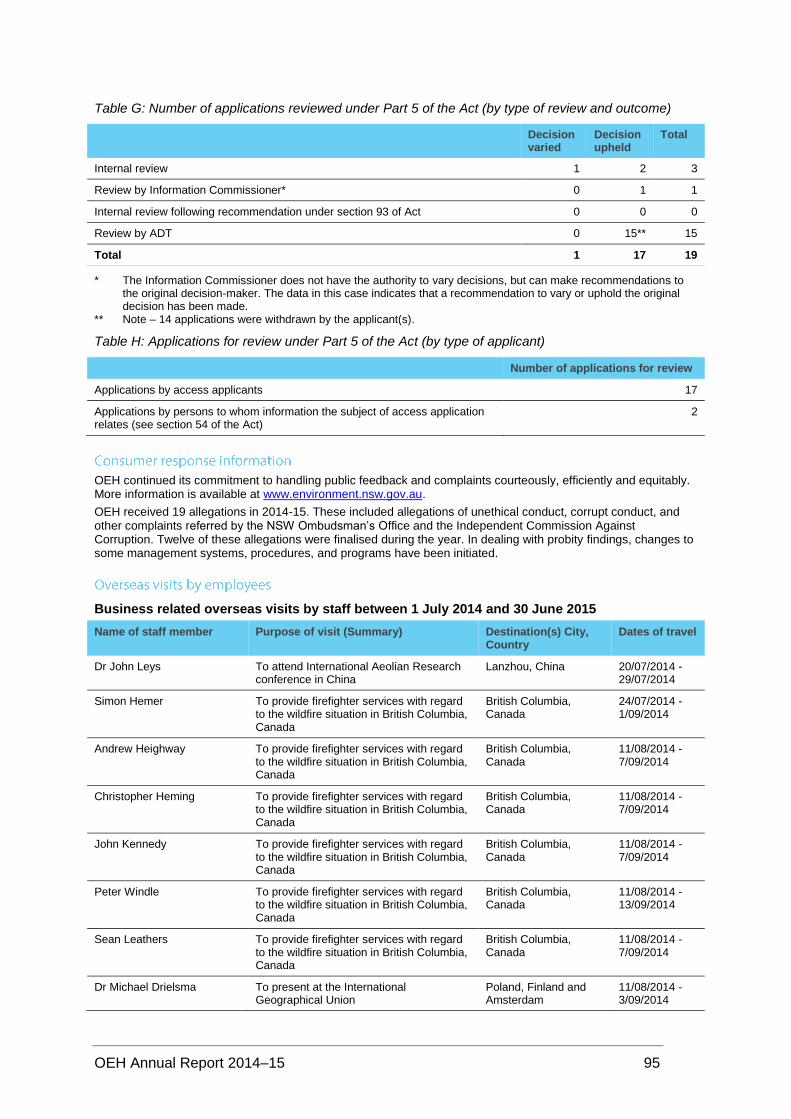
OEH Annual Report 2014–15 95
Table G: Number of applications reviewed under Part 5 of the Act (by type of review and outcome)
Decision varied
Decision upheld
Total
Internal review 1 2 3
Review by Information Commissioner* 0 1 1
Internal review following recommendation under section 93 of Act 0 0 0
Review by ADT 0 15** 15
Total 1 17 19
* The Information Commissioner does not have the authority to vary decisions, but can make recommendations to the original decision-maker. The data in this case indicates that a recommendation to vary or uphold the original decision has been made.
** Note – 14 applications were withdrawn by the applicant(s).
Table H: Applications for review under Part 5 of the Act (by type of applicant)
Number of applications for review
Applications by access applicants 17
Applications by persons to whom information the subject of access application relates (see section 54 of the Act)
2
OEH continued its commitment to handling public feedback and complaints courteously, efficiently and equitably. More information is available at www.environment.nsw.gov.au.
OEH received 19 allegations in 2014-15. These included allegations of unethical conduct, corrupt conduct, and other complaints referred by the NSW Ombudsman’s Office and the Independent Commission Against Corruption. Twelve of these allegations were finalised during the year. In dealing with probity findings, changes to some management systems, procedures, and programs have been initiated.
Business related overseas visits by staff between 1 July 2014 and 30 June 2015
Name of staff member Purpose of visit (Summary) Destination(s) City, Country
Dates of travel
Dr John Leys To attend International Aeolian Research conference in China
Lanzhou, China 20/07/2014 - 29/07/2014
Simon Hemer To provide firefighter services with regard to the wildfire situation in British Columbia, Canada
British Columbia, Canada
24/07/2014 - 1/09/2014
Andrew Heighway To provide firefighter services with regard to the wildfire situation in British Columbia, Canada
British Columbia, Canada
11/08/2014 - 7/09/2014
Christopher Heming To provide firefighter services with regard to the wildfire situation in British Columbia, Canada
British Columbia, Canada
11/08/2014 - 7/09/2014
John Kennedy To provide firefighter services with regard to the wildfire situation in British Columbia, Canada
British Columbia, Canada
11/08/2014 - 7/09/2014
Peter Windle To provide firefighter services with regard to the wildfire situation in British Columbia, Canada
British Columbia, Canada
11/08/2014 - 13/09/2014
Sean Leathers To provide firefighter services with regard to the wildfire situation in British Columbia, Canada
British Columbia, Canada
11/08/2014 - 7/09/2014
Dr Michael Drielsma To present at the International Geographical Union
Poland, Finland and Amsterdam
11/08/2014 - 3/09/2014
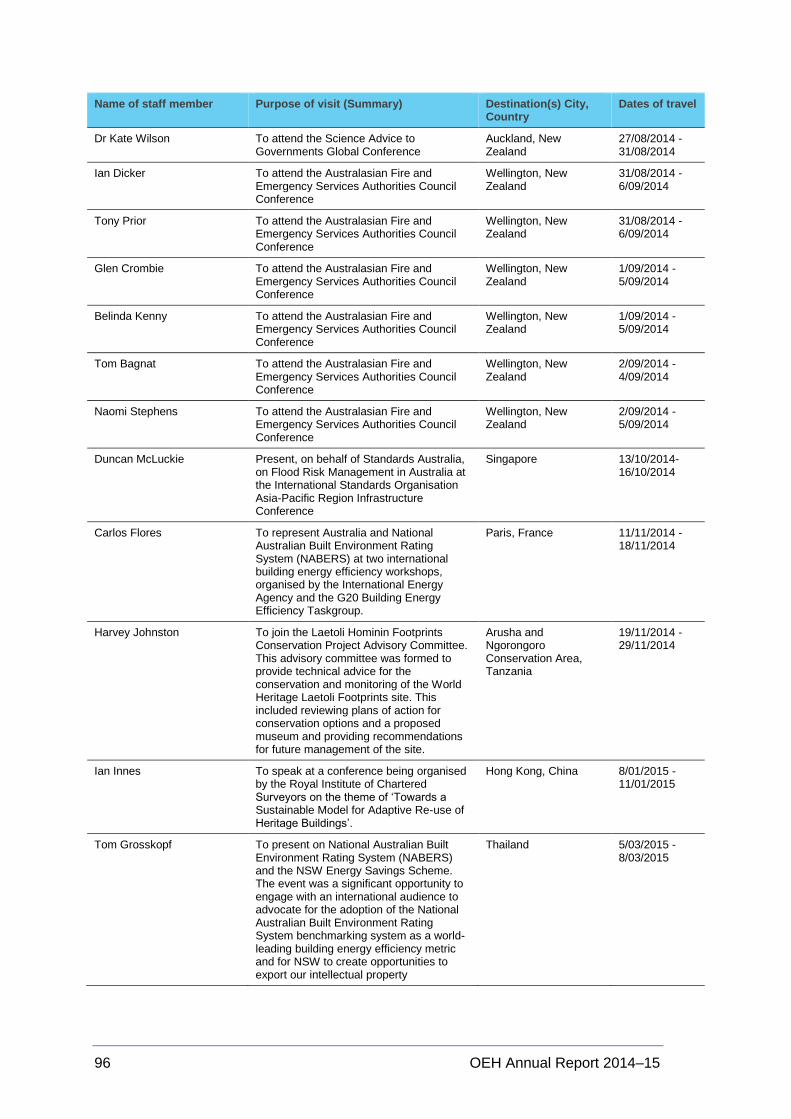
96 OEH Annual Report 2014–15
Name of staff member Purpose of visit (Summary) Destination(s) City, Country
Dates of travel
Dr Kate Wilson To attend the Science Advice to Governments Global Conference
Auckland, New Zealand
27/08/2014 - 31/08/2014
Ian Dicker To attend the Australasian Fire and Emergency Services Authorities Council Conference
Wellington, New Zealand
31/08/2014 - 6/09/2014
Tony Prior To attend the Australasian Fire and Emergency Services Authorities Council Conference
Wellington, New Zealand
31/08/2014 - 6/09/2014
Glen Crombie To attend the Australasian Fire and Emergency Services Authorities Council Conference
Wellington, New Zealand
1/09/2014 - 5/09/2014
Belinda Kenny To attend the Australasian Fire and Emergency Services Authorities Council Conference
Wellington, New Zealand
1/09/2014 - 5/09/2014
Tom Bagnat To attend the Australasian Fire and Emergency Services Authorities Council Conference
Wellington, New Zealand
2/09/2014 - 4/09/2014
Naomi Stephens To attend the Australasian Fire and Emergency Services Authorities Council Conference
Wellington, New Zealand
2/09/2014 - 5/09/2014
Duncan McLuckie Present, on behalf of Standards Australia, on Flood Risk Management in Australia at the International Standards Organisation Asia-Pacific Region Infrastructure Conference
Singapore 13/10/2014- 16/10/2014
Carlos Flores To represent Australia and National Australian Built Environment Rating System (NABERS) at two international building energy efficiency workshops, organised by the International Energy Agency and the G20 Building Energy Efficiency Taskgroup.
Paris, France 11/11/2014 - 18/11/2014
Harvey Johnston To join the Laetoli Hominin Footprints Conservation Project Advisory Committee. This advisory committee was formed to provide technical advice for the conservation and monitoring of the World Heritage Laetoli Footprints site. This included reviewing plans of action for conservation options and a proposed museum and providing recommendations for future management of the site.
Arusha and Ngorongoro Conservation Area, Tanzania
19/11/2014 - 29/11/2014
Ian Innes To speak at a conference being organised by the Royal Institute of Chartered Surveyors on the theme of ‘Towards a Sustainable Model for Adaptive Re-use of Heritage Buildings’.
Hong Kong, China 8/01/2015 - 11/01/2015
Tom Grosskopf To present on National Australian Built Environment Rating System (NABERS) and the NSW Energy Savings Scheme. The event was a significant opportunity to engage with an international audience to advocate for the adoption of the National Australian Built Environment Rating System benchmarking system as a world-leading building energy efficiency metric and for NSW to create opportunities to export our intellectual property
Thailand 5/03/2015 - 8/03/2015
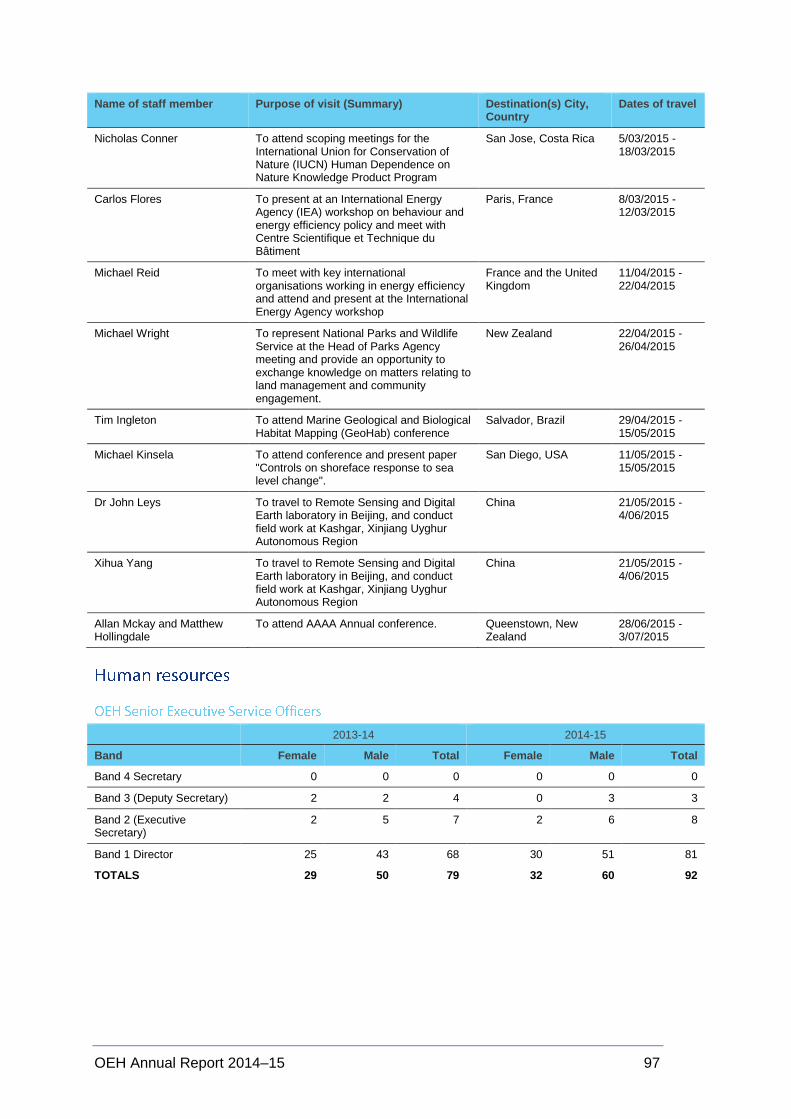
OEH Annual Report 2014–15 97
Name of staff member Purpose of visit (Summary) Destination(s) City, Country
Dates of travel
Nicholas Conner To attend scoping meetings for the International Union for Conservation of Nature (IUCN) Human Dependence on Nature Knowledge Product Program
San Jose, Costa Rica 5/03/2015 - 18/03/2015
Carlos Flores To present at an International Energy Agency (IEA) workshop on behaviour and energy efficiency policy and meet with Centre Scientifique et Technique du Bâtiment
Paris, France 8/03/2015 - 12/03/2015
Michael Reid To meet with key international organisations working in energy efficiency and attend and present at the International Energy Agency workshop
France and the United Kingdom
11/04/2015 - 22/04/2015
Michael Wright To represent National Parks and Wildlife Service at the Head of Parks Agency meeting and provide an opportunity to exchange knowledge on matters relating to land management and community engagement.
New Zealand 22/04/2015 - 26/04/2015
Tim Ingleton To attend Marine Geological and Biological Habitat Mapping (GeoHab) conference
Salvador, Brazil 29/04/2015 - 15/05/2015
Michael Kinsela To attend conference and present paper "Controls on shoreface response to sea level change".
San Diego, USA 11/05/2015 - 15/05/2015
Dr John Leys To travel to Remote Sensing and Digital Earth laboratory in Beijing, and conduct field work at Kashgar, Xinjiang Uyghur Autonomous Region
China 21/05/2015 - 4/06/2015
Xihua Yang To travel to Remote Sensing and Digital Earth laboratory in Beijing, and conduct field work at Kashgar, Xinjiang Uyghur Autonomous Region
China 21/05/2015 - 4/06/2015
Allan Mckay and Matthew Hollingdale
To attend AAAA Annual conference. Queenstown, New Zealand
28/06/2015 - 3/07/2015
2013-14 2014-15
Band Female Male Total Female Male Total
Band 4 Secretary 0 0 0 0 0 0
Band 3 (Deputy Secretary) 2 2 4 0 3 3
Band 2 (Executive Secretary)
2 5 7 2 6 8
Band 1 Director 25 43 68 30 51 81
TOTALS 29 50 79 32 60 92
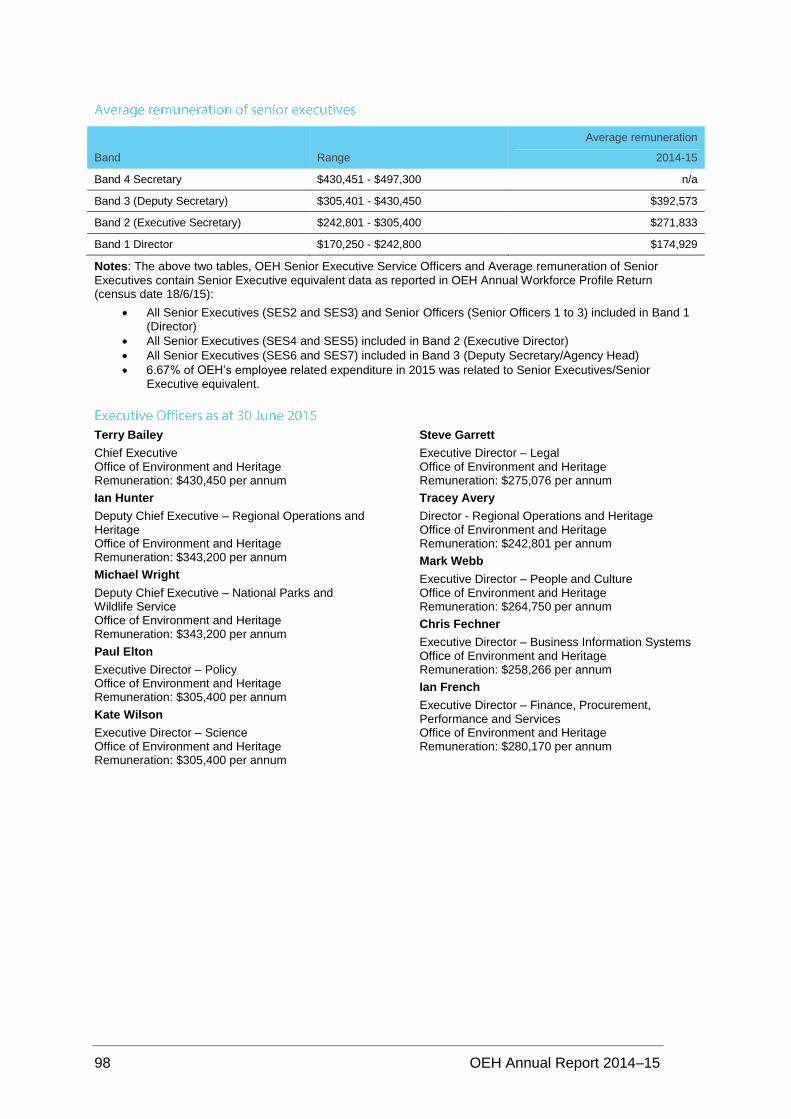
98 OEH Annual Report 2014–15
Band Range
Average remuneration
2014-15
Band 4 Secretary $430,451 - $497,300 n/a
Band 3 (Deputy Secretary) $305,401 - $430,450 $392,573
Band 2 (Executive Secretary) $242,801 - $305,400 $271,833
Band 1 Director $170,250 - $242,800 $174,929
Notes: The above two tables, OEH Senior Executive Service Officers and Average remuneration of Senior
Executives contain Senior Executive equivalent data as reported in OEH Annual Workforce Profile Return (census date 18/6/15):
All Senior Executives (SES2 and SES3) and Senior Officers (Senior Officers 1 to 3) included in Band 1 (Director)
All Senior Executives (SES4 and SES5) included in Band 2 (Executive Director)
All Senior Executives (SES6 and SES7) included in Band 3 (Deputy Secretary/Agency Head)
6.67% of OEH’s employee related expenditure in 2015 was related to Senior Executives/Senior Executive equivalent.
Terry Bailey
Chief Executive Office of Environment and Heritage Remuneration: $430,450 per annum
Ian Hunter
Deputy Chief Executive – Regional Operations and Heritage Office of Environment and Heritage Remuneration: $343,200 per annum
Michael Wright
Deputy Chief Executive – National Parks and Wildlife Service Office of Environment and Heritage Remuneration: $343,200 per annum
Paul Elton
Executive Director – Policy Office of Environment and Heritage Remuneration: $305,400 per annum
Kate Wilson
Executive Director – Science Office of Environment and Heritage Remuneration: $305,400 per annum
Steve Garrett
Executive Director – Legal Office of Environment and Heritage Remuneration: $275,076 per annum
Tracey Avery
Director - Regional Operations and Heritage Office of Environment and Heritage Remuneration: $242,801 per annum
Mark Webb
Executive Director – People and Culture Office of Environment and Heritage Remuneration: $264,750 per annum
Chris Fechner
Executive Director – Business Information Systems Office of Environment and Heritage Remuneration: $258,266 per annum
Ian French
Executive Director – Finance, Procurement, Performance and Services Office of Environment and Heritage Remuneration: $280,170 per annum
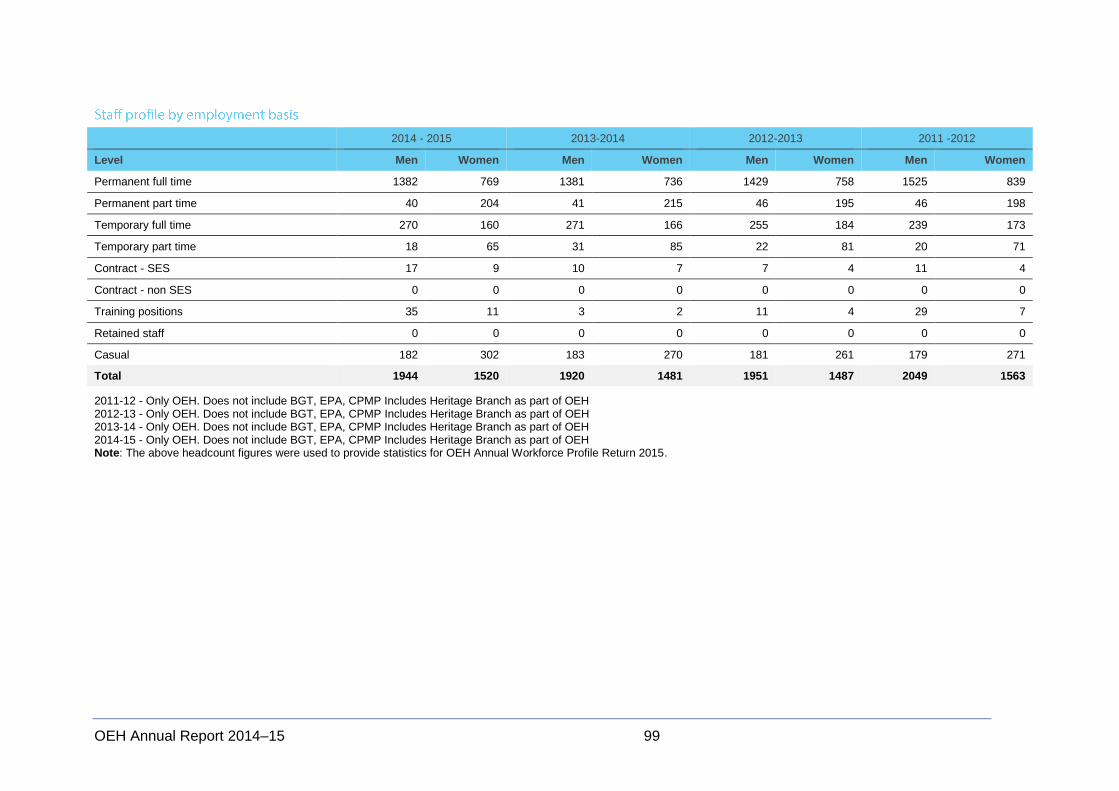
OEH Annual Report 2014–15 99
2014 - 2015 2013-2014 2012-2013 2011 -2012
Level Men Women Men Women Men Women Men Women
Permanent full time 1382 769 1381 736 1429 758 1525 839
Permanent part time 40 204 41 215 46 195 46 198
Temporary full time 270 160 271 166 255 184 239 173
Temporary part time 18 65 31 85 22 81 20 71
Contract - SES 17 9 10 7 7 4 11 4
Contract - non SES 0 0 0 0 0 0 0 0
Training positions 35 11 3 2 11 4 29 7
Retained staff 0 0 0 0 0 0 0 0
Casual 182 302 183 270 181 261 179 271
Total 1944 1520 1920 1481 1951 1487 2049 1563
2011-12 - Only OEH. Does not include BGT, EPA, CPMP Includes Heritage Branch as part of OEH 2012-13 - Only OEH. Does not include BGT, EPA, CPMP Includes Heritage Branch as part of OEH 2013-14 - Only OEH. Does not include BGT, EPA, CPMP Includes Heritage Branch as part of OEH 2014-15 - Only OEH. Does not include BGT, EPA, CPMP Includes Heritage Branch as part of OEH Note: The above headcount figures were used to provide statistics for OEH Annual Workforce Profile Return 2015.
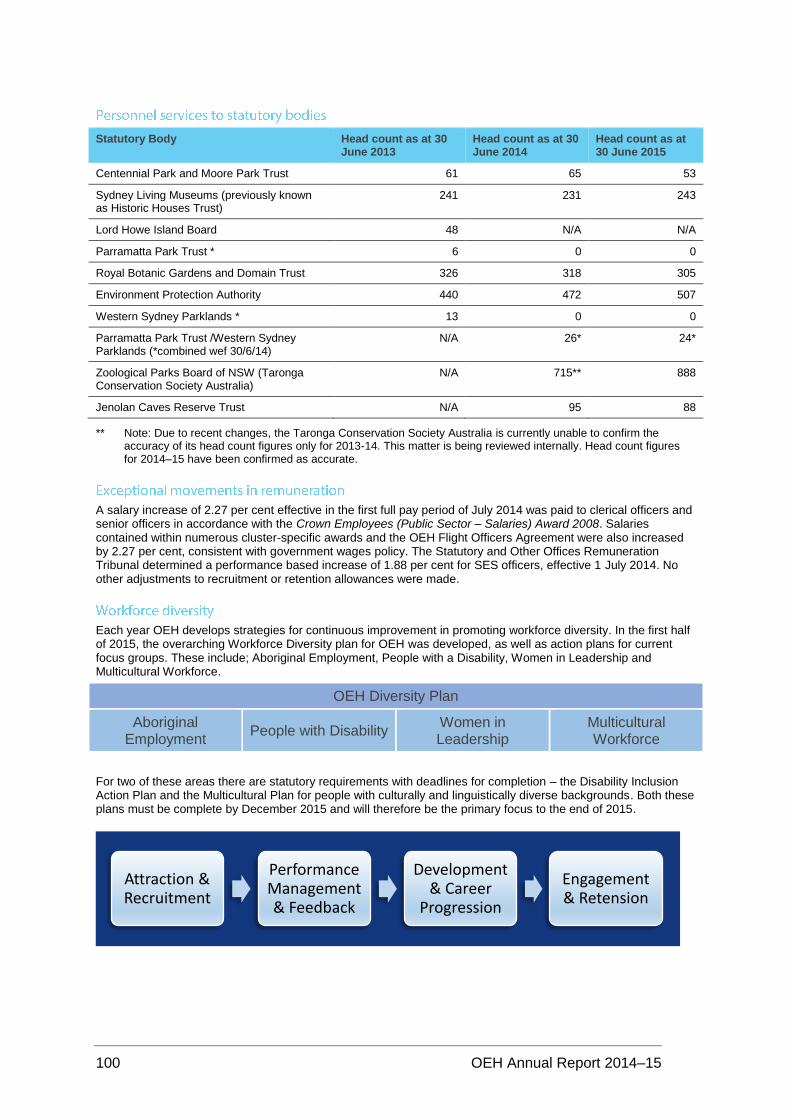
100 OEH Annual Report 2014–15
Statutory Body Head count as at 30 June 2013
Head count as at 30 June 2014
Head count as at 30 June 2015
Centennial Park and Moore Park Trust 61 65 53
Sydney Living Museums (previously known as Historic Houses Trust)
241 231 243
Lord Howe Island Board 48 N/A N/A
Parramatta Park Trust * 6 0 0
Royal Botanic Gardens and Domain Trust 326 318 305
Environment Protection Authority 440 472 507
Western Sydney Parklands * 13 0 0
Parramatta Park Trust /Western Sydney Parklands (*combined wef 30/6/14)
N/A 26* 24*
Zoological Parks Board of NSW (Taronga Conservation Society Australia)
N/A 715** 888
Jenolan Caves Reserve Trust N/A 95 88
** Note: Due to recent changes, the Taronga Conservation Society Australia is currently unable to confirm the accuracy of its head count figures only for 2013-14. This matter is being reviewed internally. Head count figures for 2014–15 have been confirmed as accurate.
A salary increase of 2.27 per cent effective in the first full pay period of July 2014 was paid to clerical officers and senior officers in accordance with the Crown Employees (Public Sector – Salaries) Award 2008. Salaries contained within numerous cluster-specific awards and the OEH Flight Officers Agreement were also increased by 2.27 per cent, consistent with government wages policy. The Statutory and Other Offices Remuneration Tribunal determined a performance based increase of 1.88 per cent for SES officers, effective 1 July 2014. No other adjustments to recruitment or retention allowances were made.
Each year OEH develops strategies for continuous improvement in promoting workforce diversity. In the first half of 2015, the overarching Workforce Diversity plan for OEH was developed, as well as action plans for current focus groups. These include; Aboriginal Employment, People with a Disability, Women in Leadership and Multicultural Workforce.
OEH Diversity Plan
Aboriginal Employment
People with Disability Women in Leadership
Multicultural Workforce
For two of these areas there are statutory requirements with deadlines for completion – the Disability Inclusion Action Plan and the Multicultural Plan for people with culturally and linguistically diverse backgrounds. Both these plans must be complete by December 2015 and will therefore be the primary focus to the end of 2015.
Attraction & Recruitment
Performance Management & Feedback
Development & Career
Progression
Engagement & Retension
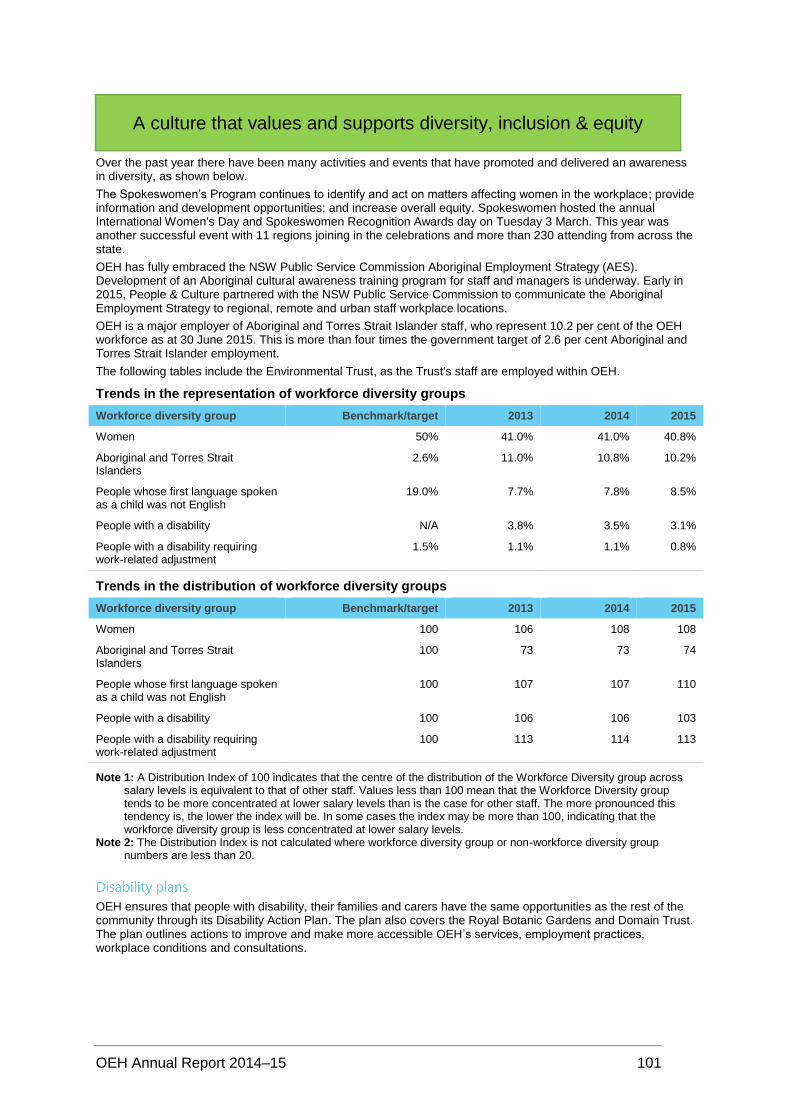
OEH Annual Report 2014–15 101
A culture that values and supports diversity, inclusion & equity
Over the past year there have been many activities and events that have promoted and delivered an awareness in diversity, as shown below.
The Spokeswomen’s Program continues to identify and act on matters affecting women in the workplace; provide information and development opportunities; and increase overall equity. Spokeswomen hosted the annual International Women's Day and Spokeswomen Recognition Awards day on Tuesday 3 March. This year was another successful event with 11 regions joining in the celebrations and more than 230 attending from across the state.
OEH has fully embraced the NSW Public Service Commission Aboriginal Employment Strategy (AES). Development of an Aboriginal cultural awareness training program for staff and managers is underway. Early in 2015, People & Culture partnered with the NSW Public Service Commission to communicate the Aboriginal Employment Strategy to regional, remote and urban staff workplace locations.
OEH is a major employer of Aboriginal and Torres Strait Islander staff, who represent 10.2 per cent of the OEH workforce as at 30 June 2015. This is more than four times the government target of 2.6 per cent Aboriginal and Torres Strait Islander employment.
The following tables include the Environmental Trust, as the Trust's staff are employed within OEH.
Trends in the representation of workforce diversity groups
Workforce diversity group Benchmark/target 2013 2014 2015
Women 50% 41.0% 41.0% 40.8%
Aboriginal and Torres Strait Islanders
2.6% 11.0% 10.8% 10.2%
People whose first language spoken as a child was not English
19.0% 7.7% 7.8% 8.5%
People with a disability N/A 3.8% 3.5% 3.1%
People with a disability requiring work-related adjustment
1.5% 1.1% 1.1% 0.8%
Trends in the distribution of workforce diversity groups
Workforce diversity group Benchmark/target 2013 2014 2015
Women 100 106 108 108
Aboriginal and Torres Strait Islanders
100 73 73 74
People whose first language spoken as a child was not English
100 107 107 110
People with a disability 100 106 106 103
People with a disability requiring work-related adjustment
100 113 114 113
Note 1: A Distribution Index of 100 indicates that the centre of the distribution of the Workforce Diversity group across salary levels is equivalent to that of other staff. Values less than 100 mean that the Workforce Diversity group tends to be more concentrated at lower salary levels than is the case for other staff. The more pronounced this tendency is, the lower the index will be. In some cases the index may be more than 100, indicating that the workforce diversity group is less concentrated at lower salary levels.
Note 2: The Distribution Index is not calculated where workforce diversity group or non-workforce diversity group numbers are less than 20.
OEH ensures that people with disability, their families and carers have the same opportunities as the rest of the community through its Disability Action Plan. The plan also covers the Royal Botanic Gardens and Domain Trust. The plan outlines actions to improve and make more accessible OEH’s services, employment practices, workplace conditions and consultations.
102 OEH Annual Report 2014–15
The Disability Inclusion Act 2014 requires NSW public authorities to develop new Disability Inclusion Action Plans by December 2015. The OEH Disability Inclusion Action Plan is currently being developed. It will have four focus areas:
- developing positive community attitudes and behaviours - creating liveable communities - supporting access to meaningful employment - improving access to mainstream services through better systems and processes.
OEH’s strategies, programs and actions align with whole-of-government multicultural policies and services programs.
Through the Our Place Program, OEH partnered with six community organisations that had strong relationships with Culturally and Linguistically Diverse (CALD) communities in Western Sydney and the Illawarra. The grants program helped these partners to introduce the topic of sustainability to their existing CALD stakeholders. The program used a community-led approach through a co-design introductory workshop that helped OEH understand barriers and needs specific to CALD community engagement with sustainability. This formed the framework for the Our Place support program. In 2015, initiatives supported by the Our Place grants included: education excursions for school children; values-based workshops and activities for residents and integration programs for new migrants including food gardens that strengthen community participation and multicultural harmony.
In 2014, The Home Power Savings Program (HPSP) won the Premier’s Award for Strengthening the Environment and Communities. One of the Program’s successes was exceeding CALD targets and reaching over 30,000 CALD households. HPSP used a range of approaches to ensure that there was engagement and participation from the CALD communities across NSW including the development of multilingual collateral and employing multilingual assessors. The most effective and innovative approach was partnering with MTC Training Solutions who ran 17 English language classes that focused on energy efficiency for people from various cultural backgrounds. Through this approach over 1,500 sign-ups were generated for the program. The program also delivered a tailored Aboriginal Community Project through partnering with Murdi Paaki Regional Enterprise Corporation (MPREC) in the very remote parts of North-West NSW, allowing access to the program for residents in those communities. In working with MPREC, OEH gained valuable insights into the specific needs of those householders and were able to tailor the program offering to suit those needs by training Aboriginal energy experts, marketing and delivering the program in partnership with a trusted local organisation, and by offering additional out of the home services such as community education workshops. The project improved the HPSP’s reach to Aboriginal households significantly.
Trainee Field Officers were recruited to provide young Australians from diverse backgrounds the opportunity to pursue a career with OEH. This included a number of Aboriginal identified positions being filled in national parks.
The NPWS volunteering programs are promoted across all of NSW communities. The recently introduced Nature Nomads program encourages tourists and retirees to engage in environmental volunteering while traveling.
OEH continued to provide translated materials for programs and services, and access to translator services on its Environmental Line.
In the forthcoming year, OEH will be working with Multicultural NSW to develop a new Multicultural plan. It will outline the ways OEH conducts its business within a culturally, linguistically and religiously diverse society.
A number of Aboriginal employment and development initiatives were successfully implemented in 2014-15. These actions align with and support the NSW Public Service Commission (PSC) Aboriginal Employment Strategy outcome to improve the distribution of Aboriginal employees across all classifications. Initiatives include:
Sponsorship of the Aboriginal Network regional gatherings held in Depot Beach, Bonville, Mungo and Myuna Bay. The Aboriginal Network is an initiative originally established in 1984 by National Parks and Wildlife Service (NPWS) to support Aboriginal Staff. The network brings a readily accessible Aboriginal perspective to the development of the full range of OEH policies, services and programs. Aboriginal Network gatherings provide an opportunity for Aboriginal staff to exchange ideas, express their views and raise concerns.
David Nalder, Area Manager NPWS was selected and sponsored to attend the NSW PSC Aboriginal Career and Leadership Development Program. The program is specifically designed to facilitate career and leadership development for Aboriginal and Torres Strait Islander NSW Public Sector employees who aspire to leadership roles. The program is delivered by the Australian Graduate School of Management (AGSM) in collaboration with the PSC.
Two Aboriginal staff attended the Annual National Indigenous Career Advancement Forum.
Ten Aboriginal staff attended the PSC Aboriginal Youth Leadership Network Forum in May 2015.
OEH Annual Report 2014–15 103
During 2014–15, ten Aboriginal trainees commenced employment under the NPWS Field Officer Traineeship Program. During this two-year program trainees complete a Certificate III in Conservation and Land Management.
During 2014-15, two Aboriginal Trainee Field Officers and one Aboriginal Trainee Interpretive Assistant graduated from the traineeship program.
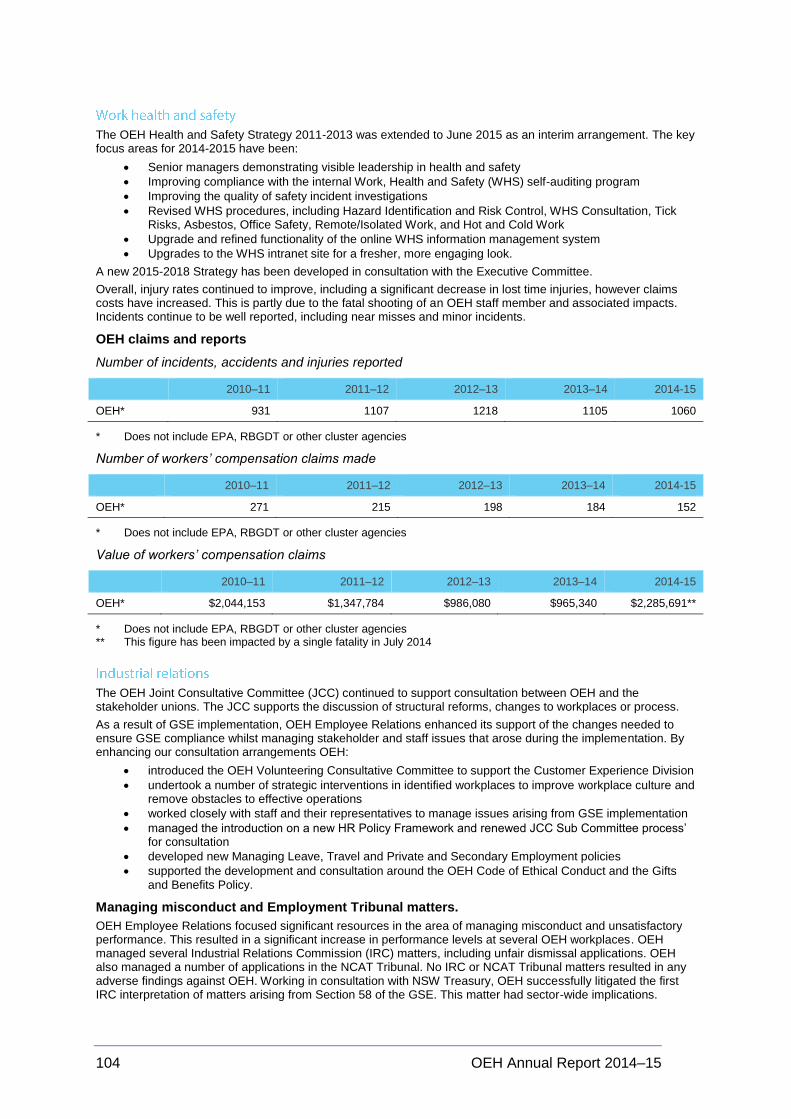
104 OEH Annual Report 2014–15
The OEH Health and Safety Strategy 2011-2013 was extended to June 2015 as an interim arrangement. The key focus areas for 2014-2015 have been:
Senior managers demonstrating visible leadership in health and safety
Improving compliance with the internal Work, Health and Safety (WHS) self-auditing program
Improving the quality of safety incident investigations
Revised WHS procedures, including Hazard Identification and Risk Control, WHS Consultation, Tick Risks, Asbestos, Office Safety, Remote/Isolated Work, and Hot and Cold Work
Upgrade and refined functionality of the online WHS information management system
Upgrades to the WHS intranet site for a fresher, more engaging look.
A new 2015-2018 Strategy has been developed in consultation with the Executive Committee.
Overall, injury rates continued to improve, including a significant decrease in lost time injuries, however claims costs have increased. This is partly due to the fatal shooting of an OEH staff member and associated impacts. Incidents continue to be well reported, including near misses and minor incidents.
OEH claims and reports
Number of incidents, accidents and injuries reported
2010–11 2011–12 2012–13 2013–14 2014-15
OEH* 931 1107 1218 1105 1060
* Does not include EPA, RBGDT or other cluster agencies
Number of workers’ compensation claims made
2010–11 2011–12 2012–13 2013–14 2014-15
OEH* 271 215 198 184 152
* Does not include EPA, RBGDT or other cluster agencies
Value of workers’ compensation claims
2010–11 2011–12 2012–13 2013–14 2014-15
OEH* $2,044,153 $1,347,784 $986,080 $965,340 $2,285,691**
* Does not include EPA, RBGDT or other cluster agencies ** This figure has been impacted by a single fatality in July 2014
The OEH Joint Consultative Committee (JCC) continued to support consultation between OEH and the stakeholder unions. The JCC supports the discussion of structural reforms, changes to workplaces or process.
As a result of GSE implementation, OEH Employee Relations enhanced its support of the changes needed to ensure GSE compliance whilst managing stakeholder and staff issues that arose during the implementation. By enhancing our consultation arrangements OEH:
introduced the OEH Volunteering Consultative Committee to support the Customer Experience Division
undertook a number of strategic interventions in identified workplaces to improve workplace culture and remove obstacles to effective operations
worked closely with staff and their representatives to manage issues arising from GSE implementation
managed the introduction on a new HR Policy Framework and renewed JCC Sub Committee process’ for consultation
developed new Managing Leave, Travel and Private and Secondary Employment policies
supported the development and consultation around the OEH Code of Ethical Conduct and the Gifts and Benefits Policy.
Managing misconduct and Employment Tribunal matters.
OEH Employee Relations focused significant resources in the area of managing misconduct and unsatisfactory performance. This resulted in a significant increase in performance levels at several OEH workplaces. OEH managed several Industrial Relations Commission (IRC) matters, including unfair dismissal applications. OEH also managed a number of applications in the NCAT Tribunal. No IRC or NCAT Tribunal matters resulted in any adverse findings against OEH. Working in consultation with NSW Treasury, OEH successfully litigated the first IRC interpretation of matters arising from Section 58 of the GSE. This matter had sector-wide implications.
OEH Annual Report 2014–15 105
Trust specific projects
OEH has continued to support the implementation of the Royal Botanic Gardens and Domain Trust operational integration with the Centennial Park Moore Park Trust. OEH also supported significant workplace reforms in the Jenolan Caves Reserve Trust (JCRT). This resulted in a significant gain in JCRT Trust returns on visitation to the area. OEH also achieved large excess labour cost reductions by implementing GSE compliant work practices. This activity included managing staff and stakeholder relationships.
OEH continued to provide support to Taronga Conservation Society Australia in IRC matters and in providing support in the area of managing stakeholder relationships.
Workplace grievances
OEH continues to use its Respectful Workplace Policy as the primary process for resolving workplace
grievances.
This section is now reported under the heading ‘Multicultural Policies and Services’, reflecting establishment of the NSW government agency Multicultural NSW.
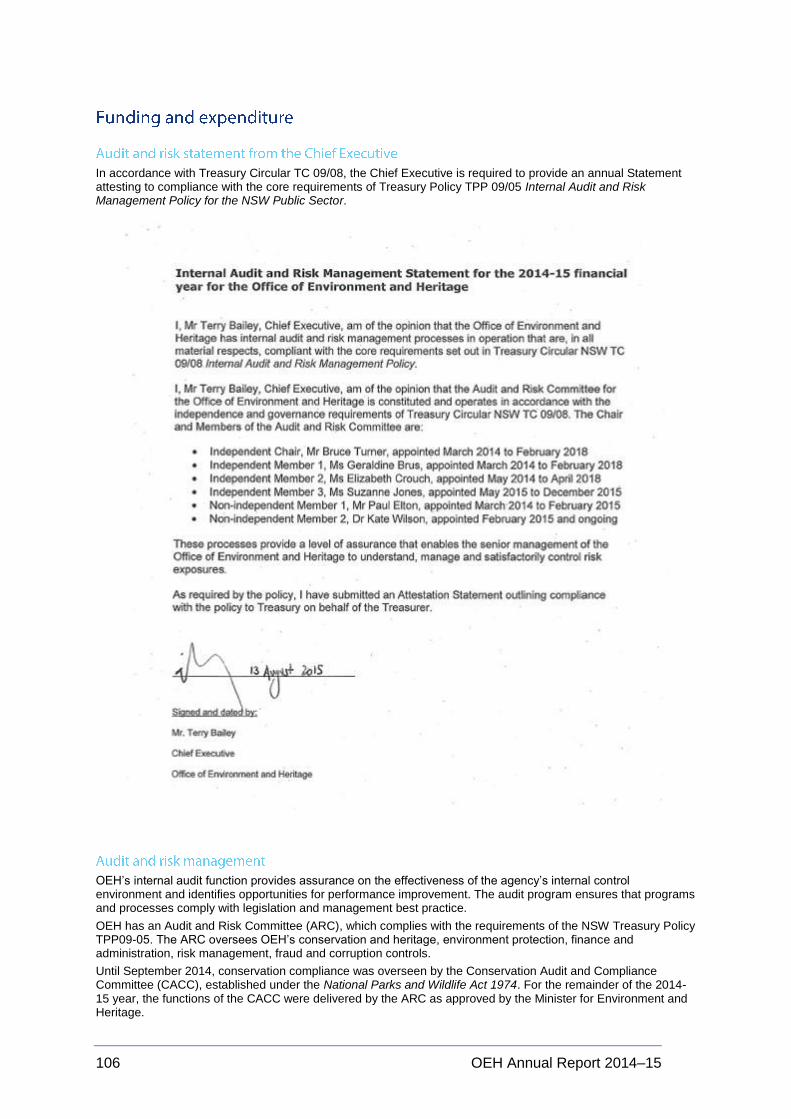
106 OEH Annual Report 2014–15
In accordance with Treasury Circular TC 09/08, the Chief Executive is required to provide an annual Statement attesting to compliance with the core requirements of Treasury Policy TPP 09/05 Internal Audit and Risk Management Policy for the NSW Public Sector.
OEH’s internal audit function provides assurance on the effectiveness of the agency’s internal control environment and identifies opportunities for performance improvement. The audit program ensures that programs and processes comply with legislation and management best practice.
OEH has an Audit and Risk Committee (ARC), which complies with the requirements of the NSW Treasury Policy TPP09-05. The ARC oversees OEH’s conservation and heritage, environment protection, finance and administration, risk management, fraud and corruption controls.
Until September 2014, conservation compliance was overseen by the Conservation Audit and Compliance Committee (CACC), established under the National Parks and Wildlife Act 1974. For the remainder of the 2014-15 year, the functions of the CACC were delivered by the ARC as approved by the Minister for Environment and Heritage.

OEH Annual Report 2014–15 107
The ARC meets quarterly and officers from the Audit Office of NSW regularly attend meetings as observers.
The audit function is managed by the Chief Audit Executive (CAE). Internal audit reports are submitted through the CAE to the ARC and, until September 2014, the CACC. Report recommendations are monitored to ensure they are fully implemented. The internal audit provision for 2014–15 was outsourced to IAB Services.
From 1 July 2014 to 30 June 2015, seven audits were undertaken. These audits found that operation and administrative systems were largely sound and no areas were identified with extreme risk ratings. Areas identified as having a high risk rating are controlled through the implementation of agreed recommendations, which are monitored by the ARC.
No significant matters were raised for OEH in the ongoing audit reports or external reviews for 2014–15.
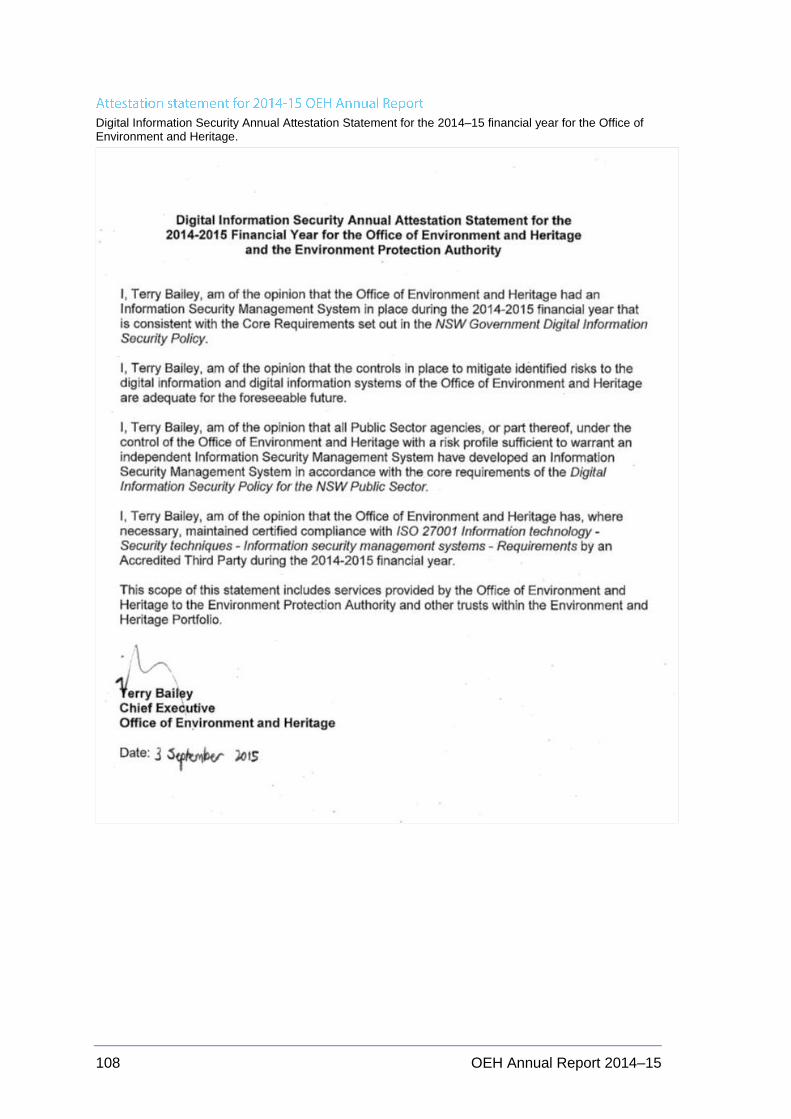
108 OEH Annual Report 2014–15
Digital Information Security Annual Attestation Statement for the 2014–15 financial year for the Office of Environment and Heritage.
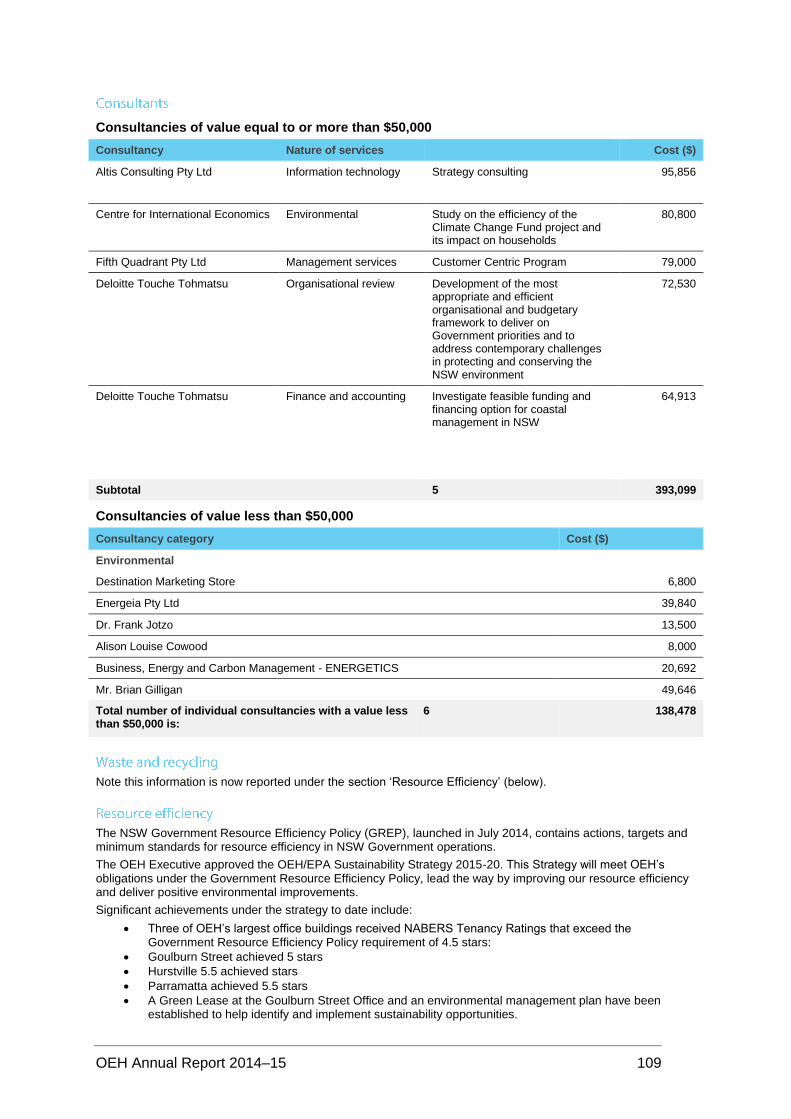
OEH Annual Report 2014–15 109
Consultancies of value equal to or more than $50,000
Consultancy Nature of services Cost ($)
Altis Consulting Pty Ltd Information technology Strategy consulting 95,856
Centre for International Economics Environmental Study on the efficiency of the Climate Change Fund project and its impact on households
80,800
Fifth Quadrant Pty Ltd Management services Customer Centric Program 79,000
Deloitte Touche Tohmatsu Organisational review Development of the most appropriate and efficient organisational and budgetary framework to deliver on Government priorities and to address contemporary challenges in protecting and conserving the NSW environment
72,530
Deloitte Touche Tohmatsu Finance and accounting Investigate feasible funding and financing option for coastal management in NSW
64,913
Subtotal 5 393,099
Consultancies of value less than $50,000
Consultancy category Cost ($)
Environmental
Destination Marketing Store 6,800
Energeia Pty Ltd 39,840
Dr. Frank Jotzo 13,500
Alison Louise Cowood 8,000
Business, Energy and Carbon Management - ENERGETICS 20,692
Mr. Brian Gilligan 49,646
Total number of individual consultancies with a value less than $50,000 is:
6 138,478
Note this information is now reported under the section ‘Resource Efficiency’ (below).
The NSW Government Resource Efficiency Policy (GREP), launched in July 2014, contains actions, targets and minimum standards for resource efficiency in NSW Government operations.
The OEH Executive approved the OEH/EPA Sustainability Strategy 2015-20. This Strategy will meet OEH’s obligations under the Government Resource Efficiency Policy, lead the way by improving our resource efficiency and deliver positive environmental improvements.
Significant achievements under the strategy to date include:
Three of OEH’s largest office buildings received NABERS Tenancy Ratings that exceed the Government Resource Efficiency Policy requirement of 4.5 stars:
Goulburn Street achieved 5 stars
Hurstville 5.5 achieved stars
Parramatta achieved 5.5 stars
A Green Lease at the Goulburn Street Office and an environmental management plan have been established to help identify and implement sustainability opportunities.
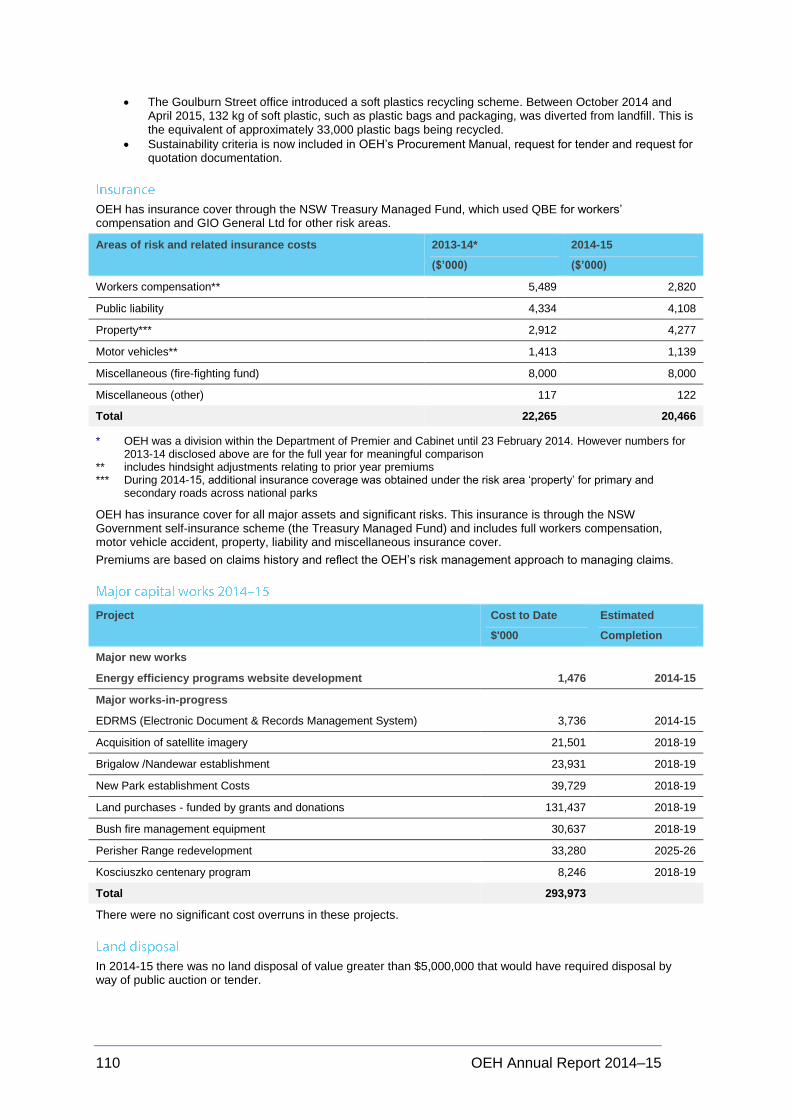
110 OEH Annual Report 2014–15
The Goulburn Street office introduced a soft plastics recycling scheme. Between October 2014 and April 2015, 132 kg of soft plastic, such as plastic bags and packaging, was diverted from landfill. This is the equivalent of approximately 33,000 plastic bags being recycled.
Sustainability criteria is now included in OEH’s Procurement Manual, request for tender and request for quotation documentation.
OEH has insurance cover through the NSW Treasury Managed Fund, which used QBE for workers’ compensation and GIO General Ltd for other risk areas.
Areas of risk and related insurance costs 2013-14*
($’000)
2014-15
($’000)
Workers compensation** 5,489 2,820
Public liability 4,334 4,108
Property*** 2,912 4,277
Motor vehicles** 1,413 1,139
Miscellaneous (fire-fighting fund) 8,000 8,000
Miscellaneous (other) 117 122
Total 22,265 20,466
* OEH was a division within the Department of Premier and Cabinet until 23 February 2014. However numbers for 2013-14 disclosed above are for the full year for meaningful comparison
** includes hindsight adjustments relating to prior year premiums *** During 2014-15, additional insurance coverage was obtained under the risk area ‘property’ for primary and
secondary roads across national parks
OEH has insurance cover for all major assets and significant risks. This insurance is through the NSW Government self-insurance scheme (the Treasury Managed Fund) and includes full workers compensation, motor vehicle accident, property, liability and miscellaneous insurance cover.
Premiums are based on claims history and reflect the OEH’s risk management approach to managing claims.
Project Cost to Date
$'000
Estimated
Completion
Major new works
Energy efficiency programs website development 1,476 2014-15
Major works-in-progress
EDRMS (Electronic Document & Records Management System) 3,736 2014-15
Acquisition of satellite imagery 21,501 2018-19
Brigalow /Nandewar establishment 23,931 2018-19
New Park establishment Costs 39,729 2018-19
Land purchases - funded by grants and donations 131,437 2018-19
Bush fire management equipment 30,637 2018-19
Perisher Range redevelopment 33,280 2025-26
Kosciuszko centenary program 8,246 2018-19
Total 293,973
There were no significant cost overruns in these projects.
In 2014-15 there was no land disposal of value greater than $5,000,000 that would have required disposal by way of public auction or tender.
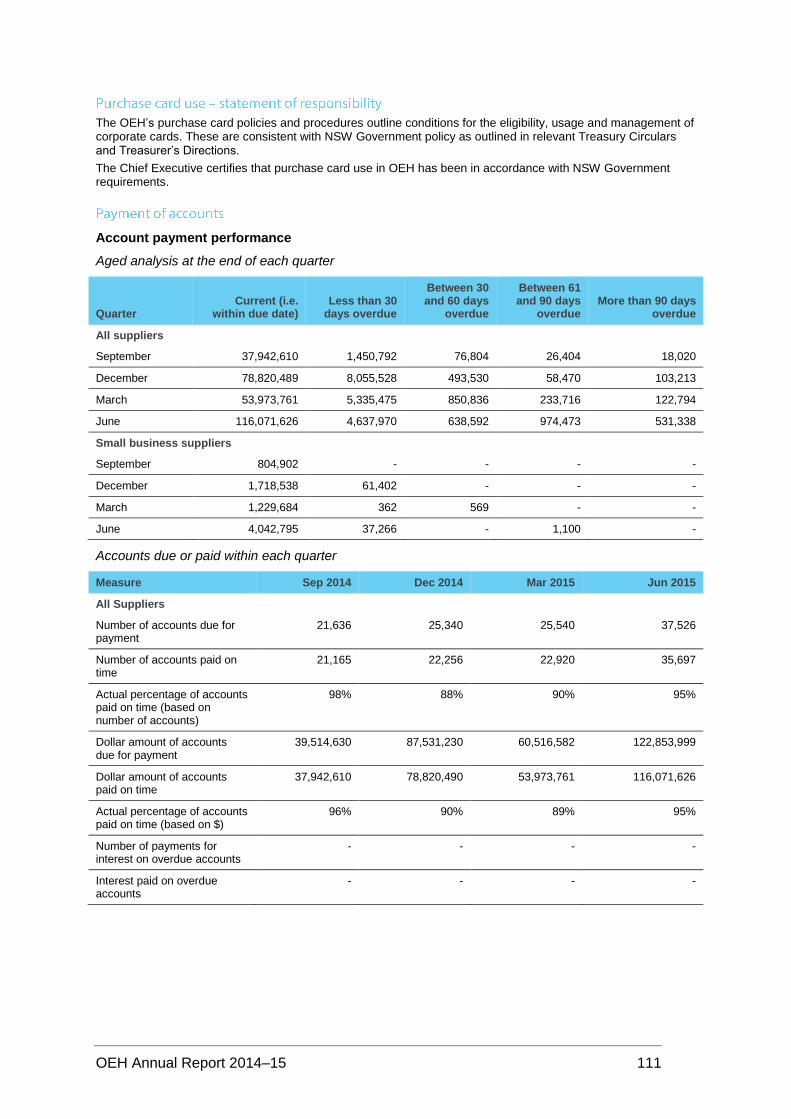
OEH Annual Report 2014–15 111
The OEH’s purchase card policies and procedures outline conditions for the eligibility, usage and management of corporate cards. These are consistent with NSW Government policy as outlined in relevant Treasury Circulars and Treasurer’s Directions.
The Chief Executive certifies that purchase card use in OEH has been in accordance with NSW Government requirements.
Account payment performance
Aged analysis at the end of each quarter
Quarter Current (i.e.
within due date) Less than 30
days overdue
Between 30 and 60 days
overdue
Between 61 and 90 days
overdue More than 90 days
overdue
All suppliers
September 37,942,610 1,450,792 76,804 26,404 18,020
December 78,820,489 8,055,528 493,530 58,470 103,213
March 53,973,761 5,335,475 850,836 233,716 122,794
June 116,071,626 4,637,970 638,592 974,473 531,338
Small business suppliers
September 804,902 - - - -
December 1,718,538 61,402 - - -
March 1,229,684 362 569 - -
June 4,042,795 37,266 - 1,100 -
Accounts due or paid within each quarter
Measure Sep 2014 Dec 2014 Mar 2015 Jun 2015
All Suppliers
Number of accounts due for payment
21,636 25,340 25,540 37,526
Number of accounts paid on time
21,165 22,256 22,920 35,697
Actual percentage of accounts paid on time (based on number of accounts)
98% 88% 90% 95%
Dollar amount of accounts due for payment
39,514,630 87,531,230 60,516,582 122,853,999
Dollar amount of accounts paid on time
37,942,610 78,820,490 53,973,761 116,071,626
Actual percentage of accounts paid on time (based on $)
96% 90% 89% 95%
Number of payments for interest on overdue accounts
- - - -
Interest paid on overdue accounts
- - - -

112 OEH Annual Report 2014–15
Measure Sep 2014 Dec 2014 Mar 2015 Jun 2015
Small business suppliers
Number of accounts due for payment to small businesses
507 736 665 1,177
Number of accounts due to small businesses paid on time
507 727 663 1,165
Actual percentage of small business accounts paid on time (based on number of accounts)
100% 99% 99% 99%
Dollar amount of accounts due for payment to small businesses
804,902 1,779,940 1,230,615 4,081,161
Dollar amount of accounts due to small businesses paid on time
804,902 1,718,538 1,229,684 4,042,794
Actual percentage of small business accounts paid on time (based on $)
100% 97% 99% 99%
Number of payments to small business for interest on overdue accounts
- 9 - -
Interest paid to small businesses on overdue accounts
- 539 - -
Organisation Nature and purpose of grant Amount
3rd Space Mob Aboriginal and Torres Strait Islander Corporation
Educational video and film project 37,500.00
Australian Seabird Rescue Contribution to Wildlife Carers group 2,565.00
Bankstown Youth Development Service To investigate and find solutions to waste/water management in the local environment utilising creative arts surrounding Bankstown
22,800.00
Bankstown Youth Development Service To investigate and find solutions to waste/water management in the local environment utilising creative arts surrounding Bankstown
7,600.00
Big Hart To collect oral histories and community workshops to inform theatre production and events to celebrate the 65th anniversary of the Snowy Mountains Hydro Scheme
20,000.00
Catholic Parish of St Mary of the Presentation Mudgee
To undertake conservation works to the State Heritage Register listed St. Mary's Roman Catholic Church, Presbytery, Convent and Hall
74,255.08
Eden Local Aboriginal Land Council To prepare an interpretation strategy for the Bundian Way and reconstruct the trail between Beermuna and Bilgalera as a safe walking trail
38,620.00
Eramboo World Studies Centre Support Ku-ring-gai PH Art and Science Project 900.00
Ethnic Communities' Council of NSW Support voluntary organisations in Western Sydney to engage their communities with local waste and food garden initiatives
40,000.00
FAWNA (NSW) Contribution to Wildlife Carers group 6,800.00
Foundation for National Parks and Wildlife Conservation contribution 50,000.00
Friends of the Koala Contribution to Wildlife Carers group 2,565.00
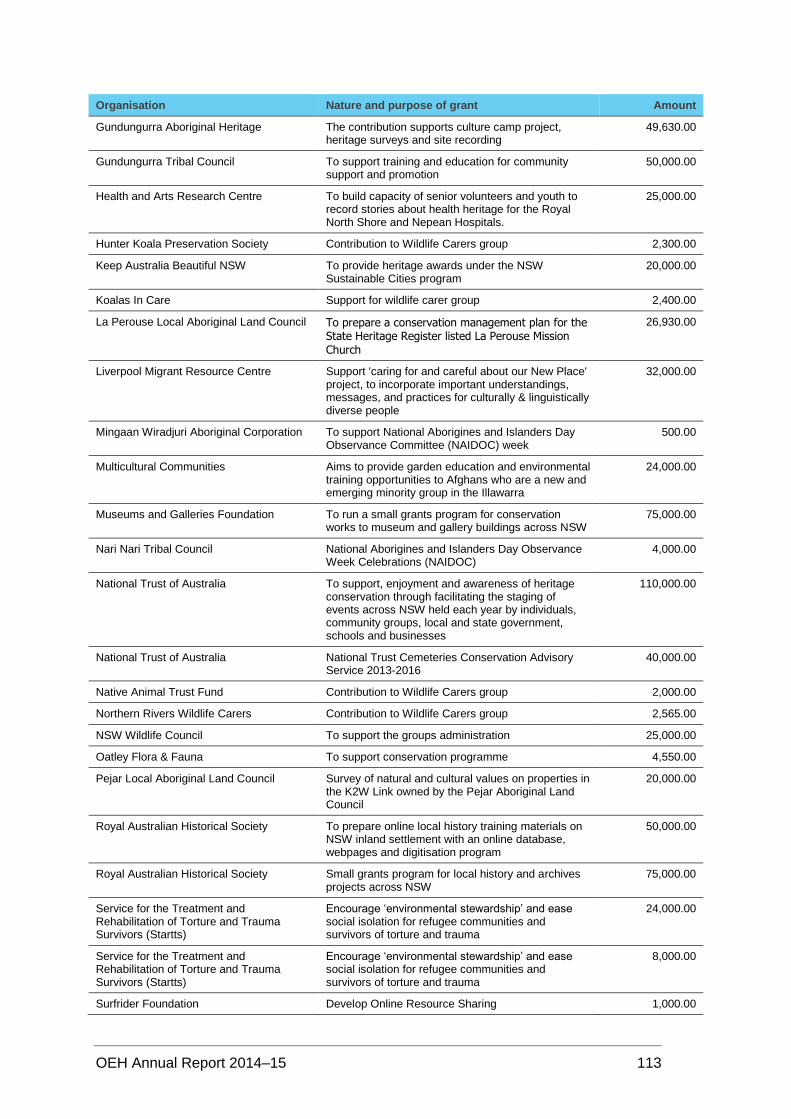
OEH Annual Report 2014–15 113
Organisation Nature and purpose of grant Amount
Gundungurra Aboriginal Heritage The contribution supports culture camp project, heritage surveys and site recording
49,630.00
Gundungurra Tribal Council To support training and education for community support and promotion
50,000.00
Health and Arts Research Centre To build capacity of senior volunteers and youth to record stories about health heritage for the Royal North Shore and Nepean Hospitals.
25,000.00
Hunter Koala Preservation Society Contribution to Wildlife Carers group 2,300.00
Keep Australia Beautiful NSW To provide heritage awards under the NSW Sustainable Cities program
20,000.00
Koalas In Care Support for wildlife carer group 2,400.00
La Perouse Local Aboriginal Land Council To prepare a conservation management plan for the State Heritage Register listed La Perouse Mission Church
26,930.00
Liverpool Migrant Resource Centre Support 'caring for and careful about our New Place' project, to incorporate important understandings, messages, and practices for culturally & linguistically diverse people
32,000.00
Mingaan Wiradjuri Aboriginal Corporation To support National Aborigines and Islanders Day Observance Committee (NAIDOC) week
500.00
Multicultural Communities Aims to provide garden education and environmental training opportunities to Afghans who are a new and emerging minority group in the Illawarra
24,000.00
Museums and Galleries Foundation To run a small grants program for conservation works to museum and gallery buildings across NSW
75,000.00
Nari Nari Tribal Council National Aborigines and Islanders Day Observance Week Celebrations (NAIDOC)
4,000.00
National Trust of Australia To support, enjoyment and awareness of heritage conservation through facilitating the staging of events across NSW held each year by individuals, community groups, local and state government, schools and businesses
110,000.00
National Trust of Australia National Trust Cemeteries Conservation Advisory Service 2013-2016
40,000.00
Native Animal Trust Fund Contribution to Wildlife Carers group 2,000.00
Northern Rivers Wildlife Carers Contribution to Wildlife Carers group 2,565.00
NSW Wildlife Council To support the groups administration 25,000.00
Oatley Flora & Fauna To support conservation programme 4,550.00
Pejar Local Aboriginal Land Council Survey of natural and cultural values on properties in the K2W Link owned by the Pejar Aboriginal Land Council
20,000.00
Royal Australian Historical Society To prepare online local history training materials on NSW inland settlement with an online database, webpages and digitisation program
50,000.00
Royal Australian Historical Society Small grants program for local history and archives projects across NSW
75,000.00
Service for the Treatment and Rehabilitation of Torture and Trauma Survivors (Startts)
Encourage ‘environmental stewardship’ and ease social isolation for refugee communities and survivors of torture and trauma
24,000.00
Service for the Treatment and Rehabilitation of Torture and Trauma Survivors (Startts)
Encourage ‘environmental stewardship’ and ease social isolation for refugee communities and survivors of torture and trauma
8,000.00
Surfrider Foundation Develop Online Resource Sharing 1,000.00
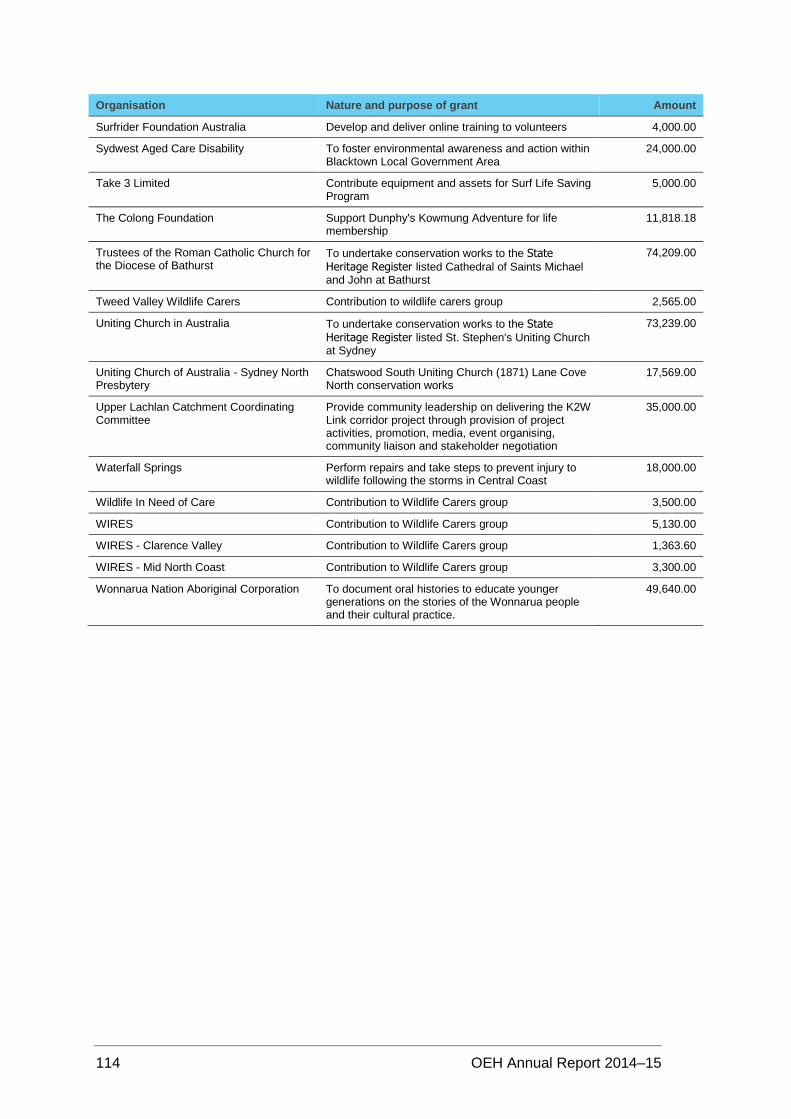
114 OEH Annual Report 2014–15
Organisation Nature and purpose of grant Amount
Surfrider Foundation Australia Develop and deliver online training to volunteers 4,000.00
Sydwest Aged Care Disability To foster environmental awareness and action within Blacktown Local Government Area
24,000.00
Take 3 Limited Contribute equipment and assets for Surf Life Saving Program
5,000.00
The Colong Foundation Support Dunphy's Kowmung Adventure for life membership
11,818.18
Trustees of the Roman Catholic Church for the Diocese of Bathurst
To undertake conservation works to the State Heritage Register listed Cathedral of Saints Michael and John at Bathurst
74,209.00
Tweed Valley Wildlife Carers Contribution to wildlife carers group 2,565.00
Uniting Church in Australia To undertake conservation works to the State Heritage Register listed St. Stephen's Uniting Church at Sydney
73,239.00
Uniting Church of Australia - Sydney North Presbytery
Chatswood South Uniting Church (1871) Lane Cove North conservation works
17,569.00
Upper Lachlan Catchment Coordinating Committee
Provide community leadership on delivering the K2W Link corridor project through provision of project activities, promotion, media, event organising, community liaison and stakeholder negotiation
35,000.00
Waterfall Springs Perform repairs and take steps to prevent injury to wildlife following the storms in Central Coast
18,000.00
Wildlife In Need of Care Contribution to Wildlife Carers group 3,500.00
WIRES Contribution to Wildlife Carers group 5,130.00
WIRES - Clarence Valley Contribution to Wildlife Carers group 1,363.60
WIRES - Mid North Coast Contribution to Wildlife Carers group 3,300.00
Wonnarua Nation Aboriginal Corporation To document oral histories to educate younger generations on the stories of the Wonnarua people and their cultural practice.
49,640.00
OEH Annual Report 2014–15 115
The Heritage Council of NSW is a statutory body under the Heritage Act 1977 (the Act) and is required by the Act to produce an annual report. The Council comprises nine members with a range of knowledge, qualifications and skills. Members are drawn from the community, the NSW Government and the heritage/conservation profession, and include a nominee of the National Trust (NSW).
The Heritage Council makes decisions about the care and protection of places and items that have been identified as being of heritage significance to the people of NSW. It also advises the Minister for Heritage on heritage matters. The Council is supported by the Office of Environment and Heritage (OEH), which provides professional advice and administrative support to help promote the identification, protection, conservation, management and celebration of heritage places across NSW and maintains the NSW State Heritage Inventory.
Further details on the role and activities of the Heritage Council are available at: www.environment.nsw.gov.au/heritage/index.htm.
The Heritage Council members are as follows: Mr Stephen Davies; Ms Jennifer Davis; Mr Mark Dunn; Ms Jane Irwin; Mr Raymond Kelly (representing Aboriginal heritage management); Mr Don Godden (National Trust of Australia (NSW) nominee1/07/2014 to 16/11/2014); Ms Lisa Newell (National Trust of Australia (NSW) nominee, as Don Godden’s deputy); and Ms Josephine Wing (for Secretary, Department of Planning and Environment).
Dr Deborah Dearing joined the Heritage Council during the year. Professor Lawrence Nield (Chair) completed his 3-year term on the Heritage Council in May 2015.
The Heritage Council meets on the first Wednesday of the month between February and December (11 times during 2014-15). In addition, the Heritage Council held four meetings out of session to facilitate the effective and efficient operations of the Act.
The annual Heritage Council regional visit took place in September 2014. The Heritage Council visited the South West Slopes region, including Wagga Wagga, Tumut and Gundagai. The Council met with local community groups and representatives from local government including Wagga Wagga City Council, Greater Hume Shire Council, Gundagai Shire Council, Junee Shire Council, Tumbarumba Shire Council and Tumut Shire Council.
The Heritage Council ensures it meets its statutory obligations to conserve and list state heritage items by delegating these functions to the State Heritage Register Committee and the Approvals Committee. Both committees meet monthly with members from the Heritage Council and additional experts. In 2014–15, Ms Louise Cox AO and Mr Bruce Pettman served as additional experts on these committees.
Heritage Council State Heritage Register Committee
During 2014-15 the State Heritage Register Committee met 11 times. The members of the Committee were Ms Louise Cox AO (Chair), Ms Jennifer Davis, Dr Deborah Dearing, Mr Mark Dunn, Mr Raymond Kelly and Ms Lisa Newell.
The Committee, under delegation, is responsible for making recommendations to the Minister for Heritage on the listing of items on the State Heritage Register and providing expert comment on planning documents for major heritage places.
Heritage Council Approvals Committee
During 2014-15 the Approvals Committee met 12 times. The members of the Committee were Professor Lawrence Nield (Chair), Mr Stephen Davies, Ms Jane Irwin, Mr Bruce Pettman and Ms Josephine Wing.
The Committee, under delegation, administers the Heritage Council's approval body role. It approves, comments on, or suggests amendments to proposed changes to listed items.
During 2014–15, 20 items were added to the State Heritage Register. The register lists places and items of particular heritage significance in NSW, and contains 1658 items. The NSW Government owns almost 50 per cent of these items, and the rest are owned by individuals, local councils and industry.
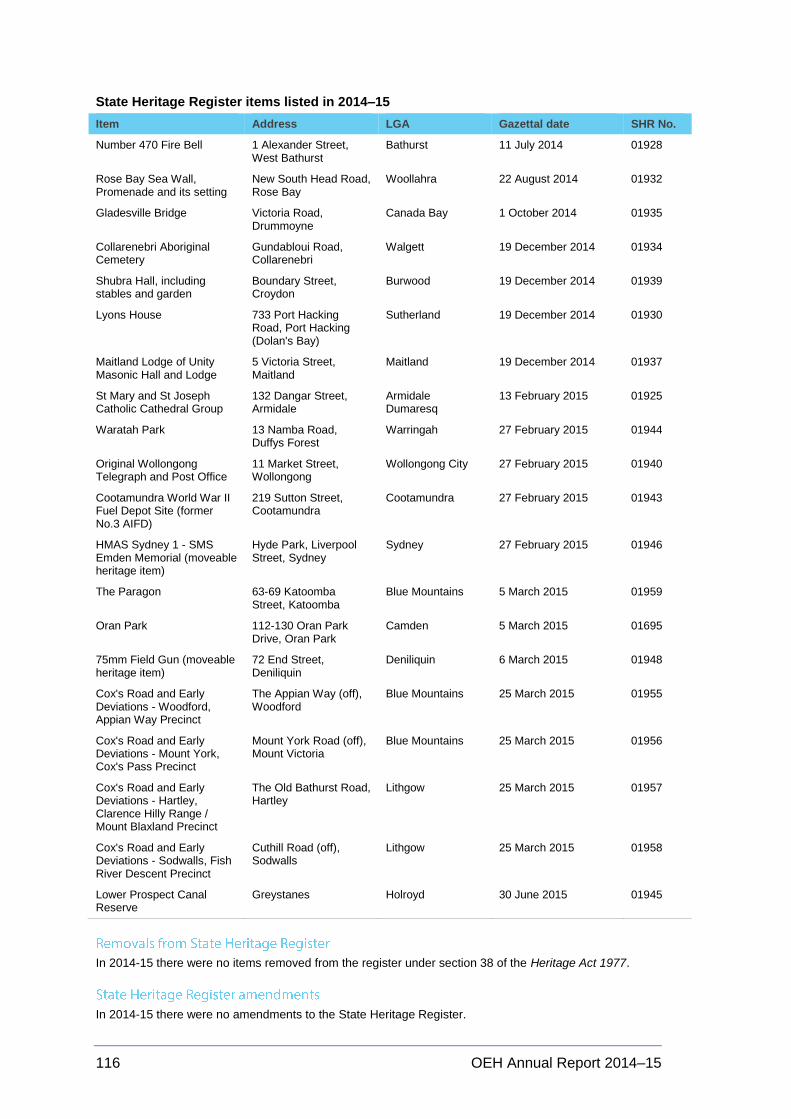
116 OEH Annual Report 2014–15
State Heritage Register items listed in 2014–15
Item Address LGA Gazettal date SHR No.
Number 470 Fire Bell 1 Alexander Street, West Bathurst
Bathurst 11 July 2014 01928
Rose Bay Sea Wall, Promenade and its setting
New South Head Road, Rose Bay
Woollahra 22 August 2014 01932
Gladesville Bridge Victoria Road, Drummoyne
Canada Bay 1 October 2014 01935
Collarenebri Aboriginal Cemetery
Gundabloui Road, Collarenebri
Walgett 19 December 2014 01934
Shubra Hall, including stables and garden
Boundary Street, Croydon
Burwood 19 December 2014 01939
Lyons House 733 Port Hacking Road, Port Hacking (Dolan's Bay)
Sutherland 19 December 2014 01930
Maitland Lodge of Unity Masonic Hall and Lodge
5 Victoria Street, Maitland
Maitland 19 December 2014 01937
St Mary and St Joseph Catholic Cathedral Group
132 Dangar Street, Armidale
Armidale Dumaresq
13 February 2015 01925
Waratah Park 13 Namba Road, Duffys Forest
Warringah 27 February 2015 01944
Original Wollongong Telegraph and Post Office
11 Market Street, Wollongong
Wollongong City 27 February 2015 01940
Cootamundra World War II Fuel Depot Site (former No.3 AIFD)
219 Sutton Street, Cootamundra
Cootamundra 27 February 2015 01943
HMAS Sydney 1 - SMS Emden Memorial (moveable heritage item)
Hyde Park, Liverpool Street, Sydney
Sydney 27 February 2015 01946
The Paragon 63-69 Katoomba Street, Katoomba
Blue Mountains 5 March 2015 01959
Oran Park 112-130 Oran Park Drive, Oran Park
Camden 5 March 2015 01695
75mm Field Gun (moveable heritage item)
72 End Street, Deniliquin
Deniliquin 6 March 2015 01948
Cox's Road and Early Deviations - Woodford, Appian Way Precinct
The Appian Way (off), Woodford
Blue Mountains 25 March 2015 01955
Cox's Road and Early Deviations - Mount York, Cox's Pass Precinct
Mount York Road (off), Mount Victoria
Blue Mountains 25 March 2015 01956
Cox's Road and Early Deviations - Hartley, Clarence Hilly Range / Mount Blaxland Precinct
The Old Bathurst Road, Hartley
Lithgow 25 March 2015 01957
Cox's Road and Early Deviations - Sodwalls, Fish River Descent Precinct
Cuthill Road (off), Sodwalls
Lithgow 25 March 2015 01958
Lower Prospect Canal Reserve
Greystanes Holroyd 30 June 2015 01945
In 2014-15 there were no items removed from the register under section 38 of the Heritage Act 1977.
In 2014-15 there were no amendments to the State Heritage Register.
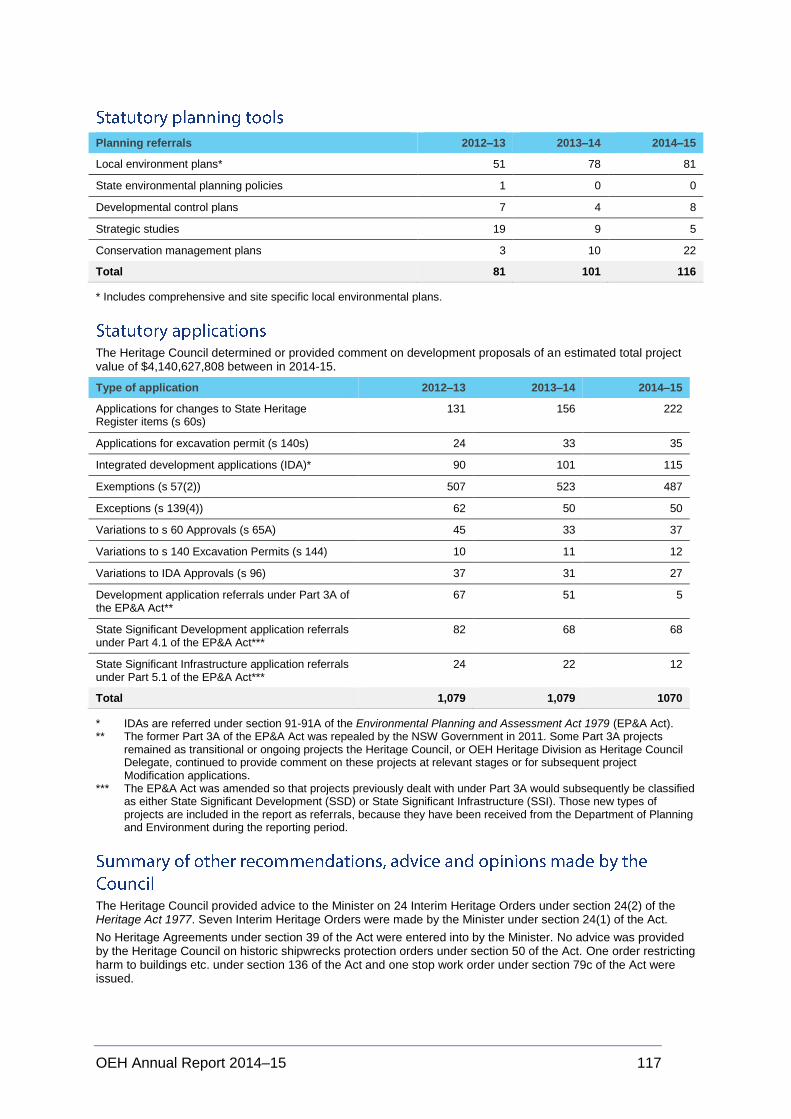
OEH Annual Report 2014–15 117
Planning referrals 2012–13 2013–14 2014–15
Local environment plans* 51 78 81
State environmental planning policies 1 0 0
Developmental control plans 7 4 8
Strategic studies 19 9 5
Conservation management plans 3 10 22
Total 81 101 116
* Includes comprehensive and site specific local environmental plans.
The Heritage Council determined or provided comment on development proposals of an estimated total project value of $4,140,627,808 between in 2014-15.
Type of application 2012–13 2013–14 2014–15
Applications for changes to State Heritage Register items (s 60s)
131 156 222
Applications for excavation permit (s 140s) 24 33 35
Integrated development applications (IDA)* 90 101 115
Exemptions (s 57(2)) 507 523 487
Exceptions (s 139(4)) 62 50 50
Variations to s 60 Approvals (s 65A) 45 33 37
Variations to s 140 Excavation Permits (s 144) 10 11 12
Variations to IDA Approvals (s 96) 37 31 27
Development application referrals under Part 3A of the EP&A Act**
67 51 5
State Significant Development application referrals under Part 4.1 of the EP&A Act***
82 68 68
State Significant Infrastructure application referrals under Part 5.1 of the EP&A Act***
24 22 12
Total 1,079 1,079 1070
* IDAs are referred under section 91-91A of the Environmental Planning and Assessment Act 1979 (EP&A Act). ** The former Part 3A of the EP&A Act was repealed by the NSW Government in 2011. Some Part 3A projects
remained as transitional or ongoing projects the Heritage Council, or OEH Heritage Division as Heritage Council Delegate, continued to provide comment on these projects at relevant stages or for subsequent project Modification applications.
*** The EP&A Act was amended so that projects previously dealt with under Part 3A would subsequently be classified as either State Significant Development (SSD) or State Significant Infrastructure (SSI). Those new types of projects are included in the report as referrals, because they have been received from the Department of Planning and Environment during the reporting period.
The Heritage Council provided advice to the Minister on 24 Interim Heritage Orders under section 24(2) of the Heritage Act 1977. Seven Interim Heritage Orders were made by the Minister under section 24(1) of the Act.
No Heritage Agreements under section 39 of the Act were entered into by the Minister. No advice was provided by the Heritage Council on historic shipwrecks protection orders under section 50 of the Act. One order restricting harm to buildings etc. under section 136 of the Act and one stop work order under section 79c of the Act were issued.

118 OEH Annual Report 2014–15
The NSW Heritage Grants and Hunter Region Grants programs aim to improve the physical condition of NSW heritage items, assist communities to care for their heritage and support local government in its role as manager of the majority of heritage items in NSW. During 2014-15, 193 projects were approved, and $2,532,244 in funding was expended under these grants.
Further details about NSW Heritage grants programs can be found at www.environment.nsw.gov.au/Heritage/funding/index.htm.
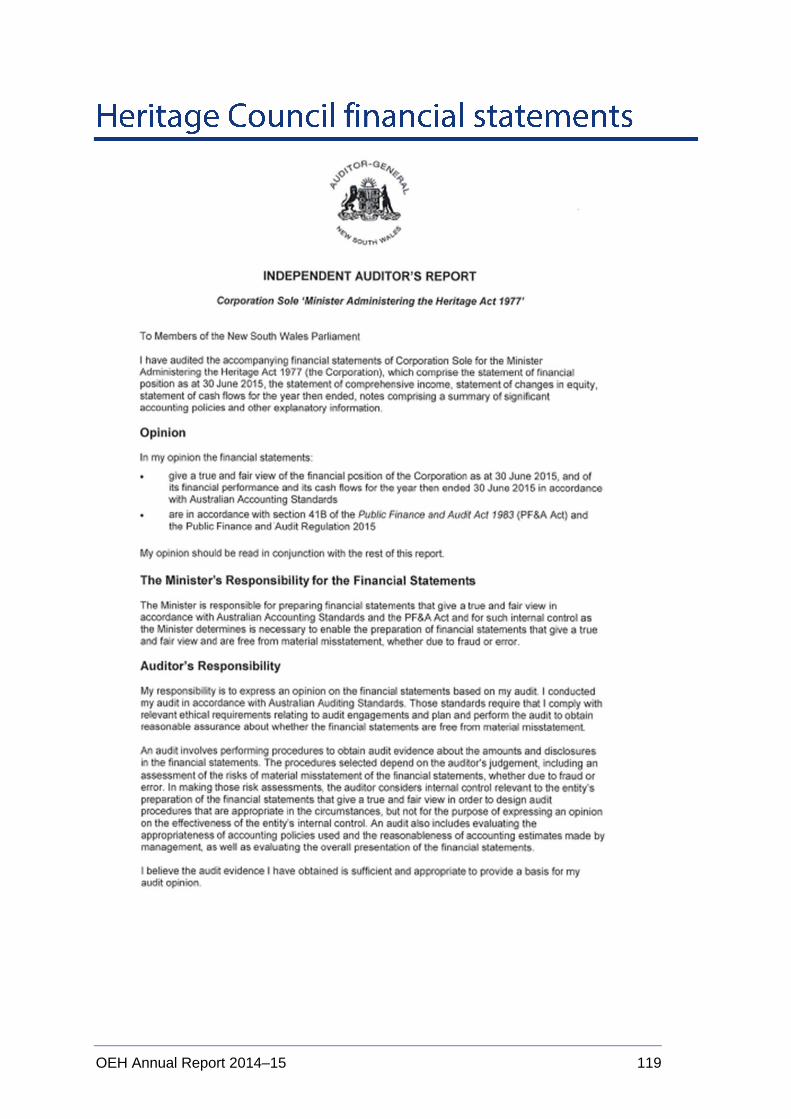
OEH Annual Report 2014–15 119
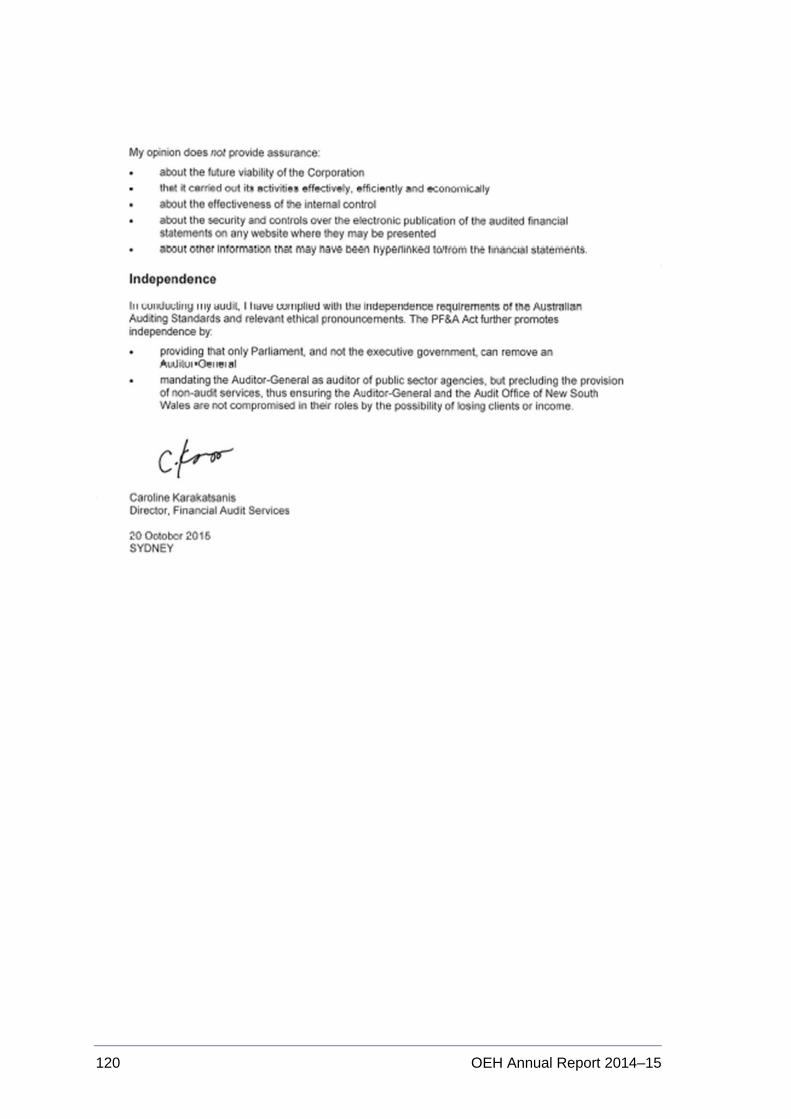
120 OEH Annual Report 2014–15
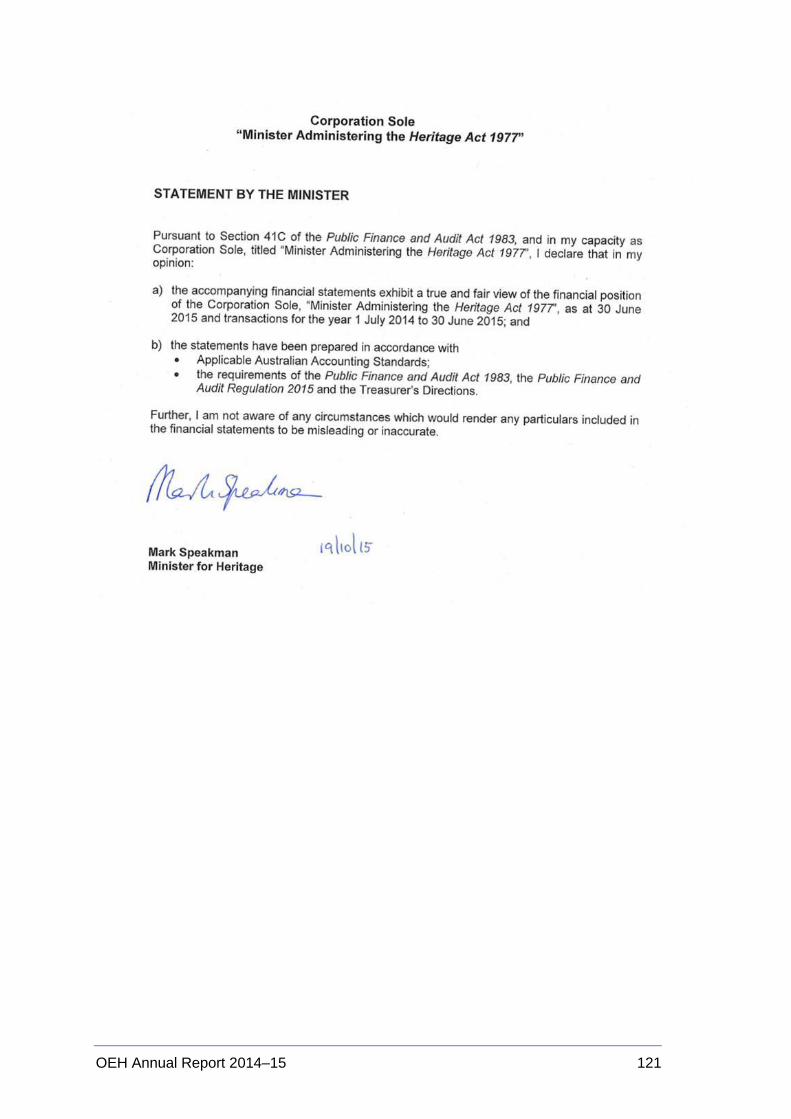
OEH Annual Report 2014–15 121
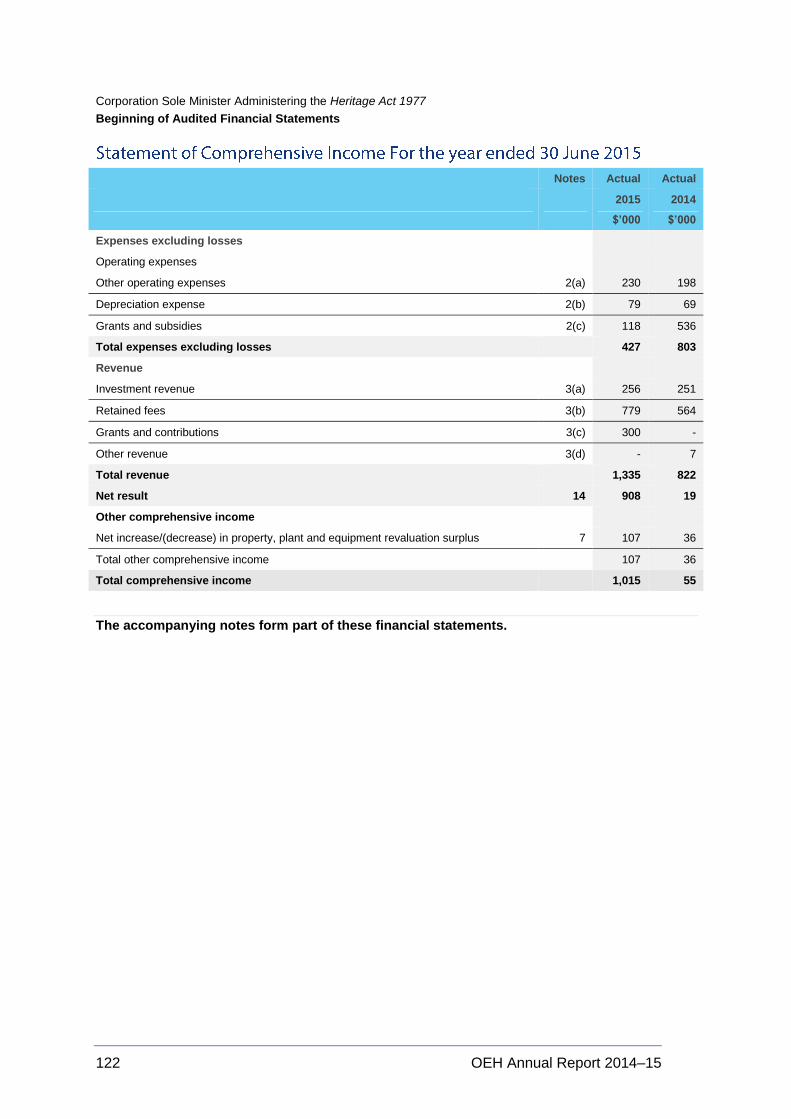
122 OEH Annual Report 2014–15
Corporation Sole Minister Administering the Heritage Act 1977
Beginning of Audited Financial Statements
Notes Actual Actual
2015
$’000
2014
$’000
Expenses excluding losses
Operating expenses
Other operating expenses 2(a) 230 198
Depreciation expense 2(b) 79 69
Grants and subsidies 2(c) 118 536
Total expenses excluding losses 427 803
Revenue
Investment revenue 3(a) 256 251
Retained fees 3(b) 779 564
Grants and contributions 3(c) 300 -
Other revenue 3(d) - 7
Total revenue 1,335 822
Net result 14 908 19
Other comprehensive income
Net increase/(decrease) in property, plant and equipment revaluation surplus 7 107 36
Total other comprehensive income 107 36
Total comprehensive income 1,015 55
The accompanying notes form part of these financial statements.
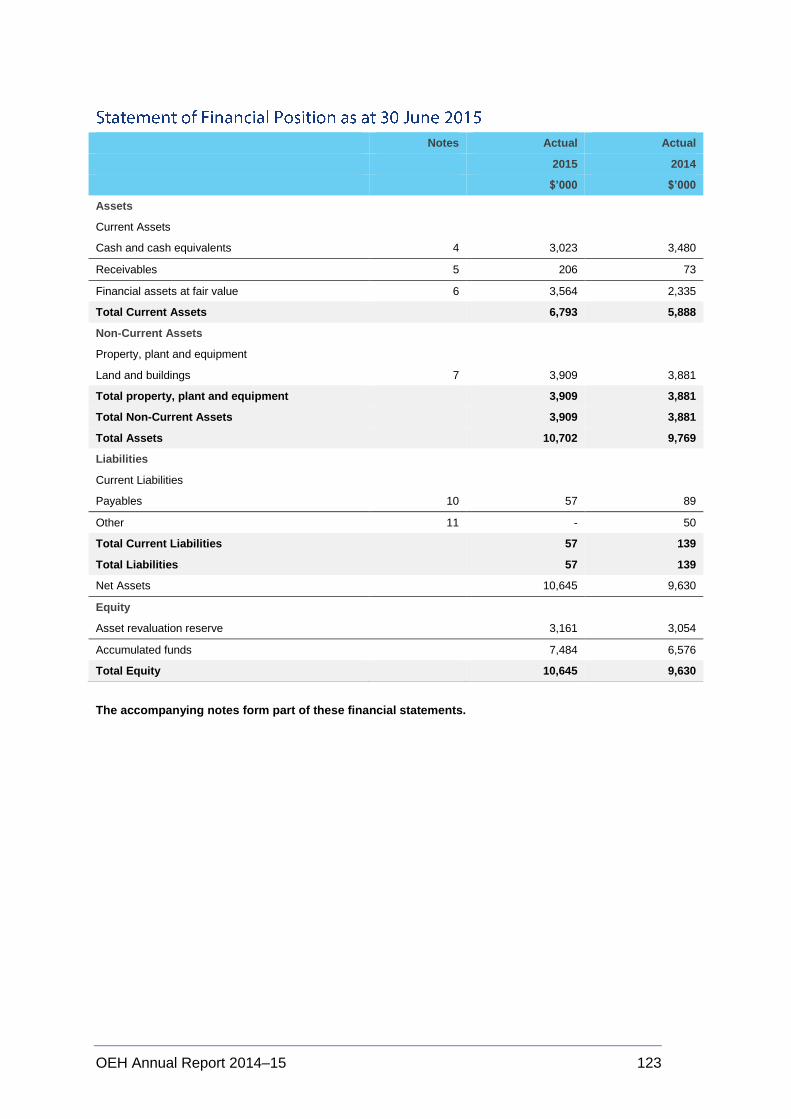
OEH Annual Report 2014–15 123
Notes Actual Actual
2015 2014
$’000 $’000
Assets
Current Assets
Cash and cash equivalents 4 3,023 3,480
Receivables 5 206 73
Financial assets at fair value 6 3,564 2,335
Total Current Assets 6,793 5,888
Non-Current Assets
Property, plant and equipment
Land and buildings 7 3,909 3,881
Total property, plant and equipment 3,909 3,881
Total Non-Current Assets 3,909 3,881
Total Assets 10,702 9,769
Liabilities
Current Liabilities
Payables 10 57 89
Other 11 - 50
Total Current Liabilities 57 139
Total Liabilities 57 139
Net Assets 10,645 9,630
Equity
Asset revaluation reserve 3,161 3,054
Accumulated funds 7,484 6,576
Total Equity 10,645 9,630
The accompanying notes form part of these financial statements.
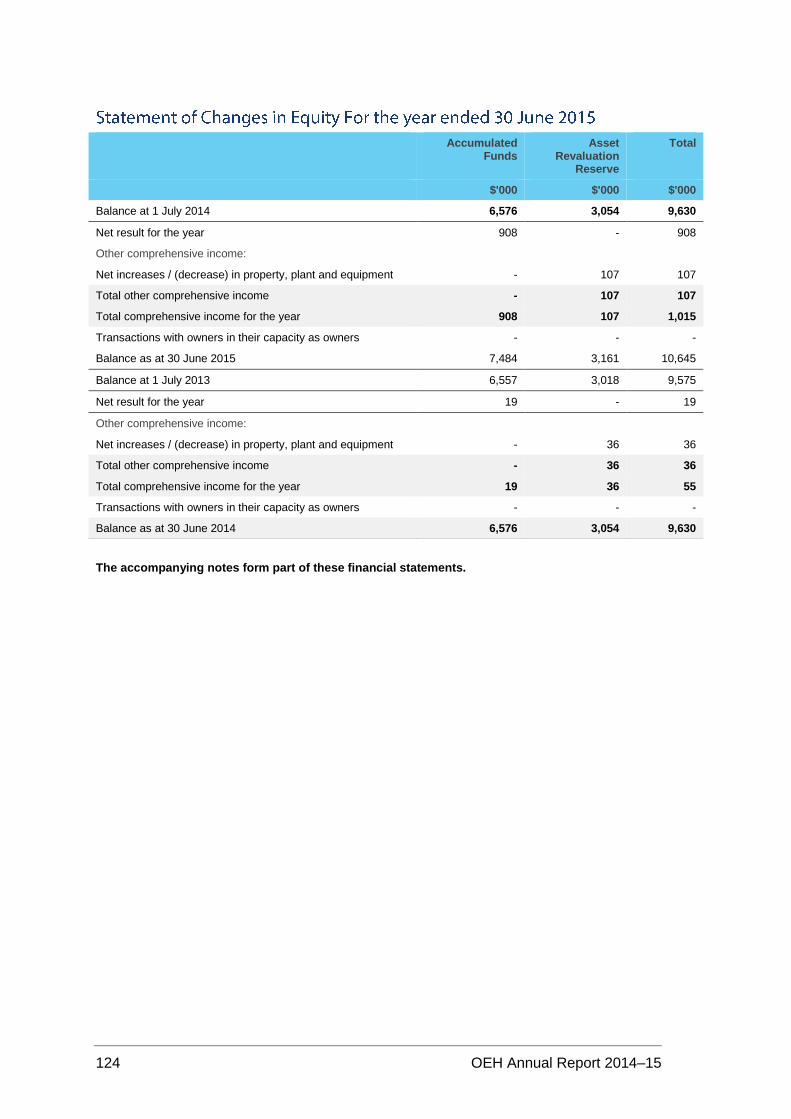
124 OEH Annual Report 2014–15
Accumulated Funds
Asset Revaluation
Reserve
Total
$'000 $'000 $'000
Balance at 1 July 2014 6,576 3,054 9,630
Net result for the year 908 - 908
Other comprehensive income:
Net increases / (decrease) in property, plant and equipment - 107 107
Total other comprehensive income - 107 107
Total comprehensive income for the year 908 107 1,015
Transactions with owners in their capacity as owners - - -
Balance as at 30 June 2015 7,484 3,161 10,645
Balance at 1 July 2013 6,557 3,018 9,575
Net result for the year 19 - 19
Other comprehensive income:
Net increases / (decrease) in property, plant and equipment - 36 36
Total other comprehensive income - 36 36
Total comprehensive income for the year 19 36 55
Transactions with owners in their capacity as owners - - -
Balance as at 30 June 2014 6,576 3,054 9,630
The accompanying notes form part of these financial statements.
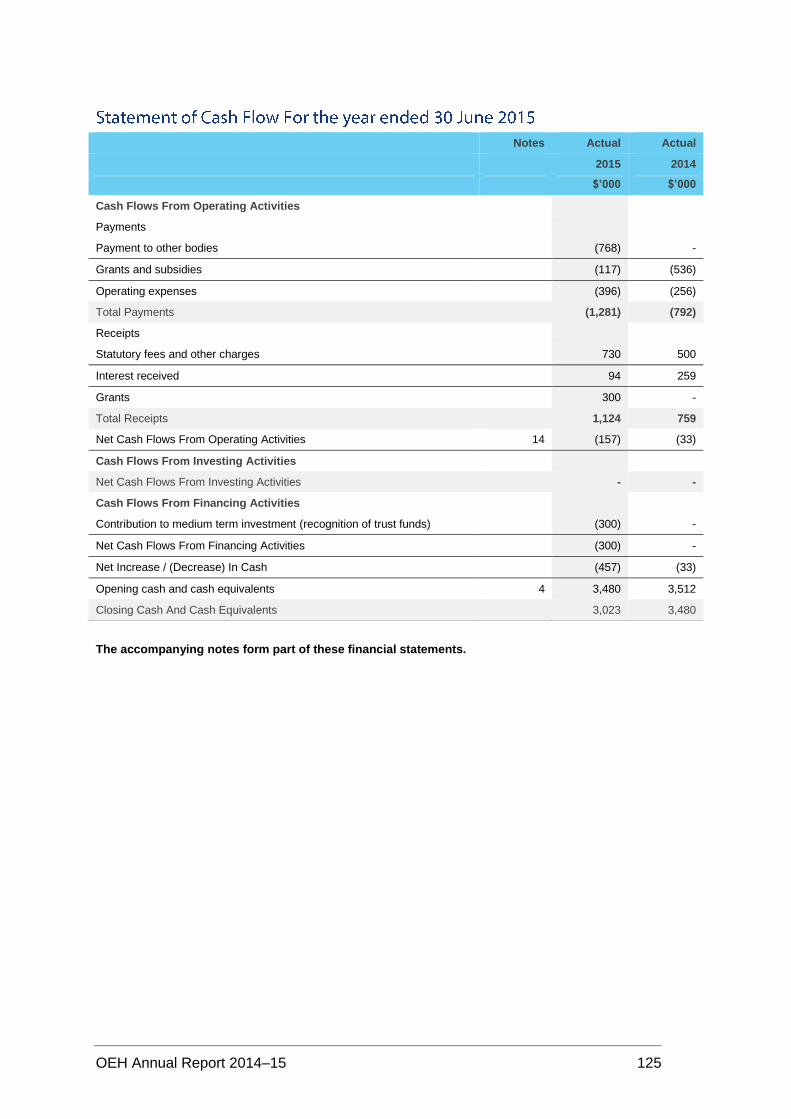
OEH Annual Report 2014–15 125
Notes Actual Actual
2015
$’000
2014
$’000
Cash Flows From Operating Activities
Payments
Payment to other bodies (768) -
Grants and subsidies (117) (536)
Operating expenses (396) (256)
Total Payments (1,281) (792)
Receipts
Statutory fees and other charges 730 500
Interest received 94 259
Grants 300 -
Total Receipts 1,124 759
Net Cash Flows From Operating Activities 14 (157) (33)
Cash Flows From Investing Activities
Net Cash Flows From Investing Activities - -
Cash Flows From Financing Activities
Contribution to medium term investment (recognition of trust funds) (300) -
Net Cash Flows From Financing Activities (300) -
Net Increase / (Decrease) In Cash (457) (33)
Opening cash and cash equivalents 4 3,480 3,512
Closing Cash And Cash Equivalents 3,023 3,480
The accompanying notes form part of these financial statements.
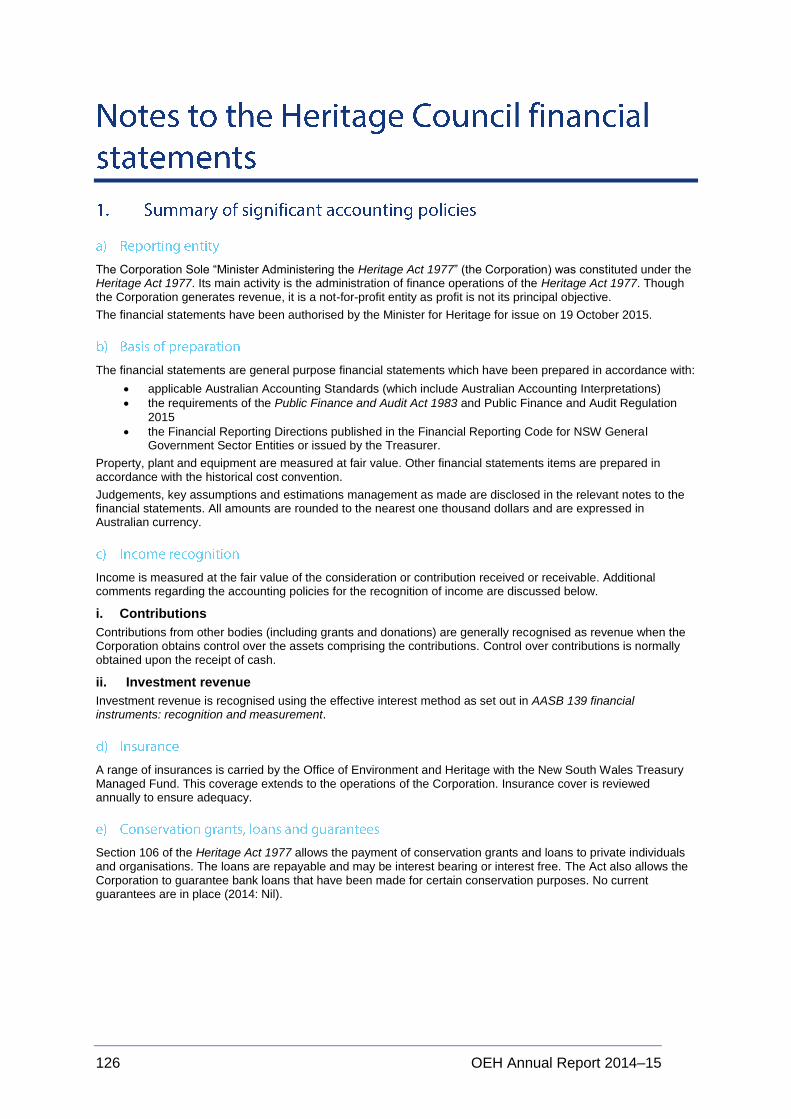
126 OEH Annual Report 2014–15
The Corporation Sole “Minister Administering the Heritage Act 1977” (the Corporation) was constituted under the Heritage Act 1977. Its main activity is the administration of finance operations of the Heritage Act 1977. Though the Corporation generates revenue, it is a not-for-profit entity as profit is not its principal objective.
The financial statements have been authorised by the Minister for Heritage for issue on 19 October 2015.
The financial statements are general purpose financial statements which have been prepared in accordance with:
applicable Australian Accounting Standards (which include Australian Accounting Interpretations)
the requirements of the Public Finance and Audit Act 1983 and Public Finance and Audit Regulation
2015
the Financial Reporting Directions published in the Financial Reporting Code for NSW General Government Sector Entities or issued by the Treasurer.
Property, plant and equipment are measured at fair value. Other financial statements items are prepared in accordance with the historical cost convention.
Judgements, key assumptions and estimations management as made are disclosed in the relevant notes to the financial statements. All amounts are rounded to the nearest one thousand dollars and are expressed in Australian currency.
Income is measured at the fair value of the consideration or contribution received or receivable. Additional comments regarding the accounting policies for the recognition of income are discussed below.
i. Contributions
Contributions from other bodies (including grants and donations) are generally recognised as revenue when the Corporation obtains control over the assets comprising the contributions. Control over contributions is normally obtained upon the receipt of cash.
ii. Investment revenue
Investment revenue is recognised using the effective interest method as set out in AASB 139 financial instruments: recognition and measurement.
A range of insurances is carried by the Office of Environment and Heritage with the New South Wales Treasury Managed Fund. This coverage extends to the operations of the Corporation. Insurance cover is reviewed annually to ensure adequacy.
Section 106 of the Heritage Act 1977 allows the payment of conservation grants and loans to private individuals and organisations. The loans are repayable and may be interest bearing or interest free. The Act also allows the Corporation to guarantee bank loans that have been made for certain conservation purposes. No current guarantees are in place (2014: Nil).
OEH Annual Report 2014–15 127
Assets acquired are initially recognised at cost. Cost is the amount of cash or cash equivalents paid or the fair value of the other consideration given to acquire the asset at the time of its acquisition or construction or, where applicable, the amount attributed to that asset when initially recognised in accordance with the requirements of other Australian Accounting Standards.
Assets acquired at no cost, or for nominal consideration, are initially recognised at their fair value at the date of acquisition. Fair value is the price that would be received to sell an asset in an orderly transaction between market participants at measurement date.
Where payment for an item is deferred beyond normal credit terms, its cost is the cash price equivalent, i.e. the deferred payment amount is effectively discounted at an asset-specific rate.
Property, plant and equipment and intangible assets costing $5000 and above individually are capitalised.
Physical non-current assets are valued in accordance with the “valuation of physical non-current assets at fair value” policy and guidelines paper TPP 14-01. This policy adopts fair value in accordance with AASB 13 fair value measurement and AASB 116 property, plant and equipment.
Property, plant and equipment is measured at the highest and best use by market participants that is physically possible, legally permissible and financially feasible. The highest and best use must be available at a period that is not remote and take into account the characteristics of the asset being measured, including any socio-political restrictions. In most cases, after taking into account these considerations, the highest and best use is the existing use. In limited circumstances, the highest and best use may be a feasible alternative use, where there are no restrictions on use or where there is a feasible higher restricted alternative use.
Fair value of property, plant and equipment is based on a market participants’ perspective, using valuation techniques (market approach, cost approach, income approach) that maximise relevant observable inputs and minimise unobservable inputs. Also see note 7 and note 8 for further information regarding fair value.
The Corporation revalues each class of property, plant and equipment at least every five years or with sufficient regularity to ensure that the carrying amount of each asset in the class does not differ materially from its fair value at reporting date. The last revaluations of land and building were completed as at 30 June 2015 and both were based on independent assessments.
Non-specialised assets with short useful lives are measured at depreciated historical cost, as a surrogate for fair value.
When revaluing non-current assets by reference to current prices for assets newer than those being revalued (adjusted to reflect the present condition of the assets), the gross amount and the related accumulated depreciation are separately restated.
For other assets valued using other valuation techniques, any balances of accumulated depreciation at the revaluation date in respect to those assets are credited to the asset accounts to which they relate. The net asset accounts are then increased or decreased by the revaluation increments or decrements.
Revaluation increments are credited directly to the asset revaluation reserve, except that, to the extent that an increment reverses a revaluation decrement in respect of that class of asset previously recognised as an expense in the net result, the increment is recognised immediately as revenue in the net result.
Revaluation decrements are recognised immediately as expenses in the net result, except that, to the extent that a credit balance exists in the asset revaluation reserve in respect to the same class of assets, they are debited directly to the asset revaluation reserve.
As a not-for-profit entity, revaluation increments and decrements are offset against one another within a class of non-current assets, but not otherwise.
Where an asset that has previously been revalued is disposed of, any balance remaining in the asset revaluation reserve in respect of that asset is transferred to accumulated funds.
As a not-for-profit entity, impairment under AASB 136 impairment of assets is unlikely to arise. As property, plant
and equipment is carried at fair value, impairment can only arise in the rare circumstances where the costs of disposal are material. Specifically, impairment is unlikely for not-for-profit entities given that AASB 136 modifies the recoverable amount test for non-cash generating assets of not-for-profit entities to the higher of fair value less costs of disposal and depreciated replacement cost, where depreciated replacement cost is also fair value. Selling costs are regarded as immaterial.
128 OEH Annual Report 2014–15
Depreciation is provided on a straight-line basis for all depreciable assets so as to write off the depreciable amount of each asset as it is consumed over its useful life to the Corporation.
All material separately identifiable components of assets are depreciated over their shorter useful lives.
The depreciation rate for building is 2.5%. Land is not depreciated.
The estimated cost of dismantling and removing an asset and restoring the site is included in the cost of an asset, to the extent that it is recognised as a liability.
The costs of day-to-day servicing or maintenance are charged as expenses as incurred, except where they relate to the replacement of a part or component of an asset, in which case the costs are capitalised and depreciated.
Trust funds
The Corporation held monies in a trustee capacity for the Old Government House archaeological site at Port Macquarie. During 2014-15, formal agreement was made to transfer control of part of these funds to the Corporation. Refer notes 9 and 15.
Income, expenses and assets are recognised net of GST, except where:
the amount of GST incurred by the Corporation as a purchaser that is not recoverable from the Australian Taxation Office is recognised as part of the cost of acquisition of an asset or as part of an item of expense
receivables and payables are stated with the amount of GST included.
Cash flows are included in the statement of cash flows on a gross basis. GST components of cash flows arising from investing and financing activities which are recoverable from, or payable to, the Australian Taxation Office are classified as operating cash flows.
These amounts represent liabilities for goods and services provided to the Corporation. Payables are recognised initially at fair value, usually based on the transaction cost or face value. Subsequent measurement is at amortised cost using the effective interest method. Short-term payables with no stated interest rate are measured at the original invoice amount where the effect of discounting is immaterial.
Receivables are non-derivative financial assets with fixed or determinable payments that are not quoted in an active market. These financial assets are recognised initially at fair value, usually based on the transaction cost at face value. Subsequent measurement is at amortised cost using the effective interest rate method, less any allowance for impairment of receivables. Any changes are accounted for in the net result for the year when impaired, derecognised or through the amortisation process. Short-term receivables with no stated interest rate are measured at original invoice amount where the effect of discounting is immaterial.
Financial instruments give rise to positions that are both a financial asset of one entity and a financial liability (or equity instrument) of another entity.
In accordance with AASB 132 financial instruments: presentation, the Corporation’s financial assets include cash, accounts receivable and financial assets at fair value and its financial liabilities include accounts payable.
In accordance with AASB 139 financial instruments: recognition and measurement, the Corporation’s financial assets and financial liabilities are disclosed at fair value through profit or loss. See note 16 for detailed information.
A number of the Corporation’s accounting policies and disclosures require the measurement of fair values, for both financial and non-financial assets and liabilities. When measuring fair value, the valuation technique used maximises the use of relevant observable inputs and minimises the use of unobservable inputs. Under AASB 13,
OEH Annual Report 2014–15 129
Corporation categorises, for disclosure purposes, the valuation techniques based on the inputs used in the valuation techniques as follows:
i. Level 1: quoted prices in active markets for identical assets/liabilities that the Corporation can access at the measurement date.
ii. Level 2: inputs other than quoted prices included within level 1 that are observable, either directly or indirectly.
iii. Level 3: inputs that are not based on observable market data (unobservable inputs).
The Corporation recognises transfers between levels of the fair value hierarchy at the end of the reporting period during which the change has occurred.
Refer note 8 and note 16 for further disclosures regarding fair value measurements of financial and non-financial assets.
i. Issued but not yet effective
NSW public sector entities are not permitted to early adopt new Australian Accounting Standards, unless Treasury determines otherwise.
The following new Accounting Standards have not been applied and are not yet effective (NSW Treasury mandate TC 15/03):
AASB 9, AASB 2010-7, AASB 2013-9 (Part C), AASB 2014-1 (Part E), AASB 2014-7 and AASB 2014-8 regarding financial instruments
AASB 10, AASB 12 and AASB 128 regarding investment entities
AASB 10, AASB 124 and AASB 1049 regarding extending related party disclosures to not-for-profit entities
AASB 13 related to fair value disclosures of not-for-profit entities
AASB 14 and AASB 2014-1(Part D) regarding regulatory deferral accounts
AASB 15 and AASB 2014-5 regarding revenue from contracts with customers
AASB 1056 superannuation entities
AASB 2014-3 regarding accounting for acquisitions of interests in joint operations
AASB 2014-4 regarding acceptable methods of depreciation and amortisation
AASB 2014-6 regarding bearer plants
AASB 2014-9 regarding equity method in separate financial statements
AASB 2014-10 regarding sale or contribution of assets between and investor and its associate or joint venture
AASB 2015-1 regarding annual improvements to Australian Accounting Standards 2012-2014 cycle
AASB 2015-2 regarding amendments to AASB 101 disclosure initiatives
AASB 2015-3 regarding materiality
AASB 2015-7 regarding amendments to Australian Accounting Standards, Fair Value Disclosures of Not for Profit Public Sector Entities.
The Corporation does not anticipate any material impact of these accounting standards on the financial statements of the Corporation.
ii. Effective for the first time in 2014-15
The accounting policies applied in 2014-15 are consistent with those of the previous financial year except as a result of the following revised Australian Accounting Standard that has been applied for the first time in 2014-15. The standard is as follows:
AASB 13 fair value measurement: AASB 13 aims to improve consistency and reduce complexity by
providing a precise definition of fair value and a single source of fair value measurement and disclosure requirements for use across the Australian Accounting Standards. No differences were found in the valuation approach and therefore no adjustments to any of the carrying amounts in the financial statements are required as a result of the adoption of AASB 13.
However adoption of revised AASB 13 required additional disclosures in the financial statements. This requirement classifies fair value measurement of non-financial assets into three levels and explains the valuation techniques and reconciliation for level 3 assets.
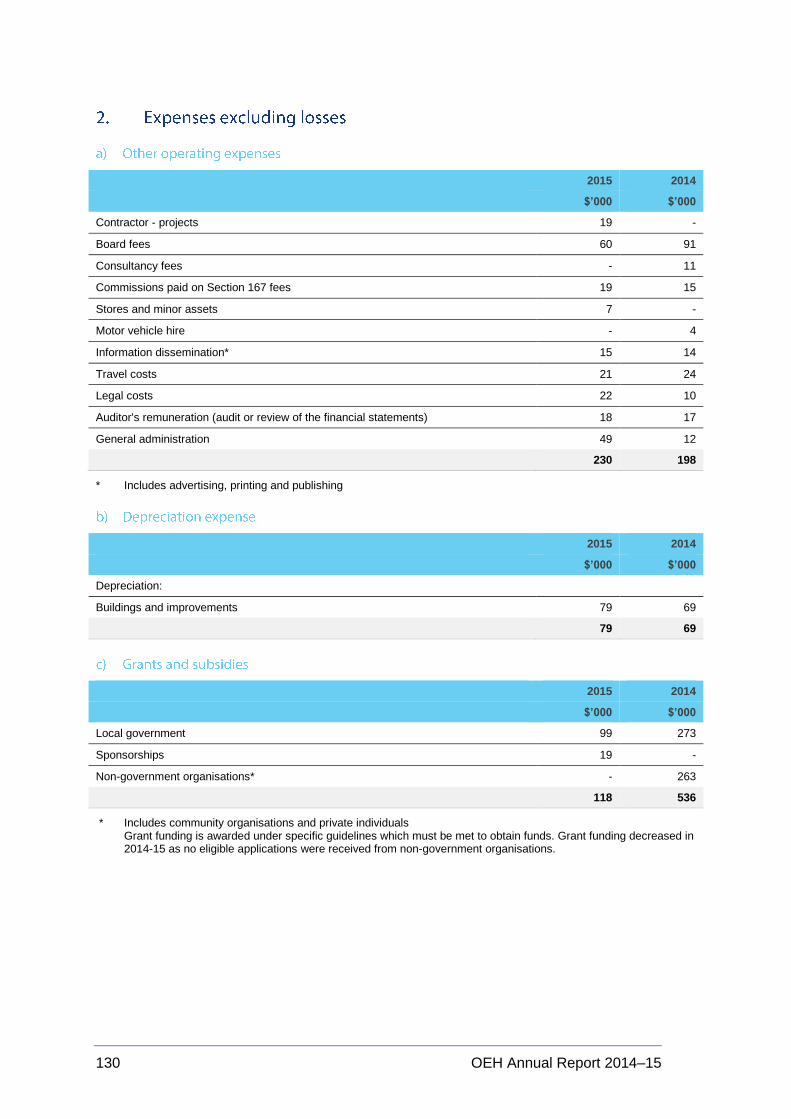
130 OEH Annual Report 2014–15
2015 2014
$’000 $’000
Contractor - projects 19 -
Board fees 60 91
Consultancy fees - 11
Commissions paid on Section 167 fees 19 15
Stores and minor assets 7 -
Motor vehicle hire - 4
Information dissemination* 15 14
Travel costs 21 24
Legal costs 22 10
Auditor's remuneration (audit or review of the financial statements) 18 17
General administration 49 12
230 198
* Includes advertising, printing and publishing
2015 2014
$’000 $’000
Depreciation:
Buildings and improvements 79 69
79 69
2015 2014
$’000 $’000
Local government 99 273
Sponsorships 19 -
Non-government organisations* - 263
118 536
* Includes community organisations and private individuals Grant funding is awarded under specific guidelines which must be met to obtain funds. Grant funding decreased in 2014-15 as no eligible applications were received from non-government organisations.
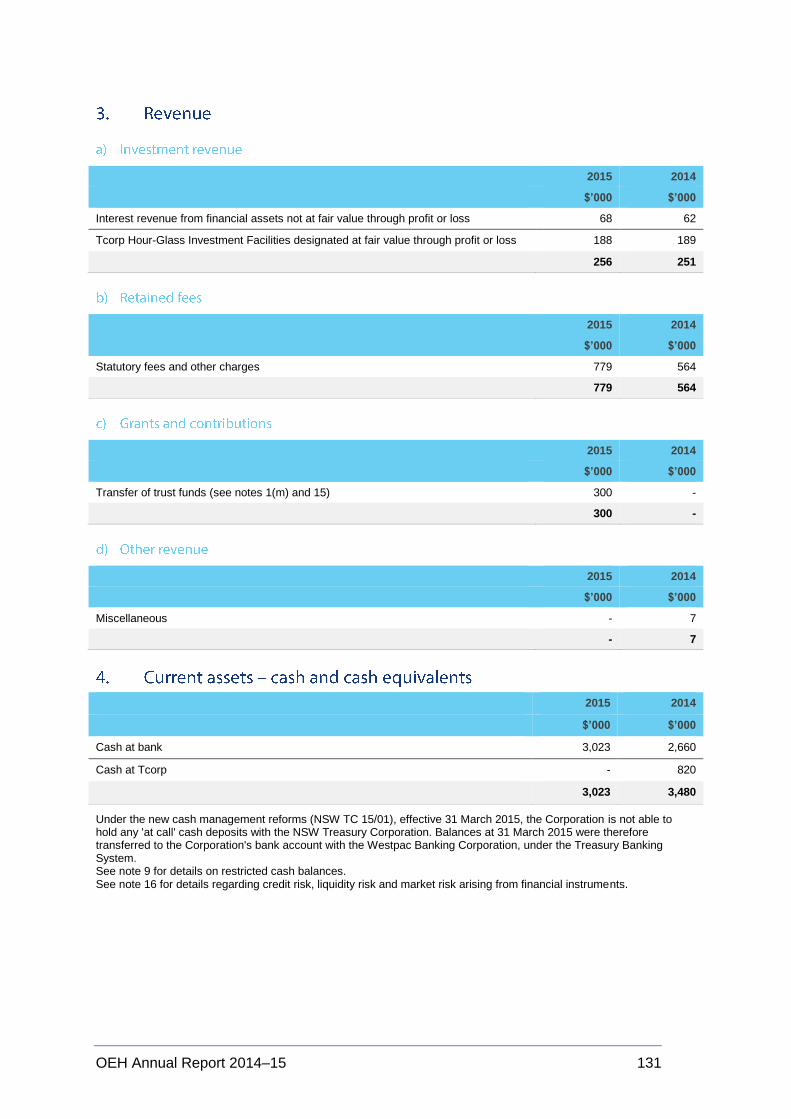
OEH Annual Report 2014–15 131
2015 2014
$’000 $’000
Interest revenue from financial assets not at fair value through profit or loss 68 62
Tcorp Hour-Glass Investment Facilities designated at fair value through profit or loss 188 189
256 251
2015 2014
$’000 $’000
Statutory fees and other charges 779 564
779 564
2015 2014
$’000 $’000
Transfer of trust funds (see notes 1(m) and 15) 300 -
300 -
2015 2014
$’000 $’000
Miscellaneous - 7
- 7
2015 2014
$’000 $’000
Cash at bank 3,023 2,660
Cash at Tcorp - 820
3,023 3,480
Under the new cash management reforms (NSW TC 15/01), effective 31 March 2015, the Corporation is not able to hold any 'at call' cash deposits with the NSW Treasury Corporation. Balances at 31 March 2015 were therefore transferred to the Corporation's bank account with the Westpac Banking Corporation, under the Treasury Banking System. See note 9 for details on restricted cash balances. See note 16 for details regarding credit risk, liquidity risk and market risk arising from financial instruments.
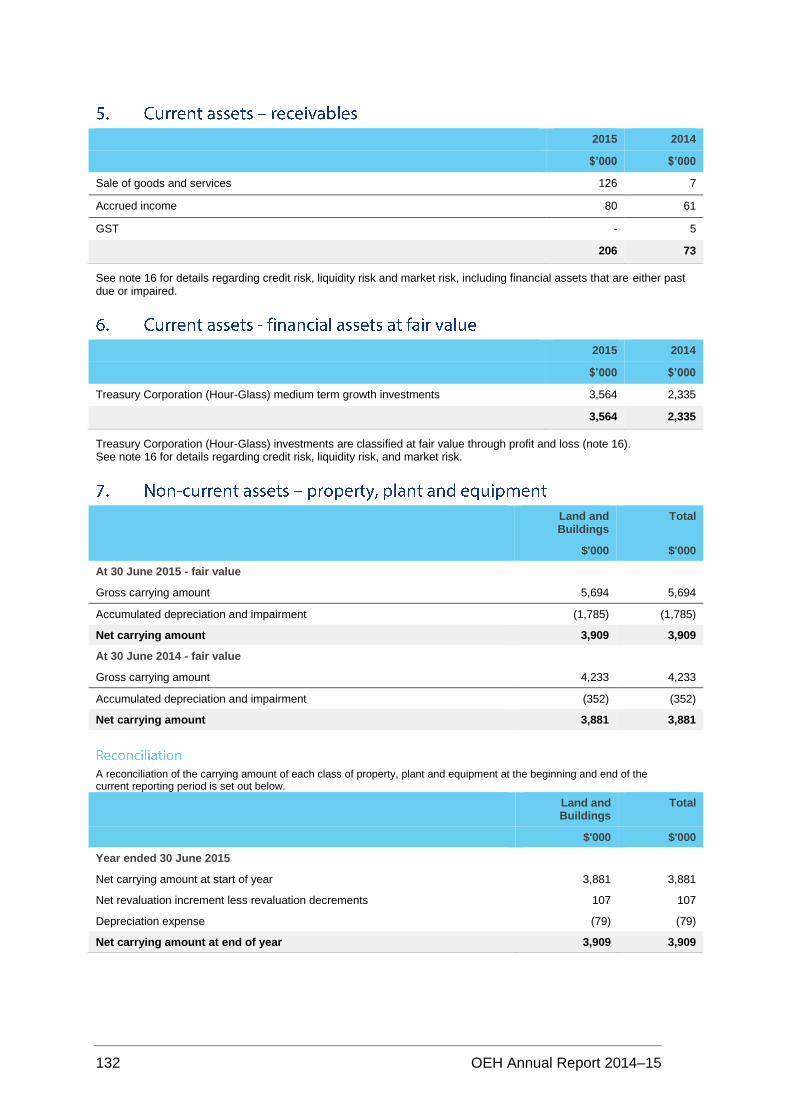
132 OEH Annual Report 2014–15
2015 2014
$’000 $’000
Sale of goods and services 126 7
Accrued income 80 61
GST - 5
206 73
See note 16 for details regarding credit risk, liquidity risk and market risk, including financial assets that are either past due or impaired.
2015 2014
$’000 $’000
Treasury Corporation (Hour-Glass) medium term growth investments 3,564 2,335
3,564 2,335
Treasury Corporation (Hour-Glass) investments are classified at fair value through profit and loss (note 16). See note 16 for details regarding credit risk, liquidity risk, and market risk.
Land and Buildings
Total
$'000 $'000
At 30 June 2015 - fair value
Gross carrying amount 5,694 5,694
Accumulated depreciation and impairment (1,785) (1,785)
Net carrying amount 3,909 3,909
At 30 June 2014 - fair value
Gross carrying amount 4,233 4,233
Accumulated depreciation and impairment (352) (352)
Net carrying amount 3,881 3,881
A reconciliation of the carrying amount of each class of property, plant and equipment at the beginning and end of the current reporting period is set out below.
Land and Buildings
Total
$'000 $'000
Year ended 30 June 2015
Net carrying amount at start of year 3,881 3,881
Net revaluation increment less revaluation decrements 107 107
Depreciation expense (79) (79)
Net carrying amount at end of year 3,909 3,909
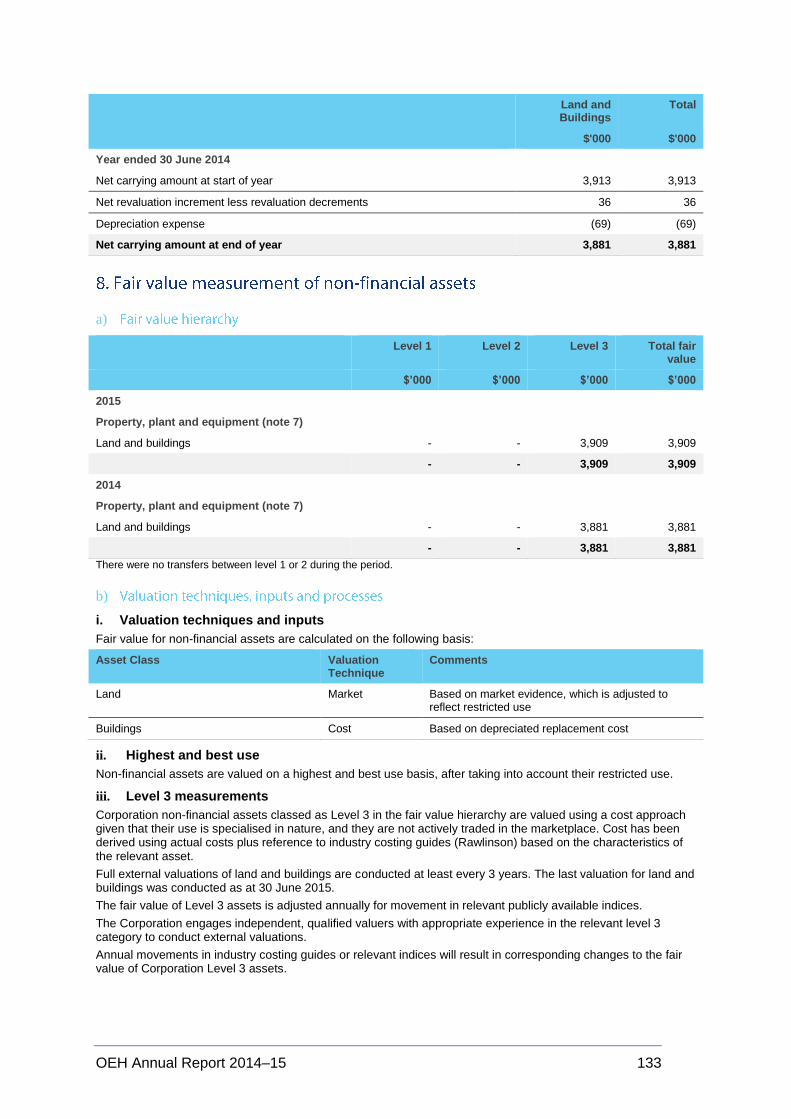
OEH Annual Report 2014–15 133
Land and Buildings
Total
$'000 $'000
Year ended 30 June 2014
Net carrying amount at start of year 3,913 3,913
Net revaluation increment less revaluation decrements 36 36
Depreciation expense (69) (69)
Net carrying amount at end of year 3,881 3,881
a)
Level 1 Level 2 Level 3 Total fair value
$’000 $’000 $’000 $’000
2015
Property, plant and equipment (note 7)
Land and buildings - - 3,909 3,909
- - 3,909 3,909
2014
Property, plant and equipment (note 7)
Land and buildings - - 3,881 3,881
- - 3,881 3,881
There were no transfers between level 1 or 2 during the period.
b)
i. Valuation techniques and inputs
Fair value for non-financial assets are calculated on the following basis:
Asset Class Valuation Technique
Comments
Land Market Based on market evidence, which is adjusted to reflect restricted use
Buildings Cost Based on depreciated replacement cost
ii. Highest and best use
Non-financial assets are valued on a highest and best use basis, after taking into account their restricted use.
iii. Level 3 measurements
Corporation non-financial assets classed as Level 3 in the fair value hierarchy are valued using a cost approach given that their use is specialised in nature, and they are not actively traded in the marketplace. Cost has been derived using actual costs plus reference to industry costing guides (Rawlinson) based on the characteristics of the relevant asset.
Full external valuations of land and buildings are conducted at least every 3 years. The last valuation for land and buildings was conducted as at 30 June 2015.
The fair value of Level 3 assets is adjusted annually for movement in relevant publicly available indices.
The Corporation engages independent, qualified valuers with appropriate experience in the relevant level 3 category to conduct external valuations.
Annual movements in industry costing guides or relevant indices will result in corresponding changes to the fair value of Corporation Level 3 assets.
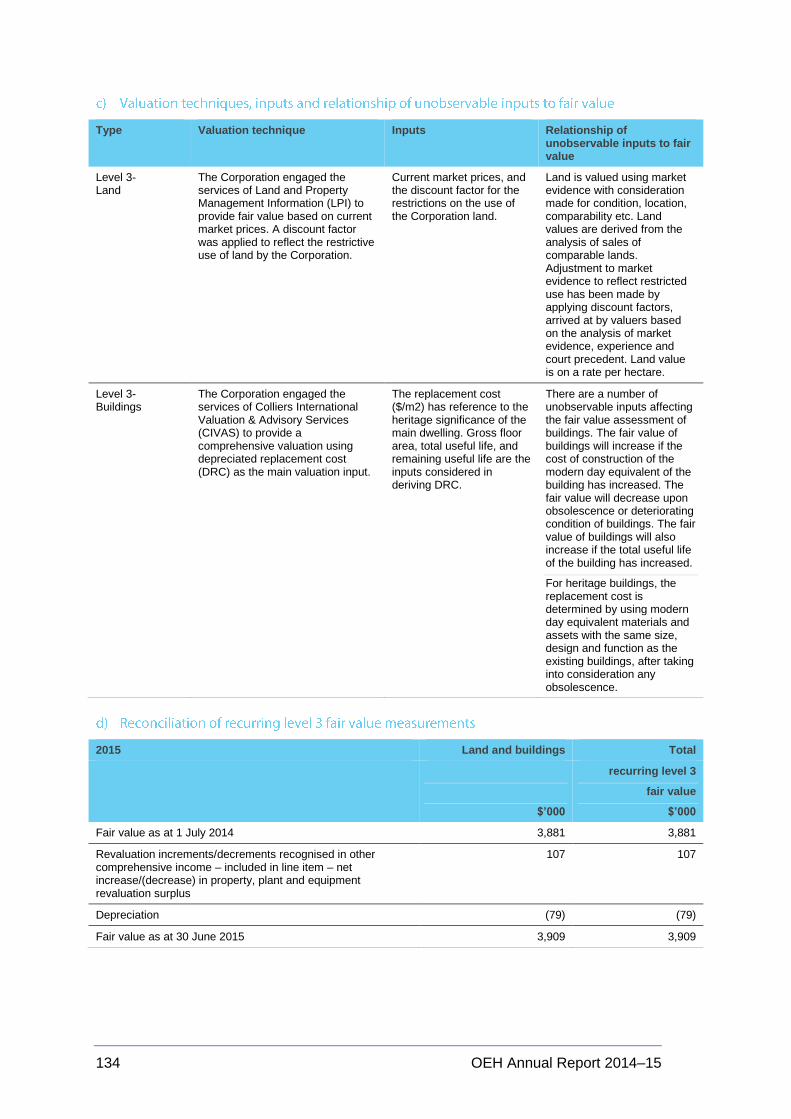
134 OEH Annual Report 2014–15
Type Valuation technique Inputs Relationship of unobservable inputs to fair value
Level 3- Land
The Corporation engaged the services of Land and Property Management Information (LPI) to provide fair value based on current market prices. A discount factor was applied to reflect the restrictive use of land by the Corporation.
Current market prices, and the discount factor for the restrictions on the use of the Corporation land.
Land is valued using market evidence with consideration made for condition, location, comparability etc. Land values are derived from the analysis of sales of comparable lands. Adjustment to market evidence to reflect restricted use has been made by applying discount factors, arrived at by valuers based on the analysis of market evidence, experience and court precedent. Land value is on a rate per hectare.
Level 3- Buildings
The Corporation engaged the services of Colliers International Valuation & Advisory Services (CIVAS) to provide a comprehensive valuation using depreciated replacement cost (DRC) as the main valuation input.
The replacement cost ($/m2) has reference to the heritage significance of the main dwelling. Gross floor area, total useful life, and remaining useful life are the inputs considered in deriving DRC.
There are a number of unobservable inputs affecting the fair value assessment of buildings. The fair value of buildings will increase if the cost of construction of the modern day equivalent of the building has increased. The fair value will decrease upon obsolescence or deteriorating condition of buildings. The fair value of buildings will also increase if the total useful life of the building has increased.
For heritage buildings, the replacement cost is determined by using modern day equivalent materials and assets with the same size, design and function as the existing buildings, after taking into consideration any obsolescence.
2015 Land and buildings Total
$’000
recurring level 3
fair value
$’000
Fair value as at 1 July 2014 3,881 3,881
Revaluation increments/decrements recognised in other comprehensive income – included in line item – net increase/(decrease) in property, plant and equipment revaluation surplus
107 107
Depreciation (79) (79)
Fair value as at 30 June 2015 3,909 3,909
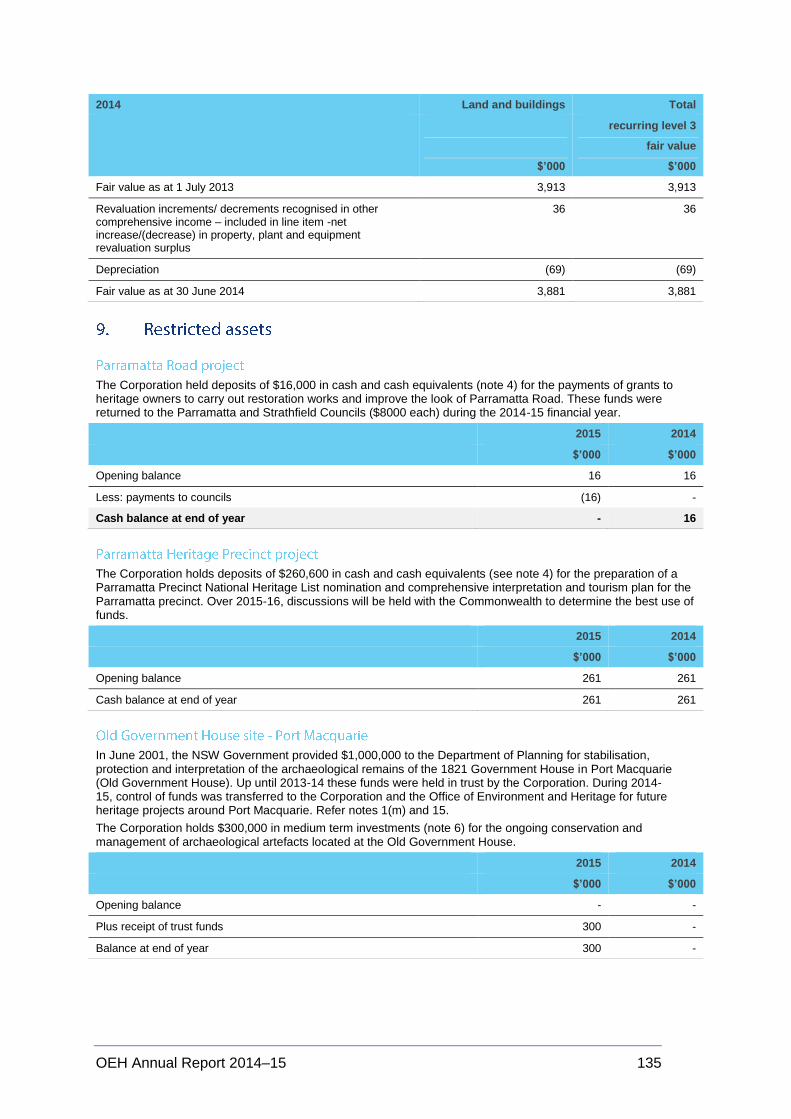
OEH Annual Report 2014–15 135
2014 Land and buildings Total
$’000
recurring level 3
fair value
$’000
Fair value as at 1 July 2013 3,913 3,913
Revaluation increments/ decrements recognised in other comprehensive income – included in line item -net increase/(decrease) in property, plant and equipment revaluation surplus
36 36
Depreciation (69) (69)
Fair value as at 30 June 2014 3,881 3,881
The Corporation held deposits of $16,000 in cash and cash equivalents (note 4) for the payments of grants to heritage owners to carry out restoration works and improve the look of Parramatta Road. These funds were returned to the Parramatta and Strathfield Councils ($8000 each) during the 2014-15 financial year.
2015 2014
$’000 $’000
Opening balance 16 16
Less: payments to councils (16) -
Cash balance at end of year - 16
The Corporation holds deposits of $260,600 in cash and cash equivalents (see note 4) for the preparation of a Parramatta Precinct National Heritage List nomination and comprehensive interpretation and tourism plan for the Parramatta precinct. Over 2015-16, discussions will be held with the Commonwealth to determine the best use of funds.
2015 2014
$’000 $’000
Opening balance 261 261
Cash balance at end of year 261 261
In June 2001, the NSW Government provided $1,000,000 to the Department of Planning for stabilisation, protection and interpretation of the archaeological remains of the 1821 Government House in Port Macquarie (Old Government House). Up until 2013-14 these funds were held in trust by the Corporation. During 2014-15, control of funds was transferred to the Corporation and the Office of Environment and Heritage for future heritage projects around Port Macquarie. Refer notes 1(m) and 15.
The Corporation holds $300,000 in medium term investments (note 6) for the ongoing conservation and management of archaeological artefacts located at the Old Government House.
2015 2014
$’000 $’000
Opening balance - -
Plus receipt of trust funds 300 -
Balance at end of year 300 -
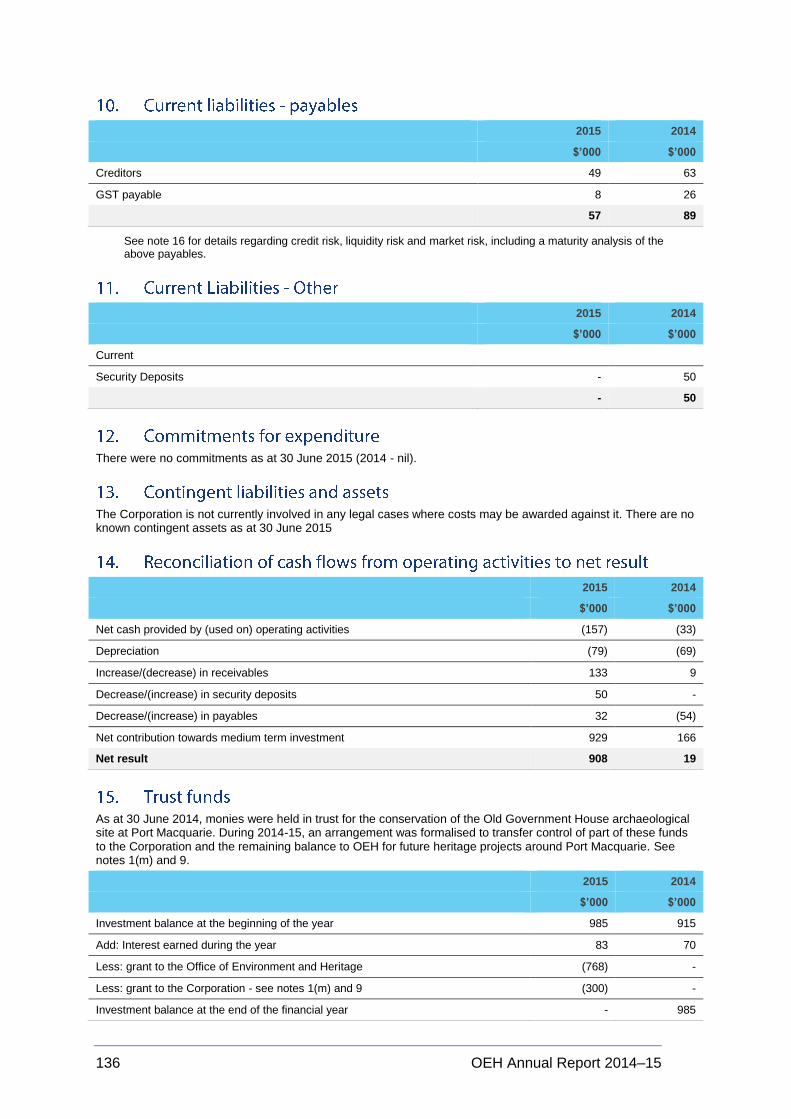
136 OEH Annual Report 2014–15
2015 2014
$’000 $’000
Creditors 49 63
GST payable 8 26
57 89
See note 16 for details regarding credit risk, liquidity risk and market risk, including a maturity analysis of the above payables.
2015 2014
$’000 $’000
Current
Security Deposits - 50
- 50
There were no commitments as at 30 June 2015 (2014 - nil).
The Corporation is not currently involved in any legal cases where costs may be awarded against it. There are no known contingent assets as at 30 June 2015
2015 2014
$’000 $’000
Net cash provided by (used on) operating activities (157) (33)
Depreciation (79) (69)
Increase/(decrease) in receivables 133 9
Decrease/(increase) in security deposits 50 -
Decrease/(increase) in payables 32 (54)
Net contribution towards medium term investment 929 166
Net result 908 19
As at 30 June 2014, monies were held in trust for the conservation of the Old Government House archaeological site at Port Macquarie. During 2014-15, an arrangement was formalised to transfer control of part of these funds to the Corporation and the remaining balance to OEH for future heritage projects around Port Macquarie. See notes 1(m) and 9.
2015 2014
$’000 $’000
Investment balance at the beginning of the year 985 915
Add: Interest earned during the year 83 70
Less: grant to the Office of Environment and Heritage (768) -
Less: grant to the Corporation - see notes 1(m) and 9 (300) -
Investment balance at the end of the financial year - 985
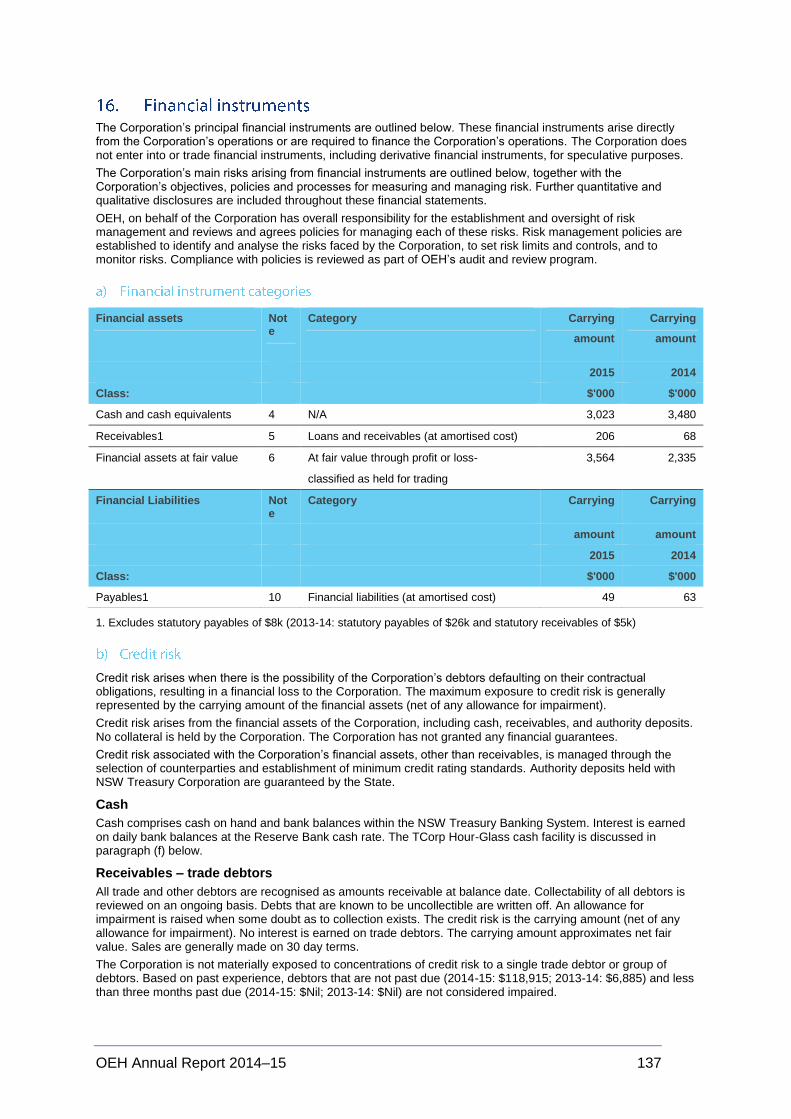
OEH Annual Report 2014–15 137
The Corporation’s principal financial instruments are outlined below. These financial instruments arise directly from the Corporation’s operations or are required to finance the Corporation’s operations. The Corporation does not enter into or trade financial instruments, including derivative financial instruments, for speculative purposes.
The Corporation’s main risks arising from financial instruments are outlined below, together with the Corporation’s objectives, policies and processes for measuring and managing risk. Further quantitative and qualitative disclosures are included throughout these financial statements.
OEH, on behalf of the Corporation has overall responsibility for the establishment and oversight of risk management and reviews and agrees policies for managing each of these risks. Risk management policies are established to identify and analyse the risks faced by the Corporation, to set risk limits and controls, and to monitor risks. Compliance with policies is reviewed as part of OEH’s audit and review program.
Financial assets
Note
Category
Carrying
amount
Carrying
amount
2015 2014
Class: $'000 $'000
Cash and cash equivalents 4 N/A 3,023 3,480
Receivables1 5 Loans and receivables (at amortised cost) 206 68
Financial assets at fair value 6 At fair value through profit or loss- 3,564 2,335
classified as held for trading
Financial Liabilities Note
Category Carrying Carrying
amount amount
2015 2014
Class: $'000 $'000
Payables1 10 Financial liabilities (at amortised cost) 49 63
1. Excludes statutory payables of $8k (2013-14: statutory payables of $26k and statutory receivables of $5k)
Credit risk arises when there is the possibility of the Corporation’s debtors defaulting on their contractual obligations, resulting in a financial loss to the Corporation. The maximum exposure to credit risk is generally represented by the carrying amount of the financial assets (net of any allowance for impairment).
Credit risk arises from the financial assets of the Corporation, including cash, receivables, and authority deposits. No collateral is held by the Corporation. The Corporation has not granted any financial guarantees.
Credit risk associated with the Corporation’s financial assets, other than receivables, is managed through the selection of counterparties and establishment of minimum credit rating standards. Authority deposits held with NSW Treasury Corporation are guaranteed by the State.
Cash
Cash comprises cash on hand and bank balances within the NSW Treasury Banking System. Interest is earned on daily bank balances at the Reserve Bank cash rate. The TCorp Hour-Glass cash facility is discussed in paragraph (f) below.
Receivables – trade debtors
All trade and other debtors are recognised as amounts receivable at balance date. Collectability of all debtors is reviewed on an ongoing basis. Debts that are known to be uncollectible are written off. An allowance for impairment is raised when some doubt as to collection exists. The credit risk is the carrying amount (net of any allowance for impairment). No interest is earned on trade debtors. The carrying amount approximates net fair value. Sales are generally made on 30 day terms.
The Corporation is not materially exposed to concentrations of credit risk to a single trade debtor or group of debtors. Based on past experience, debtors that are not past due (2014-15: $118,915; 2013-14: $6,885) and less than three months past due (2014-15: $Nil; 2013-14: $Nil) are not considered impaired.
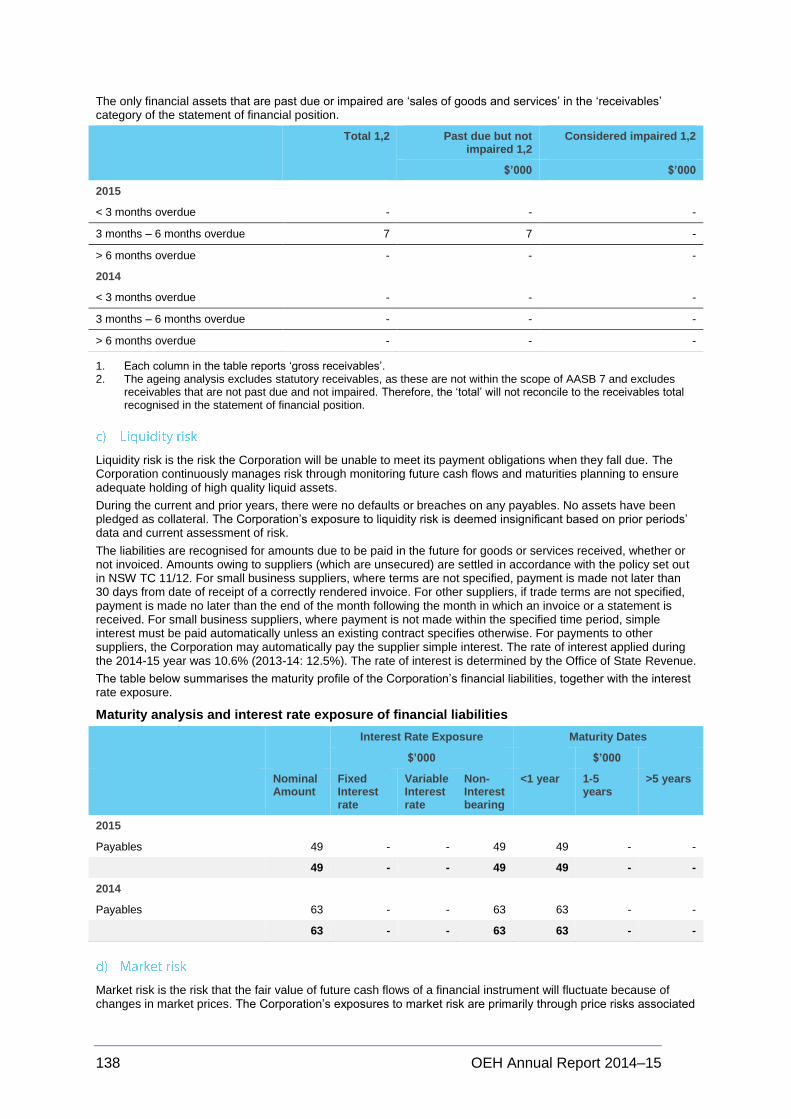
138 OEH Annual Report 2014–15
The only financial assets that are past due or impaired are ‘sales of goods and services’ in the ‘receivables’ category of the statement of financial position.
Total 1,2 Past due but not impaired 1,2
Considered impaired 1,2
$’000 $’000
2015
< 3 months overdue - - -
3 months – 6 months overdue 7 7 -
> 6 months overdue - - -
2014
< 3 months overdue - - -
3 months – 6 months overdue - - -
> 6 months overdue - - -
1. Each column in the table reports ‘gross receivables’. 2. The ageing analysis excludes statutory receivables, as these are not within the scope of AASB 7 and excludes
receivables that are not past due and not impaired. Therefore, the ‘total’ will not reconcile to the receivables total recognised in the statement of financial position.
Liquidity risk is the risk the Corporation will be unable to meet its payment obligations when they fall due. The Corporation continuously manages risk through monitoring future cash flows and maturities planning to ensure adequate holding of high quality liquid assets.
During the current and prior years, there were no defaults or breaches on any payables. No assets have been pledged as collateral. The Corporation’s exposure to liquidity risk is deemed insignificant based on prior periods’ data and current assessment of risk.
The liabilities are recognised for amounts due to be paid in the future for goods or services received, whether or not invoiced. Amounts owing to suppliers (which are unsecured) are settled in accordance with the policy set out in NSW TC 11/12. For small business suppliers, where terms are not specified, payment is made not later than 30 days from date of receipt of a correctly rendered invoice. For other suppliers, if trade terms are not specified, payment is made no later than the end of the month following the month in which an invoice or a statement is received. For small business suppliers, where payment is not made within the specified time period, simple interest must be paid automatically unless an existing contract specifies otherwise. For payments to other suppliers, the Corporation may automatically pay the supplier simple interest. The rate of interest applied during the 2014-15 year was 10.6% (2013-14: 12.5%). The rate of interest is determined by the Office of State Revenue.
The table below summarises the maturity profile of the Corporation’s financial liabilities, together with the interest rate exposure.
Maturity analysis and interest rate exposure of financial liabilities
Interest Rate Exposure Maturity Dates
$’000 $’000
Nominal Amount
Fixed Interest rate
Variable Interest rate
Non-Interest bearing
<1 year 1-5 years
>5 years
2015
Payables 49 - - 49 49 - -
49 - - 49 49 - -
2014
Payables 63 - - 63 63 - -
63 - - 63 63 - -
Market risk is the risk that the fair value of future cash flows of a financial instrument will fluctuate because of changes in market prices. The Corporation’s exposures to market risk are primarily through price risks associated
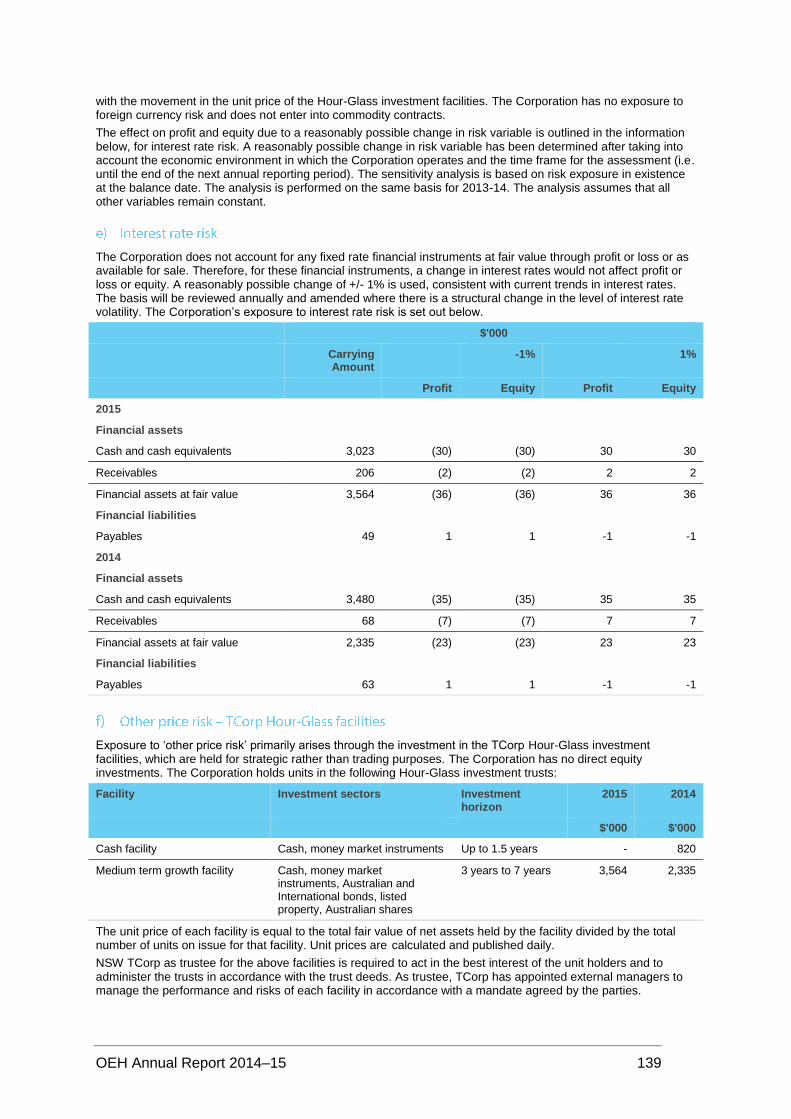
OEH Annual Report 2014–15 139
with the movement in the unit price of the Hour-Glass investment facilities. The Corporation has no exposure to foreign currency risk and does not enter into commodity contracts.
The effect on profit and equity due to a reasonably possible change in risk variable is outlined in the information below, for interest rate risk. A reasonably possible change in risk variable has been determined after taking into account the economic environment in which the Corporation operates and the time frame for the assessment (i.e. until the end of the next annual reporting period). The sensitivity analysis is based on risk exposure in existence at the balance date. The analysis is performed on the same basis for 2013-14. The analysis assumes that all other variables remain constant.
The Corporation does not account for any fixed rate financial instruments at fair value through profit or loss or as available for sale. Therefore, for these financial instruments, a change in interest rates would not affect profit or loss or equity. A reasonably possible change of +/- 1% is used, consistent with current trends in interest rates. The basis will be reviewed annually and amended where there is a structural change in the level of interest rate volatility. The Corporation’s exposure to interest rate risk is set out below.
$'000
Carrying Amount
-1% 1%
Profit Equity Profit Equity
2015
Financial assets
Cash and cash equivalents 3,023 (30) (30) 30 30
Receivables 206 (2) (2) 2 2
Financial assets at fair value 3,564 (36) (36) 36 36
Financial liabilities
Payables 49 1 1 -1 -1
2014
Financial assets
Cash and cash equivalents 3,480 (35) (35) 35 35
Receivables 68 (7) (7) 7 7
Financial assets at fair value 2,335 (23) (23) 23 23
Financial liabilities
Payables 63 1 1 -1 -1
Exposure to ‘other price risk’ primarily arises through the investment in the TCorp Hour-Glass investment facilities, which are held for strategic rather than trading purposes. The Corporation has no direct equity investments. The Corporation holds units in the following Hour-Glass investment trusts:
Facility Investment sectors Investment horizon
2015 2014
$'000 $'000
Cash facility Cash, money market instruments Up to 1.5 years - 820
Medium term growth facility Cash, money market instruments, Australian and International bonds, listed property, Australian shares
3 years to 7 years 3,564 2,335
The unit price of each facility is equal to the total fair value of net assets held by the facility divided by the total number of units on issue for that facility. Unit prices are calculated and published daily.
NSW TCorp as trustee for the above facilities is required to act in the best interest of the unit holders and to administer the trusts in accordance with the trust deeds. As trustee, TCorp has appointed external managers to manage the performance and risks of each facility in accordance with a mandate agreed by the parties.
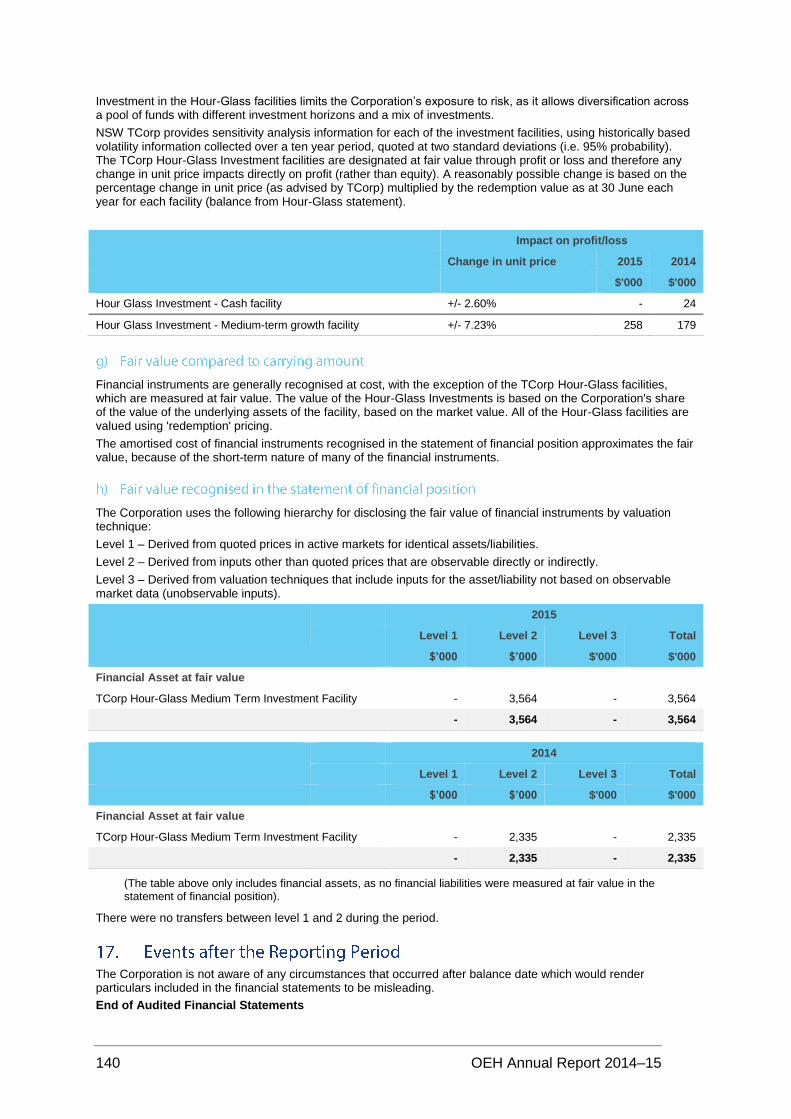
140 OEH Annual Report 2014–15
Investment in the Hour-Glass facilities limits the Corporation’s exposure to risk, as it allows diversification across a pool of funds with different investment horizons and a mix of investments.
NSW TCorp provides sensitivity analysis information for each of the investment facilities, using historically based volatility information collected over a ten year period, quoted at two standard deviations (i.e. 95% probability). The TCorp Hour-Glass Investment facilities are designated at fair value through profit or loss and therefore any change in unit price impacts directly on profit (rather than equity). A reasonably possible change is based on the percentage change in unit price (as advised by TCorp) multiplied by the redemption value as at 30 June each year for each facility (balance from Hour-Glass statement).
Impact on profit/loss
Change in unit price 2015 2014
$'000 $'000
Hour Glass Investment - Cash facility +/- 2.60% - 24
Hour Glass Investment - Medium-term growth facility +/- 7.23% 258 179
Financial instruments are generally recognised at cost, with the exception of the TCorp Hour-Glass facilities, which are measured at fair value. The value of the Hour-Glass Investments is based on the Corporation's share of the value of the underlying assets of the facility, based on the market value. All of the Hour-Glass facilities are valued using 'redemption' pricing.
The amortised cost of financial instruments recognised in the statement of financial position approximates the fair value, because of the short-term nature of many of the financial instruments.
The Corporation uses the following hierarchy for disclosing the fair value of financial instruments by valuation technique:
Level 1 – Derived from quoted prices in active markets for identical assets/liabilities.
Level 2 – Derived from inputs other than quoted prices that are observable directly or indirectly.
Level 3 – Derived from valuation techniques that include inputs for the asset/liability not based on observable market data (unobservable inputs).
2015
Level 1 Level 2 Level 3 Total
$’000 $’000 $'000 $'000
Financial Asset at fair value
TCorp Hour-Glass Medium Term Investment Facility - 3,564 - 3,564
- 3,564 - 3,564
2014
Level 1 Level 2 Level 3 Total
$’000 $’000 $'000 $'000
Financial Asset at fair value
TCorp Hour-Glass Medium Term Investment Facility - 2,335 - 2,335
- 2,335 - 2,335
(The table above only includes financial assets, as no financial liabilities were measured at fair value in the statement of financial position).
There were no transfers between level 1 and 2 during the period.
The Corporation is not aware of any circumstances that occurred after balance date which would render particulars included in the financial statements to be misleading.
End of Audited Financial Statements
OEH Annual Report 2014–15 141
Office of Environment and Heritage (OEH) and National Parks and Wildlife Service (NPWS)
Head office: Sydney CBD Level 14, 59 Goulburn Street Sydney, NSW 2000
Australia
Mail:
Head Office PO Box A290 Sydney South, NSW 1232 Australia
Phone:
Main switchboard: (02) 9995 5000 Environment Line: 131 555 (local call from landlines within NSW) or (02) 9995 5555 (from outside of NSW)
Website:
www.environment.nsw.gov.au
Email:
Please include what you are inquiring about in the subject line.
Visit our offices:
Information Centre
Head office: Sydney CBD
Level 14, 59 Goulburn Street
Relay calls:
If you are deaf, or have a hearing impairment or speech impairment, contact us through the National Relay Service. TTY/voice: 133 677 Speak & listen: 1300 555 727
Fax:
(02) 9995 5999
Business hours:
8.30am to 5.00pm Monday to Friday
Metropolitan and Regional Offices:
Business Hours: 9:00am to 5.00pm Monday to Friday