olstein financial alert fund chairman’s message august 24 ... · pdf...
TRANSCRIPT

THE FINANCIAL ALERT FUNDOLSTEIN
1
Chairman’s Message August 24, 2006
LONG-TERM RETURNS AND DIFFERENTIATING VALUE FROM VALUE TRAPS
Dear Shareholders:
EMPHASIZING LONG-TERM RETURNS
For the fiscal year ended June 30, 2006, the Fund underperformed the S&P 500® Index (4.59% for theFund’s Class C shares versus 8.63% for the Index). However, for the ten-year, five-year and three-year periodsended June 30, 2006, the average annual returns of The Olstein Financial Alert Fund outperformed theannualized returns of the S&P 500® Index, as listed below:
Time Periods Average Annual Returns(ending 6/30/2006) OFALX S&P 500® Index__________________ _______ _______________1 year 4.59% 8.63%3 years 12.05% 11.22%5 years 4.10% 2.49%10 years 14.46% 8.32%
The Fund has experienced other periods of underperformance, which include calendar years 1998 and 2005,and the first six months of 2006.
Average Annual ReturnsTime Periods OFALX S&P 500® Index____________ _______ _______________1998 15.01% 28.58%2005 2.79% 4.91%Six months ended 6/30/06 -0.24% 2.71%
While past performance is not necessarily indicative of future results, the above illustration of the Fund’shistorical longer term and recent performance data compared to the broad market benchmark (the S&P500® Index) emphasizes our long held belief that there is a high correlation between paying attention topurchasing companies at discounted prices and achieving the Fund’s long-term investment objectives.However, discounted prices often occur when investor crowd perception and/or psychology are undulynegative, which usually requires time to change. Many of the stocks that generated our long-term investmentresults were not ideas whose implications were seen as obvious by the investing public, which is precisely thereason we were able to purchase these securities at a discount. On Wall Street, the fact that future values are___________The performance data quoted represents past performance and does not guarantee future results. The above chart pertainsto the Fund’s Class C shares, and assumes no redemptions. The returns mentioned do not reflect deduction of the Fund’s1% maximum contingent deferred sales charge (“CDSC”) for Class C shares imposed when an investor redeems Class Cshares within the first year of purchase. The Fund’s Class C average annual return for the ten-year, five-year, and one-yearperiods ended 6/30/06, assuming reinvestment of dividends and capital gain distributions and deduction of the Fund’smaximum CDSC during the one-year period, was 14.46%, 4.10%, and 3.59%, respectively. The investment return andprincipal value of an investment will fluctuate so that an investor’s shares, when redeemed, may be worth more or less thantheir original cost. Current performance may be lower or higher than performance quoted. To obtain performance datacurrent to the most recent month end, please go to our website at www.olsteinfunds.com. Performance for other share classeswill vary. Not FDIC insured / Not bank-guaranteed / May lose value.
Performance data quoted represents past performance. Past performance does not guarantee future results. All performance stated in this document assumes the reinvestment of dividends and capital gains. We caution shareholders that we can never predict or assure future returns on investments. The investment return and principal value of an investment with our Funds will fluctuate over time so that your shares, when redeemed, may be with more or less than their original cost. Current performance may be lower or higher than the performance data quoted. Click the following links for the annual expense ratios and standardized performance current to the most recent quarter and month end periods for The Olstein All Cap Value Fund.

not obvious usually results in a period of stock underperformance until the catalyst becomes obvious. Overthe past ten years, the Fund’s long-term performance has been the result of an investment philosophy andprocess that requires long-term perspectives, reflection, and proprietary valuation techniques in the face ofshort-term bad news and negative crowd psychology. It is our belief that the attempt to perform all of thetime will take us out of our long-term game plan of performing over time. Looking at finite returns todetermine long-term results is similar to the crowd determining who will win a tennis match by looking atone point.
WHEN WARRANTED, CHANGE THE PORTFOLIO BUT NOT THE DISCIPLINE
Managing a value portfolio can be a frustrating and humbling experience, when our valuations for the stocksin the portfolio either take longer to emerge or do not emerge at all. Although we constantly monitor andevaluate our portfolio positions as relevant events unfold, we use these frustrating periods to re-evaluate eachportfolio holding; reassess our expectations for each company’s ability to produce future free cash flow, andchallenge our understanding of each company’s competitive environment and strategic choices. We alsodetermine which of the companies in our portfolio have had falling equity prices due to short-term factorssuch as quarterly earnings disappointments or non-recurring events, and which companies have beenaffected by fundamental shifts within their industry or company that are likely to have a lasting negativeimpact, and as a result, call into question the validity of our free cash flow projections and resultingvaluations. Mistakes are pruned from the portfolio immediately and the sale proceeds are either reinvestedinto companies that we believe have higher probabilities of reaching the Fund’s long-term investmentobjectives, or moved to the sidelines (to earn interest income) and be available to initiate positions ininvestment ideas that eventually reach our discount threshold. On the other hand, we generally add topositions in companies as their stock prices fall further away from our estimate of private market value… butonly if the decline is related to short-term factors, faulty misperceptions, or just plain old negative psychology.Our commitment to our disciplined investment process obliges us to make changes to the portfolio asneeded, and to take advantage of potential opportunities that arise from an ever-changing landscape, but thelong-term investment discipline remains the same.
REMOVING EGO FROM THE INVESTMENT PROCESS
In my 38 years as an investment professional, I have consistently seen investment managers and investors staywith bad investment decisions due to one important factor… ego. Ego can insert itself in the investmentprocess in several ways, including:
1. Changing the reason for owning a stock rather than admitting to a flawed investment thesis.
2. A tendency to overvalue ideas selected personally, which creates biases when owning up to making amistake.
3. The normal tendency to emphasize investment successes while minimizing investment failures as non-recurring, thereby creating a false sense of confidence.
4. Framing problems or decision-making situations to support a desired outcome.
To admit a mistake is ego deflating. However, protecting one’s ego by avoiding the realization of a loss,rather than re-employing the proceeds into stocks that in our opinion offer higher probabilities of greater
2
Chairman’s Message – continued
THE FINANCIAL ALERT FUNDOLSTEIN

appreciation, is an impediment to long-term performance. We seek to minimize the intrusion of ego intoour investment process in two related ways:
1. through teamwork and
2. a rigorous investment review process that values the analysis and insight of each team member foreach portfolio holding.
Value investing is about performing over time and growing shareholder value, and has nothing to do withego. Our process seeks to recognize mistakes in a timely manner and re-employ the proceeds into stockswhich, in our opinion, offer higher probabilities for appreciation. In this regard, after rigorous team review,old media stocks (Grey Television, Tribune, Gannett, and Journal Register) and Pier One were pruned fromthe portfolio because we believed our assumptions were wrong. On the other hand, Marsh McLennan is anexample of a stock, which has declined since our original purchase (most recently on short-term concernsaffecting the overall financial services industry), yet we continue to believe that our expectations of futurecash flow are justified by company specific factors, and we have therefore added to our position as the stockhas fallen.
BETTER VALUES OR VALUE TRAPS
How do we determine when a stock is falling whether we believe it is temporarily out of favor or has turnedinto a value trap? There are two main risks that we assess when valuing a company. Financial risk relates tohow a company is capitalized (debt ratios, excess cash, etc.), the realism of its reporting practices, and mostimportantly its ability to withstand bad times without having to resort to short-term solutions that are not inthe long-term interests of the company. Operating risk relates to the accuracy of future estimates of acompany’s ability to produce free cash flow from its basic business. Thus, the accuracy of our valuations isbased on our ability to accurately predict future excess cash flow. We do not want to accept financial riskbecause a company’s inability to withstand bad times could result in permanent damage to a company’svaluation. Material losses in a portfolio are far more damaging to the portfolio’s long-term financial healththan material gains. Let us not forget a portfolio that increases 80% followed by a 50% loss is down 10%, notup 30%. A $100,000 portfolio that increases 80% in year one appreciates to $180,000…a 50% decline in yeartwo results in a portfolio worth $90,000 at year-end.
Our methodology of defending against financial risk is to seek companies that generate, or are expected togenerate, excess free cash flow, have financial statements that are understandable and in accord witheconomic reality, and have balance sheets that can withstand bad times. Excess cash flow companies can buyback stock, raise the dividend, make strategic acquisitions when others may not be able to, and do not have toadopt short-term strategies that are not in the long-term interests of the company. These companiesrepresent outstanding acquisition candidates.
When we originally purchased Pier One, at what we believed were discount prices created by an initial miss ofproduct trends, the company had material excess cash balances and was still generating excess cash flow(although diminished). We believed the out of favor product line was temporary, and if the company wassuccessful in turning around its merchandise selection, a return to normalized margins could create excesscash flow potential of over $1.50 per share on a stock we purchased for an average cost of $14.76 a sharebetween June 2004 and September of 2005. The company’s balance sheet had net cash of $100 million withno debt, and even though earnings were below former levels, the company was continuing to generate excess
3
Chairman’s Message – continued
THE FINANCIAL ALERT FUNDOLSTEIN

cash flow. The balance sheet and cash flow metrics provided the company with a financial cushion while itsought to redesign its merchandise selection and return earnings to former levels.
As Pier One continued to struggle to find the right merchandising mix, excess cash flow turned negative, theexcess cash margin was being drawn down and our margin of safety was being reduced. We began to worryabout both the company’s ability to produce free cash flow and its deteriorating balance sheet. The companycontinued to have fashion missteps resulting in increasing inventories relative to sales and reduced cashpositions. We reached a sell decision since we were no longer confident in our valuation based onpredictable free cash flow, while the balance sheet was no longer providing us with enough support towithstand continued merchandising missteps.
During the latest fiscal year, we also had to reach similar conclusions on some of our older media stocks suchas the Tribune, Gannett, Journal Register and Gray Television. The Internet has continued to make rapidinroads into the traditional newspaper industry advertising model, resulting in reduced free cash flowexpectations and reduced valuations, and a sell decision with 25% losses since we began buying thesecompanies three years ago. We did not expect the Internet to make such rapid inroads into the stable cashflow models of the old media companies. We were too optimistic in our assumptions regarding the cash flowbases of these older companies.
In direct contrast, although Marsh McLennan stock has declined since our initial purchase, we believe thatthe company’s capable management team is making long-term decisions that should result in future free cashflow exceeding $2.00 per share. At the present time, there are no indications that our future expectations arenot achievable. Marsh McLennan is already achieving free cash flow and the balance sheet has begun toimprove. Our valuation remains above current prices. We have continued to add to our position, despite theshort-term negativity surrounding the stock that has resulted in the stock declining below our initial purchaseprice. Our discipline dictates that we usually add to positions as stock prices fall further from our valuation aslong as our future free cash flow expectations are continuing to support our valuation. Thus, as theprobabilities of success increase (market price falls further from our estimate of private market value), weincrease our positions. As the spreads narrow, we decrease our position.
NOT ALL SALES ARE FAILURES
Office Depot was also sold during the current fiscal year at prices that exceeded our initial purchase in 2004by more than 100%. Our valuation for Office Depot increased throughout the 18 months the Fund hadinvested in the company as cash flow expectations continued to exceed our original estimates. However, wecontinued to prune our position as deviations between the stock’s price and our estimate of private marketvalue narrowed. Office Depot finally reached what we call perfection pricing (market prices equaled ourestimates of private value) and our remaining position was liquidated with the cash moved to the sidelineawaiting other opportunities. Scientific Games (SGMS) is another stock that was initially purchased in 2001at one eighth of our most current sale price. Our position in SGMS has been reduced throughout our fiveyear holding period in order to control risk (size of position compared to our calculation of the discount)and still remains a portfolio holding at almost eight times our initial purchase price. Our original estimatesof growth and free cash flow were reasonably conservative, but the company’s ability to capitalize on theburgeoning public lottery market and its effective use of cash proceeds justified our increased valuations overthe period we have held its common stock. We are extremely flexible in assessing what actually transpires
4
Chairman’s Message – continued
THE FINANCIAL ALERT FUNDOLSTEIN

versus our original estimates and our valuation models react to deviations between expectations and reality.In certain cases, the new facts tell us to sell, other times to buy, and we do not get caught up in ego issues asto whether the decision results in a loss or a gain.
THE CURRENT ENVIRONMENT
As a final note, all stocks are vulnerable to rising interest rates and the resulting impact on investorpsychology. As interest rates rise, stock valuations tend to decline as U.S. Treasury securities represent acompetitive lower risk alternative to investing in equities. However, it is significant to note that currentinterest rates are no higher than they were from 1995 to 2000 when the ten-year U.S. Treasury rate averaged6.34% (the current ten-year rate is approximately 5%). The psychology of crowds can change in a minute,and rather than joining crowd psychology, we choose to take advantage of overreactions caused by what webelieve is “groupthink”.
On December 31, 1999, the S&P 500® Index closed at 1,469.25 On June 30, 2006, the Index closed at1,270.20, which amounts to an approximate 13.5% cumulative decline over the five and one half year period.In 1999, the S&P 500® Index companies earned $45.00 a share whereas in 2006, our current estimate is$85.00 a share. The price earnings ratio of the S&P 500® Index has fallen from 32 times earnings in 1999 tounder 15 times estimated earnings for 2006.
We believe that the market has finally grown into its earnings shoes. Although our cash position is currentlyin excess of 15%, we are beginning to find values in larger companies such as American Express, AIGInternational, 3M and Cisco, which are not only new holdings, but first time holdings for the Fund. It standsto reason that if earnings have almost doubled over a time period in which the market is down, values shouldbegin to emerge. We believe that despite the negative psychology surrounding the stock market,opportunities are beginning to develop, which we believe could increase our chances of achieving the Fund’sinvestment objectives.
COMMITTED TO OUR DISCIPLINE
Rather than drawing attention to a fund’s short-term results, we prefer to explain our discipline in detail andallow our shareholders the opportunity to conclude that they can identify with its long-term goals. Inconsidering the probability of achieving one’s investment objectives via an investment in the Fund and thediscipline it employs, we believe that it is important to emphasize long-term returns in conjunction with theFund’s investment process. The best way to analyze the Fund’s long-term investment results is to carefullyreview the table at the end of this letter illustrating the growth, on a quarterly basis, of a hypothetical $10,000investment made in the Fund’s Class C Shares at its inception date of September 21, 1995.
We remain committed to our discipline which: emphasizes identifying downside risk before evaluating upsidepotential; emphasizes valuations based on excess free cash flow; looks behind a company’s reported numbersand demands accounting practices that reflect the economic reality of a business. We are working diligentlyto make changes to our portfolio as warranted and to take advantage of the changing landscape. We believethat our discipline is not dead, it has just been resting.
5
OLSTEIN
Chairman’s Message – continued
THE FINANCIAL ALERT FUND

Management continues to have a material investment in the Fund alongside our shareholders, and we sharecommon goals and objectives. We appreciate your trust.
Sincerely,
Robert A. OlsteinChairman andChief Investment Officer
The following chart illustrates the growth, on a quarterly basis, of a hypothetical $10,000 investment made inthe Fund’s Class C share at the Fund’s inception date of September 21, 1995. (with dividends and capital gaindistributions reinvested but no deduction of taxes on reinvested distributions – see “Details”)
Value of Shares Owned, Value of Shares Owned, If Initial Investment If Initial Investment
Date was $10,000 Date was $10,000_____ ________________________ _____ ________________________
9/21/95 $10,000 3/31/01 $30,2079/30/95 10,010 6/30/01 36,192
12/31/95 10,261 9/30/01 28,2133/31/96 10,882 12/31/01 35,3406/30/96 11,462 3/31/02 38,2599/30/96 11,713 6/30/02 33,797
12/31/96 12,760 9/30/02 25,8703/31/97 13,327 12/31/02 28,5296/30/97 14,602 3/31/03 26,2269/30/97 17,250 6/30/03 31,448
12/31/97 17,205 9/30/03 33,7973/31/98 19,851 12/31/03 38,8536/30/98 18,468 3/31/04 40,8709/30/98 15,499 6/30/04 41,297
12/31/98 19,788 9/30/04 39,0433/31/99 20,717 12/31/04 43,1466/30/99 25,365 3/31/05 42,6409/30/99 23,675 6/30/05 42,302
12/31/99 26,692 9/30/05 43,7493/31/00 28,170 12/31/05 44,3506/30/00 28,899 3/31/06 46,5669/30/00 30,596 6/30/06 44,241
12/31/00 30,142
6
OLSTEINTHE FINANCIAL ALERT FUND
Chairman’s Message – continued
Details
The performance data quoted represents past performance and does not guarantee future results. The above chart pertainsto the Fund’s Class C shares, and assumes no redemptions. The returns mentioned do not reflect deduction of the Fund’s1% maximum contingent deferred sales charge (“CDSC”) for Class C shares imposed when an investor redeems Class Cshares within the first year of purchase. The Fund’s Class C average annual return for the ten-year, five-year, and one-yearperiods ended 6/30/06, assuming reinvestment of dividends and capital gain distributions and deduction of the Fund’smaximum CDSC during the one-year period, was 14.46%, 4.10%, and 3.59%, respectively. The investment return andprincipal value of an investment will fluctuate so that an investor’s shares, when redeemed, may be worth more or less thantheir original cost. Current performance may be lower or higher than performance quoted. To obtain performance datacurrent to the most recent month end, please go to our website at www.olsteinfunds.com. Performance for other share classeswill vary. Not FDIC insured / Not bank-guaranteed / May lose value.
The S&P 500® Index is an unmanaged index created by Standard & Poor’s Corporation that includes a representativesample of 500 leading companies in leading industries of the U.S. economy and is considered representative of the U.S.stock-market performance in general. The S&P 500® Index is not an investment product available for purchase.
Source for U.S. Treasury Rates: MSCI U.S. Treasury 10-year average yield via Bloomberg.
As of 6/30/06 the Fund maintained a position in the following securities mentioned above, and is subject to change:Marsh McLennan (3.20%), Scientific Games (0.73%), American Express (0.99%), 3M (1.25%), AIG International(2.09%) and Cisco (2.12%). As of 6/30/06 the Fund did not maintain a position in the following securities mentionedabove, and is subject to change: Grey Television, Tribune, Gannett, Journal Register, Pier One and Office Depot. Thereferences to securities are not buy or sell recommendations. The references are intended to be descriptive examples of theFund’s investment philosophy. Do not make investments based on the securities referenced above.
The above commentary represents the opinion of the Manager, and is not intended to be a forecast of future events, aguarantee of future results, or investment advice. This information should be preceded or accompanied by a currentprospectus, which contains more complete information, including investment objectives, risks, and charges and expenses ofthe Fund and should be read carefully before investing. A current prospectus may be obtained by calling (800) 799-2113 orby visiting the Fund’s website at www.olsteinfunds.com.
7
Chairman’s Message – continued
THE FINANCIAL ALERT FUNDOLSTEIN

8
Chairman’s Message – continued
THE FINANCIAL ALERT FUNDOLSTEIN
$10,000
$15,000
$20,000
$25,000
$30,000
$35,000
$40,000
$45,000
8/31/95 8/31/96 8/31/97 8/31/98 8/31/99 8/31/20008/31/20018/31/20028/31/20038/31/20048/31/20058/31/2006
Olstein Financial Alert Fund – Class C S&P 500® Index Russell 3000® Index
9/21/95
$44,241
$26,221
8/31/00 8/31/01 8/31/02 8/31/03 6/30/04(4) 6/30/05
$26,032
6/30/06
(1) Assumes reinvestment of dividends and capital gains. Also includes all expenses at the end of each period and reflects the deductionof the appropriate CDSC as if an investor had redeemed at the end of the one year period, and thus represents a “net return.” Pastperformance is not necessarily indicative of future results. Investment returns and principal values may fluctuate, so that, whenredeemed, shares may be worth more or less than their original cost.
(2) The Russell 3000® Index reflects the broad U.S. equity universe and represents approximately 98% of the U.S. market. Russell 3000Index return is adjusted upward to reflect reinvested dividends, but does not reflect the deduction of any fees or expenses associatedwith investments in the index, and thus represents a “gross return.”
(3) S&P 500® Index return is adjusted upward to reflect reinvested dividends, but does not reflect the deduction of any fees or expensesassociated with investment in the index, and thus represents a “gross return.”
(4) On April 29, 2004, the Fund’s Board approved changing the Fund’s fiscal year end to June 30.
Average Annual Total Return__________________________1 Year 5 Year Inception_____ ______ ________
Olstein Financial Alert – Class C(1) 3.59% 4.10% 14.79%Russell 3000® Index(2) 9.56% 3.53% 9.36%S&P 500® Index(3) 8.63% 2.49% 9.28%
Comparison of the Change in Value of a Hypothetical $10,000 Investment from the Fund’s Class CInception through the Fiscal Year End of 6/30/06. The line chart does not reflect any applicableContingent Deferred Sales Charge. The returns listed in the table do not reflect the deduction of taxes onreinvested dividends.

9
Chairman’s Message – continued
THE FINANCIAL ALERT FUNDOLSTEIN
$6,000
$8,000
$10,000
$12,000
$14,000
$16,000
$18,000
$20,000
Olstein Financial Alert Fund – Adviser Class S&P 500® Index Russell 3000® Index
$18,900
$10,814
8/31/009/21/99 8/31/01 8/31/02 8/31/03 6/30/04(4) 6/30/05
$11,793
6/30/06
(1) Assumes reinvestment of dividends and capital gains. Past performance is not necessarily indicative of future results. Investmentreturns and principal values may fluctuate, so that, when redeemed, shares may be worth more or less than their original cost.
(2) The Russell 3000® Index reflects the broad U.S. equity universe and represents approximately 98% of the U.S. market. Russell 3000Index return is adjusted upward to reflect reinvested dividends, but does not reflect the deduction of any fees or expenses associatedwith investments in the index, and thus represents a “gross return.”
(3) S&P 500® Index return is adjusted upward to reflect reinvested dividends, but does not reflect the deduction of any fees or expensesassociated with investment in the index, and thus represents a “gross return.”
(4) On April 29, 2004, the Fund’s Board approved changing the Fund’s fiscal year end to June 30.
Average Annual Total Return__________________________1 Year 5 Year Inception_____ ______ ________
Olstein Financial Alert – Adviser Class(1) 5.40% 4.89% 9.85%Russell 3000® Index(2) 9.56% 3.53% 2.46%S&P 500® Index(3) 8.63% 2.49% 1.16%
Comparison of the Change in Value of a Hypothetical $10,000 Investment from the Fund’s Adviser ClassInception through the Fiscal Year End of 6/30/06. The returns listed in the table do not reflect thededuction of taxes on reinvested dividends.

As a shareholder of the Fund, you incur two types of costs: (1) transaction costs, including contingentdeferred sales charges on redemptions, if any; and (2) ongoing costs, including management fees;distribution fees (12b-1); and other Fund expenses. This Example is intended to help you understand yourongoing costs (in dollars) of investing in the Fund and to compare these costs with the ongoing costs ofinvesting in other mutual funds. The Example is based on an investment of $1,000 invested at the beginningof the period and held for the entire period, January 1, 2006 – June 30, 2006.
Actual ExpensesThe table below provides information about actual account values and actual expenses. You will be assessedfees for outgoing wire transfers, returned checks and stop payment orders at prevailing rates charged by U.S.Bancorp Fund Services, LLC, the Fund’s transfer agent. If you request that a redemption be made by a wiretransfer, currently a $15.00 fee is charged by the Fund’s transfer agent. IRA accounts will be charged a $15.00annual maintenance fee and a $25 distribution fee. The example below includes, but is not limited to,management fees, distribution fees, fund accounting, custody and transfer agent fees. However, the Examplebelow does not include portfolio trading commissions and related expenses. You may use the information inthis table, together with the amount you invested, to estimate the expenses that you paid over the period.Simply divide your account value by $1,000 (for example, an $8,600 account value divided by $1,000 = 8.6),then multiply the result by the number in the table under the heading entitled “Expenses Paid DuringPeriod’’ to estimate the expenses you paid on your account during this period.
Hypothetical Example for Comparison PurposesThe table below also provides information about hypothetical account values and hypothetical expensesbased on the Fund’s actual expense ratio and an assumed rate of return of 5% per year before expenses,which is not the Fund’s actual return. The hypothetical account values and expenses may not be used toestimate the actual ending account balance or expenses you paid for the period. You may use thisinformation to compare the ongoing costs of investing in the Fund and other funds. To do so, compare this5% hypothetical example with the 5% hypothetical examples that appear in the shareholder reports of theother funds. Please note that the expenses shown in the table are meant to highlight your ongoing costs onlyand do not reflect any transactional costs, such as contingent deferred sales charges on redemptions, if any.Therefore, the hypothetical information is useful in comparing ongoing costs only, and will not help youdetermine the relative total costs of owning different funds. In addition, if these transactional costs wereincluded, your costs would have been higher.
Beginning Ending Expenses PaidAccount Value Account Value During Period*
1/1/06 6/30/06 1/1/06 – 6/30/06_____________ _____________ _________________Actual
Class C $1,000.00 $ 997.60 $10.85Adviser Class 1,000.00 1,001.20 7.15
Hypothetical (5% annual return before expenses)Class C $1,000.00 $1,013.93 $10.94Adviser Class 1,000.00 1,017.65 7.20
* Expenses are equal to the Fund’s annualized expense ratio of 2.19%, and 1.44% for Class C and Adviser Class, respectively, multipliedby the average account value over the period, multiplied by 181/365 (to reflect the one-half year period).
10
Expense Example June 30, 2006
THE FINANCIAL ALERT FUNDOLSTEIN

11
Allocation of Portfolio Assets as a percentage of investments June 30, 2006
THE FINANCIAL ALERT FUNDOLSTEIN
Common Stocks89.4%
Short-Term Investments10.6%
-10%
0%
10%
20%
30%
40%
50%
60%
70%
80%
90%
100%

12
THE FINANCIAL ALERT FUNDOLSTEIN
The accompanying notes are an integral part of the financial statements.
Shares Value______ ______
COMMON STOCKS – 85.8%BEVERAGES – 2.2%
Molson Coors Brewing Company – Class B . . . . . . . 536,500 $ 36,417,620______________
CAPITAL MARKETS – 6.2%The Goldman Sachs Group, Inc. . . . . . . . . . . . . . 45,300 6,814,479
Janus Capital Group Inc. . . . 1,446,200 25,886,980Merrill Lynch & Co., Inc. . . 167,100 11,623,476Morgan Stanley . . . . . . . . . . . 498,800 31,529,148Waddell & Reed Financial, Inc. – Class A . . . . . . . . . . . . 1,238,000 25,453,280______________
101,307,363______________
COMMERCIAL BANKS – 1.6%Bank of America Corporation . . . . . . . . . . . . 554,700 26,681,070______________
COMMERCIAL SERVICES & SUPPLIES – 2.5%Avery Dennison Corporation . . . . . . . . . . . . 222,100 12,895,126
John H. Harland Company . 326,400 14,198,400Pitney Bowes Inc. . . . . . . . . . 321,600 13,282,080______________
40,375,606______________
COMMUNICATIONS EQUIPMENT – 3.9%3Com Corporation (a) . . . . . 2,962,100 15,165,952Cisco Systems, Inc. (a) . . . . . 1,773,900 34,644,267CommScope, Inc. (a) . . . . . . 450,200 14,145,284______________
63,955,503______________
COMPUTERS & PERIPHERALS – 4.6%Adaptec, Inc. (a) . . . . . . . . . . 4,702,000 20,406,680Apple Computer, Inc. (a) . . . 421,100 24,053,232Diebold, Incorporated . . . . . 269,000 10,926,780Intermec, Inc. (a) . . . . . . . . . 902,000 20,691,880______________
76,078,572______________
CONSTRUCTION & ENGINEERING – 2.3%Quanta Services, Inc. (a) . . . 2,200,600 38,136,398______________
CONSUMER FINANCE – 1.0%American Express Company 305,900 16,279,998______________
ELECTRICAL EQUIPMENT – 1.1%Energy Conversion Devices, Inc. (a) . . . . . . . . . 490,900 17,883,487______________
ENERGY EQUIPMENT & SERVICES – 1.5%Newpark Resources, Inc. (a) 3,932,900 24,187,335______________
Schedule of Investments June 30, 2006
Shares Value______ ______
FOOD & STAPLES RETAILING – 0.5%Nash Finch Company . . . . . . 349,000 $ 7,430,210______________
FOOD PRODUCTS – 3.7%Del Monte Foods Company . 5,343,300 60,005,259______________
HEALTH CARE EQUIPMENT & SUPPLIES – 2.0%Baxter International Inc. . . . 572,500 21,045,100PerkinElmer, Inc. . . . . . . . . . 569,500 11,902,550______________
32,947,650______________
HOTELS RESTAURANTS & LEISURE – 3.9%CKE Restaurants, Inc. . . . . . 1,025,000 17,025,250McDonald’s Corporation . . . 1,047,050 35,180,880Scientific Games Corporation – Class A (a) . 333,220 11,869,297______________
64,075,427______________
HOUSEHOLD DURABLES – 3.2%Blount International, Inc. (a) . . . . . . . . . . . . . . . . . 998,400 12,000,768
Tupperware Brands Corporation . . . . . . . . . . . . 1,156,600 22,773,454
Universal Electronics Inc. (a) (b) . . . . . . . . . . . . . 985,900 17,460,289______________
52,234,511______________
INDUSTRIAL CONGLOMERATES – 6.1%3M Co. . . . . . . . . . . . . . . . . . 252,500 20,394,425Tyco International Ltd. (c) . 2,914,800 80,157,000______________
100,551,425______________
INSURANCE – 7.2%American International Group, Inc. . . . . . . . . . . . . . 578,800 34,178,140
Marsh & McLennan Companies, Inc. . . . . . . . . . 1,950,300 52,443,567
XL Capital Ltd. – Class A (c) . . . . . . . . . . . . . . 511,700 31,367,210______________
117,988,917______________
INTERNET SOFTWARE & SERVICES – 0.6%VeriSign, Inc. (a) . . . . . . . . . . 415,100 9,617,867______________
LEISURE EQUIPMENT & PRODUCTS – 1.4%Hasbro, Inc. . . . . . . . . . . . . . 1,304,200 23,619,062______________
MEDIA – 2.0%The Walt Disney Company . . 1,104,800 33,144,000______________
METALS & MINING – 1.5%Cleveland-Cliffs Inc. . . . . . . . 318,500 25,253,865______________

13
THE FINANCIAL ALERT FUNDOLSTEIN
The accompanying notes are an integral part of the financial statements.
Shares Value______ ______
COMMON STOCKS – 85.8% – continuedMULTILINE RETAIL – 2.7%
Federated Department Stores, Inc. . . . . . . . . . . . . . 900,400 $ 32,954,640
J. C. Penney Company, Inc. . 158,100 10,673,331______________43,627,971______________
OFFICE ELECTRONICS – 1.9%Xerox Corporation (a) . . . . . 2,208,000 30,713,280______________
OIL & GAS – 6.2%Chesapeake Energy Corporation . . . . . . . . . . . . 857,000 25,924,250
Hugoton Royalty Trust . . . . . 2 59The Williams Companies, Inc. . . . . . . . . . 2,404,700 56,173,792
XTO Energy, Inc. . . . . . . . . . 435,300 19,270,731______________101,368,832______________
PAPER & FOREST PRODUCTS – 1.7%Neenah Paper, Inc. (b) . . . . . 891,800 27,155,310______________
PERSONAL PRODUCTS – 1.4%Playtex Products, Inc. (a) . . . 2,214,100 23,093,063______________
SEMICONDUCTOR & SEMICONDUCTOR EQUIPMENT – 1.5%Atmel Corporation (a) . . . . . 4,413,800 24,496,590______________
SPECIALTY RETAIL – 10.1%Abercrombie & Fitch Co. – Class A . . . . . . . . . . . . 456,800 25,320,424
Claire’s Stores, Inc. . . . . . . . 869,800 22,188,598The Finish Line, Inc. – Class A . . . . . . . . . . . . 1,776,200 21,012,446
Foot Locker, Inc. . . . . . . . . . 1,019,300 24,962,657Jo-Ann Stores, Inc. (a) (b) . . 1,894,900 27,760,285RadioShack Corporation . . . 1,898,200 26,574,800Ross Stores, Inc. . . . . . . . . . . 616,300 17,287,215______________
165,106,425______________
TEXTILES, APPAREL & LUXURY GOODS – 1.3%Jones Apparel Group, Inc. . 645,400 20,517,266______________
TOTAL COMMON STOCKS(Cost $1,217,194,235) . . . . . . . . . . . . . 1,404,249,882______________
SHORT-TERM INVESTMENTS – 10.1%MUTUAL FUND – 0.1%
First American Prime Obligations Fund . . . . . . . . 1,964,184 1,964,184______________
Schedule of Investments – continued June 30, 2006
PrincipalAmount Value________ ______
U.S. GOVERNMENT AGENCY OBLIGATIONS – 10.0%Federal Home Loan Bank:4.57%, 07/12/2006 . . . . . . $30,000,000 $ 29,954,5334.92%, 07/10/2006 . . . . . . 19,000,000 18,976,5834.92%, 07/11/2006 . . . . . . 24,000,000 23,966,9334.95%, 07/03/2006 . . . . . . 15,500,000 15,495,8854.95%, 07/05/2006 . . . . . . 30,000,000 29,983,7004.95%, 07/06/2006 . . . . . . 18,100,000 18,087,7325.065%, 07/07/2006 . . . . . 27,300,000 27,277,796______________
TOTAL U.S. GOVERNMENT AGENCY OBLIGATIONS . . . . . . . . . . 163,743,162______________
TOTAL SHORT-TERM INVESTMENTS(Cost $165,707,346) . . . . . . . . . . . . . . 165,707,346______________
TOTAL INVESTMENTS – 95.9%(Cost $1,382,901,581) . . . . . . . . . . . . . . . . . . . 1,569,957,228______________
OTHER ASSETS IN EXCESS OF LIABILITIES – 4.1% . . . . . . . . . . . . . . . . . 66,599,107______________
TOTAL NET ASSETS – 100.0% . . . . . . . . . . . . $1,636,556,335____________________________
(a) Non-income producing security.(b) Affiliated company; the Fund owns 5% or more of the
outstanding voting securities of the issuer. See Note 8.(c) Dollar-denominated foreign security.

14
THE FINANCIAL ALERT FUNDOLSTEIN
The accompanying notes are an integral part of the financial statements.
Assets:Investments, at value:
Investments in securities of unaffiliated issuers (cost $1,302,660,329) . . . . . . . . . . . . . . . . . . . . . . . $1,497,581,344Investments in securities of affiliated issuers (cost $80,241,252) (See Note 8) . . . . . . . . . . . . . . . . . 72,375,884______________
Total investments (cost $1,382,901,581) . . . . . . . . . . . . . . . . . . . . . . . . . . . . . . . . . . . . . . . . . . . . . . . . . . 1,569,957,228Cash . . . . . . . . . . . . . . . . . . . . . . . . . . . . . . . . . . . . . . . . . . . . . . . . . . . . . . . . . . . . . . . . . . . . . . . . . . . . . . . 194,446Receivable for securities sold . . . . . . . . . . . . . . . . . . . . . . . . . . . . . . . . . . . . . . . . . . . . . . . . . . . . . . . . . . . 81,023,559Receivable for capital shares sold . . . . . . . . . . . . . . . . . . . . . . . . . . . . . . . . . . . . . . . . . . . . . . . . . . . . . . . . 792,444Dividends and interest receivable . . . . . . . . . . . . . . . . . . . . . . . . . . . . . . . . . . . . . . . . . . . . . . . . . . . . . . . 751,613Other assets . . . . . . . . . . . . . . . . . . . . . . . . . . . . . . . . . . . . . . . . . . . . . . . . . . . . . . . . . . . . . . . . . . . . . . . . . 28,871______________
Total Assets . . . . . . . . . . . . . . . . . . . . . . . . . . . . . . . . . . . . . . . . . . . . . . . . . . . . . . . . . . . . . . . . 1,652,748,161______________Liabilities:
Payable for securities purchased . . . . . . . . . . . . . . . . . . . . . . . . . . . . . . . . . . . . . . . . . . . . . . . . . . . . . . . . 5,066,564Payable for capital shares redeemed . . . . . . . . . . . . . . . . . . . . . . . . . . . . . . . . . . . . . . . . . . . . . . . . . . . . . 5,160,452Distribution expense payable . . . . . . . . . . . . . . . . . . . . . . . . . . . . . . . . . . . . . . . . . . . . . . . . . . . . . . . . . . . 3,735,904Payable to Investment Manager (See Note 5) . . . . . . . . . . . . . . . . . . . . . . . . . . . . . . . . . . . . . . . . . . . . . . 1,348,664Accrued expenses and other liabilities . . . . . . . . . . . . . . . . . . . . . . . . . . . . . . . . . . . . . . . . . . . . . . . . . . . 880,242______________
Total Liabilities . . . . . . . . . . . . . . . . . . . . . . . . . . . . . . . . . . . . . . . . . . . . . . . . . . . . . . . . . . . . . 16,191,826______________Net Assets . . . . . . . . . . . . . . . . . . . . . . . . . . . . . . . . . . . . . . . . . . . . . . . . . . . . . . . . . . . . . . . . . . . . . . . . . . . . $1,636,556,335____________________________Net Assets Consist of:
Capital stock . . . . . . . . . . . . . . . . . . . . . . . . . . . . . . . . . . . . . . . . . . . . . . . . . . . . . . . . . . . . . . . . . . . . . . . . $1,383,838,094Accumulated net realized gain on investments sold . . . . . . . . . . . . . . . . . . . . . . . . . . . . . . . . . . . . . . . . . 65,662,594Net unrealized appreciation on investments . . . . . . . . . . . . . . . . . . . . . . . . . . . . . . . . . . . . . . . . . . . . . . . 187,055,647______________
Total Net Assets . . . . . . . . . . . . . . . . . . . . . . . . . . . . . . . . . . . . . . . . . . . . . . . . . . . . . . . . . . . . $1,636,556,335____________________________CLASS C:
Net Assets . . . . . . . . . . . . . . . . . . . . . . . . . . . . . . . . . . . . . . . . . . . . . . . . . . . . . . . . . . . . . . . . . . . . . . . . . . . $1,355,960,347Shares of beneficial interest outstanding (unlimited number of shares authorized, $0.001 par value) . . . . . . . . . . . . . . . . . . . . . . . . . . . . . . . . . . . . . . . . . . . . . . . . . . 82,835,232
Net asset value, offering and redemption (may be subject tocontingent deferred sales charge) price per share . . . . . . . . . . . . . . . . . . . . . . . . . . . . . . . . . . . . . . . . . $16.37____________
ADVISER CLASS:Net Assets . . . . . . . . . . . . . . . . . . . . . . . . . . . . . . . . . . . . . . . . . . . . . . . . . . . . . . . . . . . . . . . . . . . . . . . . . . . $ 280,595,988Shares of beneficial interest outstanding (unlimited number of shares authorized, $0.001 par value) . . . . . . . . . . . . . . . . . . . . . . . . . . . . . . . . . . . . . . . . . . . . . . . . . . 16,134,349
Net asset value, offering and redemption price per share . . . . . . . . . . . . . . . . . . . . . . . . . . . . . . . . . . . . $17.39____________
Statement of Assets and Liabilities June 30, 2006

For theYear Ended
June 30, 2006_____________
Investment Income:Dividend income:
Dividend income from securities of unaffiliated issuers . . . . . . . . . . . . . . . . . . . . . . . . . . . . . . . . . . . $ 20,259,567Dividend income from securities of affiliated issuers (See Note 8) . . . . . . . . . . . . . . . . . . . . . . . . . . 663,787
Interest income . . . . . . . . . . . . . . . . . . . . . . . . . . . . . . . . . . . . . . . . . . . . . . . . . . . . . . . . . . . . . . . . . . . . . . 6,701,879____________Total investment income . . . . . . . . . . . . . . . . . . . . . . . . . . . . . . . . . . . . . . . . . . . . . . . . . . . . . 27,625,233____________
Expenses:Investment management fee (See Note 5) . . . . . . . . . . . . . . . . . . . . . . . . . . . . . . . . . . . . . . . . . . . . . . . . . 18,398,156Distribution expense – Class C . . . . . . . . . . . . . . . . . . . . . . . . . . . . . . . . . . . . . . . . . . . . . . . . . . . . . . . . . . 14,733,186Distribution expense – Adviser Class . . . . . . . . . . . . . . . . . . . . . . . . . . . . . . . . . . . . . . . . . . . . . . . . . . . . . 916,242Shareholder servicing and accounting costs . . . . . . . . . . . . . . . . . . . . . . . . . . . . . . . . . . . . . . . . . . . . . . . 1,771,537Administration fee . . . . . . . . . . . . . . . . . . . . . . . . . . . . . . . . . . . . . . . . . . . . . . . . . . . . . . . . . . . . . . . . . . . . 872,445Professional fees . . . . . . . . . . . . . . . . . . . . . . . . . . . . . . . . . . . . . . . . . . . . . . . . . . . . . . . . . . . . . . . . . . . . . . 217,987Reports to shareholders . . . . . . . . . . . . . . . . . . . . . . . . . . . . . . . . . . . . . . . . . . . . . . . . . . . . . . . . . . . . . . . . 158,574Custody fees . . . . . . . . . . . . . . . . . . . . . . . . . . . . . . . . . . . . . . . . . . . . . . . . . . . . . . . . . . . . . . . . . . . . . . . . . 137,714Federal and state registration . . . . . . . . . . . . . . . . . . . . . . . . . . . . . . . . . . . . . . . . . . . . . . . . . . . . . . . . . . . 128,395Trustees’ fees and expenses . . . . . . . . . . . . . . . . . . . . . . . . . . . . . . . . . . . . . . . . . . . . . . . . . . . . . . . . . . . . . 109,071Other . . . . . . . . . . . . . . . . . . . . . . . . . . . . . . . . . . . . . . . . . . . . . . . . . . . . . . . . . . . . . . . . . . . . . . . . . . . . . . . 57,402____________
Total expenses . . . . . . . . . . . . . . . . . . . . . . . . . . . . . . . . . . . . . . . . . . . . . . . . . . . . . . . . . . . . . . 37,500,709____________Net investment loss . . . . . . . . . . . . . . . . . . . . . . . . . . . . . . . . . . . . . . . . . . . . . . . . . . . . . . . . . . (9,875,476)____________
Realized and Unrealized Gain (Loss) on Investments:Realized gain (loss) on:
Investments of unaffiliated issuers . . . . . . . . . . . . . . . . . . . . . . . . . . . . . . . . . . . . . . . . . . . . . . . . . . . . 156,616,816Investments of affiliated issuers (See Note 8) . . . . . . . . . . . . . . . . . . . . . . . . . . . . . . . . . . . . . . . . . . . . (5,629,947)
Change in unrealized appreciation/depreciation on investments . . . . . . . . . . . . . . . . . . . . . . . . . . . . . . (45,029,884)____________Net realized and unrealized gain on investments . . . . . . . . . . . . . . . . . . . . . . . . . . . . . . . . . . . . . . . . . . . 105,956,985____________
Net Increase in Net Assets Resulting from Operations . . . . . . . . . . . . . . . . . . . . . . . . . . . . . . . . . . . . . . . . . $ 96,081,509________________________
15
THE FINANCIAL ALERT FUNDOLSTEIN
The accompanying notes are an integral part of the financial statements.
Statement of Operations
For the For theYear Ended Year Ended
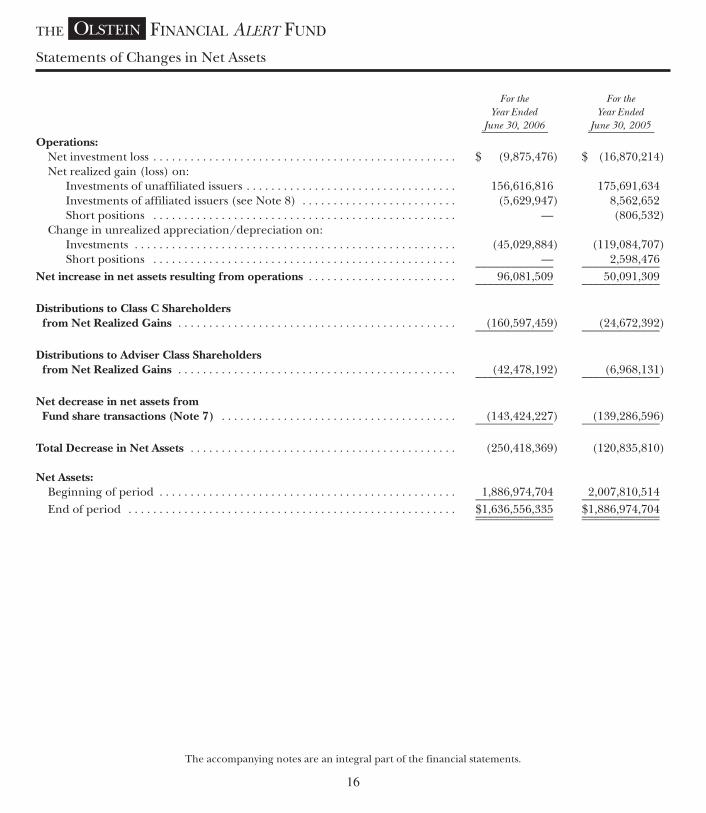
June 30, 2006 June 30, 2005_____________ _____________Operations:
Net investment loss . . . . . . . . . . . . . . . . . . . . . . . . . . . . . . . . . . . . . . . . . . . . . . . . . $ (9,875,476) $ (16,870,214)Net realized gain (loss) on:
Investments of unaffiliated issuers . . . . . . . . . . . . . . . . . . . . . . . . . . . . . . . . . . 156,616,816 175,691,634Investments of affiliated issuers (see Note 8) . . . . . . . . . . . . . . . . . . . . . . . . . (5,629,947) 8,562,652Short positions . . . . . . . . . . . . . . . . . . . . . . . . . . . . . . . . . . . . . . . . . . . . . . . . . — (806,532)
Change in unrealized appreciation/depreciation on:Investments . . . . . . . . . . . . . . . . . . . . . . . . . . . . . . . . . . . . . . . . . . . . . . . . . . . . (45,029,884) (119,084,707)Short positions . . . . . . . . . . . . . . . . . . . . . . . . . . . . . . . . . . . . . . . . . . . . . . . . . — 2,598,476_____________ _____________
Net increase in net assets resulting from operations . . . . . . . . . . . . . . . . . . . . . . . . 96,081,509 50,091,309_____________ _____________
Distributions to Class C Shareholdersfrom Net Realized Gains . . . . . . . . . . . . . . . . . . . . . . . . . . . . . . . . . . . . . . . . . . . . . (160,597,459) (24,672,392)_____________ _____________
Distributions to Adviser Class Shareholdersfrom Net Realized Gains . . . . . . . . . . . . . . . . . . . . . . . . . . . . . . . . . . . . . . . . . . . . . (42,478,192) (6,968,131)_____________ _____________
Net decrease in net assets fromFund share transactions (Note 7) . . . . . . . . . . . . . . . . . . . . . . . . . . . . . . . . . . . . . . (143,424,227) (139,286,596)_____________ _____________
Total Decrease in Net Assets . . . . . . . . . . . . . . . . . . . . . . . . . . . . . . . . . . . . . . . . . . . (250,418,369) (120,835,810)
Net Assets:Beginning of period . . . . . . . . . . . . . . . . . . . . . . . . . . . . . . . . . . . . . . . . . . . . . . . . 1,886,974,704 2,007,810,514_____________ _____________End of period . . . . . . . . . . . . . . . . . . . . . . . . . . . . . . . . . . . . . . . . . . . . . . . . . . . . . $1,636,556,335 $1,886,974,704_____________ __________________________ _____________
16
THE FINANCIAL ALERT FUNDOLSTEIN
The accompanying notes are an integral part of the financial statements.
Statements of Changes in Net Assets

THE FOLLOWING TABLE INCLUDES SELECTED DATA FOR A SHARE OUTSTANDING OF THE FUNDTHROUGHOUT EACH PERIOD AND OTHER PERFORMANCE INFORMATION DERIVED FROM THEFINANCIAL STATEMENTS. IT SHOULD BE READ IN CONJUNCTION WITH THE FINANCIALSTATEMENTS AND NOTES THERETO.
ADVISER CLASSFOR THE FOR THE FOR THE FOR THE FOR THE FOR THE
YEAR YEAR PERIOD YEAR YEAR YEAR
ENDED ENDED ENDED ENDED ENDED ENDED
JUNE 30, JUNE 30, JUNE 30, AUG. 31, AUG. 31, AUG. 31,2006 2005 2004 4 2003 2002 2001________ ________ ________ ________ ________ ________
Net Asset Value – Beginning of Period . . . . . . . . . . . . . . . . . . . . . . . $18.38 $18.09 $14.93 $12.66 $15.77 $16.89______ ______ ______ ______ ______ ______Investment Operations:
Net investment income (loss)1 . . . . . . . . . . . . . . . . . . . . . . . . . . . 0.01 (0.05) (0.03) (0.05) (0.07) (0.04)Net realized and unrealized gain (loss) on investments . . . . . . . . . . . . . . . . . . . . . . . . . . . . . . 0.99 0.62 3.19 2.32 (1.84) 1.74______ ______ ______ ______ ______ ______
Total from investment operations . . . . . . . . . . . . . . . . . . . . 1.00 0.57 3.16 2.27 (1.91) 1.70______ ______ ______ ______ ______ ______Distributions from net realized gain on investments . . . . . . . . . . . . . . . . . . . . . . . . . . . . . . . . . . . . . (1.99) (0.28) — — (1.20) (2.82)______ ______ ______ ______ ______ ______
Net Asset Value – End of Period . . . . . . . . . . . . . . . . . . . . . . . . . . . . $17.39 $18.38 $18.09 $14.93 $12.66 $15.77______ ______ ______ ______ ______ ____________ ______ ______ ______ ______ ______
Total Return . . . . . . . . . . . . . . . . . . . . . . . . . . . . . . . . . . . . . . . . . . . . 5.40% 3.18% 21.17%‡ 17.93% (13.21)% 11.99%
Ratios (to average net assets)/Supplemental Data:
Expenses2 . . . . . . . . . . . . . . . . . . . . . . . . . . . . . . . . . . . . . . . . . . . . 1.44% 1.42% 1.41%* 1.48% 1.43% 1.43%Net investment income (loss) . . . . . . . . . . . . . . . . . . . . . . . . . . . . 0.06% (0.28)% (0.25)%* (0.41)% (0.46)% (0.22)%
Portfolio turnover rate3 . . . . . . . . . . . . . . . . . . . . . . . . . . . . . . . . . . . 59.44% 68.46% 52.45% 79.55% 81.86% 106.56%Net assets at end of period (000 omitted) . . . . . . . . . . . . . . . . . . . . $280,596 $413,800 $451,620 $350,583 $356,839 $198,742
‡ Not annualized.* Annualized.1 Net investment income (loss) per share represents net investment income (loss) divided by the average shares outstanding
throughout the period.2 The expense ratio includes dividends on short positions where applicable. The ratio of dividends on short positions for the periods
ended June 30, 2005, August 31, 2003 and 2002 was 0.00%, 0.02% and 0.01%, respectively. There were no dividends on shortpositions for the periods ended June 30, 2006, June 30, 2004 and August 31, 2001.
3 Portfolio turnover is calculated on the basis of the Fund as a whole without distinguishing between the classes of shares issued.4 On April 29, 2004, the Fund’s Board approved changing the Fund’s fiscal year end to June 30.
17
THE FINANCIAL ALERT FUNDOLSTEIN
The accompanying notes are an integral part of the financial statements.
Financial Highlights

CLASS CFOR THE FOR THE FOR THE FOR THE FOR THE FOR THE
YEAR YEAR PERIOD YEAR YEAR YEAR
ENDED ENDED ENDED ENDED ENDED ENDED
JUNE 30, JUNE 30, JUNE 30, AUG. 31, AUG. 31, AUG. 31,2006 2005 2004 4 2003 2002 2001_______ _______ _______ _______ _______ _______
Net Asset Value – Beginning of Period . . . . . . . . . . . . . . . . $17.54 $17.40 $14.45 $12.34 $15.51 $16.77______ ______ ______ ______ ______ ______Investment Operations:
Net investment loss1 . . . . . . . . . . . . . . . . . . . . . . . . . . . . . (0.12) (0.18) (0.13) (0.14) (0.18) (0.12)Net realized and unrealizedgain (loss) on investments . . . . . . . . . . . . . . . . . . . . . . . 0.94 0.60 3.08 2.25 (1.79) 1.68______ ______ ______ ______ ______ ______
Total from investment operations . . . . . . . . . . . . . . 0.82 0.42 2.95 2.11 (1.97) 1.56______ ______ ______ ______ ______ ______Distributions from net realizedgain on investments . . . . . . . . . . . . . . . . . . . . . . . . . . . . . . . (1.99) (0.28) — — (1.20) (2.82)______ ______ ______ ______ ______ ______
Net Asset Value – End of Period . . . . . . . . . . . . . . . . . . . . . $16.37 $17.54 $17.40 $14.45 $12.34 $15.51______ ______ ______ ______ ______ ____________ ______ ______ ______ ______ ______
Total Return‡ . . . . . . . . . . . . . . . . . . . . . . . . . . . . . . . . . . . . 4.59% 2.43% 20.42%* 17.10% (13.86)% 11.12%
Ratios (to average net assets)/Supplemental Data:
Expenses2 . . . . . . . . . . . . . . . . . . . . . . . . . . . . . . . . . . . . . . 2.19% 2.17% 2.16%** 2.23% 2.18% 2.18%Net investment loss . . . . . . . . . . . . . . . . . . . . . . . . . . . . . . (0.69)% (1.03)% (1.00)%** (1.16)% (1.21)% (0.75)%
Portfolio turnover rate3 . . . . . . . . . . . . . . . . . . . . . . . . . . . . . 59.44% 68.46% 52.45% 79.55% 81.86% 106.56%Net assets at end of period (000 omitted) . . . . . . . . . . . . . . $1,355,960 $1,473,175 $1,556,190 $1,194,726 $1,020,455 $684,738
‡ Total returns do not reflect any deferred sales charge for Class C Shares.* Not annualized.** Annualized.1 Net investment loss per share represents net investment loss divided by the average shares outstanding throughout the period.2 The expense ratio includes dividends on short positions where applicable. The ratio of dividends on short positions for the periods
ended June 30, 2005, August 31, 2003 and 2002 was 0.00%, 0.02% and 0.01%, respectively. There were no dividends on shortpositions for the periods ended June 30, 2006, June 30, 2004 and August 31, 2001.
3 Portfolio turnover is calculated on the basis of the Fund as a whole without distinguishing between the classes of shares issued.4 On April 29, 2004, the Fund’s Board approved changing the Fund’s fiscal year end to June 30.
18
Financial Highlights – continued
THE FINANCIAL ALERT FUNDOLSTEIN
The accompanying notes are an integral part of the financial statements.

1. Description of the Fund. The Olstein Financial Alert Fund (the “Fund”) is the first series of The OlsteinFunds (the “Trust”), a Delaware statutory trust organized on March 31, 1995. The Fund is registeredunder the Investment Company Act of 1940, as amended (the “1940 Act”), as an open-end diversifiedmanagement investment company. The primary investment objective of the Fund is long-term capitalappreciation with a secondary objective of income. The Fund commenced investment operations onSeptember 21, 1995.
The Fund issued a second class of shares, Adviser Class shares, and renamed the initial class as Class Cshares on September 1, 1999. The Adviser Class shares were initially sold on September 21, 1999 and aresubject to expenses pursuant to the Shareholder Servicing and Distribution Plan described in Note 6.The Class C shares are subject to a contingent deferred sales charge (“CDSC”) for redemptions inaccordance with the Fund’s prospectus, and expenses pursuant to the Shareholder Servicing andDistribution Plan described in Note 6. The maximum CDSC is 1.00% of the original purchase price forClass C shares within one year of purchase.
2. Significant Accounting Policies. The following is a summary of the significant accounting policies of theFund:
Security Valuation. The Fund’s securities, except short-term investments with maturities of 60 days or less atthe time of purchase and securities traded on the NASDAQ NMS and Small Cap exchanges, are valued attheir market value as determined by their last sale price in the principal market in which these securitiesare normally traded. Lacking any sales, the security is valued at the mean between the closing bid and askprice. Securities traded on NASDAQ are valued at the NASDAQ Official Closing Price (“NOCP”). Short-term investments with remaining maturities of 60 days or less at the time of purchase are valued atamortized cost, which approximates market value, unless the Fund’s Board of Trustees determines thatthis does not represent fair value. The value of all other securities, for which no quotations are readilyavailable, is determined in good faith by, or under procedures approved by, the Board of Trustees. TheBoard has adopted specific procedures for valuing portfolio securities and delegated the implementationof these procedures to Olstein & Associates, L.P. (“Olstein & Associates” or the “Investment Manager”).The procedures authorize the Investment Manager to make all necessary determinations regarding thefair value of a portfolio security and to report such determinations to the Board of Trustees. The Fundmay also use independent pricing services to assist in pricing portfolio securities.
Federal Income Taxes. The Fund intends to continue to qualify for treatment as a “regulated investmentcompany” under Subchapter M of the Internal Revenue Code of 1986 and to distribute all of its taxableincome to its shareholders. Therefore, no federal income tax provision has been provided.
Distributions to Shareholders. Distributions of net investment income and net realized gains, if any, aredetermined in accordance with income tax regulations, which may differ from U.S. generally acceptedaccounting principles. These differences are either temporary or permanent in nature. To the extent thesedifferences are permanent, reclassifications are made in the capital accounts in the period that the differencearises. Accordingly, at June 30, 2006 reclassifications were recorded to increase undistributable netinvestment income by $9,875,476 and decrease accumulated gains by $9,875,476. Generally, distributions aredeclared and paid annually. The Fund may utilize earnings and profits distributed to shareholders onredemption of shares as part of the dividend paid deduction.
19
THE FINANCIAL ALERT FUNDOLSTEIN
Notes to Financial Statements

Use of Estimates in the Preparation of Financial Statements. The preparation of financial statements inconformity with U.S. generally accepted accounting principles requires management to make estimatesand assumptions that affect the reported amounts of assets and liabilities and disclosures of contingentassets and liabilities at the date of the financial statements and the reported amounts of revenue andexpenses during the reporting period. Actual results may differ from those estimates.
Other. Investment security transactions are accounted for on a trade date basis. The Fund uses thespecific identification method for determining realized gain or loss on investments for both financial andfederal income tax reporting purposes. Dividend income and dividends on short positions arerecognized on the ex-dividend date or as soon as information is available to the Fund and interestincome is recognized on an accrual basis. Income, realized and unrealized gains or losses on investmentsare allocated to each class of shares based on its relative net assets. All discounts and premiums areamortized using the effective interest method for tax and financial reporting purposes.
Expenses. Expenses directly attributable to a class of shares, such as Rule 12b-1 distribution fees, arecharged to that class. Expenses that are not attributable to a particular class are typically allocated amongeach class in proportion to their respective net assets.
Short Sales. Short sales are transactions in which the Fund sells a security it does not own, in anticipationof a decline in the market value of that security. To complete such a transaction, the Fund must borrowthe security to deliver to the buyer upon the short sale; the Fund then is obligated to replace the securityborrowed by purchasing it in the open market at some later date. The Fund will incur a loss if themarket price of the security increases between the date of the short sale and the date on which the Fundreplaces the borrowed security. The Fund will realize a gain if the security declines in value betweenthose dates. All short sales must be fully collateralized. The Fund maintains the collateral in asegregated account consisting of cash, U.S. Government securities or other liquid assets sufficient tocollateralize the market value of its short positions. The Fund limits the value of short positions to 25%of the Fund’s total assets. At June 30, 2006, the Fund had no short positions outstanding.
3. Purchases and Sales of Investment Securities. During the year ended June 30, 2006, purchases and salesof investment securities (excluding short-term investments) for the Fund were $992,659,612 and$1,525,025,089, respectively. The Fund did not purchase long-term U.S. Government securities as a partof its investment strategy during the year ended June 30, 2006.
20
THE FINANCIAL ALERT FUNDOLSTEIN
Notes to Financial Statements – continued

21
THE FINANCIAL ALERT FUNDOLSTEIN
4. Tax Information. At June 30, 2006, the components of accumulated earnings/(losses) on a tax basiswere as follows:
Cost of Investments $1,395,480,425__________________________Gross unrealized appreciation $ 250,112,590Gross unrealized depreciation (75,635,787)_____________Net unrealized appreciation/(depreciation) $ 174,476,803__________________________Undistributed ordinary income $ 6,464,589Undistributed long-term capital gain 71,776,849_____________Total distributable earnings $ 78,241,438__________________________Other accumulated losses $ —_____________Total accumulated earnings/(losses) $ 252,718,241__________________________
The difference between book-basis and tax-basis net unrealized appreciation is attributable primarily tothe tax deferral of losses on wash sales.
The tax components of dividends paid during the years ended June 30, 2006 and June 30, 2005 were asfollows:
June 30, 2006 June 30, 2005_____________ _____________
Ordinary Income $ 22,961,387 $ —Long-Term Capital Gains $180,114,264 $42,849,523
On July 13, 2006, the Financial Accounting Standards Board (“FASB”) released FASB Interpretation No.48 “Accounting for Uncertainty in Income Taxes” (“FIN 48”). FIN 48 provides guidance for howuncertain tax positions should be recognized, measured, presented and disclosed in the financialstatements. FIN 48 requires the evaluation of tax positions taken or expected to be taken in the course ofpreparing the Trust’s tax returns to determine whether the tax positions are “more-likely-than-not” ofbeing sustained by the applicable tax authority. Tax positions not deemed to meet the more-likely-than-not threshold would be recorded as a tax benefit or expense in the current year. Adoption of FIN 48 isrequired for fiscal years beginning after December 15, 2006 and is to be applied to all open tax years as ofthe effective date. At this time, management is evaluating the implications of FIN 48 and whether it willhave any impact on the Fund’s financial statements.
5. Investment Management Fee and Other Agreements. The Fund employs Olstein & Associates as theinvestment manager (the “Investment Manager”). Pursuant to an investment management agreementwith the Fund, the Investment Manager selects investments and supervises the assets of the Fund inaccordance with the investment objective, policies and restrictions of the Fund, subject to the supervisionand direction of the Board of Trustees. For its services, the Investment Manager earns a monthly fee atthe annual rate of 1.00% of the Fund’s average daily net assets. For the year ended June 30, 2006, theFund incurred investment management fees of $18,398,156, with $1,348,664 payable to the InvestmentManager as of June 30, 2006.
Certain trustees and officers of the Trust are also officers of the Trust’s Investment Manager. Suchtrustees and officers are paid no fees by the Trust for serving as trustees or officers of the Trust.
Notes to Financial Statements – continued

6. Shareholder Servicing and Distribution Plans. Olstein & Associates (the “Distributor”) has entered into adistribution and underwriting agreement with the Fund dated August 18, 1995 (subsequently revised onJuly 29, 1999 to reflect the additional class), under which the Distributor acts as underwriter to engage inactivities designed to assist the Fund in securing purchasers for its shares. The Fund has adoptedShareholder Servicing and Distribution Plans pursuant to Rule 12b-1 under the 1940 Act (the “12b-1Plans”). Amounts paid under the 12b-l Plans may compensate the Distributor or others for the activitiesin the promotion and distribution of the Fund’s shares and for shareholder servicing. The total amountwhich the Fund will pay under the 12b-1 Plans for the Class C and Adviser Class shares are 1.00% and0.25%, respectively, per annum of the Fund’s average daily net assets of Class C and Adviser Class shares.For the year ended June 30, 2006, fees incurred by the Fund pursuant to the 12b-1 Plans were$14,733,186 for Class C and $916,242 for Adviser Class Shares.
During the year ended June 30, 2006, the Fund paid total brokerage commissions of $702,279 toaffiliated broker-dealers in connection with purchases and sales of investment securities.
7. Fund Shares. At June 30, 2006, there was an unlimited number of shares of beneficial interest, $0.001par value, authorized. The following table summarizes the activity in shares of each class of the Fund:
YEAR ENDED YEAR ENDED
JUNE 30, 2006 JUNE 30, 2005______________________________ _______________________________CLASS C CLASS C
SHARES AMOUNT SHARES AMOUNT____________ _____________ ____________ _____________
Shares sold . . . . . . . . . . . . . . . . . . . . . . . . . 5,224,319 $ 90,698,849 9,509,131 $ 161,933,785Shares issued to shareholders inreinvestment of distributions . . . . . . . . . 9,189,908 152,001,071 1,358,307 23,444,392
Shares redeemed . . . . . . . . . . . . . . . . . . . . (15,584,529) (270,144,716) (16,281,141) (279,789,557)__________ _____________ __________ _____________Net decrease . . . . . . . . . . . . . . . . . . . . . . . (1,170,302) $ (27,444,796) (5,413,703) $ (94,411,380)_____________ __________________________ _____________Shares Outstanding:Beginning of period . . . . . . . . . . . . . . . . . 84,005,534 89,419,237__________ __________End of period . . . . . . . . . . . . . . . . . . . . . . 82,835,232 84,005,534__________ ____________________ __________
22
Notes to Financial Statements – continued
THE FINANCIAL ALERT FUNDOLSTEIN

YEAR ENDED YEAR ENDED
JUNE 30, 2006 JUNE 30, 2005______________________________ _______________________________ADVISER CLASS ADVISER CLASS
SHARES AMOUNT SHARES AMOUNT____________ _____________ ____________ _____________
Shares sold . . . . . . . . . . . . . . . . . . . . . . . . . 3,075,797 $ 56,816,534 6,745,651 $ 119,478,082Shares issued to shareholders inreinvestment of distributions . . . . . . . . . 2,351,866 41,157,654 374,944 6,752,749
Shares redeemed . . . . . . . . . . . . . . . . . . . . (11,804,890) (213,953,619) (9,572,326) (171,106,047)__________ _____________ __________ _____________Net decrease . . . . . . . . . . . . . . . . . . . . . . . (6,377,227) $(115,979,431) (2,451,731) $ (44,875,216)_____________ __________________________ _____________Shares Outstanding:Beginning of period . . . . . . . . . . . . . . . . . 22,511,576 24,963,307__________ __________End of period . . . . . . . . . . . . . . . . . . . . . . 16,134,349 22,511,576__________ ____________________ __________
Total Net Decrease . . . . . . . . . . . . . . . . . . $(143,424,227) $(139,286,596)_____________ __________________________ _____________
8. Other Affiliates.* Investments representing 5% or more of the outstanding voting securities of acompany held in the Fund’s portfolio result in that company being considered an affiliated company ofthe Fund, as defined in the 1940 Act. The aggregate market value of all securities of affiliated companiesas of June 30, 2006 amounted to $72,375,884 representing 4.42% of net assets. Transactions during theyear ended June 30, 2006 in which the issuer was an “affiliated person” were as follows:
FTD Gray OshKoshCambrex Group, Television, Jo-Ann Neenah B’Gosh, Inc. - Technitrol, Universal
Corporation** Inc.** Inc.** Stores, Inc. Paper, Inc. Class A**,*** Inc.** Electronics Inc. Total____________ ______ _________ _________ _________ ____________ ________ ____________ ____June 30, 2005
BalanceShares 1,369,400 1,854,600 2,290,500 — — 757,700 — 1,144,600 7,416,800Cost $31,688,900 $23,034,849 $29,293,879 $ — $ — $16,253,013 $ — $16,938,367 $117,209,008
Gross AdditionsShares — 398,100 590,801 762,801 153,651 — 263,501 — 2,168,854Cost $ — $ 4,173,172 $ 5,429,397 $13,550,677 $ 4,428,296 $ — $ 3,407,606 $ — $ 30,989,148
Gross DeductionsShares 48,950 778,600 729,400 22,600 — 167,050 263,550 158,700 2,168,850Cost $ 1,362,861 $10,436,236 $ 7,486,345 $ 580,942 $ — $ 3,643,597 $ 6,177,425 $ 2,382,204 $ 32,069,610
June 30, 2006BalanceShares — — — 1,894,900 891,800 — — 985,900 3,772,600Cost $ — $ — $ — $38,582,790 $27,102,299 $ — $ — $14,556,163 $ 80,241,252___________ ___________ ___________ ___________ ___________ ___________ ___________ ___________ _______________________ ___________ ___________ ___________ ___________ ___________ ___________ ___________ ____________
Realized gain (loss) $ (425,077) $(3,231,012) $(1,089,738) $ (218,901)$ — $ 699,703 $(2,062,256) $ 697,334 $ (5,629,947)___________ ___________ ___________ ___________ ___________ ___________ ___________ ___________ _______________________ ___________ ___________ ___________ ___________ ___________ ___________ ___________ ____________
Investment income $ 41,082 $ — $ 164,586 $ — $ 259,940 $ — $ 198,179 $ — $ 663,787___________ ___________ ___________ ___________ ___________ ___________ ___________ ___________ _______________________ ___________ ___________ ___________ ___________ ___________ ___________ ___________ ____________
23
Notes to Financial Statements – continued
THE FINANCIAL ALERT FUNDOLSTEIN
* As a result of the Fund’s beneficial ownership of the common stock of these companies, regulators require that the Fund state that itmay be deemed an affiliate of the respective issuer. The Fund disclaims that the “affiliated persons” are affiliates of the Distributor,Adviser, Fund, Trust, or any other client of the Adviser.
** Security that was considered affiliated due to the Fund’s beneficial ownership representing more than 5% of the outstandingsecurities during the year ended June 30, 2006, but not at June 30, 2006.
*** Oshkosh B’Gosh was acquired by Carters, Inc.® on 7/15/05.
Note: Schedule may not roll forward, as the schedule only reflects activity during time the Fund was deemed an affiliate (heldmore than 5% of a stock’s outstanding securities).
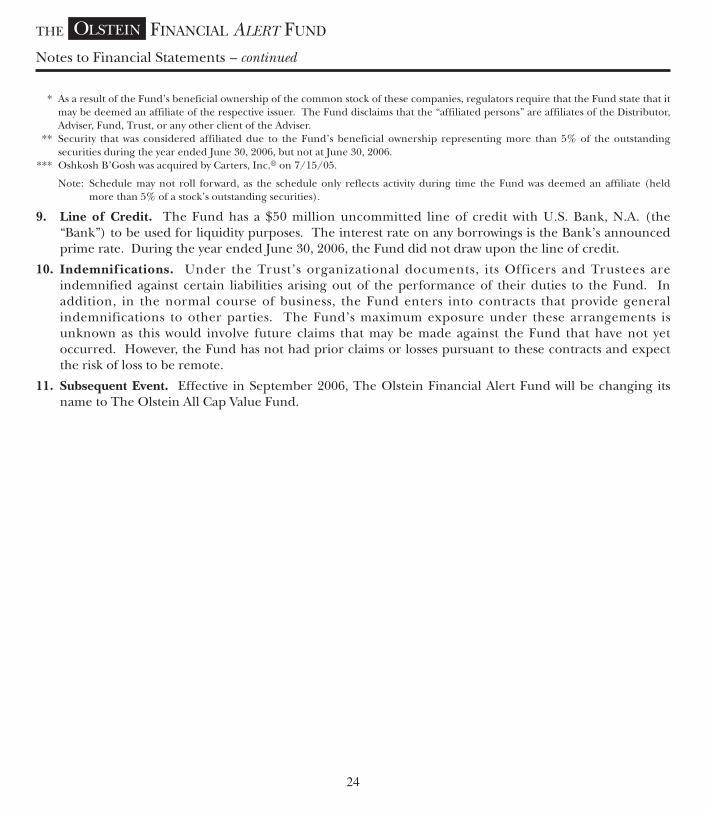
9. Line of Credit. The Fund has a $50 million uncommitted line of credit with U.S. Bank, N.A. (the“Bank”) to be used for liquidity purposes. The interest rate on any borrowings is the Bank’s announcedprime rate. During the year ended June 30, 2006, the Fund did not draw upon the line of credit.
10. Indemnifications. Under the Trust’s organizational documents, its Officers and Trustees areindemnified against certain liabilities arising out of the performance of their duties to the Fund. Inaddition, in the normal course of business, the Fund enters into contracts that provide generalindemnifications to other parties. The Fund’s maximum exposure under these arrangements isunknown as this would involve future claims that may be made against the Fund that have not yetoccurred. However, the Fund has not had prior claims or losses pursuant to these contracts and expectthe risk of loss to be remote.
11. Subsequent Event. Effective in September 2006, The Olstein Financial Alert Fund will be changing itsname to The Olstein All Cap Value Fund.
24
Notes to Financial Statements – continued
THE FINANCIAL ALERT FUNDOLSTEIN

25
Report of Independent Registered Public Accounting Firm
THE FINANCIAL ALERT FUNDOLSTEIN
To the Shareholders and Trustees of The Olstein Financial Alert Fund:
We have audited the accompanying statement of assets and liabilities of The Olstein Financial Alert Fund (“theFund”), including the schedule of investments, as of June 30, 2006, and the related statements of operationsfor the year then ended, the statements of changes in net assets for each of the two years in the period thenended, and the financial highlights for each of the periods indicated therein. These financial statements andfinancial highlights are the responsibility of the Fund’s management. Our responsibility is to express anopinion on these financial statements and financial highlights based on our audits.
We conducted our audits in accordance with the standards of the Public Company Accounting OversightBoard (United States). Those standards require that we plan and perform the audit to obtain reasonableassurance about whether the financial statements and financial highlights are free of material misstatement.We were not engaged to perform an audit of the Fund’s internal control over financial reporting. Our auditsincluded consideration of internal control over financial reporting as a basis for designing audit proceduresthat are appropriate in the circumstances, but not for the purpose of expressing an opinion on theeffectiveness of the Fund’s internal control over financial reporting. Accordingly, we express no suchopinion. An audit also includes examining, on a test basis, evidence supporting the amounts and disclosuresin the financial statements and financial highlights, assessing the accounting principles used and significantestimates made by management, and evaluating the overall financial statement presentation. Our proceduresincluded confirmation of securities owned as of June 30, 2006, by correspondence with the custodian andbrokers or by other appropriate auditing procedures where replies from brokers were not received. Webelieve that our audits provide a reasonable basis for our opinion.
In our opinion, the financial statements and financial highlights referred to above present fairly, in allmaterial respects, the financial position of The Olstein Financial Alert Fund at June 30, 2006, the results of itsoperations for the year then ended, the changes in its net assets for each of the two years in the period thenended, and the financial highlights for each of the periods indicated therein, in conformity with U.S.generally accepted accounting principles.
Chicago, IllinoisAugust 18, 2006

Proxy Voting
The Board of Trustees of the Trust, on behalf of the Fund, has delegated all proxy voting responsibilitiesrelated to the portfolio securities held by the Fund to the Investment Manager. A description of the Fund’sproxy voting policies and procedures is available without charge, upon request, by calling toll-free 1-800-799-2113. A description is also included in the Fund’s Statement of Additional Information, which isavailable on the SEC’s website at http://www.sec.gov.
The Investment Manager’s proxy voting record for the Fund for annual periods ending June 30 each year willbe available to shareholders. The proxy voting record is available, without charge, upon request by calling,toll-free, 1-800-799-2113 and on the SEC website at http://www.sec.gov.
Portfolio Holdings
The Fund includes a complete schedule of its portfolio holdings in its annual and semi-annual reports. TheFund is required to file a complete schedule of portfolio holdings with the SEC for the first and third fiscalquarters on Form N-Q. Once filed, the Form N-Q is available, without charge, upon request on the SEC’swebsite at http://www.sec.gov. Copies of Form N-Q can also be obtained by (i) visiting the SEC’s PublicReference Room in Washington, DC (information on the operation of the Public Reference Room may beobtained by calling 1-800-SEC-0330); (ii) sending your request and a duplicating fee to the SEC’s PublicReference Room, Washington, DC 20549-0102; or (iii) sending your request electronically tohttp://www.publicinfosec.gov.
Additional Tax Information
For corporate shareholders in the Fund, the percentage of dividend income distributed for the year endedJune 30, 2006, which is designated as qualifying for the dividends received deduction, is 63.4%.
For shareholders in the Fund, the percentage of dividend income distributed for the year ended June 30,2006, which is designated as qualified dividend income under the Jobs and Growth Tax Relief Act of 2003, is69.4%.
Additional Information Applicable to Foreign Shareholders Only
The Fund hereby designates 10% of its ordinary income distributions for the fiscal year ended June 30, 2006as interest related dividends under Internal Revenue Service Code Section 871(k)(1)(C).
The Fund hereby designates 100% of its ordinary income distributions for the fiscal year ended June 30, 2006as short-term capital gain distributions under Internal Revenue Service Code Section 871(k)(2)(C).
26
Additional Information
THE FINANCIAL ALERT FUNDOLSTEIN

Board of Trustees and Officers of the Trust______________________________________
The Board of Trustees of the Trust consists of six individuals, four of whom are not “interested persons” ofthe Trust or Fund as that term is defined in the 1940 Act. The Trustees are fiduciaries for the Fund’sshareholders and are governed by the law of the State of Delaware in this regard. They establish policy forthe operation of the Fund and appoint the officers who conduct the daily business of the Fund.
The officers conduct and supervise the daily business operations of the Trust, while the Trustees review suchactions and decide on general policy. Compensation to officers and Trustees of the Trust who are affiliatedwith the Investment Manager is paid by the Investment Manager and not by the Trust.
Information pertaining to the Trustees and Principal Executive Officers of the Fund is set forth below. TheSAI includes additional information about the Fund’s Trustees and Officers and is available, without charge,upon request by calling 1-800-799-2113.
Number of Term of PortfoliosOffice and in Fund
Position(s) Length of ComplexHeld with Time Principal Occupation Overseen Other Directorships
Name, Address and Age the Fund Served** During Past Five Years by Trustee Held by Trustee___________________ _________ ________ __________________ ________ ______________Disinterested Trustees:
Fred W. Lange Trustee Since Private investor. 1 Wagner College123 Lewisburg Road 1995Sussex, NJ 07461Age: 73
John Lohr Trustee Since Retired; General Counsel, LFG, Inc. 1 CrosswaterP.O. Box 771407 1995 (provider of investment products), FinancialOrlando, FL 32877-1407 January 1996 to September 2002. CorporationAge: 61
D. Michael Murray Trustee Since President, Murray, Montgomery & 1 American Murray, Montgomery 1995 O’Donnell (Consultants), since 1968. Academy of& O’Donnell Preventive
100 Constitution Ave. MedicineSuite 900Washington, DC 20001Age: 65
Lawrence K. Wein Trustee Since Private Consultant for telecommunications 1 eRooms Systems27 Rippling Brook Drive 1995 industry, since July 2001; Former Vice TechnologiesShort Hills, NJ 07078 President-Wholesale Business Operations, (ERMS. OB)Age: 64 Concert Communications an ATT/BT
Company, April 2000 to June 2001; Former Executive Manager, AT&T, Inc., for 35 years, retired July 2001.
27
Additional Information
THE FINANCIAL ALERT FUNDOLSTEIN

Number of Term of PortfoliosOffice and in Fund
Position(s) Length of ComplexHeld with Time Principal Occupation Overseen Other Directorships
Name, Address and Age the Fund Served** During Past Five Years by Trustee Held by Trustee___________________ _________ ________ __________________ ________ ______________Interested Trustees:
Erik K. Olstein*+ Trustee, Since President and Chief Operating Officer, 1 Nonec/o Olstein & Associates, L.P. Secretary 1995 Olstein & Associates, L.P., since 2000; 4 Manhattanville Road and Vice President of Sales and Chief OperatingPurchase, NY 10577 Assistant Officer, Olstein & Associates, L.P., 1994-2000.Age: 38 Treasurer
Robert A. Olstein*+ Chairman Since Chairman, Chief Executive Officer and 1 Nonec/o Olstein & Associates, L.P. and 1995 Chief Investment Officer, Olstein & 4 Manhattanville Road President Associates, L.P., since 2000; Chairman, Purchase, NY 10577 Chief Executive Officer, Chief Investment Age: 65 Officer and President, Olstein &
Associates, L.P., 1994-2000; President, Secretary and Sole Shareholder ofOlstein, Inc., since June 1994.
Officers:
Michael Luper Chief Since 1995 Executive Vice President and Chief FinancialOlstein & Associates, L.P. Accounting Officer, Olstein & Associates, L.P., since 2000;4 Manhattanville Road Officer and Vice President and Chief Financial Officer,Purchase, NY 10577 Treasurer Olstein & Associates, L.P., 1994-2000.Age: 37
James B. Kimmel, Esq. Chief Since 2004 Vice President, General Counsel and ChiefOlstein & Associates, L.P. Compliance Compliance Officer, Olstein & Associates, L.P.4 Manhattanville Road Officer Previously, Of Counsel at Stradley Ronon Purchase, NY 10577 Stevens & Young LLP (law firm), May 2001 to Age: 43 April 2004, Vice President and Assistant Counsel
in the Corporate and Securities Group at Summit Bancorp from September 1996 through May 2001. Associate Attorney in the Investment Management Practice Group at Morgan Lewis & Bockius LLP from September 1990 through August 1996.
* Robert and Erik Olstein are each officers of Olstein & Associates, L.P. or its affiliates. Each of these persons are considered to be an“interested person” of the Fund and “Interested Person” within the meaning of the Investment Company Act of 1940.
+ Erik K. Olstein is the nephew of Robert A. Olstein, President of The Olstein Funds.** Each Trustee holds office during the lifetime of the Fund until their termination or until the election and qualification of his
successor.
28
Additional Information – continued
THE FINANCIAL ALERT FUNDOLSTEIN

(This Page Intentionally Left Blank.)

(This Page Intentionally Left Blank.)

(This Page Intentionally Left Blank.)

Olstein Financial Alert Fund
A N N U A L R E P O R T
J U N E 3 0 , 2 0 0 6
The Olstein Funds
TrusteesRobert A. Olstein, ChairmanFred W. LangeJohn LohrD. Michael MurrayErik K. OlsteinLawrence K. Wein
Investment ManagerOlstein & Associates, L.P.4 Manhattanville RoadPurchase, NY 10577
DistributorOlstein & Associates, L.P.
Administrator, Transfer Agent,Dividend Paying Agent &Shareholder Servicing AgentU.S. Bancorp Fund Services, LLC615 East Michigan StreetP.O. Box 701Milwaukee,WI 53202
CustodianU.S. Bank, N.A.1555 North RiverCenter Drive, Suite 302Milwaukee, WI 53212
Legal CounselStradley, Ronon, Stevens & Young, LLP2600 One Commerce SquarePhiladelphia, PA 19103-7098
Independent Registered PublicAccounting FirmErnst & Young LLP233 South Wacker DriveChicago, IL 60606
This report is submitted for the generalinformation of the shareholders of the Fund.The report is not authorized for distribution to prospective investors in theFund unless preceded or accompanied byan effective Prospectus.
Toll Free Telephone800.799.2113www.olsteinfunds.com