on current economic conditions - new york city · david rubenstein deputy director tax policy,...
TRANSCRIPT
The City of New York
Rudolph W. Giuliani
Mayor
Office of Management and
Budget
Adam L. Barsky Director
David Rubenstein Deputy Director
Tax Policy, Revenue Forecasting &
Economic Analysis Task Force
Yousuf Rahman Chief Economist (646) 458-1770
Steven Giachetti (646) 458-1503
Joshua Goldstein (646) 458-1207
Emily Raimes
(646) 458-1792
Monthly Report On
Current Economic Conditions
December 3, 2001
Highlights The September 11 attack on New York City dealt the final blow
to an already weakening U.S. economy. A contraction in Q3 Real GDP (gross domestic product) has already been confirmed, and the Q4 decline is expected to be sharper.
Data since the attack show consumer and investor confidence
plunging. The national slowdown is expected to be relatively short-lived, countered in early 2002 by the Federal Reserve’s aggressive lowering of interest rates and a fiscal stimulus package from Washington. Growth in the beginning of 2002 will remain anemic, but the economy is expected to turn around by the middle of next year.
In New York City, the forecast for employment and wage rate
growth has been lowered sharply as well. It is anticipated that the job losses resulting from the terrorist attack and the national slowdown will total 114,000 in the private sector in 2002.
Please visit our website at www.nyc.gov/html/omb/home.html

The U.S. Economy
Going into the week of September 11 the major uncertainty surrounding the U.S. economy was how long and deep the national slowdown would be. The consensus view (Blue Chip Economic Indicators) was that growth in the U.S. economy would be anemic but positive in Q3 and Q4 and that a healthy rebound would occur in early 2002. This view was based on the belief that the manufacturing sector had shown signs of bottoming out and that the combined stimuli from interest rate and tax cuts would help keep the economy afloat1. Some economists, however, calling for a more protracted and severe recession, had begun to express increasing skepticism, pointing out that the manufacturing sector was still overridden by excess capacity and that the effects of fiscal and monetary policy might be insufficient to keep consumers from retrenching given the deteriorating employment picture.
With the September 11 attack and the sharp fall in consumer and business confidence, it became quickly apparent that the U.S. economy would not be able to avoid a contraction in Q3 and Q4. Consumer confidence (University of Michigan Index) fell to 81.8 in September and the NAPM index (National Association of Purchasing Managers) plunged below 40, the lowest reading since 1991. GDP data for Q3, confirmed that growth had indeed fallen by 1.1 percent. Recent indicators suggest a sharper contraction in Q4, now projected to be down 2.5 percent.
The debate on the outlook for the U.S. economy has since shifted to 2002. There is a widening rift among economists on the persistence of the contraction through the first quarter of 2002 and whether the stimulus package will be effective in jump-starting the economy by the middle of next year. Real GDP
The current forecast assumes that the U.S. economy will still resume growth in 2002, albeit at a much lower rate than in the Executive Budget forecast. This view is based on the belief, that although the events of September 11 inflicted a serious shock to the economy, the effects will be relatively short-lived. Furthermore, the effect of these events on consumers and
1 This view was largely consistent with our outlook proposed at the time of the NYC Executive Budget, released May 2001.
businesses will be countered by the Federal Reserve’s aggressive action in lowering interest rates, currently at the lowest levels since the 1960s, and the additional fiscal stimulus package from Washington. Real GDP in 2002 is now forecast to grow by 1.3 percent with consumption at 2.1 percent, down significantly from the previous forecast of 3.2 percent and 3.8 percent respectively.
Real GDP is forecast to pick up in 2002, although at a modest rate, thanks to the positive effects of monetary and fiscal policy.
05040302010099
10
8
6
4
2
0
-2
-4
100
80
60
40
20
0
-20
-40
Perce
nt $ bil
Actual Forecast
Real GDP Annual Rate, Left ScaleFederal Surplus/Deficit, Right ScaleFederal Funds Rate, Left Scale
S u m m a r y C o m p a r i s o n T a b l e(Ca lendar Year )
2001 2002 2 0 0 3R e a l G D P ( % C h g . Y / Y )
Q 1 M o d 1.0 1.3 3.9Exec 1 .7 3.2 4.3
C o n s u m p t i o n ( % C h g . Y / Y )Q 1 M o d 2.7 2.1 3.7Exec 3 .1 3.8 4.4
E m p l o y m e n t (% Chg . Y /Y )Q 1 M o d 0.5 0.1 0.9Exec 0 .7 0.6 1.6
Federa l Surplus ($ Bil.)Q 1 M o d 162 .9 23.3 5.6Exec 260 .3 177.7 150.0

The U.S. Economy
The forecast for 2003-2005 then assumes a pick-up in real GDP and consumption pick up, although growth averages at only a trend rate. The current projected federal budget surplus disappears by early next year and subsequently falls into a deficit that grows to about $50 billion by 2005. The Federal Reserve is expected to keep short term interest rates at current lows, before tightening slightly in the la tter part of 2002 and early 2003. Employment and Wages
The forecast for employment and wage rate growth has also been lowered sharply in the near term. The job outlook in Q4 is grim as indicated by October’s employment report which showed job losses in excess of 450,000, the steepest drop in over 20 years. In addition to the losses in manufacturing, other sectors of the economy are also slated for heavy losses, specifically airline transportation and other sectors related to tourism. The unemployment rate is forecast to rise to 6 percent in 2002. As with the rest of the economy the effects of the downturn on jobs will be concentrated in the very near term and growth is forecast to resume by early 2002. Employment growth picks up in 2003-2005 along with the rest of the economy, averaging about 1 percent per year on average.
Consumption and employment rebound in 2002, although growth in investment lags until 2003.
The cooling job market should ease wage pressures, which had been building prior to the burst of the stock market bubble. Wage rates are forecast to grow by only 4 percent on average per year from 2002-2005 and inflationary pressures are also contained, with prices rising only 2½-3 percent per year throughout the forecast.
Investment and Profits
The outlook for the other components of GDP, investment and corporate profits, remains bleak in the near term. Given the nature of the current slowdown, which unlike previous recessions was triggered by over investment by businesses rather than Fed tightening in response to rising inflation, the current forecast assumes that the investment and corporate profits growth will continue to suffer. Non-residential investment spending is forecast to drop by 4 percent in 2002, following a similar drop in 2001 and resumes growth only in 2003-2005 at an average rate of 6 percent, well below the double digit rates of the 1994-2000 period. Corporate profits take their biggest hit since the 1980 recession, declining by an estimated 18 percent this year, and are forecast to be flat in 2002. In the outyears corporate profit growth is limited to only about 4 percent per year.
The current forecast, admittedly, is laden with caveats and uncertainties. Crucial assumptions are, 1) that the political tensions and war in Afghanistan will not worsen and have a protracted effect on consumer sentiment, and 2) Congress agrees on a stimulus package quickly. All this is far from certain at present. The forecast rebound could also be delayed by other factors, namely a continued slump in business confidence due to the investment overhang, or a worsening global economy to name some looming destabilizing factors. All this indicates that there are several potential downside risks to the current baseline forecast.
05040302010099
15
10
5
0
-5
-10
-15
6
5
4
3
2
1
0
-1
Perce
nt C
hg Y
/Y
Percent Chg Y/Y
Forecast
Employment, Right ScaleReal Consumption Spending, Right Scale Non-Residential Investment, Left Scale

New York City
Prior to the attack on the World Trade Center, the New York City economy was already showing signs of slowing from the frenetic pace of the late 1990s. Through the first nine months of 2001, employment in areas like finance, business services, and retail trade contracted, securities industry profits were falling, and a substantial amount of office space had been returned to the market as the dot-com boom turned to bust. Overall, the local economy was expected to contract slightly through the second quarter of 2002 with private employment essentially flat for the year and wage income growth slowing to 3 percent in 2001 and 2 percent in 2002 (compared to average growth of over 8 percent from 1996-2000). The attack on the World Trade Center on top of an already deteriorating national economy has caused the local outlook to change quite drastically. Employment – Effects of the World Trade Center Attack
It is anticipated that total direct and indirect job losses resulting from the destruction of the World Trade Center will total over 90,000. About 17,000 of these jobs lost are the result of firms in the immediate vicinity of the disaster relocating to New Jersey, Westchester, or Connecticut. Another 30,000 jobs lost are in tourism-related industries, which were severely impacted by the attack. Over 45,000 additional jobs will be lost as businesses are forced to close due to reduced business activity (the multiplier effect).
Particularly hard hit by the attack were FIRE (finance, insurance, and real estate) sector firms that were located in or around the WTC complex. This is not surprising considering that the FIRE sector accounted for over 75 percent of employment in the Trade Center. Many of the FIRE sector firms affected have relocated within the City, although some firms, citing difficulty obtaining large blocks of space, have already signed new long-term leases outside the City with others simply moving employees to already established offices outside the City. Much of the immediate effect of the World Trade Center disaster is reflected in the October employment report. Seasonally adjusted monthly data show that 74,000 private sector jobs were lost. As expected, FIRE lost 24,000 jobs, most of which were in securities. Tourism-related jobs were also severely impacted, with retail trade losing 17,000 jobs, 13,000 of which were in eating and drinking establishments. Services shed 21,000 jobs, with the hotel services sub-sector dropping 10 percent of its workforce, or 4,000
jobs. TCPU (transportation, communication, and public utilities), which includes the airline industry, fell by 6,000 jobs.
The City is expected to experience significant employment losses as a result of the World Trade Center attack. Job growth gradually returns in the outyears.
Employment Changes – 2002-2005
Combining the effects of the September 11
attack with the further dampening effects from the national slowdown, brings total job losses in 2002 to 114,000, compared to the pre-September forecast of 7,000 new jobs in 2002.
The majority of the expected losses are in FIRE, services, and trade. Within FIRE, the securities industry is hardest hit (in percentage terms), responsible for 20,000 of the 29,000 FIRE job losses. Part of these job losses were already anticipated in the Executive Budget, since the sector was already entering a bearish cycle. Securities is now expected to stabilize in 2003 and show small gains in 2004-2005, while FIRE as a whole is projected to lose 7,000 jobs in 2003 due to the continuing decline in banking. FIRE then adds approximately 5,000 new jobs per year in 2004-2005.
The service sector is forecast to lose 36,000 jobs in 2002, with the losses largely concentrated in business services and tourism-related businesses such as hotels, the amusement and recreation industry, and museums. Although services start to pick up jobs after 2002, by
050403020100
4
2
0
-2
-4
-6
% C
hang
e Y
/YPrivate Empl. Executive Budget Private Empl., Q1 Mod

New York City
200520001995199019851980
25
20
15
10
5
0
-5
$ Bi
llion
NYSE Member Firm Profits FIRE Bonus Pool
2005 the sector is still only expected to grow by 32,000 jobs a year, nowhere near the average annual growth of 50,000 jobs during 1995-2000.
The trade sector is projected to shed 31,000 jobs, 29,000 more than the 2,000 jobs losses that were expected at the time of the Executive Budget. Again, many of the newly forecast losses will be tourism-related jobs, such as retail employment in eating and drinking establishments and in department stores. After this sharp dip, trade is expected to be relatively flat in 2003 and starts to pick up in 2004-2005, gaining 13,000 jobs per year.
The manufacturing sector, which has been steadily declining for years, continues that trend, shedding 15,000 jobs in 2002 and then 4,000 jobs per year through 2005. The TCPU (transportation, communication, and public utilities) sector is forecast to shed 9,000 jobs in 2002, many of them airline workers. The sector will be flat in 2003 and then inch up to small gains by 2005. The one sector that is not expected to be adversely affected by the September 11 disaster is the construction sector, which is forecast to pick up 5,000 new jobs per year in the coming years, primarily due to new construction in the downtown area. Securities Industry Profits and Bonuses
Following the record $21 billion in profits in
2000, profits in the executive budget were forecast to drop significantly in 2001 to $5.5 billion. With profits plunging, FIRE sector employees were expected to see a severe reduction in their bonuses. With much uncertainty as to the effects of a recent shift in the long-term interest rate environment and the unknown effects of the Enron bankruptcy this assumption has been held, although the sizes of the bonus pool has been lifted following more recent information about bonuses on calendar 2000 earnings.
Outside of the FIRE sector, average wages rise
by 2.7 percent in 2002. Given the expected steep decline in bonuses, the average wage in the City, after rising by 5.2 percent in 2001, drops by 2.5 percent in 2002. Lower wages, combined with the massive employment losses, lead to a decline in overall wage income in 2002 of 6 percent.
After a decade of phenomenal growth, a sharp correction in FIRE sector profits and bonuses is expected.
Real Estate Market
The real estate implications of the WTC attack are numerous and complex. In the near term, nearly 30 million square feet of downtown office space, or 30 percent of the entire downtown market, was affected by the attack. Over 35,000 people were employed in the Trade Center complex and nearly 15,000 were employed in the World Financial Center complex. Hundreds of tenants were initially displaced, many scrambling for space inside and outside the City, with the majority of firms remaining in Manhattan. Concurrently, many firms were in the process of returning unused space to the sublet market, providing much needed relie f for these displaced firms. However, larger blocks of space, as usual, are difficult to obtain, forcing some companies to sign long-term leases outside of the City.
Through the end of 2001 the commercial real estate market should remain relatively tight, as the demand for space by temporarily displaced firms offsets newly available space. In 2002, however, as most of the downtown space (with the exception of the nearly 13 million square feet of the World Trade Center complex) is returned to operable condition, the market is expected to begin to loosen. The loss of 114,000 jobs in 2002 will loosen the market further, as will the delivery of nearly 10 million square feet of inventory already in the pipeline.

New York City
04020098969492908886
18
16
14
12
10
8
6
4
2
65
60
55
50
45
40
35
30
Vac
ancy
Rat
e
$ Per Square Foot
Vacancy Rate, left scaleAsking Rent, right scale
Given the underlying employment forecast, vacancy rates are expected to jump and asking rents ease. However, a collapse in the market, as in the mid 1990s is not anticipated.
Primary market vacancy rates rise to 7.5 percent in 2002 from 5.5 percent in 2001. As the City’s economy stabilizes, vacancy rates level off at around 8.5 percent (8-10 percent is often considered the market equilibrium) from 2003-2005. The drop in demand coupled with increased supply should cause asking rents to remain flat in 2001, after a jump of nearly 30 percent in 2000, and then fall by 4 percent in 2002 before stabilizing in 2003-2005.
The real estate market was in very good
condition prior to the tragic events of September 11 and should be able to withstand the oncoming recession, unlike the real estate collapse in the early 1990s. The real estate crash of the early 1990s, when vacancy rates more than doubled, was not only caused by an enormous drop in demand for office space (the City lost over 300,000 jobs) but also by a simultaneous increase of over 40 million square feet of inventory, which took place between 1987 and 1992. Much of this inventory was being built on a speculative basis, without a major tenant in mind. While demand is certainly expected to drop in the City over the next year, there has been a sparse amount of new supply added to the commercial real estate markets and relatively little planned in the pipeline. Since 1995, only 2 major buildings have been added to the skyline. As mentioned before, the additional supply of nearly 10 million square feet of office space, most of which is already pre-leased, should loosen the
market further, but unlike the 1990s is not expected to cause a crash.

1999 2000 2001 2002 2003 2004 2005 1969-2000* NATIONAL ECONOMY Real GDP Bil of 1996 Dollars 8,856.5 9,224.0 9,315.8 9,435.1 9,840.3 10,130.0 10,411.7 Percent Change 4.1 4.1 1 1.3 4.3 2.9 2.8 3.0 Non-agricultural Empl Millions of Jobs 128.9 131.8 132.4 132.6 133.7 135.2 136.9 Change from Prev Yr 3.1 2.9 0.6 0.2 1.1 1.5 1.7 Percent Change 2.4 2.2 0.5 0.1 0.9 1.1 1.3 2.0 Consumer Price Index All Urban (1982-84=100) 166.7 172.3 177.6 181.2 185.5 190.4 195.6 Percent Change 2.2 3.4 3.1 2 2.4 2.6 2.7 5.2 Wage Rate Dollars Per Year 34,695 36,713 38,596 39,766 41,570 43,316 44,845 Percent Change 4.1 5.8 5.1 3 4.5 4.2 3.5 5.3 Before-Tax Corp Profits Billions of Dollars 776.3 845.4 692.2 700 769.5 775.6 793.2 Percent Change 7.7 8.9 -18.1 1.1 9.9 0.8 2.3 7.8 Unemployment Rate Percent 4.2 4 4.7 5.9 5.4 5.1 5 6.3 (avg) Federal Funds Rate Percent 5 6.2 3.9 3 4.6 5 5 7.4 (avg) NEW YORK CITY ECONOMY Real Gross City Product** Bil of 1996 Dollars 406.5 438.4 438.6 399.3 420.3 432.8 443.8 Percent Change 3.9 7.8 0 -8.9 5.3 3 2.5 2.6 Non-agricultural Empl Thousands of Jobs 3,621 3,721 3,736 3,622 3,630 3,673 3,727 Change from Prev Yr 92.8 99.8 15.7 -114 7.7 43.1 54.4 Percent Change 2.6 2.8 0.4 -3.1 0.2 1.2 1.5 -0.2 Consumer Price Index All Urban (1982-84=100) 177 182.5 187.8 191.8 196.4 201.4 207 Percent Change 1.9 3.1 2.9 2.1 2.4 2.5 2.8 5.2 Wage Rate Dollars Per Year 54,083 57,956 60,983 59,430 62,515 65,097 67,778 Percent Change 3.7 7.2 5.2 -2.5 5.2 4.1 4.1 6.5 Personal Income Billions of Dollars 278.3 296.9 310.5 300.6 316.7 332.4 350.8 Percent Change 6.6 6.7 4.6 -3.2 5.4 5 5.5 6.8 NEW YORK CITY REAL ESTATE MARKET Manhattan Primary Office Market Asking Rental Rate*** Dollars per sq ft 45.92 58.52 58.41 56.06 57.94 59.83 62.66 Percent Change 9.7 27.4 -0.2 -4 3.3 3.3 4.7 NA Vacancy Rate*** Percent 6.2 3 5.5 7.5 8.4 8.5 8.3 NA * Compound annual growth rates for 1969-1999. Compound growth rate for Real Gross City Product covers the period 1978-1998; for NYC wage rate, 1975-1998. ** GCP estimated by OMB. *** Office market data are based on statistics published by Cushman & Wakefield. Data for 1995 and beyond are not directly comparable to
Q1 Mod 2002Forecasts of Selected United States and New York City Economic Indicators
Calender Year 1999-2005

The U.S. Economy 5/00 6/00 7/00 8/00 9/00 10/00 11/00 12/00 1/01 2/01 3/01 4/01 5/01 6/01 7/01 8/01 9/01 10/01
General Economic Indicators Nominal GDP $bil 9,857.6 9,937.5 10,027.9 10,141.7 10,202.6 10,230 Real GDP (Chain-Wt) $96bil 9,229.4 9,260.1 9,303.9 9,334.5 9,341.7 9,317 q/q SAAR % 5.7 1.3 1.9 1.3 0.3 -1.1 y/y%chg % 5.2 4.4 2.8 2.5 1.2 0.6
Nominal Change in Inventories $96bil 75.4 52.5 38.7 -25.5 -36.7 Real Change in Inventories $96bil 78.9 51.7 42.8 -27.1 -38.3 -60
Real Final Sales $96bil 9,150.40 9,208.40 9,261.20 9,361.6 9,380.00 9,376.90 q/q SAAR % 3.4 2.6 2.3 4.4 0.8 0 y/y%chg % 4.7 4.3 3.4 3.2 2.5 1.8
Consumption Expenditures $96bil 6,226.3 6,292.1 6,341.1 6,388.5 6,428.4 6,447 q/q SAAR % 3.6 4.3 3.1 3 2.5 1.1 y/y%chg % 4.9 4.9 4.2 3.5 3.2 2.5
Nonres Fixed Investments $96bil 1,347.7 1,371.1 1,374.5 1,373.90 1,320.9 1,289.10 q/q SAAR % 12.2 7.1 1 -0.2 -14.6 -9.3 y/y%chg % 10.9 10.2 8.9 5 -2 -6 Invesment Proc Machines $96bil 601.5 621 641.8 620.9 588.1 570.8 q/q SAAR % 20.9 13.6 14.1 -12.4 -19.5 -11.3 y/y%chg % 20.8 19.4 19.8 8.3 -2.2 -8.1
Residential Fixed Inv $96bil 376.5 366.3 365.3 372.9 378.3 380.6 q/q SAAR % -0.8 -10.4 -1.1 8.5 5.9 2.5 y/y%chg % 2.0 -0.5 -1.2 -1.2 0.5 3.9
Net Exports $96bil -392.8 -411.2 -421.1 -404.5 -406.7 -408.1 Pre-tax Corp Profits $bil 862 858 817 756 738 680.1 % chg SAAR % 8.3 -1.7 -18.1 -26.6 -8.9 -28 %chg y/y % 13.6 12.1 -1 -10.6 -14.4 -20.8
Employment, Payroll Total 000 131,909 131,969 131,899 131,837 132,046 132,145 132,279 132,367 132,428 132,595 132,654 132,489 132,530 132,431 132,449 132,395 132,230 131,762 chg from previous period 000 226.0 60.0 -70.0 -62.0 209.0 99.0 134.0 88.0 61.0 167.0 59.0 -165.0 41.0 -99.0 18.0 -54.0 -165.0 -468.0 y/y%chg % 2.7 2.5 2.2 2.0 2.0 1.8 1.7 1.5 1.3 1.3 0.9 0.6 0.5 0.4 0.4 0.4 0.1 -0.3
Private 000 110,795 111,029 111,180 111,237 111,463 111,564 111,689 111,753 111,799 111,915 111,943 111,742 111,760 111,603 111,517 111,390 111,249 110,762 chg from previous period 000 -133 234 151 57 226 101 125 64 46 116 28 -201 18 -157 -86 -127 -141 -487
FIRE 000 7,550 7,541 7,536 7,549 7,556 7,569 7,575 7,582 7,594 7,609 7,618 7,626 7,644 7,631 7,618 7,623 7,633 7,627 chg from previous period 000 -8 -9 -5 13 7 13 6 7 12 15 9 8 18 -13 -13 5 10 -6 Service 000 40,312 40,447 40,495 40,613 40,736 40,767 40,845 40,901 40,984 41,020 41,073 40,993 41,078 41,085 41,046 41,129 41,134 40,983 chg from previous period 000 -6 135 48 118 123 31 78 56 83 36 53 -80 85 7 -39 83 5 -151 Manufacturing 000 18493 18521 18554 18485 18421 18404 18382 18349 18257 18192 18116 18009 17879 17757 17688 17533 17448 17324 chg from previous period 000 -24 28 33 -69 -64 -17 -22 -33 -92 -65 -76 -107 -130 -122 -69 -155 -85 -124 Leading Econ Indicators % chg 0 -0.2 -0.1 -0.3 0 -0.4 -0.3 -0.4 0 0.1 -0.2 0 0.6 0.2 0.3 -0.1 -0.5 0.3 ratio 1.0 1.0 1.0 1.0 1.0 1.0 1.0 1.0 1.0 1.0 1.016 1.017 1.027 1.0 1.051 1.053 1.049 Initial Claims for Unempl 000/wk 287.3 300.4 295.3 316.2 306.6 310.0 345.9 355.4 325.9 356.4 377.8 405.6 414.8 408.6 395.6 399.5 455 496.2 % of total employment 2.18 2.28 2.24 2.4 2.32 2.35 2.61 2.68 2.46 2.69 2.85 3.06 3.13 3.09 2.99 3.02 3.44 3.77 Unemployment Rate, Civ % 4.1 4 4 4.1 3.9 3.9 4 4 4.2 4.2 4.3 4.5 4.4 4.5 4.5 4.9 4.9 5.4 Weekly Hours hrs/wk 34.4 34.5 34.4 34.3 34.4 34.4 34.3 34.2 34.4 34.3 34.3 34.2 34.2 34.2 34.2 34 34.1 34

4/00 5/00 6/00 7/00 8/00 9/00 10/00 11/00 12/00 1/01 2/01 3/01 4/01 5/01 6/01 7/01 8/01 9/01 10/01Consumer Personal Income $bil 8,223 8,272 8,318 8,344 8,377 8,423 8,479 8,514 8,567 8,604 8,640 8,676 8,697 8,709 8,738 8,769 8,775 8,773 8,770
% change m/m % 0.7 0.6 0.6 0.3 0.4 0.5 0.7 0.4 0.6 0.4 0.4 0.4 0.2 0.1 0.3 0.4 0.1 0 0
% change y/y % 7.0 7.2 7.2 7.1 7.0 7.5 7.3 7.3 7.3 6.8 6.7 6.3 5.8 5.3 5 5.1 4.8 4.2 3.4 Consumption Expenditures $bil 6,650 6,672 6,703 6,746 6,771 6,840 6,846 6,870 6,898 6,960 6,979 6,994 7,017 7,044 7,073 7,091 7,102 6,984 7,188
% change m/m % 0 0.3 0.5 0.6 0.4 1 0.1 0.3 0.4 0.9 0.3 0.2 0.3 0.4 0.4 0.3 0.2 -1.7 2.9
% change y/y % 7.5 8.0 7.6 7.7 7.5 8.1 7.4 7.3 6.2 6.9 6.0 5.2 5.5 5.6 5.5 5.1 4.9 2.1 5 Wage Rate $/yr 36,292 36,290 36,582 36,834 36,912 37,128 37,429 37,602 37,769 37,928 38,100 38,248 38,439 38,419 38,624 38,690 38,700 38,763 38,801
% change m/m % 0.8 0 0.8 0.7 0.2 0.6 0.8 0.5 0.4 0.4 0.5 0.4 0.5 -0.1 0.5 0.2 0 0.2 0.1
% change y/y % 5.8 5.2 5.8 5.9 5.7 5.9 6.5 6.7 6.6 6 6.1 6.2 5.9 5.9 5.6 5 4.8 4.4 3.7
Personal Savings Rate 1.1 1.4 1.3 1.0 0.9 0.4 0.9 1.0 1.2 0.9 1.1 1.3 1.3 1.1 1 2.4 4.2 4.6 0.2 Consumer Inst Credit $bil 1,436 1,447 1,463 1,471 1,484 1,493 1,509 1,525 1,532 1,549 1,563 1,572 1,584 1,591 1,589 1,588 1,620 1,622 1,629
Change (previous period) $bil 6.4 11.8 15.5 7.8 13.3 8.6 16.8 15.6 6.4 17 14.5 8.7 12.8 6.6 -1.8 -1.5 31.9 2 7
Change(year ago) $bil 102.2 104 114.4 114.6 119.5 126.3 137.8 142.3 137.8 139.4 144.5 142.4 148.8 143.6 126.4 117 135.6 129 119.2
as % of disposable income % 20.6 20.7 20.8 20.8 21 21 21.1 21.2 21.2 21.3 21.4 21.4 21.6 21.6 21.5 21.1 21.2 21.4 21.9
Retail Sales Total $bil 3,055 3,062 3,076 3,088 3,090 3,125 3,116 3,095 3,096 3,138 3,144 3,128 3,177 3,180 3,177 3,184 3,190 3,121 3,361
% change m/m % -1.3 0.2 0.4 0.4 0.1 1.1 -0.3 -0.7 0.0 1.4 0.2 -0.5 1.5 0.1 -0.1 0.2 0.2 -2.2 7.7
% change y/y % 9.1 8.1 8.2 7.7 6.5 7.6 7.0 4.8 3.0 4.2 2.8 1.1 4 3.9 3.3 3.1 3.2 -0.1 7.9
Cons Conf, Conference Bd(1985=100) 137.7 144.7 139.2 143.0 140.8 142.5 135.8 132.6 128.6 115.7 109.2 116.9 109.9 116.1 118.9 116.3 114 97 85.3 New & Existing Home Sales 000 5823 6043 5973 5701 6079 6062 5992 6182 5941 6138 6149 6383 6119 6242 6219 6077 6409 5778 6050
Housing Starts 000 1626.0 1573.0 1560.0 1477.0 1531.0 1508.0 1527.0 1559.0 1532.0 1666.0 1623.0 1592.0 1626.0 1610.0 1634.0 1660.0 1559.0 1572.0 1552.0
Housing Permits 000 1595.0 1540.0 1566.0 1534.0 1544.0 1549.0 1562.0 1614.0 1553.0 1724.0 1663.0 1627.0 1587.0 1621.0 1587.0 1571.0 1571.0 1528.0 1473.0
Auto sales $mil 9.0 8.8 8.9 8.8 8.7 8.9 8.6 8.4 8.1 8.7 8.8 8.4 8.5 8.3 8.4 8.1 7.9 7.7 10.2
Industry
Purchasing Mgrs Index % 54.7 53.1 52.1 51.7 49.9 49.6 48.3 47.9 44.3 41.2 41.9 43.1 43.2 42.1 44.7 43.6 47.9 47.0 39.8
Industrial Production % 0.5 0.7 0.4 -0.4 0.1 0.1 -0.4 -0.3 -0.4 -0.8 -0.3 -0.4 -0.6 -0.3 -0.9 0.1 -0.4 -0.9 -1.2

5/00 6/00 7/00 8/00 9/00 10/00 11/00 12/00 1/01 2/01 3/01 4/01 5/01 6/01 7/01 8/01 9/01 10/01Capacity Utilization %chg y/y 82.7 82.7 82.3 82.6 82.4 82 81.4 80.6 79.7 79.2 78.7 78.4 78 77.2 77.0 Mfrs New Orders-Total $bil 365.8 393.2 359.7 359.8 365.4 353.9 360.1 360 337.2 344.9 347.4 335.4 342.9 332.9 332.6 332.4 311 333.2 %chg m/m 3.6 7.5 -8.5 0.0 1.6 -3.1 1.7 0.0 -6.3 2.3 0.7 -3.4 2.2 -2.9 -0.1 -0.1 -6.5 7.1New Orders Durable Goods $bil 211.5 238.5 204.9 205.2 211.8 199.6 205.6 205.1 183.1 190.3 194 182.9 188.1 183.4 181.6 180.5 163.9 184.8 %chg m/m 5.6 12.7 -14.1 0.1 3.2 -5.7 3 -0.2 -10.7 3.9 1.9 -5.7 2.8 -2.5 -1.0 -0.6 -9.2 12.7
New Orders Non-Defense $bil 66.9 71.6 67.7 67.8 68 67.7 66.7 65.6 66.8 63.7 61.8 60.2 59.6 57.7 56.3 55.7 50.2 53.2
Capital Gds Excl Aircraft %chg m/m -0.5 7.1 -5.5 0.2 0.3 -0.5 -1.5 -1.6 1.8 -4.6 -3 -2.5 -1.1 -3.1 -2.5 -1.1 -9.9 6.1 New Orders Computing $bil 11.6 10.9 11.1 12.5 11.5 12.0 11.8 11.9 11.1 10.8 10.6 9.9 9.3 8.8 8.2 7.4 6.9 8.2 %chg m/m 6.5 -5.9 2.3 12.3 -8.1 4.2 -1.1 0.3 -6.2 -3.4 -1.5 -6.9 -6.2 -4.9 -7.3 -8.8 -7.1 18.4
Mfg & Trade Inventories $bil 1171 1183 1185 1194 1194 1200 1204 1205 1207 1203 1199 1197 1195 1188 1182 1179 1174 Mfg & Trade Sales $bil 844.4 850.1 847.6 847.1 851 847.1 843.4 846.3 843 843 837.8 833.7 841.2 828.4 831.8 832.3 809.3 Inv/Sales Ratio mths sup 1.39 1.39 1.4 1.41 1.4 1.42 1.43 1.42 1.43 1.43 1.43 1.44 1.42 1.43 1.42 1.42 1.45
Prices Consumer Price Index-Total 82-84=100 171.3 172.2 172.7 172.8 173.6 173.9 174.3 174.6 175.7 176.2 176.3 176.8 177.5 177.9 177.4 177.5 178.2 177.6 All Urban %chg SAAR 1.4 6.5 3.5 0.7 5.7 2.1 2.8 2.1 7.8 3.5 0.7 3.5 4.9 2.7 -3.3 0.7 4.8 -4
%chg y/y 3.2 3.7 3.7 3.4 3.5 3.4 3.4 3.4 3.7 3.5 2.9 3.3 3.6 3.2 2.7 2.7 2.6 2.1Consumer Price Index-Core 82-84=100 181 181.3 181.7 182.1 182.6 182.8 183.3 183.5 184.1 184.7 185.1 185.5 185.7 186.3 186.6 187 187.4 187.7 %chg SAAR 2.0 2.0 2.7 2.7 3.3 1.3 3.3 1.3 4 4 2.6 2.6 1.3 3.9 1.9 2.6 2.6 1.9 %chg y/y 2.4 2.5 2.5 2.6 2.6 2.5 2.6 2.5 2.6 2.8 2.7 2.7 2.6 2.8 2.7 2.7 2.6 2.7
Consumer Price Index-Med 82-84=100 259.6 260.6 261.4 262.5 263.5 264.3 265.0 265.8 267.4 268.8 269.8 270.9 271.7 272.7 273 274.5 275.3 276.5 %chg SAAR 4.3 4.7 3.7 5.2 4.7 3.7 3.2 3.7 7.5 6.5 4.6 5 3.6 4.5 1.3 6.8 3.6 5.4 %chg y/y 4.0 4.1 4.1 4.2 4.3 4.3 4.2 4.2 4.5 4.6 4.6 4.7 4.7 4.6 4.4 4.6 4.5 4.6Prod Price Index-Fin goods 82=100 137.1 138.3 138.2 138.0 139.0 139.6 139.8 140.0 141.6 141.7 141.6 142.3 142.4 141.7 140.4 140.9 141.4 %chg SAAR 0.0 11.0 -0.9 -1.7 9.1 5.3 1.7 1.7 14.6 0.9 -0.8 6.1 0.8 -5.7 -10.5 4.4 4.3 %chg y/y 3.6 4.5 4.1 3.3 3.3 3.7 3.8 3.6 4.8 4 3 3.8 3.9 2.5 1.6 2.1 1.7 Crude Oil Price $/barrel 28.8 31.8 29.8 31.2 33.9 33.1 34.4 28.5 29.6 29.6 27.2 27.4 28.6 27.6 26.5 Auto Price $000s 20.7 20.8 20.9 21.0 20.8 21.2 21.2 21.7 21 21.6 21.4 21.5 21.4 21.7 22.1 21.9 21.6 21.2Employment Cost Index % chg SAAR 4.2 3.8 3.5 4.6 3.7 4.2 %chg y/y 4.4 4.4 4.2 4 3.9 4 Non-farm bus productivity % chg SA 6.8 1.7 2.1 0 2.1 1.7 %chg y/y 4.4 4.0 2.6 2.6 1.5 1.5
Unit Labor Cost % chg SA 1.4 5.4 6.5 4.9 2.8 2.4 %chg y/y 1.8 2.6 5.1 4.5 4.9 4.1

6/00 7/00 8/00 9/00 10/00 11/00 12/00 1/01 2/01 3/01 4/01 5/01 6/01 7/01 8/01 9/01 10/01 Financial
Money Supply M2 $bil 4,788 4,808 4,838 4,870 4,891 4,907 4,945 4,995 5,040 5100.7 5,146 5170.7 5214.3 5253.5 5287.1 5398.1 5400.1
%chg y/y 6.0 5.8 6.1 6.4 6.3 6.1 6.3 6.8 7.4 8 8.1 8.5 8.9 9.3 9.3 10.8 10.4
Discount Rate % 6.0 6.0 6.0 6.0 6.0 6.0 6.0 5.5 5 4.8 4.3 3.7 3.5 3.3 3.2 2.8 2
Fed Funds Rate % 6.5 6.5 6.5 6.5 6.5 6.5 6.4 6.0 5.5 5.3 4.8 4.2 4 3.8
Prime Rate % 9.5 9.5 9.5 9.5 9.5 9.5 9.5 9.1 8.5 8.3 7.8 7.2 7.0 6.8 6.7 6.3 5.5
3-mo T-bill Rate % 5.7 6.0 6.1 6.0 6.1 6.2 5.8 5.2 4.9 4.4 3.9 3.6 3.5 3.5 3.4 2.6 2.2
30-yr T-bond Rate % 5.9 5.9 5.7 5.8 5.8 5.8 5.5 5.5 5.5 5.3 5.7 5.8 5.7 5.6 5.5 5.5 5.3
minus Fed Funds Rt (Yld Curve) basis points -60.0 -69.0 -78.0 -69.0 -71.0 -73.0 -91.0 -44.0 -4.0 3.0 85.0 157.0 170.0 184.0
AAA Corp Bond Rate % 7.7 7.7 7.6 7.6 7.6 7.5 7.2 7.2 7.1 7.0 7.2 7.3 7.2 7.1 7.0 7.2 7.0
minus10 yr t-bond basis points 174.0 180.0 183.0 179.0 175.0 167.0 172.0 161.0 165.0 164.0 155.0 151.0 151.0 152.0 154.0 169.0 171.0
Municipal % 5.8 5.6 5.5 5.6 5.6 5.5 5.2 5.1 5.2 5.1 5.3 5.3 5.2 5.2 5.0 5.1 5.0
Eff Mortgage Rate - Existing 8.3 8.2 8.1 8.0 7.9 7.8 7.7 7.3 7.2 7.1 7.1 7.2 7.2 7.2 7.1 6.9
NY Stock Exchange Volume millions 987 867 926 947 1181 986 1099 1266 983 1271 1160 1117 1122 1085
Dow Jones Industrial Avg index 10583 10663 11015 10968 10441 10666 10652 10683 10775 10081 10235 11005 10767 10445 10315 9043 9221
S & P 500 Index 1941-3=10 1462 1473 1485.5 1468.1 1390.1 1375 1330.9 1335.6 1305.8 1185.9 1189.8 1270.4 1238.7 1204.5 1178.5 1044.6 1076.6
NYSE Member -Firm Profits $bil 5.4 3.9 3.5 4.1 2.8 1.9
Government and Foreign Sector
Exports of Goods and Svcs 90.3 89.5 91.8 91.2 90.4 90.5 89.2 90.1 90.4 88.6 87.1 87.6 85.9 83.6 84.5 77.3
Imports of Goods and Svcs $bil 121.3 121.6 122.6 125.7 124.4 123.5 122.5 123.5 119.1 121.6 118.6 115.8 115 112.8 111.6 96
Trade Balance-Gds & Svcs $bil -31 -32 -30.8 -34.5 -34 -33 -33.3 -33.4 -28.7 -33 -31.5 -28.2 -29.1 -29.2 -27.1 -18.7
Merchandise Trade Balance $bil -36.6 -37.2 -35.7 -38.3 -38.8 -37.5 -38.0 -37.7 -33.3 -37.4 -36.3 -32.8 -34.1 -34.6 -32.8
with China $bil -7.20 -7.60 -8.60 -8.70 -9.10 -7.60 -6.00 -7.20 -5.1 -5.7 -6.3 -6.1 -6.6 -7.5 -8.1
with Japan $bil -6.40 -7.50 -6.90 -6.00 -8.50 -6.70 -6.20 -5.90 -6.1 -6.2 -6.4 -4.8 -5 -5.9 -5.4
with Canada $bil -4.30 -4.70 -4.50 -4.50 -4.80 -4.80 -5.60 -5.90 -4.4 -4.3 -4.5 -5 -4.3 -4.8 -4.4
with Mexico $bil -2.50 -1.90 -1.90 -2.60 -2.50 -2.00 -2.00 -2.10 -1.5 -2.8 -2.2 -2.7 -3.1
with Western Europe $bil -4.20 -5.70 -5.10 -3.60 -5.30 -5.10 -3.50 -4.90 -3.4 -4.9 -5.1 -4.3 -3.6
with NIC's $bil -2.00 -2.20 -2.60 -2.80 -2.80 -3.00 -1.90 -2.60 -0.8 -1.4 -1.8 -1.8 -1.8 -1.9 -2
Yen/$ FC/$ 106.10 108.20 108.10 106.80
Deutschemark/$ FC/$ 2.06 2.08 2.16 2.25 2.29 2.29 2.18 2.09 2.12 2.15 2.19 2.23 2.29 2.27 2.17 2.15 2.16

Housing 6/00 7/00 8/00 9/00 10/00 11/00 12/00 1/01 2/01 3/01 4/01 5/01 6/01 7/01New 1-family Homes Sold 000s 793 881 839 902 922 882 1001 938 959 953 899 882 889 877
m/m % chg -7 11.1 -4.8 7.5 2.2 -4.3 13.5 -6.3 2.2 -0.6 -5.7 -1.9 0.8 -1.3
Existing 1-family Homes Sold 000s 5,180 4,820 5,240 5,160 5,070 5,300 4,940 5200 5190 5430 5220 5360 5330 5200
m/m % chg -0.2 -6.9 8.7 -1.5 -1.7 4.5 -6.8 5.3 -0.2 4.6 -3.9 2.7 -0.6 -2.4
New & Existing Homes Sold 000s 5973.0 5,701 6,079 6062.0 5,992 6,182 5,941 6,138 6,149 6,383 6,119 6,242 6,219 6,077
m/m % chg -6.3 -9 -2 1.3 3 3 -2 4 -1 4 5 3 4 7
Housing Starts (Private) 000s 1,560 1,477 1,531 1,508 1,527 1,559 1,532 1,666 1,623 1,592 1,626.0 1,610.0 1,634.0 1,660.0 m/m % chg -0.8 -5.3 3.7 -1.5 1.3 2.1 -1.7 9 -3 -2 2 -1 2 2
Housing Permits (Private) 000s 1,566 1,534 1,544 1,549 1,562 1614.0 1,553 1,724.0 1,663.0 1,627.0 1,587.0 1,621.0 1,587.0 1,571.0 m/m % chg 1.7 -2 0.7 0.3 0.8 3.3 -3.8 11 -4 -2 -3 2 -2 -1
Effective Mortgage Rate-Existing % 8.3 8.2 8.1 8 7.9 7.8 7.7 7 7 7 7 7 7 7 m/m % chg 1 -0.8 -1.2 -1.2 -1.1 -1 -1.9 -4.4 -2.2 -1 -0.3 1.1 0.1 0.1
C & I Loans Outstanding $Bil 920.3 931.2 942.6 936.9 940.8 943 936.4 913.4 898.6 873.2 862.4 851.8 813.1 790.6 m/m % chg 2.4 1.2 1.2 -0.6 0.4 0.2 -0.7 -2.5 -1.6 -2.8 -1.2 -1.2 -4.5 -2.8
Median New 1-family Home Price $000s 160.1 169 166.6 171.5 176.3 174.7 162 171.3 169.1 166.3 175.2 175.3 179.4 174.2 m/m % chg -2.8 5.6 -1.4 2.9 2.8 -0.9 -7.3 5.7 -1.3 -1.7 5.4 0.1 2.3 -2.9
Avg. 1-family New Home Price $000s 197.7 202.2 200.2 208.3 215.1 210.7 208.1 209 211 210.2 205.5 211.4 211.7 208.1 m/m % chg -1.2 2.3 -1 4 3.3 -2 -1.2 0.4 1 -0.4 -2.2 2.9 0.1 -1.7
Mortgage Loan Outstanding
1-4 Family $Bil 4832.9 4962 5087.5 5193 5284.9
m/m % chg 0.8 2.7 2.5 2.1 1.8
5+ Family $Bil 387.2 390.8 399.2 409.2 418.8 m/m % chg 3.4 0.9 2.2 2.5 2.3
All $Bil 6426.5 6592.3 6744.7 6890 7016.5 m/m % chg 0.6 2.6 2.3 2.2 1.8

New York City Economic Data
5/00 6/00 7/00 8/00 9/00 10/00 11/00 12/00 1/01 2/01 3/01 4/01 5/01 6/01 7/01 8/01 9/01 10/01
Real Gross City Product-SA* $96bil 433.5 435.8 440.8 %chg q/q % -2.8 0.5 1.1 Nominal Gross City Prod-SA $92bil 460.4 466.1 473 %chg q/q % 10.9 6.7 9.8 Total Employment, NonAg-NSA 000 3,728 3,740 3,735 3,701 3,723 3,761 3,791 3,814 3,710 3,727 3,760 3,775 3,776 3,778 3,762 3,734 3,733 3,701 chg from previous year 000 129.9 122.7 97.7 72.9 122.7 96.8 90.2 83.0 83.0 79.8 81.0 73.6 48.1 38.1 27.7 33.2 9.9 -60.3 NYS Employment, NonAg-NSA 000 8,673 8,716 8,650 8,593 8,673 8,748 8,788 8,812 8,538 8,591 8,648 8,707 8,768 8,805 8,711 8,679 8,701 8,710 chg from previous year 000 200.1 195.4 185.3 132.9 221.3 176.9 160.5 142.3 147.8 149.2 132.5 119.4 95.0 88.6 61.4 85.8 28.6 -37.9 Initial Unempl Claims-NSA 000/wk 7 5.8 7.3 6.9 5.5 5.8 6.3 6.3 10.1 7.1 7.5 9.4 8.3 8 10.1 9 11 Unemployment Rate-NSA % 5.5 5.4 5.9 5.6 5.4 5.5 5.4 5.2 5.6 5.7 5.4 5.2 4.9 5 5.3 5.8 6.2 6.3
Unemployment Rate-SA % 5.9 5.6 5.6 5.7 5.5 5.5 5.6 5.6 5.1 5.3 5.1 5.4 5.2 5.3 5.0 5.8 6.3 6.2
Wage Rate-NSA $/yr 52,326 52,285 61,473 76,875 %chg y/y % 8 3 8 9.1
FIRE Wage Rate-NSA $/yr 110,503 103,432 144,380 266,456 %chg y/y % 18 2 23 16.2
Pvt Non-FIRE Wage-NSA $/yr 43,412 43,767 49,521 47,249 %chg y/y % 6.8 4.6 2.8 4.4 Consumer Price Index-NS 82-84=100 181.4 182.0 182.8 183.1 184.4 184.6 184.6 184.2 184.9 185.3 186.4 186.6 187.3 188.3 187.8 188.1 188.0 187.8 %chg y/y % 3.0 2.9 3.2 3.1 3.5 3.2 3.2 3.1 3.1 2.7 2.7 2.9 3.3 3.5 2.7 2.7 2.0 1.7
Primary Office Vacancy Rate Midtown % 2.8 2.5 2.9 4 6 7 Downtown % 2.5 2.0 1.7 2.7 4.4 3.7 Total % 2.7 2.3 2.6 3.6 5.6 6.3
Primary Office Asking Rental Rate(1) Midtown $/sf 61.55 65.77 66.83 65.19 60.52 59.32 Downtown $/sf 47.1 48.4 51.0 51.4 47.5 47.3 Total $/sf 58.2 62.0 64.3 62.6 58.0 57.9

Employment by Industry-Not Seasonally Adjusted 5/00 6/00 7/00 8/00 9/00 10/00 11/00 12/00 1/01 2/01 3/01 4/01 5/01 6/01 7/01 8/01 9/01 10/01
Total 000 3728.1 3739.7 3734.5 3700.8 3722.9 3761.3 3791.4 3813.8 3710.4 3727.0 3759.9 3774.7 3776.2 3777.8 3762.2 3734.0 3732.8 3701.0 chg from previous yr 000 129.9 122.7 97.7 72.9 122.7 96.8 90.2 83.0 83.0 79.8 81.0 73.6 48.1 38.1 27.7 33.2 9.9 (60.3) Private 000 3141.9 3169.5 3147.0 3134.7 3175.9 3200.2 3225.3 3244.6 3148.0 3165.7 3193.8 3206.1 3209.0 3214.0 3185.2 3171.1 3185.0 3140.8 chg from previous yr 000 106.9 114.4 114.8 96.4 124.4 98.7 89.6 83.2 84.4 78.1 80.3 79.0 67.1 44.5 38.2 36.4 9.1 (59.4) FIRE 000 485.8 493.3 494.1 496.5 492.5 491.1 492.4 493.5 490.0 491.2 490.6 489.3 487.6 492.2 490.9 490.4 488.9 464.1 chg from previous yr 000 2.4 5.3 6.2 7.5 8.7 6.2 6.0 4.8 4.8 3.9 3.3 3.9 1.8 (1.1) (3.2) (6.1) (3.6) (27.0) Securities 000 178.8 184.4 187.6 190.1 187.0 186.4 187.5 187.3 186.3 187.0 185.9 184.4 183.2 184.9 183.8 183.6 181.2 165.4 chg from previous yr 000 11.3 13.2 12.6 13.3 12.7 11.7 10.3 9.1 9.0 8.4 7.1 5.7 4.4 0.5 (3.8) (6.5) (5.8) (21.0) Banking 000 102.3 102.5 101.0 100.5 98.8 98.3 98.4 98.7 98.8 98.4 98.3 98.2 97.4 98.6 99.1 98.7 98.3 91.5 chg from previous yr 000 (6.8) (6.0) (6.6) (6.4) (6.3) (6.1) (5.5) (5.2) (5.4) (5.6) (5.6) (4.7) (4.9) (3.9) (1.9) (1.8) (0.5) (6.8) Service 000 1454.0 1459.6 1453.5 1451.5 1461.6 1483.3 1496.7 1505.5 1467.8 1485.2 1502.2 1511.8 1507.7 1502.3 1490.3 1477.3 1477.7 1483.8 chg from previous yr 000 80.0 83.3 81.1 82.3 85.6 71.8 69.1 65.2 67.6 64.9 65.9 63.2 53.7 42.7 36.8 25.8 16.1 0.5 Business Services 000 338.6 343.1 346.3 351.0 352.5 354.0 356.7 361.1 356.1 359.5 363.6 365.9 357.1 353.6 352.5 349.0 344.6 338.1 chg from previous yr 000 40.4 41.9 41.3 41.0 41.3 38.3 39.0 39.0 37.0 34.9 33.4 33.1 18.5 10.5 6.2 (2.0) (7.9) (15.9) Medical Services 000 322.0 322.4 324.0 323.1 322.8 322.7 323.1 324.3 318.7 319.0 320.0 320.1 323.3 324.2 325.3 326.4 326.0 327.0 chg from previous yr 000 1.7 0.8 3.2 2.1 1.5 0.5 (0.3) (0.6) 2.3 1.5 2.6 - 1.3 1.8 1.3 3.3 3.2 4.3 Social Services 000 180.1 180.5 180.3 179.0 178.5 180.8 182.7 183.4 181.7 182.1 183.0 182.9 184.3 185.4 185.1 184.0 183.1 185.0 chg from previous yr 000 7.5 7.5 8.9 8.3 8.8 8.3 7.7 7.2 5.7 6.0 5.2 4.4 4.2 4.9 4.8 5.0 4.6 4.2 Educational Services 000 122.2 116.7 109.3 105.6 114.4 126.0 127.8 125.2 119.0 124.8 127.3 129.2 126.8 120.7 116.4 113.0 122.5 137.1 chg from previous yr 000 2.9 6.0 5.1 5.3 6.1 3.2 0.1 (2.1) - 0.8 0.2 2.5 4.6 4.0 7.1 7.4 8.1 11.1 Retail Trade 000 434.3 439.3 432.1 432.9 439.4 446.5 456.7 469.6 441.2 437.6 441.7 444.6 447.6 449.3 441.1 440.5 446.7 434.9 chg from previous yr 000 19.4 19.5 21.6 21.2 22.6 20.1 16.3 16.5 15.6 15.2 17.2 15.0 13.3 10.0 9.0 7.6 7.3 (11.6) Wholesale Trade 000 191.6 193.3 192.1 192.7 193.3 193.5 195.0 195.4 191.2 190.9 191.6 190.7 189.8 190.4 188.3 188.6 189.9 188.6 chg from previous yr 000 0.6 1.5 2.2 1.6 2.1 0.4 0.2 (0.3) (0.1) (0.9) (1.4) (0.4) (1.8) (2.9) (3.8) (4.1) (3.4) (4.9) Manufacturing 000 242.3 245.5 241.3 244.1 246.5 243.1 241.5 237.6 227.5 229.2 229.6 228.9 231.2 233.5 231.8 232.3 233.9 227.1 chg from previous yr 000 (9.3) (8.6) (8.1) (8.1) (6.9) (9.9) (10.6) (10.6) (10.3) (12.1) (14.1) (13.1) (11.1) (12.0) (9.5) (11.8) (12.6) (16.0) Trans, comm, public utils 000 213.3 215.2 208.9 190.0 214.5 214.5 214.3 215.1 212.4 212.5 215.1 215.4 216.2 216.1 211.3 209.7 214.4 209.0 chg from previous yr 000 5.8 5.9 4.6 (14.8) 5.6 3.3 1.4 1.2 - 0.4 2.8 3.2 2.9 0.9 2.4 19.7 (0.1) (5.5) Construction 000 120.4 123.1 124.8 126.8 127.9 128.0 128.5 127.7 117.7 118.9 122.8 125.2 128.7 130.0 131.3 132.1 133.3 133.1 chg from previous yr 000 8.1 7.6 7.3 6.8 6.8 6.9 7.3 6.5 6.8 6.7 6.6 7.2 8.3 6.9 6.5 5.3 5.4 5.1 Government (F,S,L) 000 586.2 570.2 587.5 566.1 547.0 561.1 566.1 569.2 562.4 561.3 566.1 568.6 567.2 563.8 577.0 562.9 547.8 560.2 chg from previous yr 000 23.0 8.3 (17.1) (23.5) (1.7) (1.9) 0.6 (0.2) (1.4) 1.7 0.7 (5.4) (19.0) (6.4) (10.5) (3.2) 0.8 (0.9) Local Government 000 448.8 446.8 467.3 451.3 434.0 448.4 453.0 454.8 449.7 448.4 453.2 455.5 453.8 450.3 464.2 450.4 435.7 447.9 chg from previous yr 000 (0.6) (1.1) (22.6) (24.1) (0.2) (0.9) 1.9 1.3 0.1 3.8 4.1 1.2 5.0 3.5 (3.1) (0.9) 1.7 (0.5)

Employment by Industry- Seasonally Adjusted 5/00 6/00 7/00 8/00 9/00 10/00 11/00 12/00 1/01 2/01 3/01 4/01 5/01 6/01 7/01 8/01 9/01 10/01
Total 000 3731.1 3732.3 3727.5 3708.4 3747.3 3740.6 3743.7 3748.1 3761.7 3767.2 3773.3 3782.0 3779.3 3770.3 3755.8 3742.3 3757.6 3680.6
chg from previous mth 000 22.5 1.2 (4.8) (19.2) 38.9 (6.7) 3.2 4.3 13.6 5.6 6 8.7 (2.7) -9 -14.5 -13.5 15.3 -77 Private 000 3143.9 3159.4 3164.2 3155.6 3179.6 3174.3 3178.2 3183.0 3193.7 3198.8 3205.6 3213.7 3211.2 3204.3 3202.6 3192.7 3189.1 3115.2 chg from previous mth 000 9.1 15.6 4.8 (8.6) 23.9 (5.3) 3.9 4.8 10.7 5.1 6.8 8.1 (2.5) -7 -1.7 -9.8 -3.6 -73.9 FIRE 000 489.3 491.5 489.8 491.5 491.3 491.2 491.5 491.2 493.2 493.5 493.0 493.4 491.1 490.4 486.6 485.5 487.7 464.2 chg from previous mth 000 (0.2) 2.2 (1.6) 1.7 (0.2) (0.1) 0.3 (0.3) 2.0 0.3 -0.4 0.3 (2.3) -0.7 -3.8 -1.1 2.2 -23.6 Securities 000 181.1 183.6 184.8 186.9 186.5 186.2 186.7 186.9 187.6 188.3 187.3 186.7 185.6 184.1 181 180.5 180.7 165.2 chg from previous mth 000 0.2 2.5 1.2 2.1 (0.4) (0.3) 0.6 0.2 0.6 0.7 -1 -0.6 (1.1) -1.5 -3 -0.5 0.2 -15.5 Banking 000 102.6 102.3 100.4 99.9 98.9 98.6 98.6 98.4 98.9 98.4 98.6 98.6 97.6 98.4 98.6 98.1 98.4 91.8 chg from previous mth 000 (0.8) (0.3) (1.8) (0.5) (1.0) (0.3) (0.1) (0.2) 0.5 (0.5) 0.2 0 (1.0) 0.8 0.2 -0.4 0.3 -6.6 Service 000 1450.1 1458.8 1469.3 1475.5 1477.7 1472.9 1476.7 1478.9 1483.7 1490.9 1495.3 1502.3 1503.9 1501.6 1506.4 1501.6 1494.1 1473.4 chg from previous mth 000 10.6 8.6 10.5 6.2 2.2 (4.8) 3.8 2.2 4.8 7.2 4.3 7.1 1.5 -2.2 4.7 -4.8 -7.5 -20.7 Business Services 000 339.9 343.2 346.2 348.5 350.2 350.9 352.8 355.2 363.7 365.7 366.7 366.2 358.6 353.7 352.3 346.5 342.3 335.1 chg from previous mth 000 6.9 3.3 3.0 2.4 1.7 0.6 1.9 2.4 8.5 2.0 1.1 -0.6 (7.6) -4.9 -1.4 -5.8 -4.1 -7.2 Medical Services 000 322.1 321.9 323.6 323.9 323.5 322.3 322.6 322.3 319.3 320.0 319.8 321 323.3 323.7 324.9 327.2 326.7 326.6 chg from previous mth 000 1.1 (0.1) 1.7 0.2 (0.4) (1.2) 0.3 (0.3) (3.0) 0.7 -0.2 1.2 2.4 0.4 1.2 2.2 -0.4 -0.2 Social Services 000 178.8 179.3 180.1 180.4 181.1 181.0 182.0 181.9 182.6 182.8 183.2 181.8 183.0 184.1 184.9 185.5 185.8 185.2 chg from previous mth 000 1.3 0.5 0.8 0.4 0.7 (0.2) 1.0 (0.1) 0.7 0.3 0.4 -1.4 1.1 1.2 0.7 0.6 0.4 -0.7 Educational Services 000 119.0 121.6 123.1 122.8 121.9 121.3 121.7 119.7 117.7 118.6 119.8 121.1 123.5 125.8 131 131.3 130.6 132 chg from previous mth 000 0.2 2.6 1.5 (0.3) (0.9) (0.5) 0.3 (2.0) (1.9) 0.9 1.1 1.3 2.4 2.3 5.2 0.3 -0.8 1.4 Retail Trade 000 436.8 438.2 437.1 439.1 439.8 442.0 442.9 444.8 445.4 448.1 450.3 451.8 450.2 448.2 446.2 446.7 447.1 430.5 chg from previous mth 000 0.2 1.4 (1.1) 2.0 0.7 2.2 0.9 1.9 0.6 2.7 2.2 1.6 (1.6) -2 -2.1 0.6 0.4 -16.6 Wholesale Trade 000 191.7 192.4 192.5 192.6 192.7 192.7 193.3 193.2 193.8 192.6 192 191.6 189.8 189.6 188.7 188.5 189.3 187.8 chg from previous mth 000 (0.4) 0.8 0.1 0.1 0.1 - 0.6 - 0.6 (1.2) -0.6 -0.4 (1.8) -0.3 -0.8 -0.2 0.8 -1.5 Manufacturing 000 242.3 243.1 242.1 241.1 240.8 239.1 238.2 237.8 237.5 233.0 231.2 230.6 231.2 231.2 232.6 229.4 228.5 223.4 chg from previous mth 000 (1.5) 0.8 (1.0) (1.0) (0.3) (1.8) (0.9) (0.4) (0.3) (4.5) -1.8 -0.7 0.7 0 1.3 -3.1 -0.9 -5.2 Trans, comm, public utils 000 212.5 213.8 211.9 193.5 213.9 213.1 211.7 212.0 214.1 213.3 215 216 215.4 214.7 214.4 213.6 213.8 207.7 chg from previous mth 000 (0.3) 1.3 (1.9) (18.4) 20.4 (0.8) (1.4) 0.2 2.1 (0.7) 1.7 1 (0.6) -0.7 -0.3 -0.8 0.2 -6.1 Construction 000 121.2 121.7 121.5 122.3 123.3 123.3 123.9 125.2 126.0 127.4 128.7 128 129.6 128.5 127.8 127.4 128.6 128.3 chg from previous mth 000 0.6 0.4 (0.2) 0.8 1.0 - 0.6 1.3 0.8 1.4 1.3 -0.7 1.6 -1.1 -0.7 -0.4 1.2 -0.3 Government (F,S,L) 000 587.2 572.8 563.3 552.7 567.7 566.3 565.5 565.1 568.0 568.4 567.7 568.3 568.1 566.1 553.3 549.6 568.5 565.4 chg from previous mth 000 13.5 (14.4) (9.6) (10.6) 15.0 (1.4) (0.7) (0.5) 2.9 0.5 -0.8 0.6 (0.1) -2.1 -12.8 -3.7 18.9 -3.1 Local Government 000 449.7 450.5 444.9 442.5 453.5 451.8 453.3 452.8 453.5 452.2 452 455 454.4 453.6 442.1 442.7 454.9 450.8 chg from previous mth 000 -4.4 0.8 -5.6 -2.4 11.1 -1.8 1.5 -0.5 0.7 -1.3 -0.2 3 -0.6 -0.8 -11.5 0.7 12.2 -4.1

NYS Employment Figures 3/00 4/00 5/00 6/00 7/00 8/00 9/00 10/00 11/00 12/00 1/01 2/01 3/01 4/01 5/01 6/01 7/01
Non-Ag Data Total Downstate* Level 5,413 5,456 5,502 5,529 5,505 5,455 5,492 5,556 5,594 5,624 5,450 5,471 5,528 5,558 5,580 5,600 5,558
Chg y/y 132 141 166 156 138 102 164 141 129 116 118 111 115 102 78 71 54
Upstate** Level 3,103 3,132 3,171 3,187 3,145 3,138 3,181 3,192 3,194 3,188 3,088 3,120 3,121 3,149 3,188 3,205 3,153
Chg y/y 54 39 34 39 48 31 57 36 31 27 30 39 18 18 17 18 8
NYC Level 3,679 3,701 3,728 3,740 3,735 3,701 3,723 3,761 3,791 3,814 3,710 3,727 3,760 3,775 3,776 3,778 3,762
Chg y/y 95 109 130 123 98 73 123 97 90 83 83 80 81 74 48 38 28
NYS Level 8,516 8,587 8,673 8,716 8,650 8,593 8,673 8,748 8,788 8,812 8,538 8,591 8,648 8,707 8,768 8,805 8,711
Chg y/y 186 180 200 195 185 133 221 177 161 142 148 149 133 119 95 89 61
Private Downstate Level 4,565 4,595 4,626 4,672 4,653 4,631 4,674 4,711 4,741 4,769 4,609 4,625 4,675 4,699 4,721 4,744 4,710
Chg y/y 121 120 131 137 153 124 161 136 123 109 115 104 110 104 95 71 57
Upstate Level 2,471 2,500 2,533 2,564 2,562 2,565 2,574 2,568 2,565 2,565 2,483 2,493 2,495 2,525 2,558 2,580 2,570
Chg y/y 44 24 17 27 30 23 45 31 27 23 32 37 24 25 25 16 8
NYC Level 3,114 3,127 3,142 3,170 3,147 3,135 3,176 3,200 3,225 3,245 3,148 3,166 3,194 3,206 3,209 3,214 3,185
Chg y/y 92 99 107 114 115 96 124 99 90 83 84 78 80 79 67 45 38
NYS Level 7,037 7,095 7,159 7,236 7,215 7,196 7,248 7,279 7,306 7,334 7,092 7,118 7,170 7,224 7,279 7,323 7,280
Chg y/y 165 144 148 164 183 147 205 167 149 132 147 141 134 128 120 87 65
Labor Force Data
Labor Downstate Level 5,579 5,563 5,575 5,639 5,721 5,662 5,574 5,616 5,615 5,615 5,557 5,571 5,587 5,573 5,565 5,612 5,675
Force Chg y/y 106 122 143 121 102 96 117 92 82 60 32 26 8 9 -10 -27 -46
Upstate Level 3,299 3,289 3,306 3,367 3,400 3,383 3,332 3,344 3,360 3,365 3,363 3,351 3,319 3,315 3,334 3,388 3,421
Chg y/y -76 -77 -82 -67 -51 -35 -8 1 25 48 52 42 20 26 29 21 21
NYC Level 3,576 3,559 3,553 3,572 3,630 3,585 3,539 3,562 3,551 3,540 3,510 3,534 3,536 3,514 3,489 3,492 3,543
Chg y/y 145.0 161.0 172 154 127 115 115 81 61 30 -10 -12 -40 -45 -64 -80 -87
NYS Level 8,878 8,852 8,881 9,006 9,120 9,045 8,906 8,960 8,975 8,980 8,919 8,922 8,906 8,888 8,899 9,000 9,096
Chg y/y 30 46 60 54 51 61 109 93 108 108 84 68 28 36 18 -6 -24
Unempd. Downstate Level 281 253 250 254 282 269 255 257 249 237 261 264 246 233 225 238 264
Chg y/y -27 -28 -33 -44 -48 -39 -41 -38 -26 -19 -33 -24 -35 -20 -25 -16 -17
Upstate Level 160 137 133 133 131 125 135 130 140 139 173 168 145 128 132 136 147
Chg y/y -28 -21 -23 -22 -20 -13 -12 -9 -4 -7 -8 -10 -15 -8 -1 3 16
NYC Level 223 203 196 192 214 202 190 198 193 185 195 201 191 182 170 173 189
Chg y/y -16 -16 -20 -32 -35 -29 -33 -31 -20 -14 -31 -20 -31 -22 -26 -18 -25
NYS Level 441 390 384 387 413 394 390 387 389 377 434 433 391 362 357 374 411
Chg y/y -55 -49 -56 -66 -68 -53 -53 -46 -30 -26 -42 -34 -50 -28 -26 -13 -1
Unempl. Downstate % 5.0 4.6 4.5 4.5 4.9 4.8 4.6 4.58 4.44 4.23 4.69 4.74 4.39 4.19 4.05 4.2 4.7
Rate Upstate % 4.9 4.2 4.0 4.0 3.9 3.7 4.1 3.87 4.16 4.14 5.14 5.03 4.37 3.87 3.96 4.0 4.3
NYC % 6.2 5.7 5.5 5.4 5.9 5.6 5.4 5.5 5.4 5.2 5.6 5.7 5.4 5.2 4.9 5 5.3
NYS % 5.0 4.4 4.3 4.3 4.5 4.4 4.4 4.3 4.3 4.2 4.9 4.8 4.4 4.1 4 4.2 4.5
* Downstate = NYC PMSA + Nassau & Suffolk PMSA** Upstate = NYS - DownstateAll employment figures are NOT seasonally adjusted

Annual Historical Data--U.S.General Economic Indicators 1986 1987 1988 1989 1990 1991 1992 1993 1994 1995 1996 1997 1998 1999 2000
Nominal GDP $bil 4,453 4,742 5,108 5,489 5,803 5,986 6,319 6,642 7,054 7,401 7,813 8,318 8,782 9,269 9,873
Real GDP (Chain-Wt) $96bil 5,912 6,113 6,368 6,592 6,708 6,676 6,880 7,063 7,348 7,544 7,813 8,159 8,509 8,857 9,224.0 y/y%chg % 3.4 3.4 4.2 3.5 1.8 (0.5) 3.1 2.7 4.0 2.7 3.6 4.4 4.3 4.1 4.1 Nominal Change in Inventories $96bil 6.6 27.2 18.5 27.7 14.6 (0.2) 15.0 21.1 62.6 33.0 30.0 62.9 73.1 58.6 49.4 Real Change in Inventories $96bil 9.6 29.6 18.4 29.6 16.5 -1 17.1 20 66.8 30.4 30 63.8 76.7 62.1 50.6 Real Final Sales $96bil 5,903 6,084 6,350 6,562 6,691 6,677 6,863 7,043 7,281 7,513 7,783 8,096 8,432 8,794 9,173 y/y%chg % 3.7 3.1 4.4 3.3 2 -0.2 2.8 2.6 3.4 3.2 3.6 4 4.2 4.3 4.3 Consumption Expenditures $96bil 3,981 4,113 4,279 4,394 4,475 4,467 4,594 4,749 4,928 5,076 5,238 5,424 5,684 5,968 6,258 y/y%chg % 4.2 3.3 4 2.7 1.8 -0.2 2.9 3.4 3.8 3 3.2 3.6 4.8 5 4.8 Nonres Fixed Investments $96bil 573 572 604 637 642 610 631 684 745 818 899 1,009 1,136 1,229 1,351 y/y%chg % -2.7 -0.1 5.4 5.5 0.7 -4.9 3.4 8.4 8.9 9.8 10 12.2 12.5 8.2 9.9 Invesment Proc Machines $96bil 99.0 105.0 116.0 131.0 136.0 143.0 163.0 183.0 207.0 243.0 287.0 350.0 429.0 506.0 609.0 y/y%chg % 8.0 6.1 10.8 12.8 3.9 4.6 14.2 12.5 12.7 17.5 18.3 21.8 22.7 17.9 20.4
Residential Fixed Inv $96bil 290.0 291.0 289.0 277.0 254.0 221.0 257.0 276.0 303.0 292.0 313.0 320.0 345.0 368.0 371.0 y/y%chg % 12 0.2 -0.5 -4.1 -8.6 -12.8 16.3 7.3 9.7 -3.6 7.4 2 8 6.7 0.8
Net Exports $96bil (165) (156) (112) (79) (57) (16) (20) (59) (87) (78) (89) (113) (221) (317) (399) Pre-tax Corp Profits $bil 243.4 314.6 382.0 376.7 401.5 416.1 451.6 510.4 573.4 668.5 726.4 792.4 721.1 776.3 845.4
%chg y/y -4.6 29.2 21.4 -1.4 6.6 3.6 8.5 13.0 12.3 16.6 8.7 9.1 -9 7.7 8.9
Total 000s 99,344 101,953 105,202 107,883 109,404 108,255 108,591 110,692 114,135 117,188 119,589 122,676 125,845 128,901 131,757 chg from previous period 000s 1,958 2,608 3,249 2,681 1,521 -1,149 336 2,101 3,443 3,053 2,402 3,087 3,168 3,056 2,857 y/y%chg % 2.0 2.6 3.2 2.5 1.4 -1.1 0.3 1.9 3.1 2.7 2.0 2.6 2.6 2.4 2.2 Private 000s 82,653 84,945 87,819 90,104 91,098 89,849 89,950 91,865 95,024 97,895 100,187 103,128 106,034 108,705 111,084 chg from previous period 000s 1,660 2,292 2,874 2,286 993 -1,249 102 1,915 3,160 2,871 2,292 2,941 2,905 2,671 2,379 Finance, ins, & real estate 000s 6,272 6,533 6,629 6,669 6,709 6,647 6,602 6,757 6,895 6,808 6,911 7,108 7,387 7,555 7,561 chg from previous period 000s 324 260 96 40 40 (62) (45) 155 138 (87) 104 197 279 168 6 Service 000s 22,957 24,109 25,500 26,904 27,930 28,335 29,047 30,193 31,575 33,115 34,455 36,038 37,526 39,048 40,461 chg from previous period 000s 1,030 1,152 1,392 1,404 1,026 405 711 1,146 1,382 1,540 1,340 1,583 1,488 1,522 1,413 Manufacturing 000s 18,948 18,998 19,315 19,391 19,075 18,405 18,106 18,076 18,323 18,526 18,494 18,672 18,805 18,555 18,470 chg from previous period 000s -302 50 317 76 -316 -670 -299 -30 247 202 (32) 179 133 (250) (85) Leading Econ Indicators 2.2 2.5 0.5 -0.9 -0.5 -0.2 1.5 0.8 1.5 -0.7 1.9 2.9 2.4 3.3 1.0 ratio 0.9 1.0 1.0 0.9 0.9 1.0 1.0 1.0 1.0 1.0 1.0 1.0 1.0 1.1 1.0
Initial Claims for Unempl 000/wk 377.6 325.0 312.2 330.4 386.3 448.7 407.0 343.2 342.6 358.6 351.6 320.1 315.6 296.2 301.8 % of total employment % 380.00% 320.00% 300.00% 310.00% 350.00% 410.00% 370.00% 310.00% 300.00% 310.00% 290.00% 260.00% 250.00% 230.00% 230.0% Unemployment Rate, Civ % 7.0 6.2 5.5 5.3 5.6 6.9 7.5 6.9 6.1 5.6 5.4 5.0 4.5 4.2 4.0
Weekly Hours hrs/wk 34.8 34.8 34.6 34.5 34.4 34.3 34.4 34.5 34.6 34.4 34.5 34.6 34.6 34.5 34.4
** Beginning in late 1992, the unemployment survey methodology was revised, and therefore the data prior to 1992 is inconsistent with the more recent data.
Employment, Payroll

Consumer 1986 1987 1988 1989 1990 1991 1992 1993 1994 1995 1996 1997 1998 1999 2000
Personal Income $bil 3,647 3,877 4,173 4,489 4,796 4,966 5,256 5,481 5,780 6,201 6,547 6,937 7,426 7,777 8,319
%chg y/y % 6.0 6.3 7.6 7.6 6.8 3.5 5.8 4.3 5.4 7.3 5.6 6.0 7.0 4.7 7.0
Consumption Expenditures $bil 2,893 3,095 3,350 3,595 3,839 3,975 4,220 4,459 4,717 4,969 5,237 5,529 5,856 6,250 6,728
%chg y/y % 6.9 7.0 8.2 7.3 6.8 3.5 6.2 5.7 5.8 5.3 5.4 5.6 5.9 6.7 7.7
Wage Rate $/yr 21,283 22,267 23,314 24,071 25,178 26,089 27,466 27,872 28,358 29,224 30,325 31,701 33,317 34,695 36,713 %chg y/y % 3.9 4.6 4.7 3.2 4.6 3.6 5.3 1.5 1.7 3.1 3.8 4.5 5.1 4.1 5.8
Personal Savings Rate % 6.2 5.0 5.2 4.8 5.1 5.6 5.7 4.4 3.9 5.6 4.8 4.2 4.7 2.4 1.0
Cons Inst Credit $bil 625 658 702 759 787 783 777 806 900 1,034 1,150 1,214 1,268 1,353 1,468
chg from year ago $bil 66.6 33.2 44.3 56.4 28.7 -4.0 -6.4 28.8 94.8 133.6 116.1 63.4 54.1 84.9 115.4
as % of disposable pers inc % 19.6 19.6 19.3 19.5 18.9 18.0 16.9 16.8 17.9 19.1 20.3 20.3 20.1 20.4 21.0
Retail Sales Total $bil 121 128 137 147 154 155 154 165 179 188 200 209 220 238 257
%chg y/y % 5.5 6.2 7.1 6.7 5.0 0.6 (0.6) 7.1 8.6 5.4 6.0 4.8 4.9 8.6 7.7
Durable goods $bil 45 48 52 55 56 54 58 65 74 79 85 89 95 104 111
%chg y/y % 8.6 6.3 9.2 4.9 1.9 (3.0) 7.9 11.4 13.4 7.1 7.1 4.8 6.7 10.4 6.6
Durable goods less auto $bil 18 19 21 23 23 23 25 27 30 32 34 36 39 42 44
%chg y/y % 10.0 8.6 9.9 6.2 4.0 (1.6) 6.4 8.9 11.9 7.0 6.3 5.3 8.2 8.3 5.6
Non-durable goods $bil 76 80 85 92 98 101 104 108 113 118 123 129 134 145 158 %chg y/y % 3.7 6.1 5.9 7.8 6.9 2.6 3.1 4.4 4.7 3.8 4.8 4.6 3.9 8.0 9.1
Auto Sales mil 11.4 10.2 10.5 9.8 9.3 8.2 8.2 8.5 9.0 8.7 8.5 8.3 8.1 8.7 8.9
Auto & Light Truck Sales mil 16.1 14.9 15.4 14.5 13.9 12.3 12.8 13.9 15.0 14.8 15.0 15.1 15.4 16.8 17.2
Cons Conf, Conference Bd 1985=100 95 103 115 117 92 69 62 66 91 100 105 125 132 135 139Cons Exp, Conference Bd 1985=100 94.4 100.3 106.5 104.8 83.6 85.8 82 77.4 92.3 91.5 93.7 108 106.6 107.8 110.9
Industry Purchasing Managers Index % 51.1 57.5 56.2 48.9 46.5 47.1 52.6 52.5 57.8 49.5 50.1 55.0 50.2 54.6 51.6
Industrial Production %chg 1.2 4.6 4.5 1.8 (0.2) (2.0) 3.1 3.5 5.4 4.8 4.6 6.7 4.8 4.1 5.6

1986 1987 1988 1989 1990 1991 1992 1993 1994 1995 1996 1997 1998 1999 2000Capacity Utilization 78.7 81.3 84.0 84.1 82.3 79.3 80.2 81.3 83.1 83.3 82.6 83.5 82.1 81.2 82.1Mfrs New Orders-Total $bil 195.1 209.2 228.1 239.4 244.3 238.9 240.8 249.6 270.8 291.4 302.8 321.7 323.7 338.6 362.2 %chg y/y -0.2 7.3 9.0 4.9 2.0 -2.2 0.8 3.6 8.5 7.6 3.9 6.3 0.6 4.6 6.9 New Orders Durable Goods $bil 103.5 110.7 122.0 125.9 125.4 120.0 125.0 131.6 147.9 159.9 168.0 181.1 184.6 195.7 208.5 %chg y/y 1.3 6.9 10.2 3.2 -0.4 -4.3 4.2 5.3 12.4 8.1 5.1 7.8 1.9 6.0 6.6
New Orders Non-Defense $bil 20.3 21.6 24.3 24.7 25.1 23.6 35.6 38.8 43.6 48.1 50.5 56.3 58.1 60.4 67.2 Capital Gds Excl Aircraft %chg y/y -5.0 6.1 12.6 1.9 1.6 -6.0 50.6 9.2 12.2 10.3 5 11.5 3.2 3.9 11.3
New Orders Computing $bil 4.6 5.0 5.7 5.4 5.4 4.9 5.4 5.7 6.8 7.6 8.6 9.1 10.8 11.7 14.3 %chg y/y -6.7 8.6 12.6 -4.7 -0.2 -8.8 10.5 5.1 19.4 11.2 14.0 5.1 19.6 8.1 21.9 Mfg & Trade Inventories $bil 666 686 740 801 831 832 825 854 897 972 1,001 1,029 1,071 1,108 1,179 Mfg & Trade Sales $bil 430 457 496 527 546 543 539 567 610 655 685 723 743 787 843 Inv/Sales Ratio mths sup 1.5 1.5 1.5 1.5 1.5 1.5 1.5 1.5 1.5 1.5 1.5 1.4 1.4 1.4 1.4Prices
Consumer Price Index-Total 82-84=100 109.7 113.7 118.4 124.0 130.8 136.3 140.4 144.6 148.3 152.5 157.0 160.6 163.1 166.7 172.3 %chg y/y 1.9 3.7 4.1 4.8 5.4 4.2 3.0 3.0 2.6 2.8 2.9 2.3 1.6 2.2 3.4
Consumer Price Index-Core 82-84=100 113.7 118.4 123.6 129.1 135.7 142.3 147.5 152.4 156.7 161.4 165.8 169.7 173.6 177.2 181.5 %chg y/y 4.0 4.1 4.4 4.5 5.0 4.9 3.7 3.3 2.8 3.0 2.7 2.4 2.3 2.1 2.4
Consumer Price Index-Med 82-84=100 122.2 130.3 138.8 149.4 163 177.2 190.3 201.6 211.2 220.7 228.5 234.8 242.4 250.8 261 %chg y/y 7.5 6.6 6.5 7.6 9.1 8.7 7.4 6.0 4.8 4.5 3.5 2.8 3.2 3.5 4.1Prod Price Index-Fin goods 82=100 103.3 105.4 108 113.5 119.1 121.7 123.2 124.7 125.5 127.9 131.3 131.8 130.7 133 138 %chg y/y -1.3 2.1 2.5 5.1 4.9 2.2 1.2 1.2 0.6 1.9 2.6 0.4 -0.9 1.8 3.7
Crude Oil Price $/barrel 15.0 19.2 16.0 19.6 24.5 21.5 20.6 18.5 17.2 18.4 22.2 20.6 14.4 19.2 30.3Auto Price $000s 12.7 13.4 13.9 14.4 15.0 15.5 16.3 16.9 17.9 18.0 18.8 19.6 20.4 20.7 20.9
Employment Cost Index 0.9 0.9 1.0 1.0 1.1 1.1 1.1 1.2 1.2 1.3 1.3 1.3 1.4 1.4 1.5 %chg y/y 3.5 3.3 4.6 4.9 5.2 4.4 3.6 3.5 3.4 2.8 2.8 3.0 3.4 3.2 4.3
Non-farm bus productivity 0.9 0.9 0.9 0.9 1.0 1.0 1.0 1.0 1.0 1.0 1.1 1.1 1.1 1.1 1.2
%chg y/y 3.1 0.4 1.3 0.8 1.1 1.2 3.7 0.5 1.3 1 2.5 2 2.6 2.3 3
Unit Labor Cost 0.8 0.9 0.9 0.9 1.0 1.0 1.0 1.0 1.0 1.0 1.0 1.1 1.1 1.1 1.1
%chg y/y 2.1 3.4 3.2 1.9 4.3 3.7 1.5 1.7 0.8 1.2 0.5 0.9 2.7 2.0 3.1

1986 1987 1988 1989 1990 1991 1992 1993 1994 1995 1996 1997 1998 1999 2000Financial Money Supply M2 $bil 2,620 2,789 2,940 3,064 3,229 3,348 3,413 3,451 3,500 3,575 3,746 3,930 4,218 4,526 4,795 % chg 8.1 6.5 5.4 4.2 5.4 3.7 1.9 1.1 1.4 2.1 4.8 4.9 7.3 7.3 5.9 Discount Rate % 6.3 5.7 6.2 6.9 7.0 5.4 3.3 3.0 3.6 5.2 5.0 5.0 4.9 4.6 5.7 Fed Funds Rate % 6.8 6.7 7.6 9.2 8.1 5.7 3.5 3.0 4.2 5.8 5.3 5.5 5.4 5.0 6.2 Prime Rate % 8.3 8.2 9.3 10.9 10.0 8.5 6.3 6.0 7.1 8.8 8.3 8.4 8.4 8.0 9.2 3-mo T-Bill Rate % 6.0 5.8 6.7 8.1 7.5 5.4 3.4 3.0 4.2 5.5 5.0 5.1 4.8 4.6 5.8 30-Yr T-Bond Rate % 7.8 8.6 9.0 8.4 8.6 8.1 7.7 6.6 7.4 6.9 6.7 6.6 5.6 5.9 5.9
minus Fed Funds Rt (Yld Curve) basis points 99.3 192.3 139.1 -76.7 50.9 244.8 414.5 357.6 316.8 104.8 140.3 114.6 22.5 89.6 -29.3 10-yr T-bond Rate % 7.7 8.4 8.8 8.5 8.6 7.9 7.0 5.9 7.1 6.6 6.4 6.4 5.3 5.6 6.0 minus Fed Funds Rt (Yld Curve) basis points 87.7 172.7 127.8 -71.8 45.1 217.1 348.8 285.1 287.8 74.3 114.0 89.2 -8.9 66.7 -20.7 AAA Corp Bond Rate % 9.0 9.4 9.7 9.3 9.3 8.8 8.1 7.2 8.0 7.6 7.4 7.3 6.5 7.0 7.6 minus 10 yr t-bond basis points 133.8 99.2 86.4 75.9 77.2 91.1 113.0 134.6 88.3 101.0 93.2 90.9 126.8 140.5 159.3
Municipal % 7.3 7.7 7.7 7.2 7.3 6.9 6.4 5.6 6.2 5.9 5.8 5.5 5.1 5.4 5.7 NY Stock Exchange Volume millions 135.0 180.0 155.0 158.0 150.0 171.0 195.0 254.0 275.0 330.0 396.0 505.0 643.0 772.0 994.0
Dow Jones Industrial Avg index 1,793 2,276 2,061 2,509 2,679 2,929 3,284 3,522 3,793 4,494 5,743 7,441 8,626 10,465 10,735
Nasdaq Index index 367 402 374 437 409 492 599 715 752 925 1,165 1,468 1,793 2,722 3,778 S & P 500 Index 1941-3=10 236 287 266 323 335 376 416 451 460 542 671 873 1,084 1,326 1,427
Price/Earnings Ratio(S&P 500) 16.5 18.7 12.6 13.7 15.5 21.3 23.7 22.5 17.3 16.5 19.1 22.1 29.1 31.7 29.4
NYSE Member -Firm Profits $bil 1.4 0.3 0.6 0.5 0.0 1.5 1.5 2.1 0.3 1.9 2.8 3.1 2.4 4.1 5.2
Government and the Foreign Sector Exports of Goods & Svcs $bil UN UN UN UN UN UN 51.4 53.6 58.6 66.3 70.9 78.1 77.7 79.7 89.0
Imports of Goods & Svcs $bil UN UN UN UN UN UN 54.4 59.3 66.7 74.6 79.9 86.9 91.7 101.8 119.8 Trade Balance-Goods & Svcs $bil UN UN UN UN UN UN -3 -5.7 -8.1 -8.3 -9.0 -8.8 -13.9 -22.1 -30.8 Merchandise Trade Balance $bil -11.5 -12.7 -9.9 -9.1 -8.4 -5.5 -7.0 -9.6 -12.6 -13.2 -14.2 -15.0 -19.1 -27.4 -36.2 with China $bil -0.1 -0.2 -0.3 -0.5 -0.9 -1.1 -1.5 -1.9 -2.5 -2.8 -3.3 -4.1 -4.7 -5.7 -7.0
with Japan $bil -4.6 -4.7 -4.3 -4.1 -3.4 -3.6 -4.1 -4.9 -5.5 -4.9 -4.0 -4.7 -5.3 -6.1 -6.8
with Canada $bil -1.9 -1.1 -0.8 -0.8 -0.6 -0.5 -0.7 -0.9 -1.2 -1.5 -1.8 -1.4 -1.4 -2.7 -4.2 with Mexico $bil -0.4 -0.5 -0.2 -0.2 -0.1 0.2 0.4 0.1 0.1 -1.3 -1.5 -1.2 -1.3 -1.9 -2.0
with Western Europe $bil UN -2 -2 -1 -1 0 -1 -1 -2 -2 -2 -3 -3 -4 -5 with NIC's $bil UN UN -2.4 -2 -1.7 -1.1 -1.1 -1 -1 -0.6 -0.6 -0.7 -1.9 -2 -2.2
Yen/$ FC/$ 168.5 144.6 128.1 138.0 144.8 134.5 126.7 111.2 102.2 94.1 108.8 121.1 130.8 113.0 107.8 Deutschemark/$ FC/$ 2.2 1.8 1.8 1.9 1.6 1.7 1.6 1.7 1.6 1.4 1.5 1.7 1.8 1.9 2.1
Federal Budget Deficit -211 -167 -142 -155 -236 -267 -327 -226 -185 -146 -111 -2 54 158 255

Housing 1986 1987 1988 1989 1990 1991 1992 1993 1994 1995 1996 1997 1998 1999 2000New 1-family Homes Sold 000s 746.4 669 674.3 653.3 532.8 509.3 613.6 674.4 667.3 669.5 755.7 806.3 889.4 878.5 880.7
y/y % chg 8 -10.4 0.8 -3.1 -18.4 -4.4 20.5 9.9 -1.1 0.3 12.9 6.7 10.3 -1.2 0.2
Existing 1-family Homes Sold 000s 3473.3 3435 3510 3342.5 3225.8 3165.8 3483.3 3777.5 3915.8 3876.7 4191.7 4376.7 4964.2 5194.2 5122.5
y/y % chg 10.8 -1.1 2.2 -4.8 -3.5 -1.9 10 8.4 3.7 -1 8.1 4.4 13.4 4.6 -1.4 New & Existing Homes Sold 000s 4219.8 4104 4184.3 3995.8 3758.7 3675.2 4096.9 4451.9 4583.1 4546.2 4947.4 5183 5853.6 6072.7 6003.2 y/y % chg 10.3 -2.7 2 -4.5 -5.9 -2.2 11.5 8.7 2.9 -0.8 8.8 4.8 12.9 3.7 -1.1
Housing Starts (Private) 000s 1811.9 1630.5 1487.8 1382.1 1203.2 1008.8 1201.4 1291.6 1446 1361 1468.7 1474.6 1621.2 1647.2 1574.8
y/y % chg 4 -10 -8.7 -7.1 -12.9 -16.2 19.1 7.5 12 -5.9 7.9 0.4 9.9 1.6 -4.4
Housing Permits (Private) 000s 1771.1 1541.3 1452.1 1350.3 1123.7 945.7 1098 1207.3 1366.9 1335.8 1419.1 1442.2 1619.4 1663.9 1602.4
y/y % chg 2.2 -13 -5.8 -7 -16.8 -15.8 16.1 9.9 13.2 -2.3 6.2 1.6 12.3 2.7 -3.7
Effective Mortgage Rate-Existing % 10.3 9.3 9.3 10.1 10 9.3 8.1 7.2 7.5 7.8 7.7 7.7 7.1 7.3 8
y/y % chg -12.7 -9.5 0.3 8.6 -0.7 -7.4 -12.8 -11.7 4.3 5 -1.7 -0.4 -7.6 3.3 9.6
C & I Loans Outstanding $Bil 349.8 364.1 443.4 488.6 516.4 492.2 460.1 462.1 479.5 547.9 579.1 615.6 706.3 791.2 910.6
y/y % chg 3.2 4.1 21.8 10.2 5.7 -4.7 -6.5 0.4 3.8 14.3 5.7 6.3 14.7 12 15.1
Median New 1-family Home Price $000s 92.2 104.7 113.4 120.4 122.3 120 121.3 126.1 130.4 133.4 139.8 145.1 152 159.8 166.5
y/y % chg 9.4 13.5 8.3 6.2 1.6 -1.8 1.1 4 3.4 2.3 4.7 3.8 4.8 5.2 4.2
Avg. New 1-family Home Price $000s 112.2 127.9 139 148.3 149 147 144.9 147.6 153.7 157.6 165.7 174.4 180.7 194 204.5
y/y % chg 11.1 14.1 8.6 6.7 0.5 -1.3 -1.5 1.9 4.1 2.5 5.2 5.3 3.6 7.4 5.4
Mortgage Loan Outstanding
1-4 Family $Bil 1621.9 1853.6 2077.6 2302.9 2526.3 2688.2 2877.6 3064.1 3307.3 3551.8 3743.7 3905.6 4181.1 4624.7 5018.9
y/y % chg 12.9 14.3 12.1 10.8 9.7 6.4 7.0 6.5 7.9 7.4 5.4 4.3 7.1 10.6 8.5
5+ Family $Bil 240.1 278.9 290.1 304.9 308.8 309.4 302.6 291.6 284.7 282.3 302.6 314.8 324.3 356.5 396.6
y/y % chg 18.4 16.1 4.0 5.1 1.3 0.2 -2.2 -3.6 -2.4 -0.9 7.2 4.1 3.0 9.9 11.2
All $Bil 2492.5 2863.7 3137.9 3425.1 3677.3 3849.7 3994.7 4139.6 4367.3 4617.4 4880.1 5123.1 5503.7 6128.9 6663.4
y/y % chg 12.7 14.9 9.6 9.2 7.4 4.7 3.8 3.6 5.5 5.7 5.7 5.0 7.4 11.4 8.7
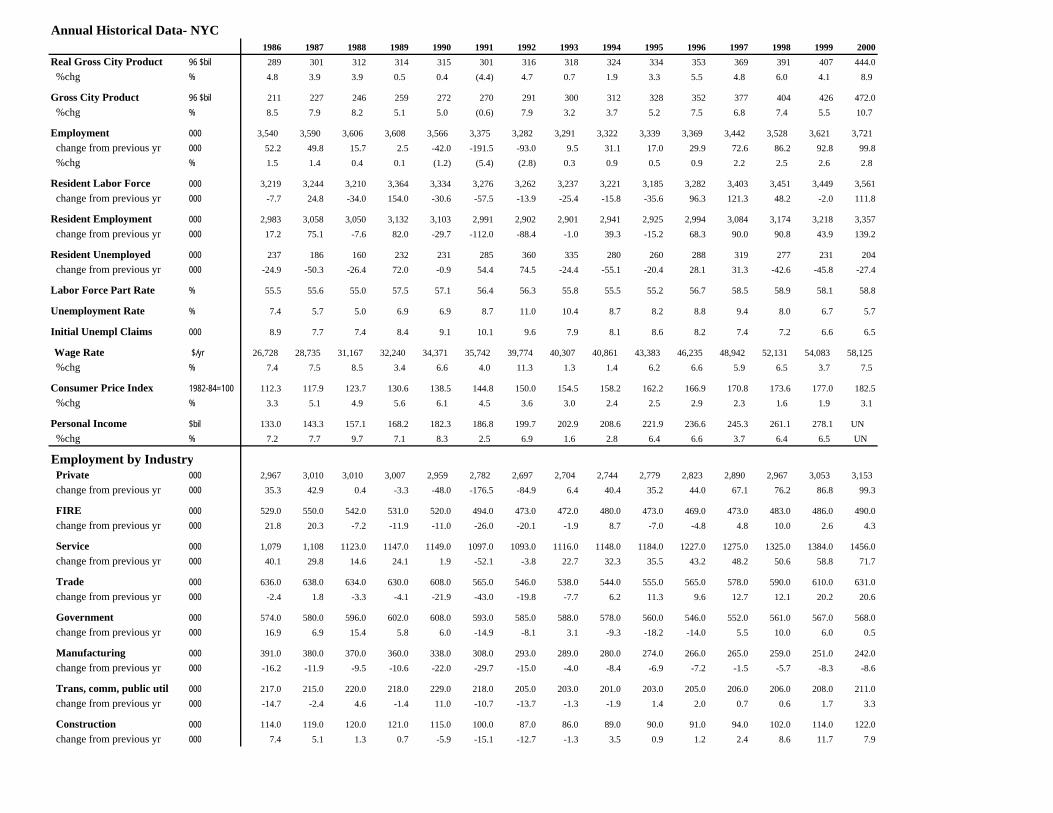
Annual Historical Data- NYC1986 1987 1988 1989 1990 1991 1992 1993 1994 1995 1996 1997 1998 1999 2000
Real Gross City Product 96 $bil 289 301 312 314 315 301 316 318 324 334 353 369 391 407 444.0 %chg % 4.8 3.9 3.9 0.5 0.4 (4.4) 4.7 0.7 1.9 3.3 5.5 4.8 6.0 4.1 8.9 Gross City Product 96 $bil 211 227 246 259 272 270 291 300 312 328 352 377 404 426 472.0 %chg % 8.5 7.9 8.2 5.1 5.0 (0.6) 7.9 3.2 3.7 5.2 7.5 6.8 7.4 5.5 10.7 Employment 000 3,540 3,590 3,606 3,608 3,566 3,375 3,282 3,291 3,322 3,339 3,369 3,442 3,528 3,621 3,721 change from previous yr 000 52.2 49.8 15.7 2.5 -42.0 -191.5 -93.0 9.5 31.1 17.0 29.9 72.6 86.2 92.8 99.8 %chg % 1.5 1.4 0.4 0.1 (1.2) (5.4) (2.8) 0.3 0.9 0.5 0.9 2.2 2.5 2.6 2.8 Resident Labor Force 000 3,219 3,244 3,210 3,364 3,334 3,276 3,262 3,237 3,221 3,185 3,282 3,403 3,451 3,449 3,561 change from previous yr 000 -7.7 24.8 -34.0 154.0 -30.6 -57.5 -13.9 -25.4 -15.8 -35.6 96.3 121.3 48.2 -2.0 111.8 Resident Employment 000 2,983 3,058 3,050 3,132 3,103 2,991 2,902 2,901 2,941 2,925 2,994 3,084 3,174 3,218 3,357 change from previous yr 000 17.2 75.1 -7.6 82.0 -29.7 -112.0 -88.4 -1.0 39.3 -15.2 68.3 90.0 90.8 43.9 139.2 Resident Unemployed 000 237 186 160 232 231 285 360 335 280 260 288 319 277 231 204 change from previous yr 000 -24.9 -50.3 -26.4 72.0 -0.9 54.4 74.5 -24.4 -55.1 -20.4 28.1 31.3 -42.6 -45.8 -27.4 Labor Force Part Rate % 55.5 55.6 55.0 57.5 57.1 56.4 56.3 55.8 55.5 55.2 56.7 58.5 58.9 58.1 58.8 Unemployment Rate % 7.4 5.7 5.0 6.9 6.9 8.7 11.0 10.4 8.7 8.2 8.8 9.4 8.0 6.7 5.7 Initial Unempl Claims 000 8.9 7.7 7.4 8.4 9.1 10.1 9.6 7.9 8.1 8.6 8.2 7.4 7.2 6.6 6.5 Wage Rate $/yr 26,728 28,735 31,167 32,240 34,371 35,742 39,774 40,307 40,861 43,383 46,235 48,942 52,131 54,083 58,125
%chg % 7.4 7.5 8.5 3.4 6.6 4.0 11.3 1.3 1.4 6.2 6.6 5.9 6.5 3.7 7.5 Consumer Price Index 1982-84=100 112.3 117.9 123.7 130.6 138.5 144.8 150.0 154.5 158.2 162.2 166.9 170.8 173.6 177.0 182.5 %chg % 3.3 5.1 4.9 5.6 6.1 4.5 3.6 3.0 2.4 2.5 2.9 2.3 1.6 1.9 3.1 Personal Income $bil 133.0 143.3 157.1 168.2 182.3 186.8 199.7 202.9 208.6 221.9 236.6 245.3 261.1 278.1 UN %chg % 7.2 7.7 9.7 7.1 8.3 2.5 6.9 1.6 2.8 6.4 6.6 3.7 6.4 6.5 UN
Employment by Industry Private 000 2,967 3,010 3,010 3,007 2,959 2,782 2,697 2,704 2,744 2,779 2,823 2,890 2,967 3,053 3,153 change from previous yr 000 35.3 42.9 0.4 -3.3 -48.0 -176.5 -84.9 6.4 40.4 35.2 44.0 67.1 76.2 86.8 99.3 FIRE 000 529.0 550.0 542.0 531.0 520.0 494.0 473.0 472.0 480.0 473.0 469.0 473.0 483.0 486.0 490.0 change from previous yr 000 21.8 20.3 -7.2 -11.9 -11.0 -26.0 -20.1 -1.9 8.7 -7.0 -4.8 4.8 10.0 2.6 4.3 Service 000 1,079 1,108 1123.0 1147.0 1149.0 1097.0 1093.0 1116.0 1148.0 1184.0 1227.0 1275.0 1325.0 1384.0 1456.0 change from previous yr 000 40.1 29.8 14.6 24.1 1.9 -52.1 -3.8 22.7 32.3 35.5 43.2 48.2 50.6 58.8 71.7 Trade 000 636.0 638.0 634.0 630.0 608.0 565.0 546.0 538.0 544.0 555.0 565.0 578.0 590.0 610.0 631.0 change from previous yr 000 -2.4 1.8 -3.3 -4.1 -21.9 -43.0 -19.8 -7.7 6.2 11.3 9.6 12.7 12.1 20.2 20.6 Government 000 574.0 580.0 596.0 602.0 608.0 593.0 585.0 588.0 578.0 560.0 546.0 552.0 561.0 567.0 568.0 change from previous yr 000 16.9 6.9 15.4 5.8 6.0 -14.9 -8.1 3.1 -9.3 -18.2 -14.0 5.5 10.0 6.0 0.5 Manufacturing 000 391.0 380.0 370.0 360.0 338.0 308.0 293.0 289.0 280.0 274.0 266.0 265.0 259.0 251.0 242.0 change from previous yr 000 -16.2 -11.9 -9.5 -10.6 -22.0 -29.7 -15.0 -4.0 -8.4 -6.9 -7.2 -1.5 -5.7 -8.3 -8.6 Trans, comm, public util 000 217.0 215.0 220.0 218.0 229.0 218.0 205.0 203.0 201.0 203.0 205.0 206.0 206.0 208.0 211.0 change from previous yr 000 -14.7 -2.4 4.6 -1.4 11.0 -10.7 -13.7 -1.3 -1.9 1.4 2.0 0.7 0.6 1.7 3.3 Construction 000 114.0 119.0 120.0 121.0 115.0 100.0 87.0 86.0 89.0 90.0 91.0 94.0 102.0 114.0 122.0 change from previous yr 000 7.4 5.1 1.3 0.7 -5.9 -15.1 -12.7 -1.3 3.5 0.9 1.2 2.4 8.6 11.7 7.9