on the structural integrity assessment of cracked piping … · · 2015-03-30on the structural...
TRANSCRIPT
Available online at www.sciencedirect.com
Progress in Nuclear Energy 50 (2008) 800e817www.elsevier.com/locate/pnucene
On the structural integrity assessment of cracked piping ofPWR nuclear reactors primary systems
M. Mattar Neto a,*, J.R.B. Cruz b, R.P. de Jong c
a Energy and Nuclear Research Institute e IPEN, Av. Prof. Lineu Prestes, 2242, 05508-000 S~ao Paulo, Brazilb Nuclear Energy National Commission e CNEN, Av. Dom Luı́s, 880, 60160-230 Fortaleza, Brazil
c Navy Technological Center in S~ao Paulo e CTMSP, Av. Prof. Lineu Prestes, 2468, 05508-000 S~ao Paulo, Brazil
Abstract
The structural integrity assessment methods of cracked components manufactured with ductile materials request the evaluation ofparameters of the ElasticePlastic Fracture Mechanics (EPFM) and of the Limit Load Analysis (LL). The following simplified methodsfor evaluation of the ductile behavior of cracked piping systems are available in the literature and were considered in this work: JeTmethod (J-integral versus the tearing modulus T ) [Paris, P.C., Johnson, R.E., 1983. A method of application of elasticeplastic fracturemechanics to nuclear vessel analysis. In: ElasticePlastic Fracture: Second Symposium, vol. II, ASTM STP 803, pp. II-5eII-40], R6 method[Milne, I., Ainsworth, R.A., Dowling, A.R., Steward, A.T., 1988. Assessment of the Integrity of Structures Containing Defects. CEGB Re-port R/H/R6 e Revision 3, 1986. International Journal of Pressure Vessels and Piping 32, 3e104] and DPFAD method (Deformation Plas-ticity Failure Assessment Diagram) [Bloom, J.M., Malik, S.N., 1982. Procedure for the Assessment of the Integrity of Nuclear PressureVessels and Piping Containing Defects. EPRI Topical Report NP-2431, Research Project 1237-2, Electric Power Research Institute, CA,USA]. Calculation routines by Jong, R.P. [2004. Structural Integrity Assessment of Cracked PWR Piping Systems. M.Sc. Dissertation, Nu-clear Technology Program, University of S~ao Paulo (in Portuguese)], related to the above defined methods, were applied for the compu-tation of the instability loads for some pipes of primary piping systems of Pressurized Water Reactors (PWR), with through-wallcircumferential cracks, subjected to bending moments, made with high toughness steels. Changes in geometry and values of the materialsproperties were considered. The estimated instability loads (bending moments) obtained for the considered pipes were compared with ex-perimental results obtained from the literature. From those comparisons, some conclusions and comments could be made, being the mainfocus of the work the aspects related to the characterization of the materials properties to the appropriate application of the methods tocracked piping of PWR primary systems, in evaluations of the LBB (Leak-Before-Break) concept.� 2007 Elsevier Ltd. All rights reserved.
Keywords: LBB; Fracture mechanics; Limit load; Piping; PWR
1. Introduction
Methods for the structural integrity assessment of compo-nents containing flaws play a fundamental role in thedecision of the service adequacy, aging managementprograms development and life extension assessment, beingmainly important in the analysis of the accident conditions
* Corresponding author. Tel.: þ55 11 3816 9437; fax: þ55 11 3816 9423.
E-mail address: [email protected] (M.M. Neto).
0149-1970/$ - see front matter � 2007 Elsevier Ltd. All rights reserved.
doi:10.1016/j.pnucene.2007.08.006
postulated in codes and standards. For components fabri-cated with ductile materials, the sudden rupture of thematerial is followed by a considerable amount of slow andstable growth of the crack. In these cases the capacity tosupport loads can increase well beyond the limit imposedby the resistance to fracture of the material expressed byJIc (limit of resistance to fracture for the initiation of thestable growth of the crack). The three methods consideredin this work to assess the described structural behavior arenext shortly described.
801M.M. Neto et al. / Progress in Nuclear Energy 50 (2008) 800e817
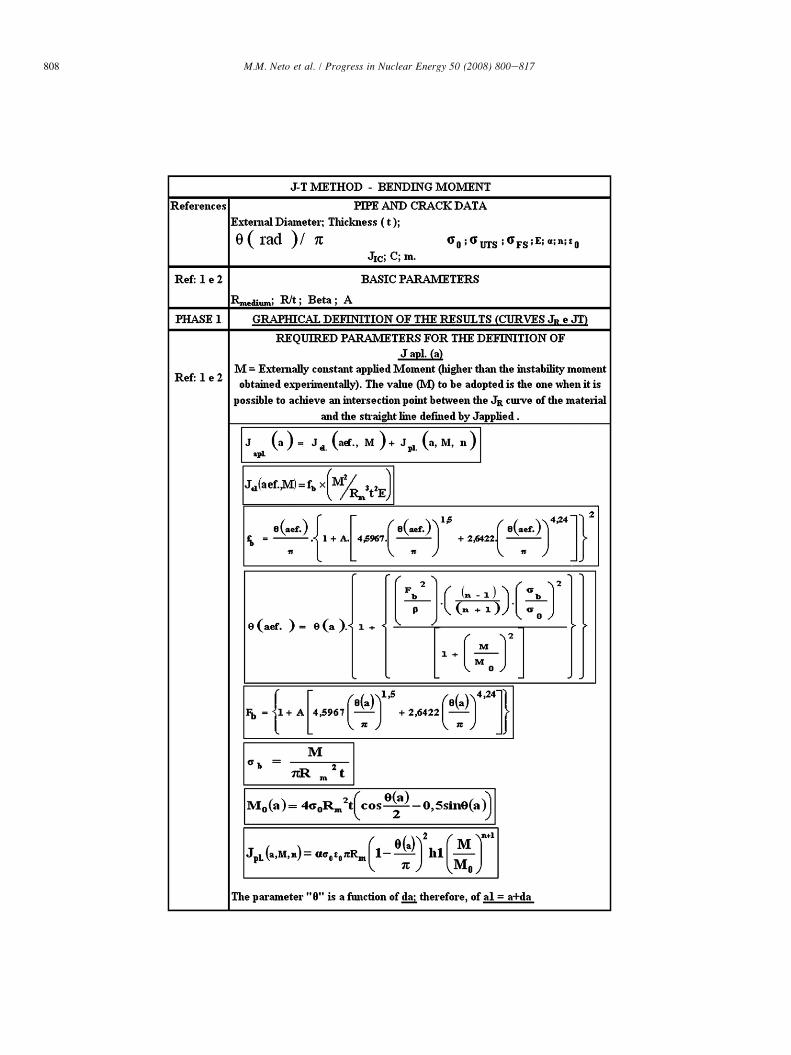
2. JeT method
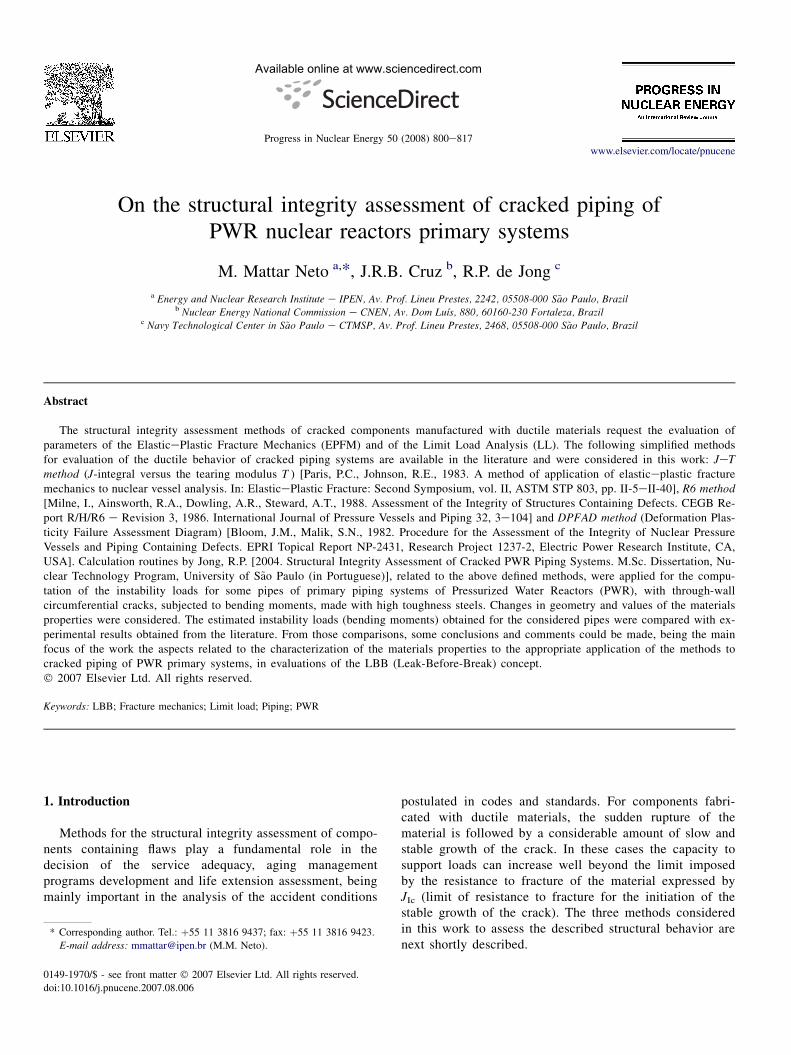
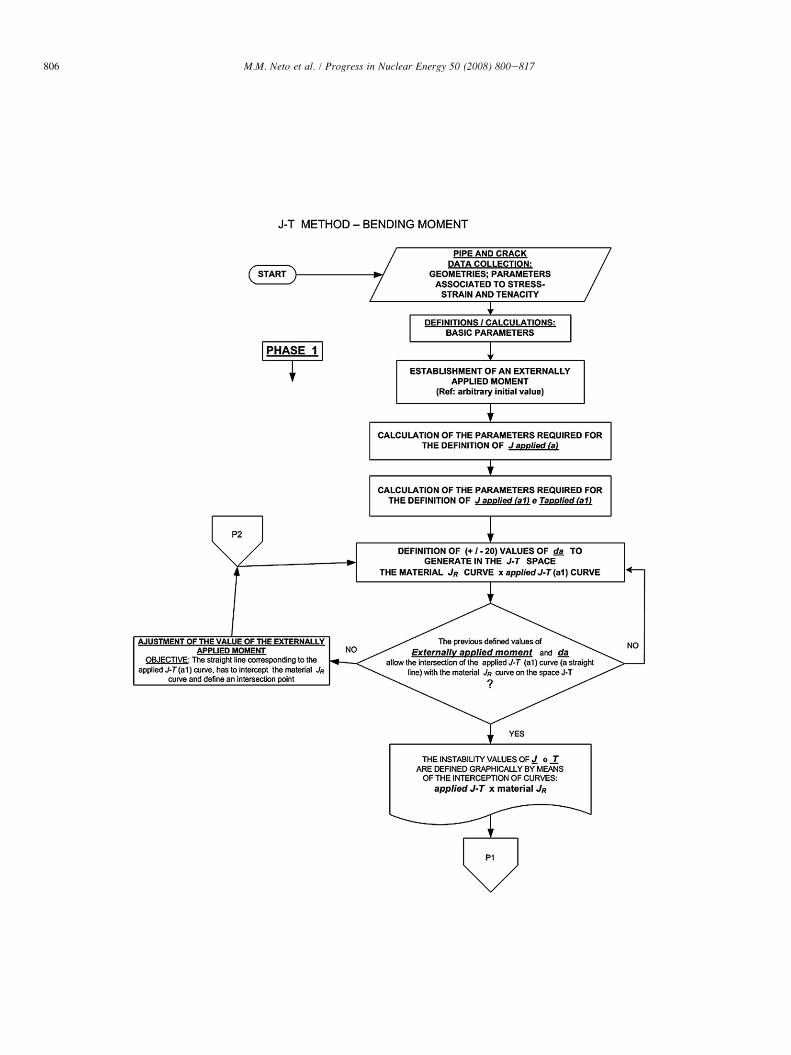
This method by Paris and Johnson (1983) involves the plot-ting of two curves on the JeT space, where J is the J-integraland T is the tearing module. One is the material JeT curve andthe other is the applied JeT curve for the crack initial lengthand is a function of the applied load. The intersection of thesetwo curves corresponds to the instability point (Fig. 1).
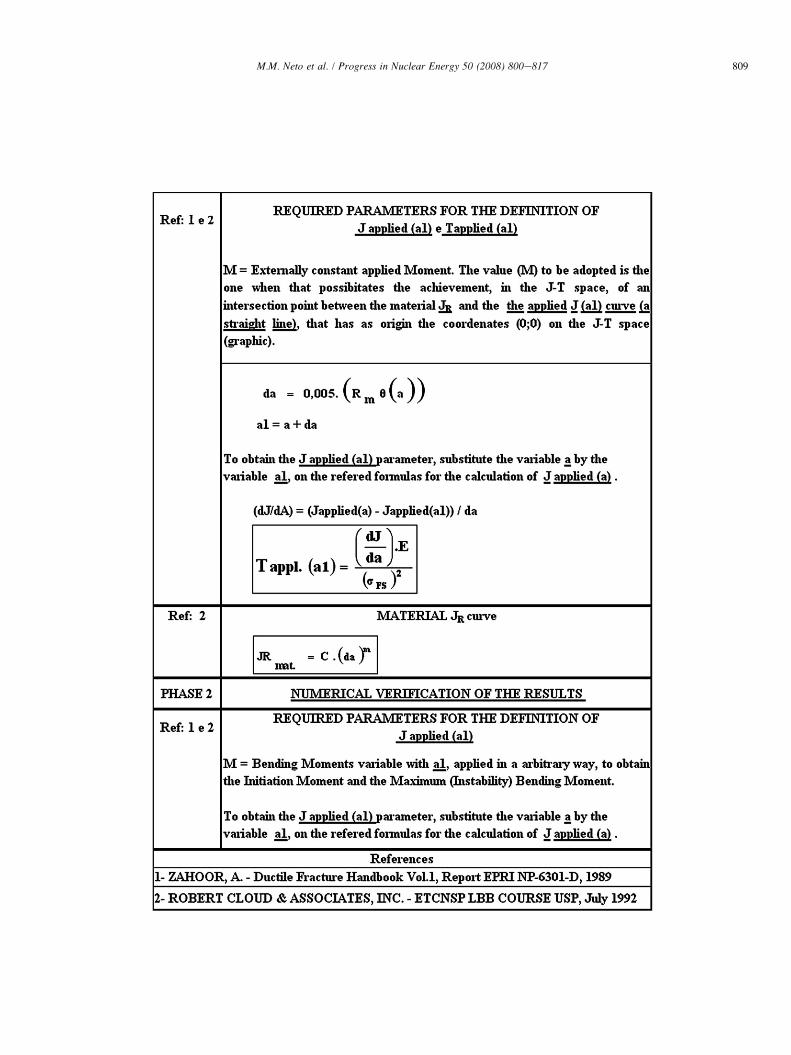
The material JeT curve is obtained from the JR curve,which represents the material resistance to fracture. Applyingthe schema defined at the EPRI-GE manual (Zahoor, 1989),applied J can be calculated as a function of the loading and,then, numerically differentiated to obtain the applied T. Ifthe initial growth of the crack is neglected, when this curveis plotted in the JeT space it will become a straight line, whichcan be defined connecting the origin to a single point in the JeT space (point A). To determine this loading line, one mustcalculate J twice, first for the initial crack length a and, after-wards, considering a small extension of the crack to determineDa and DJ.
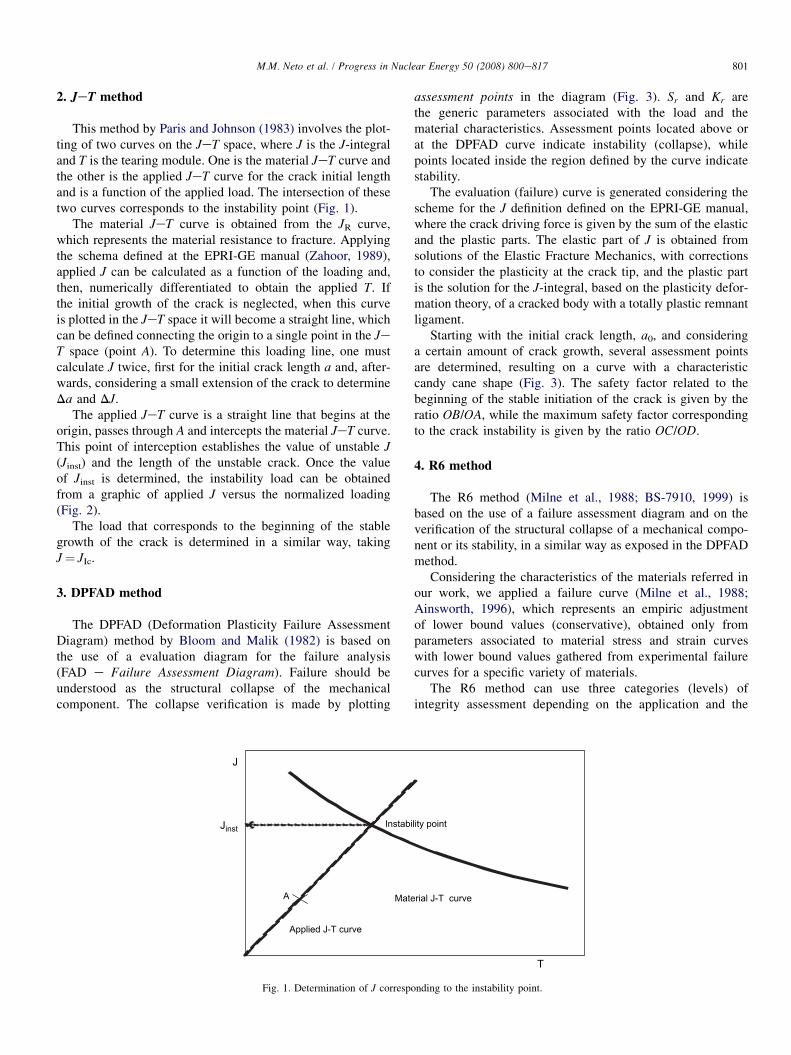
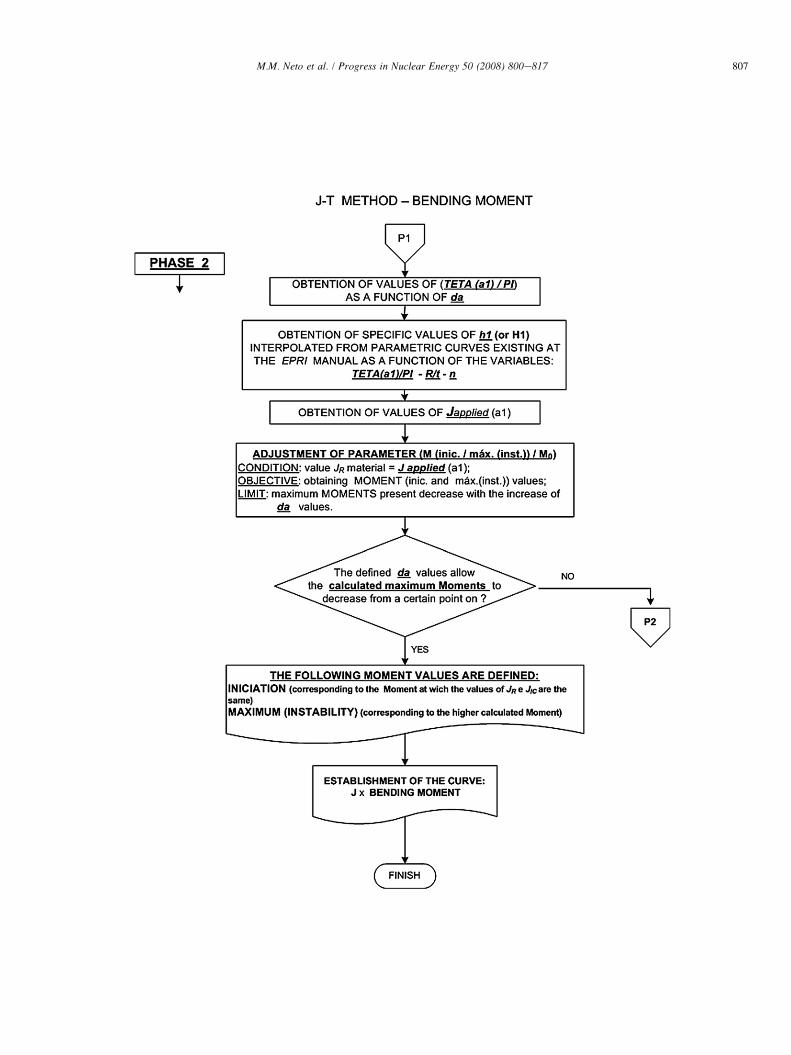
The applied JeT curve is a straight line that begins at theorigin, passes through A and intercepts the material JeT curve.This point of interception establishes the value of unstable J(Jinst) and the length of the unstable crack. Once the valueof Jinst is determined, the instability load can be obtainedfrom a graphic of applied J versus the normalized loading(Fig. 2).
The load that corresponds to the beginning of the stablegrowth of the crack is determined in a similar way, takingJ¼ JIc.
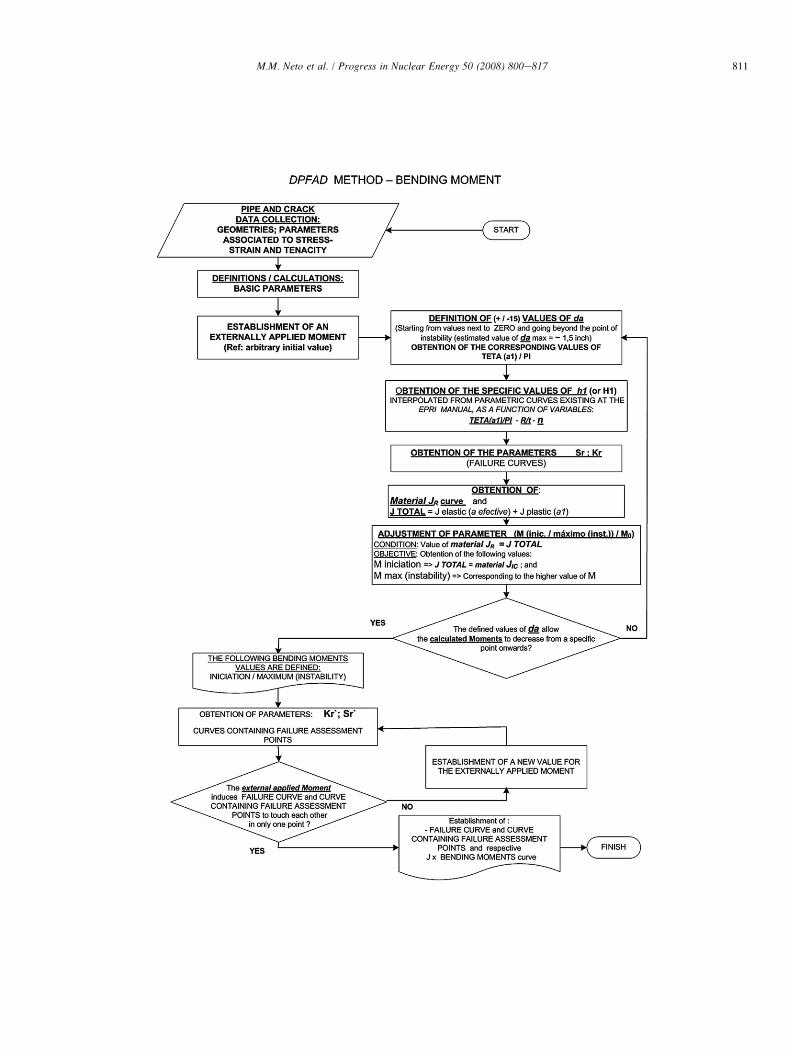
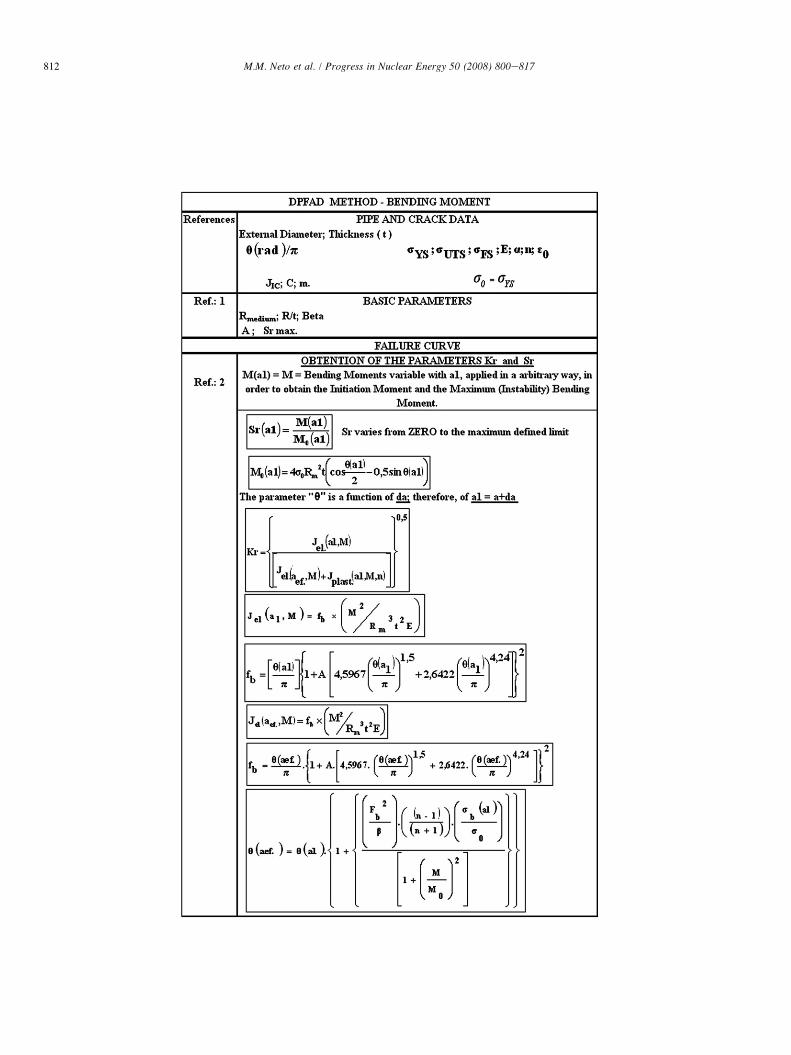
3. DPFAD method
The DPFAD (Deformation Plasticity Failure AssessmentDiagram) method by Bloom and Malik (1982) is based onthe use of a evaluation diagram for the failure analysis(FAD e Failure Assessment Diagram). Failure should beunderstood as the structural collapse of the mechanicalcomponent. The collapse verification is made by plotting
Instabi
MateA
Jinst
J
Applied J-T curve
Fig. 1. Determination of J correspo
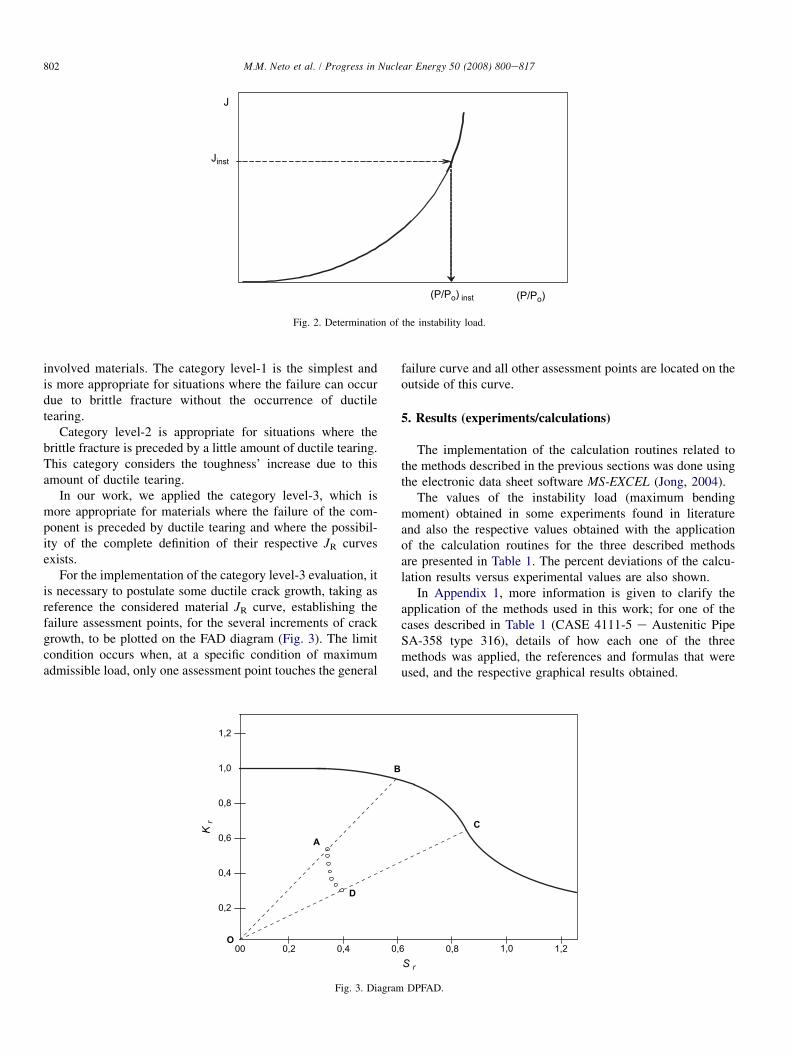
assessment points in the diagram (Fig. 3). Sr and Kr arethe generic parameters associated with the load and thematerial characteristics. Assessment points located above orat the DPFAD curve indicate instability (collapse), whilepoints located inside the region defined by the curve indicatestability.
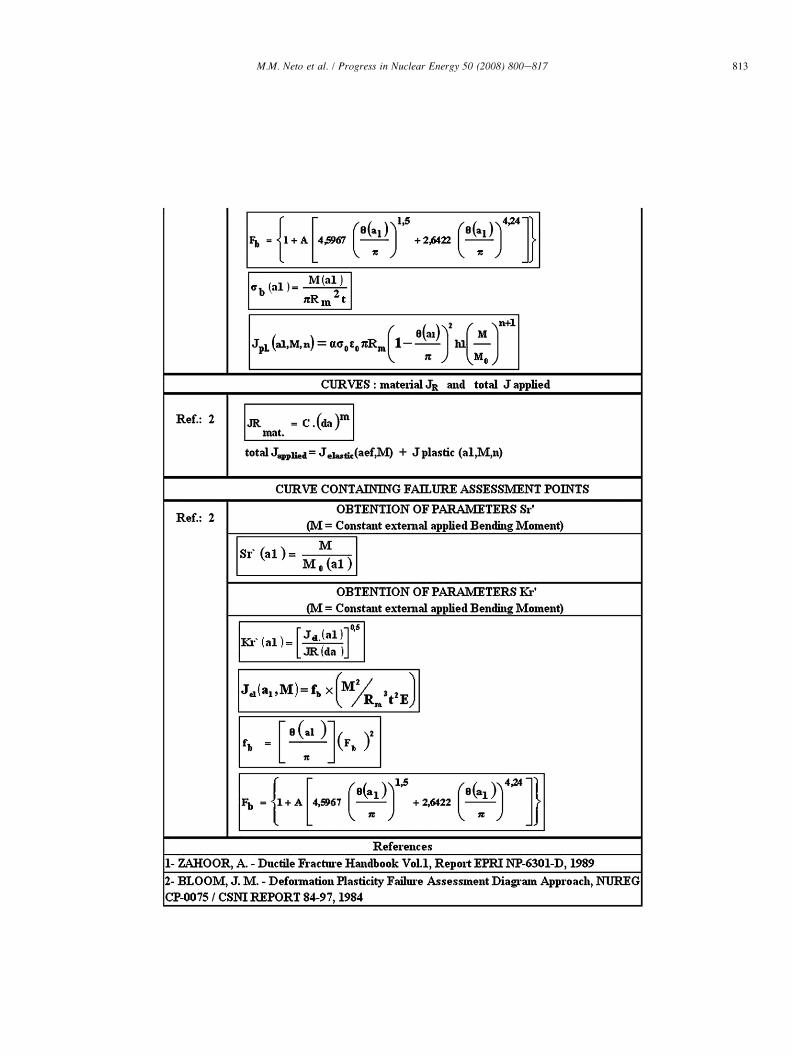
The evaluation (failure) curve is generated considering thescheme for the J definition defined on the EPRI-GE manual,where the crack driving force is given by the sum of the elasticand the plastic parts. The elastic part of J is obtained fromsolutions of the Elastic Fracture Mechanics, with correctionsto consider the plasticity at the crack tip, and the plastic partis the solution for the J-integral, based on the plasticity defor-mation theory, of a cracked body with a totally plastic remnantligament.
Starting with the initial crack length, a0, and consideringa certain amount of crack growth, several assessment pointsare determined, resulting on a curve with a characteristiccandy cane shape (Fig. 3). The safety factor related to thebeginning of the stable initiation of the crack is given by theratio OB/OA, while the maximum safety factor correspondingto the crack instability is given by the ratio OC/OD.
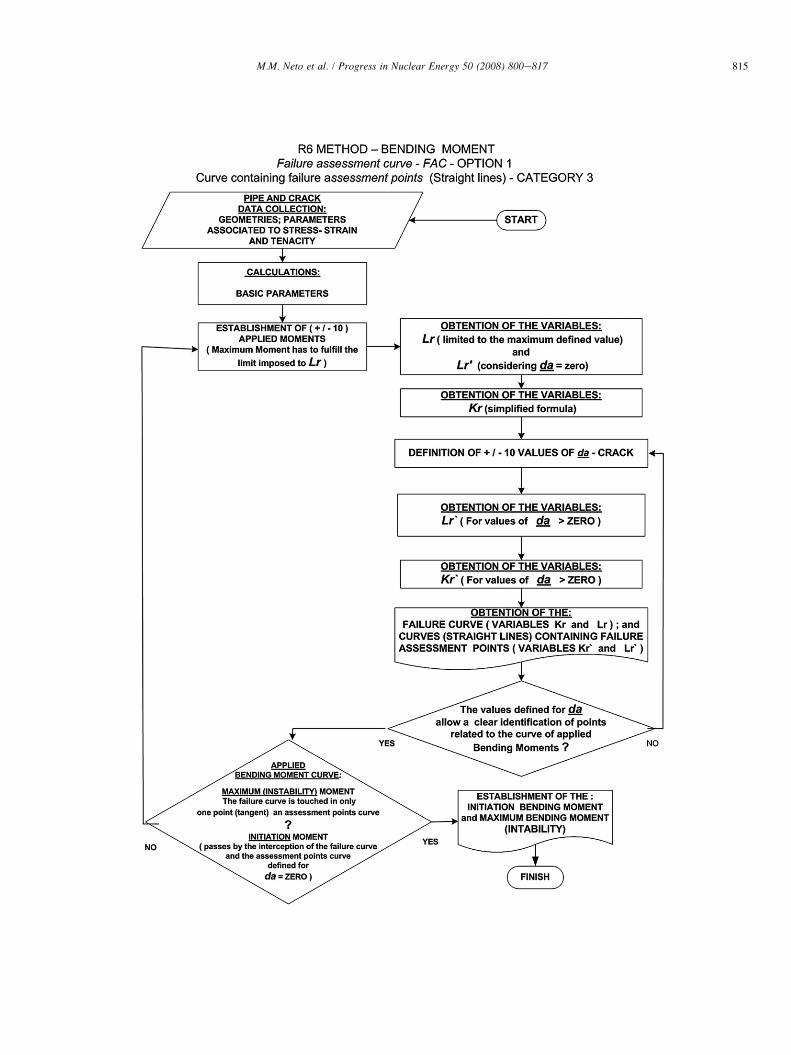
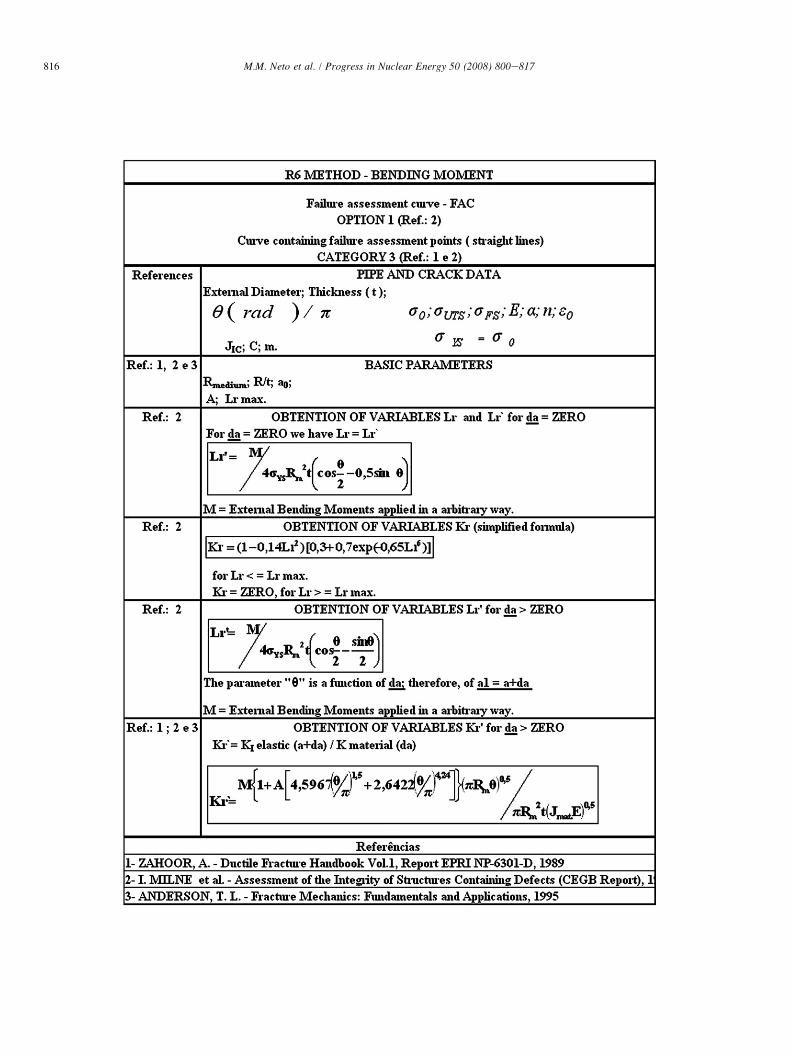
4. R6 method
The R6 method (Milne et al., 1988; BS-7910, 1999) isbased on the use of a failure assessment diagram and on theverification of the structural collapse of a mechanical compo-nent or its stability, in a similar way as exposed in the DPFADmethod.
Considering the characteristics of the materials referred inour work, we applied a failure curve (Milne et al., 1988;Ainsworth, 1996), which represents an empiric adjustmentof lower bound values (conservative), obtained only fromparameters associated to material stress and strain curveswith lower bound values gathered from experimental failurecurves for a specific variety of materials.
The R6 method can use three categories (levels) ofintegrity assessment depending on the application and the
lity point
rial J-T curve
T
nding to the instability point.
Jinst
(P/Po)
J
(P/Po) inst
Fig. 2. Determination of the instability load.
802 M.M. Neto et al. / Progress in Nuclear Energy 50 (2008) 800e817
involved materials. The category level-1 is the simplest andis more appropriate for situations where the failure can occurdue to brittle fracture without the occurrence of ductiletearing.
Category level-2 is appropriate for situations where thebrittle fracture is preceded by a little amount of ductile tearing.This category considers the toughness’ increase due to thisamount of ductile tearing.
In our work, we applied the category level-3, which ismore appropriate for materials where the failure of the com-ponent is preceded by ductile tearing and where the possibil-ity of the complete definition of their respective JR curvesexists.
For the implementation of the category level-3 evaluation, itis necessary to postulate some ductile crack growth, taking asreference the considered material JR curve, establishing thefailure assessment points, for the several increments of crackgrowth, to be plotted on the FAD diagram (Fig. 3). The limitcondition occurs when, at a specific condition of maximumadmissible load, only one assessment point touches the general
00 0,4 0,0,2O
0,2
0,4
0,6
0,8
1,0
1,2
K r
A
D
B
Fig. 3. Diagram
failure curve and all other assessment points are located on theoutside of this curve.
5. Results (experiments/calculations)
The implementation of the calculation routines related tothe methods described in the previous sections was done usingthe electronic data sheet software MS-EXCEL (Jong, 2004).
The values of the instability load (maximum bendingmoment) obtained in some experiments found in literatureand also the respective values obtained with the applicationof the calculation routines for the three described methodsare presented in Table 1. The percent deviations of the calcu-lation results versus experimental values are also shown.
In Appendix 1, more information is given to clarify theapplication of the methods used in this work; for one of thecases described in Table 1 (CASE 4111-5 e Austenitic PipeSA-358 type 316), details of how each one of the threemethods was applied, the references and formulas that wereused, and the respective graphical results obtained.
6 0,8 1,0 1,2S
r
C
DPFAD.
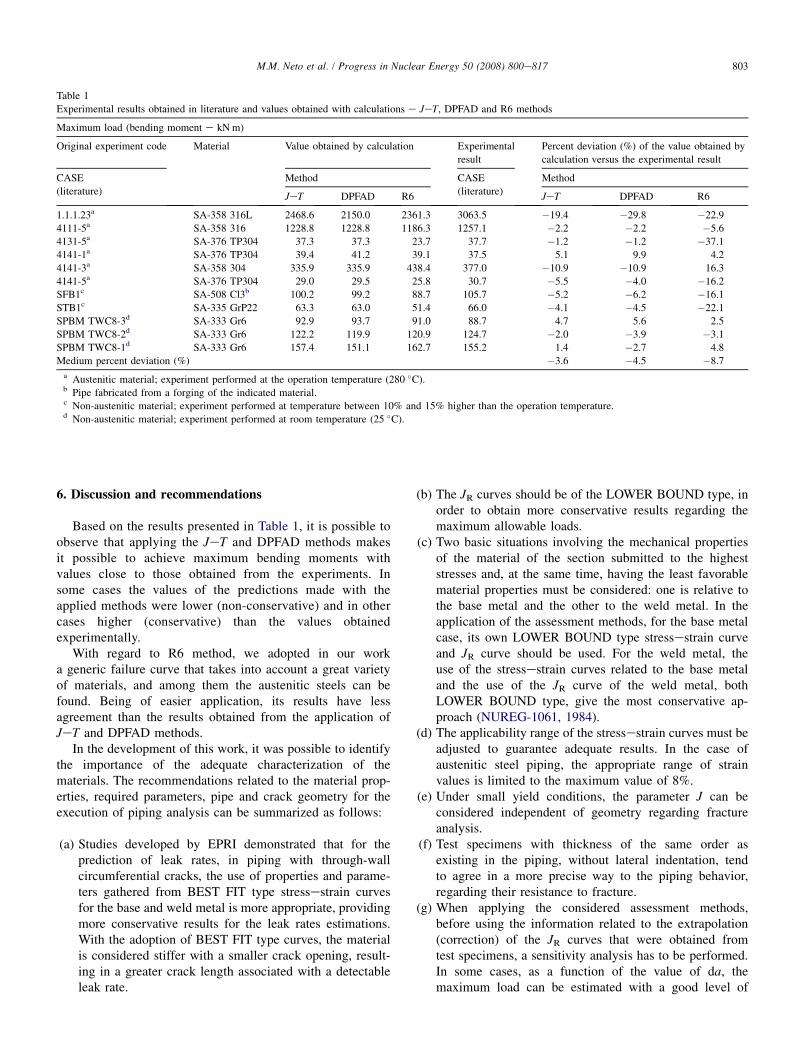
Table 1
Experimental results obtained in literature and values obtained with calculations e JeT, DPFAD and R6 methods
Maximum load (bending moment e kN m)
Original experiment code Material Value obtained by calculation Experimental
result
Percent deviation (%) of the value obtained by
calculation versus the experimental result
CASE
(literature)
Method CASE
(literature)
Method
JeT DPFAD R6 JeT DPFAD R6
1.1.1.23a SA-358 316L 2468.6 2150.0 2361.3 3063.5 �19.4 �29.8 �22.9
4111-5a SA-358 316 1228.8 1228.8 1186.3 1257.1 �2.2 �2.2 �5.6
4131-5a SA-376 TP304 37.3 37.3 23.7 37.7 �1.2 �1.2 �37.1
4141-1a SA-376 TP304 39.4 41.2 39.1 37.5 5.1 9.9 4.2
4141-3a SA-358 304 335.9 335.9 438.4 377.0 �10.9 �10.9 16.3
4141-5a SA-376 TP304 29.0 29.5 25.8 30.7 �5.5 �4.0 �16.2
SFB1c SA-508 Cl3b 100.2 99.2 88.7 105.7 �5.2 �6.2 �16.1
STB1c SA-335 GrP22 63.3 63.0 51.4 66.0 �4.1 �4.5 �22.1
SPBM TWC8-3d SA-333 Gr6 92.9 93.7 91.0 88.7 4.7 5.6 2.5
SPBM TWC8-2d SA-333 Gr6 122.2 119.9 120.9 124.7 �2.0 �3.9 �3.1
SPBM TWC8-1d SA-333 Gr6 157.4 151.1 162.7 155.2 1.4 �2.7 4.8
Medium percent deviation (%) �3.6 �4.5 �8.7
a Austenitic material; experiment performed at the operation temperature (280 �C).b Pipe fabricated from a forging of the indicated material.c Non-austenitic material; experiment performed at temperature between 10% and 15% higher than the operation temperature.d Non-austenitic material; experiment performed at room temperature (25 �C).
803M.M. Neto et al. / Progress in Nuclear Energy 50 (2008) 800e817
6. Discussion and recommendations
Based on the results presented in Table 1, it is possible toobserve that applying the JeT and DPFAD methods makesit possible to achieve maximum bending moments withvalues close to those obtained from the experiments. Insome cases the values of the predictions made with theapplied methods were lower (non-conservative) and in othercases higher (conservative) than the values obtainedexperimentally.
With regard to R6 method, we adopted in our worka generic failure curve that takes into account a great varietyof materials, and among them the austenitic steels can befound. Being of easier application, its results have lessagreement than the results obtained from the application ofJeT and DPFAD methods.
In the development of this work, it was possible to identifythe importance of the adequate characterization of thematerials. The recommendations related to the material prop-erties, required parameters, pipe and crack geometry for theexecution of piping analysis can be summarized as follows:
(a) Studies developed by EPRI demonstrated that for theprediction of leak rates, in piping with through-wallcircumferential cracks, the use of properties and parame-ters gathered from BEST FIT type stressestrain curvesfor the base and weld metal is more appropriate, providingmore conservative results for the leak rates estimations.With the adoption of BEST FIT type curves, the materialis considered stiffer with a smaller crack opening, result-ing in a greater crack length associated with a detectableleak rate.
(b) The JR curves should be of the LOWER BOUND type, inorder to obtain more conservative results regarding themaximum allowable loads.
(c) Two basic situations involving the mechanical propertiesof the material of the section submitted to the higheststresses and, at the same time, having the least favorablematerial properties must be considered: one is relative tothe base metal and the other to the weld metal. In theapplication of the assessment methods, for the base metalcase, its own LOWER BOUND type stressestrain curveand JR curve should be used. For the weld metal, theuse of the stressestrain curves related to the base metaland the use of the JR curve of the weld metal, bothLOWER BOUND type, give the most conservative ap-proach (NUREG-1061, 1984).
(d) The applicability range of the stressestrain curves must beadjusted to guarantee adequate results. In the case ofaustenitic steel piping, the appropriate range of strainvalues is limited to the maximum value of 8%.
(e) Under small yield conditions, the parameter J can beconsidered independent of geometry regarding fractureanalysis.
(f) Test specimens with thickness of the same order asexisting in the piping, without lateral indentation, tendto agree in a more precise way to the piping behavior,regarding their resistance to fracture.
(g) When applying the considered assessment methods,before using the information related to the extrapolation(correction) of the JR curves that were obtained fromtest specimens, a sensitivity analysis has to be performed.In some cases, as a function of the value of da, themaximum load can be estimated with a good level of
804 M.M. Neto et al. / Progress in Nuclear Energy 50 (2008) 800e817
accuracy, even considering the JR curve obtained directlyfrom tests executed with specimens C(T ), without anycorrection.
(h) The fabrication process that induces deformations in non-preferential directions, as for example, the forging pro-cess, is much more favorable than the lamination process,because it increases the random crystalline orientation ofthe metal grains. The mechanical conformation process,used to give a specific shape to the component, is anotherfactor that has great influence in its resistance to fracture.
For the computational implementation of the describedmethods and associated calculation routines, the followingimportant aspects should be highlighted:
(a) The importance of gathering quality experimental data, asthose listed in Table 2, related to the mechanical propertiesof materials (base metal/welding), to be applied on theanalyses (stressestrain curves and JR curves) by meansof the execution of specific tests and fulfillment of thelimits of extrapolation and applicability of the variables.It is important to capture the failure mode that occurredat the execution of those specific tests (ductile tearing/plastic collapse).
(b) Precise definition of the geometric characteristics of thecracks and components (pipes) (see Table 2), in specialthe initial length of the crack, considering the adequatedefinition of the associated parameters.
Table 2
Information to be obtained in tests related to pipes and associated materials
Test parameters
Experiment number
Piping material identification number
Piping material
External diameter
Piping SCHEDULE
Thickness of the pipe wall
Test temperature
Internal span for four point bending experiment
External span for four point bending experiment
Test pressure
Initial crack length
Crack depth
Type of crack
Experimental results
Load/bending moment at crack initiation
Maximum load
Load cycles (in cyclic test)
Observations.
(a) Tension tests (stressestrain curves) allow the definition of the following param
(b) Test specimens C(T ) type allow the definition of the following parameters: JIc
(c) The imposed loads on tests executed using displacement control are prefera
component being tested tends to be more stable. This is due to the fact that, in du
and, in order to occur a new advance in the crack extension, the displacement h
experimental points (JR curves), for these materials, is executed using the loads imp
In the utilization of this control technique, the load is imposed on the componen
a constant rate and is defined as a ‘‘quasi-static’’ loading.
(c) If feasible, always make use of stressestrain curves andJR curves obtained from tests executed with the mate-rials (base metal/welding) effectively used in the compo-nents, considering their dimensions, geometry andrelevant temperatures at which they will be submittedand also the fabrication and welding procedures appliedto the components. Generally, in cases of pre-existinginstallations, the mechanical properties of similar mate-rials obtained in specific databases are applied instead ofthe properties of the actual component, due to itsunavailability. In these cases, the use of more conserva-tive values of the mechanical properties must be consid-ered, for selected similar materials. Sensitivity analysismust be performed on the safety margins that resultsfrom the application of the simplified methods. Thesafety margins obtained for the cases of pre-existinginstallations are generally more conservative than forthe new installations. This is due to the fact that fornew installations it is possible to execute previous testsand experiments (pipe and test specimens), in order toobtain the mechanical properties, parameters and behav-ior of materials of the specific components. Thematerials to be applied on new installations do notneed to be analyzed considering lower bound mechani-cal properties, which can be too conservative. With theknowledge of the specific information of the materialsto be used in the components, the sensitivity analysisto be applied on the results obtained for these cases
Material properties
Yield stress, sys
Ultimate stress, suts
Percentage strain
Area reduction
30, s0 parameters, and RambergeOsgood coefficients n, a
JIc (J critical e at crack initiation)
dJ/dA (initial slope of JR curve)
JR extrapolated curve parameters (C, m)
Results of the Charpy test (at room temperature)
JR curves (at interest temperatures)
Stressestrain curve, as a function of temperature
E e Elasticity modulus
n e Poisson coefficient
Chemical composition of the material
eters: E, s0, 30, suts, sys, a, n, n.
, C, m.
ble than the tests performed with load control, because the response of the
ctile materials, the crack driving force decreases with the growth of the crack
as to be increased. Considering this characteristic, generally the plotting of
osed via displacement control, which permits a significant stable crack growth.
t being tested, increasing the displacement of a determined point (section) at
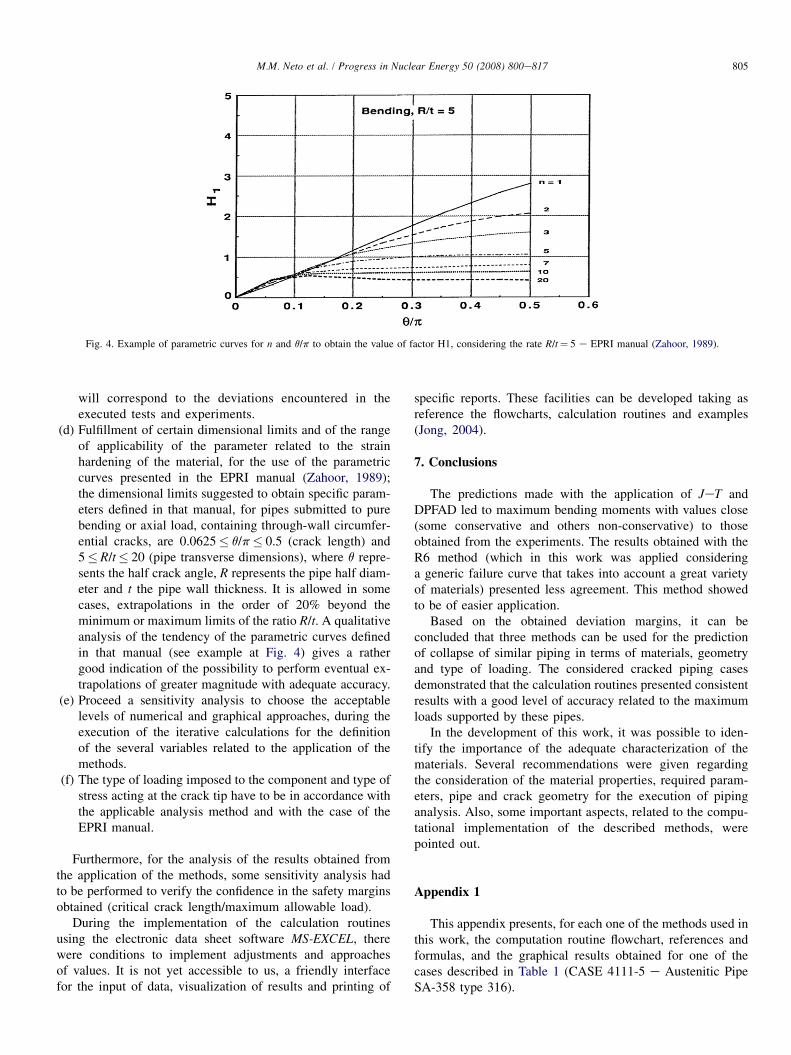
Fig. 4. Example of parametric curves for n and q/p to obtain the value of factor H1, considering the rate R/t¼ 5 e EPRI manual (Zahoor, 1989).
805M.M. Neto et al. / Progress in Nuclear Energy 50 (2008) 800e817
will correspond to the deviations encountered in theexecuted tests and experiments.
(d) Fulfillment of certain dimensional limits and of the rangeof applicability of the parameter related to the strainhardening of the material, for the use of the parametriccurves presented in the EPRI manual (Zahoor, 1989);the dimensional limits suggested to obtain specific param-eters defined in that manual, for pipes submitted to purebending or axial load, containing through-wall circumfer-ential cracks, are 0.0625� q/p� 0.5 (crack length) and5� R/t� 20 (pipe transverse dimensions), where q repre-sents the half crack angle, R represents the pipe half diam-eter and t the pipe wall thickness. It is allowed in somecases, extrapolations in the order of 20% beyond theminimum or maximum limits of the ratio R/t. A qualitativeanalysis of the tendency of the parametric curves definedin that manual (see example at Fig. 4) gives a rathergood indication of the possibility to perform eventual ex-trapolations of greater magnitude with adequate accuracy.
(e) Proceed a sensitivity analysis to choose the acceptablelevels of numerical and graphical approaches, during theexecution of the iterative calculations for the definitionof the several variables related to the application of themethods.
(f) The type of loading imposed to the component and type ofstress acting at the crack tip have to be in accordance withthe applicable analysis method and with the case of theEPRI manual.
Furthermore, for the analysis of the results obtained fromthe application of the methods, some sensitivity analysis hadto be performed to verify the confidence in the safety marginsobtained (critical crack length/maximum allowable load).
During the implementation of the calculation routinesusing the electronic data sheet software MS-EXCEL, therewere conditions to implement adjustments and approachesof values. It is not yet accessible to us, a friendly interfacefor the input of data, visualization of results and printing of
specific reports. These facilities can be developed taking asreference the flowcharts, calculation routines and examples(Jong, 2004).
7. Conclusions
The predictions made with the application of JeT andDPFAD led to maximum bending moments with values close(some conservative and others non-conservative) to thoseobtained from the experiments. The results obtained with theR6 method (which in this work was applied consideringa generic failure curve that takes into account a great varietyof materials) presented less agreement. This method showedto be of easier application.
Based on the obtained deviation margins, it can beconcluded that three methods can be used for the predictionof collapse of similar piping in terms of materials, geometryand type of loading. The considered cracked piping casesdemonstrated that the calculation routines presented consistentresults with a good level of accuracy related to the maximumloads supported by these pipes.
In the development of this work, it was possible to iden-tify the importance of the adequate characterization of thematerials. Several recommendations were given regardingthe consideration of the material properties, required param-eters, pipe and crack geometry for the execution of pipinganalysis. Also, some important aspects, related to the compu-tational implementation of the described methods, werepointed out.
Appendix 1
This appendix presents, for each one of the methods used inthis work, the computation routine flowchart, references andformulas, and the graphical results obtained for one of thecases described in Table 1 (CASE 4111-5 e Austenitic PipeSA-358 type 316).
806 M.M. Neto et al. / Progress in Nuclear Energy 50 (2008) 800e817
807M.M. Neto et al. / Progress in Nuclear Energy 50 (2008) 800e817
808 M.M. Neto et al. / Progress in Nuclear Energy 50 (2008) 800e817
809M.M. Neto et al. / Progress in Nuclear Energy 50 (2008) 800e817
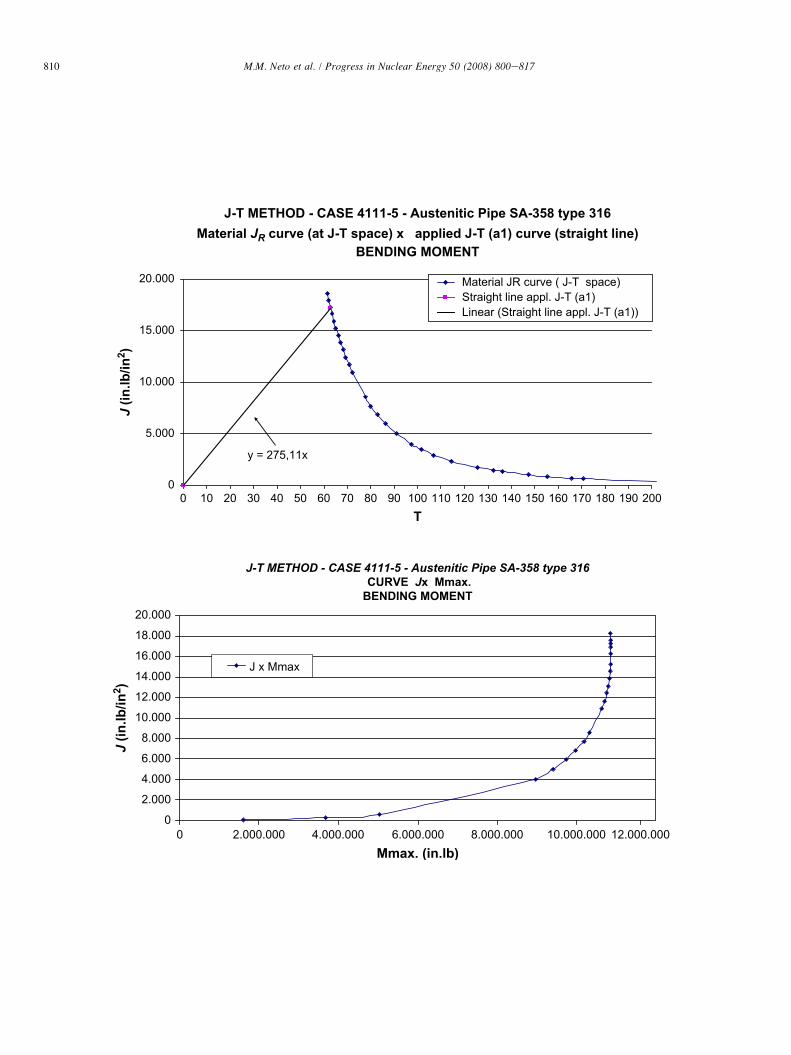
J-T METHOD - CASE 4111-5 - Austenitic Pipe SA-358 type 316
Material JR curve (at J-T space) x applied J-T (a1) curve (straight line)
BENDING MOMENT
y = 275,11x
0
5.000
10.000
15.000
20.000
0 10 20 30 40 50 60 70 80 90 100 110 120 130 140 150 160 170 180 190 200T
J (in
.lb
/in
2)
J (in
.lb
/in
2)
Material JR curve ( J-T space)Straight line appl. J-T (a1)Linear (Straight line appl. J-T (a1))
J-T METHOD - CASE 4111-5 - Austenitic Pipe SA-358 type 316
CURVE Jx Mmax.
BENDING MOMENT
0
2.000
4.000
6.000
8.000
10.000
12.000
14.000
16.000
18.000
20.000
0 2.000.000 4.000.000 6.000.000 8.000.000 10.000.000 12.000.000Mmax. (in.lb)
J x Mmax
810 M.M. Neto et al. / Progress in Nuclear Energy 50 (2008) 800e817
811M.M. Neto et al. / Progress in Nuclear Energy 50 (2008) 800e817
812 M.M. Neto et al. / Progress in Nuclear Energy 50 (2008) 800e817
813M.M. Neto et al. / Progress in Nuclear Energy 50 (2008) 800e817
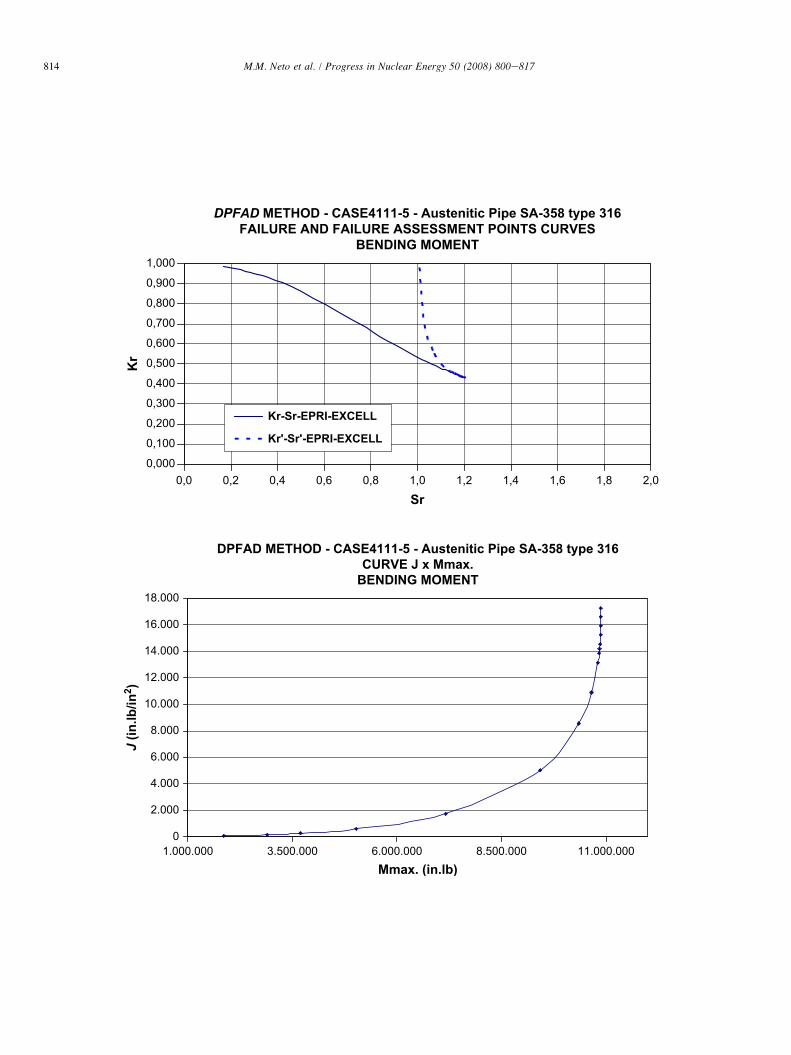
DPFAD METHOD - CASE4111-5 - Austenitic Pipe SA-358 type 316
FAILURE AND FAILURE ASSESSMENT POINTS CURVES
BENDING MOMENT
0,000
0,100
0,200
0,300
0,400
0,500
0,600
0,700
0,800
0,900
1,000
0,0 0,2 0,4 0,6 0,8 1,0 1,2 1,4 1,6 1,8 2,0
Sr
Kr
Kr-Sr-EPRI-EXCELL
Kr'-Sr'-EPRI-EXCELL
DPFAD METHOD - CASE4111-5 - Austenitic Pipe SA-358 type 316
CURVE J x Mmax.
BENDING MOMENT
0
2.000
4.000
6.000
8.000
10.000
12.000
14.000
16.000
18.000
1.000.000 3.500.000 6.000.000 8.500.000 11.000.000Mmax. (in.lb)
J (in
.lb
/in
2)
814 M.M. Neto et al. / Progress in Nuclear Energy 50 (2008) 800e817
815M.M. Neto et al. / Progress in Nuclear Energy 50 (2008) 800e817
816 M.M. Neto et al. / Progress in Nuclear Energy 50 (2008) 800e817
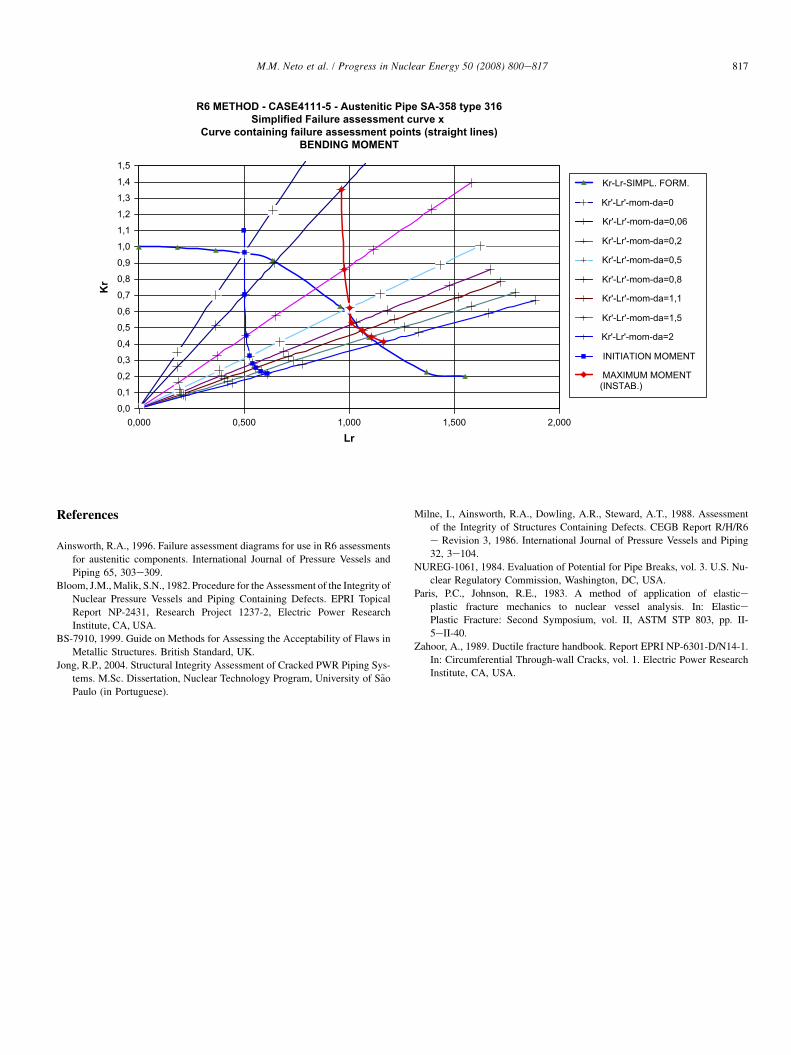
R6 METHOD - CASE4111-5 - Austenitic Pipe SA-358 type 316
Simplified Failure assessment curve x
Curve containing failure assessment points (straight lines)
BENDING MOMENT
0,0
0,1
0,2
0,3
0,4
0,5
0,6
0,7
0,8
0,9
1,0
1,1
1,2
1,3
1,4
1,5
0,000 0,500 1,000 1,500 2,000
Lr
Kr
Kr-Lr-SIMPL. FORM.
Kr'-Lr'-mom-da=0
Kr'-Lr'-mom-da=0,06
Kr'-Lr'-mom-da=0,2
Kr'-Lr'-mom-da=0,5
Kr'-Lr'-mom-da=0,8
Kr'-Lr'-mom-da=1,1
Kr'-Lr'-mom-da=1,5
Kr'-Lr'-mom-da=2
INITIATION MOMENT
MAXIMUM MOMENT(INSTAB.)
817M.M. Neto et al. / Progress in Nuclear Energy 50 (2008) 800e817
References
Ainsworth, R.A., 1996. Failure assessment diagrams for use in R6 assessments
for austenitic components. International Journal of Pressure Vessels and
Piping 65, 303e309.
Bloom, J.M., Malik, S.N., 1982. Procedure for the Assessment of the Integrity of
Nuclear Pressure Vessels and Piping Containing Defects. EPRI Topical
Report NP-2431, Research Project 1237-2, Electric Power Research
Institute, CA, USA.
BS-7910, 1999. Guide on Methods for Assessing the Acceptability of Flaws in
Metallic Structures. British Standard, UK.
Jong, R.P., 2004. Structural Integrity Assessment of Cracked PWR Piping Sys-
tems. M.Sc. Dissertation, Nuclear Technology Program, University of S~ao
Paulo (in Portuguese).
Milne, I., Ainsworth, R.A., Dowling, A.R., Steward, A.T., 1988. Assessment
of the Integrity of Structures Containing Defects. CEGB Report R/H/R6
e Revision 3, 1986. International Journal of Pressure Vessels and Piping
32, 3e104.
NUREG-1061, 1984. Evaluation of Potential for Pipe Breaks, vol. 3. U.S. Nu-
clear Regulatory Commission, Washington, DC, USA.
Paris, P.C., Johnson, R.E., 1983. A method of application of elastice
plastic fracture mechanics to nuclear vessel analysis. In: ElasticePlastic Fracture: Second Symposium, vol. II, ASTM STP 803, pp. II-
5eII-40.
Zahoor, A., 1989. Ductile fracture handbook. Report EPRI NP-6301-D/N14-1.
In: Circumferential Through-wall Cracks, vol. 1. Electric Power Research
Institute, CA, USA.