on the wintertime low bias of northern hemisphere co in ... basic simulation using maccity...
TRANSCRIPT

ACPD14, 245–301, 2014
On the wintertimelow bias of NorthernHemisphere CO in
global model studies
O. Stein et al.
Title Page
Abstract Introduction
Conclusions References
Tables Figures
J I
J I
Back Close
Full Screen / Esc
Printer-friendly Version
Interactive Discussion
Discussion
Paper
|D
iscussionP
aper|
Discussion
Paper
|D
iscussionP
aper|
Atmos. Chem. Phys. Discuss., 14, 245–301, 2014www.atmos-chem-phys-discuss.net/14/245/2014/doi:10.5194/acpd-14-245-2014© Author(s) 2014. CC Attribution 3.0 License.
Atmospheric Chemistry
and Physics
Open A
ccess
Discussions
This discussion paper is/has been under review for the journal Atmospheric Chemistryand Physics (ACP). Please refer to the corresponding final paper in ACP if available.
On the wintertime low bias of NorthernHemisphere carbon monoxide in globalmodel studiesO. Stein1, M. G. Schultz1, I. Bouarar2, H. Clark3,4, V. Huijnen5, A. Gaudel3,4,M. George2, and C. Clerbaux2
1Forschungszentrum Jülich, IEK-8 (Troposphere), Jülich, Germany2UPMC Univ. Paris 06; Université Versailles St-Quentin; CNRS/INSU, LATMOS-IPSL, Paris,France3Université de Toulouse, UPS, LA (Laboratoire d’Aérologie), Toulouse, France4CNRS, LA (Laboratoire d’Aérologie), UMR5560, Toulouse, France5KNMI, De Bilt, the Netherlands
Received: 17 October 2013 – Accepted: 12 December 2013 – Published: 6 January 2014
Correspondence to: O. Stein ([email protected])
Published by Copernicus Publications on behalf of the European Geosciences Union.
245

ACPD14, 245–301, 2014
On the wintertimelow bias of NorthernHemisphere CO in
global model studies
O. Stein et al.
Title Page
Abstract Introduction
Conclusions References
Tables Figures
J I
J I
Back Close
Full Screen / Esc
Printer-friendly Version
Interactive Discussion
Discussion
Paper
|D
iscussionP
aper|
Discussion
Paper
|D
iscussionP
aper|
Abstract
The uncertainties in the global budget of carbon monoxide (CO) are assessed to ex-plain causes for the long-standing issue of Northern Hemispheric wintertime underes-timation of CO concentrations in global models. With a series of MOZART sensitivitysimulations for the year 2008, the impacts from changing a variety of surface sources5
and sinks were analyzed. The model results were evaluated with monthly averages ofsurface station observations from the global CO monitoring network as well as withtotal columns observed from satellites and with vertical profiles from measurementson passenger aircraft. Our basic simulation using MACCity anthropogenic emissionsunderestimated Northern Hemispheric near-surface CO concentrations on average by10
more than 20 ppb from December to April with the largest bias over Europe of up to75 ppb in January. An increase in global biomass burning or biogenic emissions of COor volatile organic compounds (VOC) is not able to reduce the annual course of themodel bias and yields too high concentrations over the Southern Hemisphere. Raisingglobal annual anthropogenic emissions results in overestimations of surface concen-15
trations in most regions all-year-round. Instead, our results indicate that anthropogenicemissions in the MACCity inventory are too low for the industrialized countries duringwinter and spring. Thus we found it necessary to adjust emissions seasonally with re-gionally varying scaling factors. Moreover, exchanging the original resistance-type drydeposition scheme with a parameterization for CO uptake by oxidation from soil bac-20
teria and microbes reduced the boreal winter dry deposition fluxes and could partlycorrect for the model bias. When combining the modified dry deposition scheme withincreased wintertime road traffic emissions over Europe and North America (factorsup to 4.5 and 2, respectively) we were able to optimize the match to surface observa-tions and to reduce the model bias significantly with respect to the satellite and aircraft25
observations. A reason for the apparent underestimation of emissions may be an ex-aggerated downward trend in the RCP8.5 scenario in these regions between 2000 and2010, as this scenario was used to extrapolate the MACCity emissions from their base
246

ACPD14, 245–301, 2014
On the wintertimelow bias of NorthernHemisphere CO in
global model studies
O. Stein et al.
Title Page
Abstract Introduction
Conclusions References
Tables Figures
J I
J I
Back Close
Full Screen / Esc
Printer-friendly Version
Interactive Discussion
Discussion
Paper
|D
iscussionP
aper|
Discussion
Paper
|D
iscussionP
aper|
year 2000. This factor is potentially amplified by a lack of knowledge about the sea-sonality of emissions. A methane lifetime of 9.7 yr for our basic model and 9.8 yr for theoptimized simulation agrees well with current estimates of global OH, but we cannotexclude a potential effect from errors in the geographical and seasonal distribution ofOH concentrations. Finally, underestimated emissions from anthropogenic VOCs can5
also account for a small part of the missing CO concentrations.
1 Introduction
Carbon monoxide (CO) is a product of incomplete combustion and is also producedfrom oxidation of volatile organic compounds (VOC) in the atmosphere. It is of interestas an indirect greenhouse gas and acts as a major sink for the OH radical. The resulting10
inverse relationship between CO and OH is a reason for its important indirect controlfunction on the global atmospheric chemical composition (Novelli et al., 1998). CO isalso a precursor for tropospheric ozone and thus affects regional air quality.
Due to its mean tropospheric lifetime of about two months, CO can be transportedglobally and is often used as a tracer for long-range pollution transport (e.g. Li et al.,15
2002; Liu et al., 2003; Duncan and Bey, 2004; Law and Stohl, 2007; Shindell et al.,2008; Drori et al., 2012; Cristofanelli et al., 2013). Tropospheric CO builds up overthe Northern Hemisphere (NH) during wintertime, when emissions are high and photo-chemical activity is low. The surface CO concentrations peak around March with typicalmixing ratios measured at background stations of around 150 ppb. Above and down-20
wind of strongly polluted areas in East Asia, North America, or Europe, wintertimeconcentrations are significantly higher. Values above 1000 ppb have been reportedover Eastern China (e.g., Wang et al., 2004; Gao et al., 2005). Summertime concen-trations are significantly lower with NH background values going down to 100 ppb dueto the faster photochemical depletion of CO. Tropical and Southern Hemispheric con-25
centrations are generally lower (values as low as 35–40 ppb have been observed inremote areas) due to the limited amount of anthropogenic emissions and the large
247

ACPD14, 245–301, 2014
On the wintertimelow bias of NorthernHemisphere CO in
global model studies
O. Stein et al.
Title Page
Abstract Introduction
Conclusions References
Tables Figures
J I
J I
Back Close
Full Screen / Esc
Printer-friendly Version
Interactive Discussion
Discussion
Paper
|D
iscussionP
aper|
Discussion
Paper
|D
iscussionP
aper|
ocean surface (Novelli et al., 1998; Duncan et al., 2007). In some regions, the highestconcentrations are measured from August to October, largely influenced by emissionsfrom biomass burning (Worden et al., 2013).
The main sources of CO are from anthropogenic and natural direct emissions andfrom the oxidation of methane and other VOCs. Dominant emissions are from road5
traffic, fossil fuel and biomass burning together with smaller contributions from vege-tation and the oceans. Automobile traffic caused about 85 % of the 2008 emissions ofCO from fossil fuels in the USA (http://www.epa.gov/air/emissions/) but only 26 % ofthe 2011 emissions for the European Union (EEA, 2013). The strength of this sourcehas been decreasing since the 1990s in the industrialized countries (e.g. EEA, 2013).10
There is no clear picture for trends of CO emissions from developing countries, but forEast Asia the anthropogenic emissions are estimated to have grown by 34 % from 2000to 2008 (Kurokawa et al., 2013). Reaction with OH radicals acts as the major CO sink(Prather et al., 2001; Duncan et al., 2007), while deposition in soils contributes about10–15 % to the global atmospheric CO losses (Conrad, 1996; Sanhueza et al., 1998;15
King, 1999). A schematic overview of the global CO budget is given in Fig. 1.In spite of more than 15 yr of research, there are still considerable uncertainties about
the global budget of CO: Table 1 lists anthropogenic CO emission totals from recentglobal and regional emission inventories. The inventories report global anthropogenicemissions of 494–611 TgCOyr−1 for the period 2000–2005. Emission reductions in the20
industrialized countries since the late 1990s are largely compensated by an increasein the developing countries, particularly in Asia.
The second most important direct CO emission source is biomass burning. Obser-vations of burned area, active fires and fire radiative power from various satellite instru-ments have been used to constrain these emissions on the global scale. Global and re-25
gional totals for the year 2005 from the most recent emission inventories GFEDv2 (vander Werf et al., 2006), GFEDv3 (van der Werf et al., 2010), and GFASv1 (Kaiser et al.,2012) are displayed in Table 2. Note the large differences in continental-scale emis-sions between the inventories and the large interannual variability in the datasets. Bio-
248

ACPD14, 245–301, 2014
On the wintertimelow bias of NorthernHemisphere CO in
global model studies
O. Stein et al.
Title Page
Abstract Introduction
Conclusions References
Tables Figures
J I
J I
Back Close
Full Screen / Esc
Printer-friendly Version
Interactive Discussion
Discussion
Paper
|D
iscussionP
aper|
Discussion
Paper
|D
iscussionP
aper|
genic emission estimates from the widely used MEGAN-v2 emission inventory (Guen-ther et al., 2006) and the MEGAN-MACC inventory (Guenther et al., 2012) are alsolisted in Table 2.
Global in-situ production from methane oxidation is estimated at about 800 Tgyr−1
(Prather et al., 2001). The ensemble model simulations performed for the year 2000 in5
Shindell et al. (2006) yielded 578 to 999 Tgyr−1 of CO from this source with a multi-model mean of 766 Tgyr−1. Since methane had been prescribed as a uniform mixingratio at the surface for all models, this variability reflects the differences in the OHradical distribution among the models. The chemical production of CO from oxidationof other VOCs is even more uncertain. These emissions are dominated by biogenic10
sources, notably from isoprene, methanol and terpenes. While Prather et al. (2001) re-ported 430 Tgyr−1 of CO, Duncan et al. (2007) calculated a range of 501–542 Tgyr−1
for the period 1988–1997 with the GEOS-Chem model. The global simulations per-formed for Shindell et al. (2006) yielded 547–1198 Tgyr−1 with a multi-model mean of730 Tgyr−1, pointing to large differences among the VOC emission schemes and again15
the OH distribution in the various models.The global annual loss rate of CO by oxidation with OH roughly balances the total
sources and is estimated as 1500–2700 Tgyr−1 (Prather et al., 2001), previous modelstudies derived 2231–2618 Tgyr−1 (Duncan et al., 2007 and references therein). Thisimportant CO sink depends on an accurate calculation of the global OH distribution,20
which itself cannot be measured directly. Instead, the global annual average CO lossterm can be quantified by the methane lifetime, and evaluated using methylchloroformobservations. Prather et al. (2001) estimated a methane lifetime of 9.6 (8.2–11.0) yr,while Shindell et al. (2006) calculated a multimodel mean of 9.7 (±1.7) yr. In a more re-cent study, Prather et al. (2012) derived a present-day methane lifetime of 9.1 (±0.9) yr25
from a systematic exploration of known greenhouse gas budgets and its uncertainties.The only other known loss process of CO besides reaction with OH is dry deposition.
Reported CO dry deposition velocities for vegetated surfaces based on measurementsare relatively low compared with other substances and reach from 0 to 0.004 ms−1
249
ACPD14, 245–301, 2014
On the wintertimelow bias of NorthernHemisphere CO in
global model studies
O. Stein et al.
Title Page
Abstract Introduction
Conclusions References
Tables Figures
J I
J I
Back Close
Full Screen / Esc
Printer-friendly Version
Interactive Discussion
Discussion
Paper
|D
iscussionP
aper|
Discussion
Paper
|D
iscussionP
aper|
with most values below 0.001 ms−1 (King, 1999; Castellanos et al., 2011 and refer-ences therein). Prather et al. (2001) reported the global sink to be as high as 250–640 Tgyr−1. King (1999) confirmed the 190–580 Tgyr−1 range proposed by Conradand Seiler (1985) derived from empirical approaches but with a higher probability forthe lower values. Based on a constant dry deposition velocity of 0.03 cms−1 Sanhueza5
et al. (1998) estimated the global gross uptake to be 115 to 230 Tgyr−1. Bergamaschiet al. (2000) derived annual deposition fluxes of about 300 Tgyr−1 using the same con-stant deposition velocity, but setting the deposition velocity to zero in deserts and areaswith monthly mean temperatures below 0 ◦C.
Little focus has been placed so far on the role of CO dry deposition in global mod-10
elling. Most models apply a dry deposition scheme based on the resistance model ofWesely (1989). Often, the resistance values for O3 and SO2 are scaled to derive pa-rameterizations for CO and other substances (Wesely and Hicks, 2000). Such schemesgive quite variable dry deposition velocities (Stevenson et al., 2006) but there has notbeen a systematic intercomparison among the different models yet except for the study15
of Dentener et al. (2006), where the focus was on wet deposition of NOx and SO2,however. Other models assume that the CO dry deposition losses are to some de-gree counterbalanced by the plant emissions (e.g. Arellano et al., 2004, 2006; Duncanet al., 2007) and therefore neglect both the soil sink and the biogenic emissions. Onlya few models (Emmons et al., 2010; Lamarque et al., 2012) have extended their dry20
deposition scheme with a parameterization for CO and H2 uptake by oxidation fromsoil bacteria and microbes following the work of Sanderson et al. (2003) which itselfwas based on extensive measurements from Yonemura et al. (2000). In this case, COand H2 deposition velocities depend on the soil moisture content of the specific landcover type and on snow cover. Ehhalt and Rohrer (2009) evaluated existing parame-25
terizations of H2 uptake by soils and found that all existing model studies did not fullyaccount for the essential dependencies of dry deposition velocities on snow cover,soil moisture and vegetation type found in the field experiments except the work fromSanderson et al. (2003).
250

ACPD14, 245–301, 2014
On the wintertimelow bias of NorthernHemisphere CO in
global model studies
O. Stein et al.
Title Page
Abstract Introduction
Conclusions References
Tables Figures
J I
J I
Back Close
Full Screen / Esc
Printer-friendly Version
Interactive Discussion
Discussion
Paper
|D
iscussionP
aper|
Discussion
Paper
|D
iscussionP
aper|
As there have been only modestly decreasing trends observed in the concentrationsof CO after the 1990s (Fortems-Cheiney et al., 2011; Worden et al., 2013), the sourcesand sinks of CO must be approximately in balance, except for some seasonal andinterannual variations in the CO budget (Duncan and Logan, 2008). The few estimatesof the atmospheric CO burden of about 360 Tg (Prather et al., 2001) or 345 (248–5
407) Tg calculated as the multimodel mean (spread) in Shindell et al. (2006) are similar,even if they apply to different periods.
For a long time, global models have underestimated carbon monoxide concentra-tions in the NH as is comprehensively shown in the model intercomparison by Shindellet al. (2006). Their multimodel mean from 26 global models exhibited large underesti-10
mates of NH extratropical CO, particularly during winter and spring when compared toNOAA GMD station measurements. Such a bias is still existent in more recent modelstudies like Elguindi et al. (2010), Huijnen et al. (2010), Fisher et al. (2010) and Williamset al. (2013).
With the growing availability of atmospheric CO observation data from surface and15
in-situ observations as well as from satellites, also a number of global model inver-sions have been performed to derive optimized CO sources from these observations(Bergamaschi et al., 2000; Pétron et al., 2002, 2004; Arellano et al., 2004, 2006; Müllerand Stavrakou, 2005; Duncan et al., 2007; Pison et al., 2009; Kopacz et al., 2010;Fortems-Cheiney et al., 2011; Hooghiemstra et al., 2011, 2012; Miyazaki et al., 2012).20
Similar to the forward-model intercomparison from Shindell et al. (2006) most of thesestudies found a significant underestimation of CO sources in their a-priori estimatesand assigned those to missing emissions in the current inventories. The additional to-tal CO sources needed were as high as 392 Tgyr−1 (Fortems-Cheiney et al., 2011),492 Tgyr−1 (Kopacz et al., 2010) and 530 Tgyr−1 (Hooghiemstra et al., 2012, includ-25
ing CO sources from VOC emissions). From both forward and inverse model studies,a major part of the missing source was attributed to NH anthropogenic emissions (e.g.Shindell et al., 2006; Müller and Stavrakou, 2005; Kopacz et al., 2010; Hooghiemstraet al., 2012).
251

ACPD14, 245–301, 2014
On the wintertimelow bias of NorthernHemisphere CO in
global model studies
O. Stein et al.
Title Page
Abstract Introduction
Conclusions References
Tables Figures
J I
J I
Back Close
Full Screen / Esc
Printer-friendly Version
Interactive Discussion
Discussion
Paper
|D
iscussionP
aper|
Discussion
Paper
|D
iscussionP
aper|
In the Monitoring Atmospheric Composition and Climate (MACC) project, the tech-nique of variational data assimilation has been employed to perform a global re-analysis simulation for the years 2003–2010 (Inness et al., 2013). Total and par-tial columns as well as vertically resolved observations of O3, CO, and NO2 frommultiple satellite sensors have been assimilated. In the case of CO, this informa-5
tion consisted of total column densities from the Measurements of Pollution in theTroposphere (MOPITT) v4 product (2003–2012) and from the Infrared AtmosphericSounding Interferometer (IASI, April 2008–2012). For the MACC reanalysis the me-teorological forecast and data assimilation system IFS (Integrated Forecast System,http://www.ecmwf.int/research/ifsdocs) has been coupled to an updated version of the10
global chemistry transport model MOZART-3 (Model for Ozone And Related Tracers,version 3; Kinnison et al., 2007) in order to build the coupled MACC system MACC-IFS-MOZ (Flemming et al., 2009; Stein et al., 2012). Validation with independent ob-servations as shown in Inness et al. (2013) revealed that, in spite of the extensivesatellite data assimilation in the MACC reanalysis tropospheric concentrations of trace15
gases are still not always satisfactorily modelled. Although data assimilation helped toreduce the CO NH wintertime underestimation that was seen in a control run withoutdata assimilation, CO concentrations near the surface in the MACC reanalysis werestill too low. As shown in Fig. 2 the MOZART control simulation without data assimila-tion exhibited negative biases as large as 35 % on average at around 850 hPa when20
compared to MOZAIC profiles at airports north of 30◦ N. This bias could be reducedmost effectively for mid latitudes and for model pressure levels above 950 hPa by theassimilation of CO total columns (Fig. 2). Directly at the surface where the influenceof the surface fluxes is most important, the assimilation of CO satellite total columnshad only a small effect on the modelled concentrations. In contrast, data assimilation25
appears to lead to a positive bias at altitudes above 300 hPa. Apart from the biases andmissing near-surface sensitivity in the satellite retrievals (see also Klonecki et al., 2012)the remaining model bias in the lower troposphere was attributed to missing emissionsin the MACCity inventory.
252

ACPD14, 245–301, 2014
On the wintertimelow bias of NorthernHemisphere CO in
global model studies
O. Stein et al.
Title Page
Abstract Introduction
Conclusions References
Tables Figures
J I
J I
Back Close
Full Screen / Esc
Printer-friendly Version
Interactive Discussion
Discussion
Paper
|D
iscussionP
aper|
Discussion
Paper
|D
iscussionP
aper|
Motivated by the discrepancy that is often found between simulated and observedCO concentrations, particularly near the surface in the NH during winter, we have con-ducted a set of sensitivity simulations to shed further light on the uncertainties in theglobal CO budget. Specifically, this study addresses the following questions:
1. To what extent could direct or precursor CO emissions be underestimated in cur-5
rent global inventories?
2. What is the impact of uncertainties in the dry deposition parameterisation of COon the global burden and surface concentrations of CO?
3. How far are the modelled CO concentrations controlled by global levels and dis-tribution of the OH radical?10
Based on a series of global chemistry transport model simulations we analyze the re-sponse of tropospheric CO concentrations to different sets of trace gas surface bound-ary conditions spanning the uncertainties in our current knowledge about CO emissionand deposition.
The outline of the paper is as follows: in Sect. 2 we will describe the model setup for15
our simulations and present the model sensitivity simulations. Section 3 summarizesthe data sets used for evaluation. The results from the sensitivity studies on surfaceemissions and dry deposition are presented in Sect. 4, followed by our conclusions inSect. 5.
2 Model description20
In the following, the global model setup used for this study will be described. Inspiredby the MACC reanalysis model setup, several MOZART standalone simulations havebeen conducted, which form the backbone of our CO evaluation. The purposes andspecifics of these sensitivity simulations are described in Sect. 2.3.
253

ACPD14, 245–301, 2014
On the wintertimelow bias of NorthernHemisphere CO in
global model studies
O. Stein et al.
Title Page
Abstract Introduction
Conclusions References
Tables Figures
J I
J I
Back Close
Full Screen / Esc
Printer-friendly Version
Interactive Discussion
Discussion
Paper
|D
iscussionP
aper|
Discussion
Paper
|D
iscussionP
aper|
2.1 MOZART
MOZART as used in the MACC project is based on the MOZART-3 model code (Kin-nison et al., 2007) which itself is an extension of the tropospheric chemical transportmodel MOZART2 (Horowitz et al., 2003) to the stratosphere and mesosphere. Somefeatures have been added from MOZART4 (Emmons et al., 2010): most notably a de-5
tailed isoprene degradation scheme as described in Pfister et al. (2008) and a descrip-tion of SOx and the nitrogen cycle. Other improvements have been introduced with themodel version presented in this paper including an update of chemical rate constantsas well as improvements in the photolysis lookup-table approach and the parameteri-zation of polar stratospheric clouds. In the following we will present the model set-up10
used in this study, focussed on the model’s lower boundary conditions.The MOZART global model simulations presented here are driven by meteorological
fields from the ECMWF ERA INTERIM reanalysis (Dee et al., 2011) and accomplisha horizontal resolution of 1.875◦ ×1.875◦ with 60 hybrid vertical levels from the sur-face to the mesosphere (resolution T63L60) and a time step of 15 min. The MOZART15
chemical mechanism consists of 115 species, 71 photolysis reactions, 223 gas phasereactions and 21 heterogeneous reactions. Reaction rates have been updated to JPL-06 (Sander et al., 2006) wherever applicable. Output for tracer concentrations and othermodel fields are available with a temporal resolution of three hours.
2.2 Surface boundary conditions20
A new inventory of global anthropogenic emissions for trace gases and aerosols hasbeen developed in the MACC and CITYZEN projects (Granier et al., 2011), whichprovides up-to-date estimates for use in global model simulations (MACCity). Theseemission estimates are based on the ACCMIP emissions for the year 2000 (Lamarqueet al., 2010). The 2000–2010 MACCity emissions were obtained by using the 200525
and 2010 emissions from the future scenario RCP8.5 (Representative ConcentrationPathway): a linear interpolation was applied to obtain the yearly MACCity emissions.
254

ACPD14, 245–301, 2014
On the wintertimelow bias of NorthernHemisphere CO in
global model studies
O. Stein et al.
Title Page
Abstract Introduction
Conclusions References
Tables Figures
J I
J I
Back Close
Full Screen / Esc
Printer-friendly Version
Interactive Discussion
Discussion
Paper
|D
iscussionP
aper|
Discussion
Paper
|D
iscussionP
aper|
RCP8.5 corresponds to a radiative forcing of 8.5 Wm−2 in the year 2100 given therespective emissions (Moss et al., 2010; van Vuuren et al., 2011; Riahi et al., 2011).A source-specific seasonality developed for the RETRO project (Schultz et al., 2007;http://retro.enes.org/) was applied to the emissions. MACCity also includes ship emis-sions based on Eyring et al. (2010).5
Natural emissions are not included in the MACCity inventory. In all MACC simula-tions biogenic emissions were based on MEGAN-v2 (Guenther et al., 2006) and othernatural emissions were taken from the POET project (Granier et al., 2005) and from theGlobal Emissions Initiative (GEIA). These emissions are meant to be representative forthe year 2000.10
The MACCity anthropogenic emissions and the additional natural emissions areused as reference emissions for our MOZART 2008 sensitivity simulations which willbe presented in the next section and have also been used in the MACC reanalysis andthe reanalysis control simulation without data assimilation.
Biomass burning emissions were generated from a preliminary version of the Global15
Fire Assimilation System (GFAS) developed in the MACC project (GFASv0, Kaiseret al., 2011). This version is very similar to the finally published inventory GFASv1.0(Kaiser et al., 2012), but with somewhat smaller totals (for CO deviations for global andregional totals are less than 0.5 %). All biomass burning emissions are available witha daily resolution and have been injected into MOZART’s lowest model level where they20
are distributed quickly within the mixing layer by the boundary layer diffusion scheme.NOx from lightning in MOZART is dependent on the distribution of convective clouds,
following a parameterization of Price et al. (1997). Aircraft emissions of NOx and COare also included in the model (Horowitz et al., 2003).
MOZART contains a detailed representation of both wet and dry deposition. Monthly25
means of dry deposition velocities for 35 species used in MOZART-3 were pre-calculated offline. For MACC the dry deposition fields originate from a monthly clima-tology derived from a 10 yr nudged simulation with the global chemistry climate modelECHAM5/MOZ (Richter and Schultz, 2011) where an interactive dry deposition scheme
255

ACPD14, 245–301, 2014
On the wintertimelow bias of NorthernHemisphere CO in
global model studies
O. Stein et al.
Title Page
Abstract Introduction
Conclusions References
Tables Figures
J I
J I
Back Close
Full Screen / Esc
Printer-friendly Version
Interactive Discussion
Discussion
Paper
|D
iscussionP
aper|
Discussion
Paper
|D
iscussionP
aper|
was implemented according to the resistance model of Ganzeveld and Lelieveld (1995)and Ganzeveld et al. (1998). For some of our sensitivity simulations the CO dry depo-sition velocity input fields have been exchanged by monthly mean velocity data for theyear 2008 following the parameterization of Sanderson et al. (2003) and calculatedwith the TM5 chemical transport model (Huijnen et al., 2010). This parameterization5
assumes a strong dependence of the dry deposition on the soil moisture content andthe resulting global patterns look strikingly different from those of the original scheme.Figure 3 compares January and July dry deposition fields from both schemes. Depo-sition velocities according to the Ganzeveld scheme are dependent on air temperatureand humidity while the Sanderson scheme generates highest deposition fluxes over10
the tropics during the rainfall season and for some wet regions in the mid latitudes.Wet deposition in MOZART is represented as a first-order loss process, with ad-
ditional in-cloud scavenging and below cloud washout for soluble species (Horowitzet al., 2003). Mixing ratios at the surface are prescribed based on observations forseveral longer-lived species including methane.15
2.3 MOZART sensitivity simulations
For the purpose of analyzing the model sensitivity to CO emission and dry depositionfluxes, we conducted several MOZART simulations for the year 2008 as summarizedin Table 3. Our basic simulation MI is based on the surface boundary condition datapresented in Sect. 2.2, while the other sensitivity simulations differ in the underlying20
emission inventories and dry deposition velocities.The reference simulation MI employs MACCity anthropogenic emissions, together
with MEGANv2 biogenic emissions and GFASv0 biomass burning emissions. Basicallythis configuration was also used for the MACC reanalysis, with some modification forfire emissions (Inness et al., 2013).25
Based on simulation MI, we set up seven sensitivity simulations: NH CO concen-trations in winter and spring are mostly determined by anthropogenic emissions fromtraffic and energy consumption. MI+AN tests for the hypothesis that anthropogenic CO
256
ACPD14, 245–301, 2014
On the wintertimelow bias of NorthernHemisphere CO in
global model studies
O. Stein et al.
Title Page
Abstract Introduction
Conclusions References
Tables Figures
J I
J I
Back Close
Full Screen / Esc
Printer-friendly Version
Interactive Discussion
Discussion
Paper
|D
iscussionP
aper|
Discussion
Paper
|D
iscussionP
aper|
emissions are underestimated significantly. To incorporate also the anthropogenic VOCprecursors, we added simulation MI+VOC with doubled anthropogenic VOC emissions.With respect to natural sources we performed simulation MI+BIO where both biogenicCO and VOC emissions have been doubled. To conclude the sensitivities on the COemission sources, simulation MI+BB used doubled CO biomass burning emissions5
from GFASv1. Although these scenarios look quite extreme, they are useful to illus-trate the various effects of the emission sectors on the global and regional CO con-centrations and their annual variations. Furthermore, uncertainty levels of emissions,particularly for less developed countries and for natural emissions, are still high (e.g.Lamarque et al., 2010).10
Simulation MI-DEP tests for the alternative dry deposition velocity scheme fromSanderson et al. (2003). Finally, our optimized simulation MI-OPT applied a modifiedCO traffic emission scaling for North America and Europe only which exhibits a sea-sonal variation as shown in Table 4. This simulation utilized the same dry depositionparameterization as in MI-DEP.15
All model simulations were analyzed for the year 2008 but started at 1 July 2007to allow for a spinup period. The model was run at T63LR resolution (1.875◦ ×1.895◦)and with 60 vertical levels from the surface up to 0.1 hPa. Tracer initial conditions weretaken from the MACC reanalysis which included assimilation of CO, O3, and NO2 satel-lite information. It should be noted that 2008 was within the three years with lowest at-20
mospheric CO concentrations out of the 13 yr 2000–2012 where satellite observationswere available (Worden et al., 2013).
3 Data sets used for evaluation
3.1 Surface station data
Long term measurements of key atmospheric species from surface observation sites25
around the globe are collected at the World Data Centre for Greenhouse Gases (WD-
257

ACPD14, 245–301, 2014
On the wintertimelow bias of NorthernHemisphere CO in
global model studies
O. Stein et al.
Title Page
Abstract Introduction
Conclusions References
Tables Figures
J I
J I
Back Close
Full Screen / Esc
Printer-friendly Version
Interactive Discussion
Discussion
Paper
|D
iscussionP
aper|
Discussion
Paper
|D
iscussionP
aper|
CGG) operated by the WMO GAW programme (http://ds.data.jma.go.jp/gmd/wdcgg/).In total we used monthly means of CO concentrations measured from 67 surface sta-tions which provided data for all months in 2008, their positions on the globe are shownin Fig. 4 (red diamonds). The observation sites are operated by NOAA/ESRL (USA),CSIRO (Australia), Environment Canada, JMA (Japan), CHMI (Czech Republic), UBA5
(Germany), EMPA (Switzerland), RIVM (Netherlands), and SAWS (South Africa). Wediscarded mountain stations and stations which did not deliver monthly means for allmonths in 2008. Data was averaged over continental-scale areas to minimize the in-fluence from erratic or locally determined measurements. For evaluation we built area-averaged monthly means from all NH and SH stations as well as from those inside the10
regions defined in Fig. 4 (blue boxes).
3.2 MOZAIC profiles
The MOZAIC (Measurements of Ozone and water vapor by Airbus In-service airCraft)program collects ozone, CO, odd nitrogen (NOy) and water vapor data, using auto-matic equipment installed on-board several European long-range passenger airliners15
flying regularly all over the world (Marenco et al., 1998). Here we use CO data fromvertical tropospheric transects taken in the vicinity of airports during ascent and de-scent. For more details of the data processing see Elguindi et al. (2010). In 2008, onlythree aircraft were operating with the MOZAIC instrumentation and therefore only a lim-ited number of airports were visited regularly (13 airports with a total of 935 profiles).20
For the evaluation of the 2008 model simulations, we chose tropospheric data fromthe European airports of Frankfurt (Germany), London (UK), where 300 (80) profileswere available as well as an area average composed of the airports of Atlanta, Dal-las, Philadelphia, Portland (OR) in the United States and Toronto and Vancouver inCanada with 219 profiles altogether. This area average is meant to be representative25
for the North American Area limited by the blue box in Fig. 4. There were no data overEast Asia in 2008. We marked all airports used for evaluation with turquoise triangles
258

ACPD14, 245–301, 2014
On the wintertimelow bias of NorthernHemisphere CO in
global model studies
O. Stein et al.
Title Page
Abstract Introduction
Conclusions References
Tables Figures
J I
J I
Back Close
Full Screen / Esc
Printer-friendly Version
Interactive Discussion
Discussion
Paper
|D
iscussionP
aper|
Discussion
Paper
|D
iscussionP
aper|
in Fig. 4. The model results were interpolated to the times and locations of the MOZAICobservations, afterwards the single profiles were combined to monthly means.
3.3 MOPITT atmospheric columns
The MOPITT (Measurement Of Pollution In The Troposphere) instrument is flying onboard the NASA Terra satellite and has been operational since March 2000 (Drum-5
mond and Mand, 1996; Deeter et al., 2004). It measures upwelling radiation in thethermal infrared spectral range using gas-filter correlation radiometry. At nadir view,MOPITT offers a horizontal resolution of 22km×22 km and allows a global cover-age in two to three days. MOPITT data used in this study correspond to the daytimeCO total columns from the level 2 version 5 product. MOPITT version 5 offers CO10
data retrieved in both near-infrared (NIR) and thermal-infrared (TIR) radiances (Deeteret al., 2013). The MOPITT products are available through the following web server:http://www2.acd.ucar.edu/mopitt/products. For evaluation we use the multispectral COproduct which is based on both NIR and TIR radiances. Exploiting TIR and NIR radi-ances together increases the sensitivity to CO in the lowermost troposphere (Worden15
et al., 2010; Deeter et al., 2011, 2012). The observations are area-averaged monthlymeans from the regions defined in Fig. 4 (blue boxes). The modelled CO total columnswere calculated by applying the MOPITT averaging kernels. Details about the methodof calculation are given in Deeter et al. (2004) and Rodgers (2000).
3.4 IASI atmospheric columns20
IASI (Infrared Atmospheric Sounding Interferometer) is a nadir looking remote sensor,launched in 2006 on the polar orbiting MetOp-A satellite. IASI has a twice daily globalcoverage, with 4 pixels of 12 km diameter (at nadir) and a 2200 km swath width. Itsspectral resolution is 0.5 cm−1 (apodized) with continuous spectral coverage from 645to 2760 cm−1 that allows column and profile retrievals of several different trace gases25
(Clerbaux et al., 2009). For carbon monoxide, profiles are retrieved using an optimal
259
ACPD14, 245–301, 2014
On the wintertimelow bias of NorthernHemisphere CO in
global model studies
O. Stein et al.
Title Page
Abstract Introduction
Conclusions References
Tables Figures
J I
J I
Back Close
Full Screen / Esc
Printer-friendly Version
Interactive Discussion
Discussion
Paper
|D
iscussionP
aper|
Discussion
Paper
|D
iscussionP
aper|
estimation approach, implemented in the Fast Optimal Retrievals on Layers for IASI(FORLI) software (Hurtmans et al., 2012). The spectra are processed in near real timeand the CO profiles are distributed with error covariance, averaging kernels and qualityflags information. The IASI CO product was validated against ground based observa-tions (Kerzenmacher et al., 2012), aircraft data (Pommier et al., 2010; Klonecki et al.,5
2012) and satellite measurements (George et al., 2009). The FORLI-CO products areavailable through the Ether French atmospheric database website: www.pole-ether.fr.The IASI column values used here are daytime data that were processed with version20100815 of the FORLI-CO retrieval algorithm. For this study area-averaged monthlymeans from the regions defined in Fig. 4 (blue boxes) are used.10
4 Results
4.1 MOZART sensitivity simulations
In the following, we use MOZART sensitivity simulations to identify the potential role ofthe various CO surface fluxes for the underestimation of the near-surface concentra-tions. First we compare our basic simulation (MI), using MACCity anthropogenic and15
natural emissions, to observations gathered from the World Data Center for Green-house gases (WDCGG) database. Figure 5 shows monthly means of surface stationCO mixing ratios and of near-surface model concentrations interpolated to the stationlocation for 67 stations ordered by latitude. Note that all mountain stations as well asthose stations which did not deliver monthly means for all months in 2008 have been20
excluded.The station data exhibits the highest values and also the largest variability at north-
ern mid latitudes (30–60◦ N) during wintertime with mean January concentrations ofmore than 300 ppb for three stations, namely Hegyhatsal (Hungary), Payerne (Switzer-land) and Black Sea (Romania). In addition, Payerne exceeded this threshold in Febru-25
ary 2008 and the station Tae-ahn (South Korea) reached monthly mean concentrations
260

ACPD14, 245–301, 2014
On the wintertimelow bias of NorthernHemisphere CO in
global model studies
O. Stein et al.
Title Page
Abstract Introduction
Conclusions References
Tables Figures
J I
J I
Back Close
Full Screen / Esc
Printer-friendly Version
Interactive Discussion
Discussion
Paper
|D
iscussionP
aper|
Discussion
Paper
|D
iscussionP
aper|
of more than 300 ppb for March to May 2008 (not shown). NH concentrations are gen-erally higher in winter (and spring) than in summer. The station observations in theSouthern Hemisphere (SH) show a relatively uniform distribution both in winter andsummer with background concentrations of about 40–70 ppb. Modelled NH CO mixingratios are mostly lower than the observations, particularly during wintertime. In January,5
the model underestimates the concentrations for the arctic stations by about 50 ppb. Inthe SH model and observations match better, with an overestimation of up to 10 ppbbeing typically seen. The global distributions of atmospheric CO can be derived withhigh spatial resolution from the satellite total column observations. As shown in Fig. 6,the MOPITT and IASI products agree well for most regions. MOPITT total columns are10
somewhat higher than IASI for several NH regions in January, but IASI attains a bet-ter spatial coverage. The MI simulation is able to reproduce the general features andlevels of the satellite CO distribution, but calculates higher CO columns over India andslightly lower columns for other polluted regions like Europe, North America and EastAsia. The North African biomass burning regions in January are less pronounced than15
for the satellites, while there seems to be an overestimation from the model over SHtropical West Africa in July.
Following the findings from the MACC reanalysis and from the previous global stud-ies, the negative model bias in boreal winter and spring CO concentrations could beexplained by either missing sources from surface emissions or by an overestimation20
of the surface dry deposition sink. Thus we expanded our basic model simulation forthe year 2008 with a suite of sensitivity simulations covering the potential sources ofuncertainty in the surface fluxes (emissions and deposition) as presented in Sect. 2.4.Impacts from uncertainties in the modelling of OH on the CO budget will be discussedsubsequently. Modelled tropospheric CO mixing ratios and total column densities are25
evaluated with the observational data introduced in Sect. 3.
261

ACPD14, 245–301, 2014
On the wintertimelow bias of NorthernHemisphere CO in
global model studies
O. Stein et al.
Title Page
Abstract Introduction
Conclusions References
Tables Figures
J I
J I
Back Close
Full Screen / Esc
Printer-friendly Version
Interactive Discussion
Discussion
Paper
|D
iscussionP
aper|
Discussion
Paper
|D
iscussionP
aper|
4.1.1 Emissions
First, we compare monthly means of near-surface model concentrations with monthlymean surface station data from the WDCGG database averaged over the Northern andSouthern Hemisphere as well as for the regions Europe, North America and East Asia.Model data was interpolated to the station location. In Fig. 7 the model bias is shown for5
the base simulation MI (MACCity emissions) and for the sensitivity simulations MI+AN,MI+BIO, and MI+BB.
The simulation with MACCity emissions (MI) underestimates the observed surfaceconcentrations in the NH in all seasons except summer, with low biases exceeding20 ppb from December to April and exceeding 40 ppb in January. The largest under-10
estimation of about 75 ppb is found over Europe. During boreal summer, the modelledCO concentrations match on average the observations, with a slight underestimationfor Europe and overestimation for North America. NH summertime concentrations aremore influenced by biogenic and biomass burning emissions, and the photochemicalsink via reaction with the OH radical plays a larger role.15
East Asian observed concentrations agree relatively well with the MI simulation forthe whole year, at least for the four surface stations which could be taken into accounthere. This relative compliance is probably due to the recently updated regional emis-sion information and to the better emission predictions for China in the MACCity inven-tory (Riahi et al., 2011). For the sake of completeness we also report here the good20
agreement between simulated and observed SH concentrations, only a small positivemodel bias of 5 to 10 ppb is found all year round.
Similarly to the surface concentrations, the modelled CO total columns are com-pared with the observed total columns from MOPITTv5 and IASI (Fig. 8). The satelliteobservations are more representative for the free troposphere and accomplish a sub-25
stantial coverage over the regions of interest. Due to the differences in spatial samplingbetween the two instruments, and the different methods used to obtain the CO to-tal column product, a significant spread between the two satellite products of up to
262

ACPD14, 245–301, 2014
On the wintertimelow bias of NorthernHemisphere CO in
global model studies
O. Stein et al.
Title Page
Abstract Introduction
Conclusions References
Tables Figures
J I
J I
Back Close
Full Screen / Esc
Printer-friendly Version
Interactive Discussion
Discussion
Paper
|D
iscussionP
aper|
Discussion
Paper
|D
iscussionP
aper|
9 % averaged over the NH exists (see also Worden et al., 2013). Over the NH, IASIobserved lower total columns than MOPITT from October to March and higher totalcolumns in July/August. The findings from the surface station evaluation of the MI sim-ulation generally hold true also for the total columns with a few differences: MI alwaysunderestimated NH MOPITT total columns as well as the IASI columns from January5
to October. Largest biases occur for MOPITT−MI in March with 18 % (NH), 24 % (Eu-rope) and 22 % (North America).
As expected, in the extreme sensitivity simulation with doubled anthropogenic emis-sions (MI+AN, see Figs. 7 and 8), the CO concentrations overestimated the observedvalues in all regions. However, deviations from the observations are smaller than in10
the MI simulation from January to March over the NH which can mostly be attributedto the North American and European regions. The overestimation is less pronouncedduring the summer months, when the CO loss due to reaction with OH gains moreimportance.
The simulation MI+BIO (doubled biogenic CO and VOC emissions) enhanced the15
modelled surface CO concentrations by 20 to 40 ppb for all regions. Since the biogenicemissions mainly occur over the tropics and the NH landmasses with a summer max-imum, we find that in summer, the emissions are overestimated over the whole NH.At higher altitudes, this summer overestimation seems to last until winter 2008/2009(Fig. 8). SH concentrations are biased high during all months for both surface concen-20
trations and total columns. The MI+BB simulation (doubled CO biomass burning emis-sions) leads to overestimation of the peak surface concentrations during NH springand summer, as can be noticed in the wildfire-influenced regions of North Americaand East Asia. When compared with IASI observations, the MI+BB simulation perfomsbetter than the other runs. This is as expected, since IASI is more sensitive to tran-25
sient biomass burning events, which are also included in our simulation (Worden et al.,2013). Both simulations with enhanced biogenic or wildfire emissions are not able toimprove the negative bias seen by the models in NH winter without introducing sig-nificant overestimations during boreal summer and over the SH. This constrains the
263
ACPD14, 245–301, 2014
On the wintertimelow bias of NorthernHemisphere CO in
global model studies
O. Stein et al.
Title Page
Abstract Introduction
Conclusions References
Tables Figures
J I
J I
Back Close
Full Screen / Esc
Printer-friendly Version
Interactive Discussion
Discussion
Paper
|D
iscussionP
aper|
Discussion
Paper
|D
iscussionP
aper|
contribution of biases in biogenic or biomass burning emissions to the modelled NHwintertime low bias in CO.
To account for the uncertainties in the emissions of anthropogenic CO precursors,we also ran MOZART using MACCity emissions together with doubled VOC anthro-pogenic emissions (MI+VOC). These increased emissions are able to enhance winter-5
time and spring surface CO concentrations by 5 to 15 ppb (Fig. 9, grey lines) and couldtherefore add a small portion to the missing NH CO concentrations with the greatestimprovement seen in spring.
4.1.2 Dry deposition
Surface layer mixing ratios from the sensitivity simulation MI-DEP, which used the pa-10
rameterization by Sanderson et al. (2003) for deposition velocities, together with theMACCity emissions, are displayed in Fig. 9. When compared with MI, the reduceddeposition fluxes over the NH landmasses result in higher concentrations of around10 ppb in summer and 20 ppb in winter when OH concentrations are low. Over Europe,where the differences between the two schemes are quite large, wintertime concen-15
trations are higher by 30 ppb whereas values for May to September match the ob-servations very well. Concentrations over East Asia are moderately increased (lessthan 20 ppb all-year-round), while over North America the summer and autumn valuesare biased high compared with the observations. Over the SH, the simulation MI-DEPis able to decrease the tropospheric concentrations of CO by up to 5 ppb (August–20
October) which may be due to the increased deposition fluxes over Africa and SouthAmerica (see Fig. 9). Overall the use of the parameterization by Sanderson et al. (2003)improved the model results significantly but alone is not able fill the gap to boreal win-tertime CO observations, particularly over Europe.
264

ACPD14, 245–301, 2014
On the wintertimelow bias of NorthernHemisphere CO in
global model studies
O. Stein et al.
Title Page
Abstract Introduction
Conclusions References
Tables Figures
J I
J I
Back Close
Full Screen / Esc
Printer-friendly Version
Interactive Discussion
Discussion
Paper
|D
iscussionP
aper|
Discussion
Paper
|D
iscussionP
aper|
4.1.3 Optimized approach
As indicated in Sect. 2, the MACCity inventory is based on the ACCMIP emissions forthe year 2000. Lamarque et al. (2010) pointed out that for USA, Europe, and East Asiapublished regional inventories had been given preference, notably EPA data for USA,EMEP data for Europe and REAS data for East Asia. Based on a comparison between5
a fuel-based and a mileage-based emission inventory for one US city, Parrish (2006)concluded that the reason for a high bias in the CO to NOx ratios in the US NationalEmission Inventory (NEI) was most likely due to an overestimate of the CO emissionsrather than an underestimate in the NOx emissions and suggested an overestimateof CO emissions (by a factor of 2) in the EPA-2004 data, which also holds true for10
the more recent EPA estimates up to 2008 (Miller et al., 2008; Lamarque et al., 2010;Granier et al., 2011). EPA also reported on air pollution trends of US cities between1990 and 2008 and found maximal decadal decreases in CO pollution for US cities of60 to 80 % for 1990 to 2008 (Riahi et al., 2011). Consequently, in the RCP8.5 scenarioan exposure-driven spatial algorithm for the downscaling of the regional emission pro-15
jection has been employed leading to the highest emission reduction of up to 80 % perdecade in those grid cells with the highest exposure for regions where emissions arereduced due to air pollution measures, e.g. USA and Europe. For regions with increas-ing emissions, (e.g. in Asia) emissions increase proportionally to the acceleration of theeconomic activity (Riahi et al., 2011). Road traffic provides a major part of the anthro-20
pogenic CO emissions in the industrialized countries. Pouliot et al. (2012) comparedregional emission inventories for Europe and North America for 2005 and reported85 % of North American anthropogenic CO emissions and 43 % of European emis-sions to origin from mobile sources. In Fig. 10 the development of CO anthropogenicemissions 2000–2050 in the RCP8.5 scenario is shown. Although RCP8.5, which is25
used in MACCity, is a scenario with relatively high greenhouse gas emissions andglobal warming potential, the CO anthropogenic emissions decrease slowly in the firstdecade 2000–2010, mostly driven by strong emission reductions in the OECD coun-
265

ACPD14, 245–301, 2014
On the wintertimelow bias of NorthernHemisphere CO in
global model studies
O. Stein et al.
Title Page
Abstract Introduction
Conclusions References
Tables Figures
J I
J I
Back Close
Full Screen / Esc
Printer-friendly Version
Interactive Discussion
Discussion
Paper
|D
iscussionP
aper|
Discussion
Paper
|D
iscussionP
aper|
tries. Traffic emissions, which build the majority of anthropogenic CO emissions fromthese countries decrease by 46 % (from 119 Tgyr−1 in 2000 to 44 Tgyr−1 in 2010). ForAsia, total emissions are estimated to increase by 10 % until 2020 with largest emissiongrowth rate from industrial emissions and other emission sectors stagnating.
Our optimized simulation MI-OPT tests for the hypothesis that CO emissions from5
cars are not considered adequately in the MACCity estimate: estimates of automobileemissions are based on defined driving cycles which are lacking of typical short trips,when much more CO is emitted under cold engine conditions (Parrish, 2006; Kopaczet al., 2010; Klemp et al., 2012). This would effect a significant underestimation of trafficCO emissions in the emission inventory, which is potentially amplified by an unrealistic10
emission reduction 2000–2010 in MACCity. We note, that our simulations don’t allowthe attribution of the missing CO source to the traffic sector, although (as indicatedabove) there are reasons to believe that this sector at least contributes to the prob-lem. In reality it may well be a combination of underestimates from various sectors,many of which are poorly constrained. One such sector, which is particularly relevant15
during winter, is household wood burning (H. Denier van der Gon, personal communi-cation, 2012). Clearly, a more systematic assessment of emission uncertainties wouldbe helpful.
For the simulation MI-OPT we applied a refined scaling to the CO road traffic emis-sions with monthly scaling factors for Europe and North America only as described in20
Table 4. Global total added emissions from this simulation are as low as 19 Tgyr−1,compared to 586 Tgyr−1 from simulation MI+AN (Table 3). Applying the modified scal-ing factors enhances wintertime CO emissions only for these regions and also ac-counts for realistic CO concentrations from long-range transport. Simultaneously, MI-OPT takes into account the improved dry deposition parameterization by Sanderson25
et al. (2003) as in MI-DEP.The simulation MI-OPT is compared with surface observation as shown in Fig. 9.
The simulation is able to effectively shift wintertime CO concentrations to higher valuesfor Europe and North America without significantly increasing the CO concentrations
266
ACPD14, 245–301, 2014
On the wintertimelow bias of NorthernHemisphere CO in
global model studies
O. Stein et al.
Title Page
Abstract Introduction
Conclusions References
Tables Figures
J I
J I
Back Close
Full Screen / Esc
Printer-friendly Version
Interactive Discussion
Discussion
Paper
|D
iscussionP
aper|
Discussion
Paper
|D
iscussionP
aper|
in East Asia. Applying the scaling factors given in Table 4 results in an almost perfectmatch to the GAW station observations for Europe and on the NH average. The sameholds true over North America for the months December to May. Where concentrationswith the MI emissions were already high biased, as for North America in summer orfor East Asia in spring and autumn, these overestimations can be attributed to natu-5
ral emissions. This can be deduced from the MI+BB and MI+BIO simulations, whereconcentrations for these regions are enhanced similarly.
The comparison of total CO columns from MI-OPT to MOPITT and IASI satelliteobservations is shown in Fig. 11. NH mean columns are enhanced by 6–9 % withrespect to the MI simulation, but not enough to catch up with the satellite observations,10
except for October to December 2008. Similar changes can be seen for the regionalaverages, with largest increase over Europe (8–12 %) and somewhat lower differencesfor North America (7–10 %) and East Asia (7–9 %). In summer and autumn, most ofthe enhancement is due to the changes in the dry deposition parameterization, while inwinter and spring the increased emissions dominate the optimization (not shown). CO15
concentrations over the SH remain mostly unchanged with respect to the simulationMI.
The evaluation results from surface stations and total column observations are com-plemented by the comparison with MOZAIC profiles over the airports of Frankfurt (Ger-many) and London (UK) and a composite of 6 airports over North America (Fig. 12). In20
January 2008 simulation MI is biased low with maximal differences in the lowest modellevel (ca. 100 ppb over Frankfurt, 55 ppb over London and 80 ppb for North Americanairports). The model underestimates CO throughout the tropopause with smaller bi-ases as the upper troposphere is approached. In July, MI shows a negative bias of20–40 ppb throughout the lower troposphere. CO concentrations from the simulation25
MI-OPT are generally higher than those from MI, thus reducing the bias with respect tothe observations. In January the negative bias is reduced to 5–30 ppb near the surface,but may still reach up to 40 ppb in some parts of the free troposphere, whereas in July,MI-OPT concentrations are consistently 10–15 ppb higher than those from MI.
267

ACPD14, 245–301, 2014
On the wintertimelow bias of NorthernHemisphere CO in
global model studies
O. Stein et al.
Title Page
Abstract Introduction
Conclusions References
Tables Figures
J I
J I
Back Close
Full Screen / Esc
Printer-friendly Version
Interactive Discussion
Discussion
Paper
|D
iscussionP
aper|
Discussion
Paper
|D
iscussionP
aper|
Our optimization approach illustrates that regionally missing anthropogenic emis-sions together with modifications in the dry deposition parameterization could explainthe observed biases with respect to American and European GAW station observa-tions. Total CO column densities and tropospheric profiles of CO concentrations werealso improved. The optimization approach goes some way to addressing the under-5
estimation of the CO concentrations evident at the MOZAIC airports. The remainingbiases point to some model deficiencies in vertical exchange or the OH distributionand may also be due to the coarse resolution of the model being unable to representstrong local sources of pollution at the airport locations. The strong seasonality in theemission scaling factors used for MI-OPT and its regional differences (Table 4) indi-10
cate that a more detailed approach is needed to account for the seasonality in globalemission inventories, particularly for emissions of anthropogenic origin.
How the modification of wintertime NH CO emissions affects other trace gases isshown for simulation MI-OPT in Fig. 13. First we show the differences in the CO distri-butions compared with the simulation MI-DEP (top panel): European and North Amer-15
ican surface concentrations are enhanced by up to 170 ppb in December. Long-rangetransport of the additional emissions is confined to the NH with little effect on Asia andthe Pacific. In July, increases are always lower than 5 ppb and therefore not shown.
The regionally scaled emissions have only a small impact on the simulated near-surface ozone concentrations (Fig. 13, middle panel) and on the free-tropospheric OH20
fields (lower panel). Surface ozone increases almost globally, but nowhere by morethan 0.5 ppb. This change is smaller than the model bias usually found when MACCresults are evaluated with ozone observations (Inness et al., 2013). The OH radicalmixing ratios are evaluated at 700 hPa to represent an average tropospheric level anddistribution. As expected, OH is reduced in the simulation with scaled MACCity emis-25
sions due to the increased sink term by CO oxidation. Differences are up to 3 % inthe mid latitudes during winter, where OH concentrations are very small (see averagelatitudinal profiles on the bottom panel of Fig. 13). OH concentrations in the tropics and
268

ACPD14, 245–301, 2014
On the wintertimelow bias of NorthernHemisphere CO in
global model studies
O. Stein et al.
Title Page
Abstract Introduction
Conclusions References
Tables Figures
J I
J I
Back Close
Full Screen / Esc
Printer-friendly Version
Interactive Discussion
Discussion
Paper
|D
iscussionP
aper|
Discussion
Paper
|D
iscussionP
aper|
in the summer hemisphere are generally affected by less than 1 %, suggesting that theCO+OH loss term is marginally changed by modifying the emissions.
We assess the mean OH concentration in the MOZART model, as this would influ-ence the CO budget both for the source term via the chemical conversion of hydrocar-bons and for the chemical loss term. OH in the model cannot be evaluated directly, as5
atmospheric measurements are lacking. A widely used measure for the integrated tro-pospheric OH concentrations is the methane lifetime τ[CH4]. In this study the methanelifetime is 9.7 yr for the MI simulation and 9.8 yr for our simulation MI-OPT. These val-ues are both very close to τ[CH4] = 9.1(±0.9) yr derived by Prather et al. (2012) and tothe mean τ[CH4] calculated from the models in Shindell et al. (2006) (τ[CH4] = 9.72 yr10
(6.91–12.38)), indicating that our mean MOZART OH concentration is adequately sim-ulated and the OH sink is not greatly overestimated. As shown here, also the influenceof the modified surface fluxes on OH is small. From the evaluation with MOPITT andIASI total columns and MOZAIC profiles however, a prevalent underestimation of freetropospheric model CO concentrations could be deduced. If and how such an under-15
estimation is connected to unrealistic OH distributions or vertical exchange processesin the model, cannot be addressed further without additional observational constraints.Modifications to the chemistry mechanism, which are able to affect global OH and itsspatial distribution, such as proposed by Mao et al. (2013), could also result in higherCO concentrations. However, this is not yet well established, as there are large un-20
certainties related to the magnitude of proposed reaction pathways. Therefore thesechanges are not considered here.
Finally, the global CO burden calculated from our basic simulation MI is 351 Tg,which is well in the range of reported values in the literature. This was increased to369 Tg for MI-OPT. 14 Tg out of this 18 Tg increase can be appointed to the reduced25
dry deposition fluxes in the Sanderson scheme. Also the interannual variability of theCO burden has been calculated with a similar range (Duncan and Logan, 2008).
269
ACPD14, 245–301, 2014
On the wintertimelow bias of NorthernHemisphere CO in
global model studies
O. Stein et al.
Title Page
Abstract Introduction
Conclusions References
Tables Figures
J I
J I
Back Close
Full Screen / Esc
Printer-friendly Version
Interactive Discussion
Discussion
Paper
|D
iscussionP
aper|
Discussion
Paper
|D
iscussionP
aper|
5 Conclusions
Despite the developments in the global modelling of chemistry and of the parameteri-zation of the physical processes, CO concentrations continue to be underestimated inNH winter by most state-of-the-art model simulations. Even with extensive data assim-ilation of CO satellite retrievals, as it is applied in the MACC forecasts and reanalysis,5
a significant low CO bias in the lower troposphere remains. Such a bias can in prin-ciple originate from either an underestimation of CO sources or an overestimation ofits sinks. We addressed both the role of surface sources and sinks with a series ofMOZART model sensitivity studies for the year 2008 and compared our results to ob-servational data from ground-based stations, satellite observations, and tropospheric10
profiles from MOZAIC.Our basic simulation employed the global emission inventories MACCity, GFASv1
and MEGANv2, of which MACCity and GFASv1 have been developed in the MACCproject. Surface CO concentrations as measured by GAW stations averaged over theNH were underestimated by more than 20 ppb from December to April with a maximal15
bias of 40 ppb in January from this simulation. The bias was strongest for the Euro-pean region (75 ppb in January) but also apparent over North America, suggestingthat wintertime emissions for these regions are missing in the inventories. Modelledconcentrations over East Asia were in better agreement with the surface observations,probably reflecting the efforts which were made to update the CO emissions to the20
recent economic developments, namely in China. Negative biases were also foundfor total CO columns when evaluated against MOPITT and IASI observational data.Our comparison showed significantly lower NH modelled columns for almost the wholeyear. MOPITT and IASI products themselves differed by up to 9 % averaged over theNH so a quantification of the total column model bias remains uncertain. As pointed25
out by Worden et al. (2013) the spread in CO column values across the satellite instru-ments is mainly due to spatial sampling differences. The modelled CO concentrationswere additionally evaluated with MOZAIC profiles over several airports in Europe and
270

ACPD14, 245–301, 2014
On the wintertimelow bias of NorthernHemisphere CO in
global model studies
O. Stein et al.
Title Page
Abstract Introduction
Conclusions References
Tables Figures
J I
J I
Back Close
Full Screen / Esc
Printer-friendly Version
Interactive Discussion
Discussion
Paper
|D
iscussionP
aper|
Discussion
Paper
|D
iscussionP
aper|
North America. Tropospheric CO concentrations were mostly underestimated from themodel with largest biases for NH winter near the surface.
Four rough sensitivity simulations, defined by doubling one of the original CO sourceshelped us to identify major sectors which could contribute to the CO underestimation.Doubling the global anthropogenic CO emissions increased the concentrations all year5
round but predominately during NH wintertime. Nevertheless, concentrations simulatedwith this extreme scenario were always too high when compared to the surface obser-vations and also for regions where the bias of the original simulation was already small.A sensitivity study accounting for missing anthropogenic VOC emissions showed thatalthough these indirect emissions contribute only about 8 % to the CO sources, their10
relative impact is higher in winter when biogenic emissions are low. Doubling theseemissions increased NH wintertime near-surface concentrations by 5 to 15 ppb on theglobal and regional scale, hence biases in anthropogenic VOC emissions can accountfor a part of the missing model CO. A simulation with doubled biogenic emissions, bothfrom CO and the VOCs, led to unrealistically high concentrations during boreal summer15
and early autumn while SH tropospheric CO was greatly overestimated. Similarly, dou-bling the direct CO emissions from biomass burning led to CO overestimation peaksduring the major NH wildfire seasons in late spring and summer, hence also excludingbiomass burning as the major contributor to the wintertime NH CO bias.
The influence of the dry deposition sink on the global CO budget has been ne-20
glected so far by most of the studies on model inter-comparison and source inver-sion. Although this sink is small compared with the photochemical sink on global, an-nual average, it becomes more important over the continents and during the wintermonths when OH concentrations are low. A sensitivity simulation with a modified COdeposition scheme following Sanderson et al. (2003) reduced the global CO sink by25
68 Tgyr−1 with strongest reductions over Europe in wintertime. The resulting NH sur-face CO concentrations were enhanced by 20–30 ppb in winter and by 10–15 ppb insummer with largest increase over wintertime Europe. Nevertheless, the reduced drydeposition alone was not able to explain the total CO bias.
271

ACPD14, 245–301, 2014
On the wintertimelow bias of NorthernHemisphere CO in
global model studies
O. Stein et al.
Title Page
Abstract Introduction
Conclusions References
Tables Figures
J I
J I
Back Close
Full Screen / Esc
Printer-friendly Version
Interactive Discussion
Discussion
Paper
|D
iscussionP
aper|
Discussion
Paper
|D
iscussionP
aper|
A simulation which optimally reflects the surface observations was constructedthrough application of the modified dry deposition together with a seasonally dependingscaling of CO traffic emissions for Europe and North America only. With this simulationwe tested for a possible underestimation of CO emissions from the traffic sector in theindustrialized countries, which could originate from vehicle engines under cold start5
conditions. While the resulting surface concentrations were very close to the globalstation observations, also a considerable improvement was reached in comparison tosatellite observations and MOZAIC profiles.
In conclusion, our simulations have shown that the mismatch between observed andmodelled concentrations of CO during NH wintertime, can be explained by a combina-10
tion of errors in the dry deposition parameterisation and the following limitations in theemission inventories: (i) missing anthropogenic CO emissions from traffic or other com-bustion processes, (ii) missing anthropogenic VOC emissions, (iii) a poorly establishedseasonality in the emissions, (iv) a too optimistic emission reduction in the RCP8.5scenario underlying the MACCity inventory. There is no indication that our results were15
greatly influenced by unrealistic global OH levels, but modelled CO concentrations de-pend on the modelled OH distributions, which are themselves subject to limitations inthe chemical mechanisms and the lack of knowledge on seasonality and global pat-terns of OH.
Taking into account that other recently developed global and regional anthropogenic20
emission inventories (EDGARv4.2, EMEP, EPA) estimate similar low CO emissionsfor Europe and North America it remains necessary to question the inventory buildingprocess, particularly for the important and highly uncertain traffic sector. Furthermore,research efforts are also needed to improve the estimates for the seasonal variabilityof anthropogenic emissions. Finally, in future model studies on the inversion of atmo-25
spheric CO observations the dry deposition parameterization and its global sink termshould be more explicitly documented.
Acknowledgements. This study was funded by the European Commission under the frame-work programme 7 (contract number 218793). Data from the emission inventories used
272

ACPD14, 245–301, 2014
On the wintertimelow bias of NorthernHemisphere CO in
global model studies
O. Stein et al.
Title Page
Abstract Introduction
Conclusions References
Tables Figures
J I
J I
Back Close
Full Screen / Esc
Printer-friendly Version
Interactive Discussion
Discussion
Paper
|D
iscussionP
aper|
Discussion
Paper
|D
iscussionP
aper|
in this study are freely available on the GEIA emission data portal http://eccad.sedoo.fr/.IASI has been developed and built under the responsibility of the Centre National d’EtudesSpatiales (CNES, France). We are grateful to Pierre Coheur and Daniel Hurtmans (ULB) fordeveloping the FORLI-CO IASI processing code and to Juliette Hadji-Lazaro (LATMOS) forestablishing the IASI MACC near real time processing chain. The authors acknowledge the5
strong support of the European Commission, Airbus, and the airlines (Lufthansa, Air-France,Austrian, Air Namibia, Cathay Pacific and China Airlines), who carry the MOZAIC or IAGOSequipment and have performed the maintenance since 1994. MOZAIC is presently funded byINSU-CNRS (France), Météo-France, CNES, Université Paul Sabatier (Toulouse, France) andResearch Center Jülich (FZJ, Jülich, Germany). IAGOS has been, and is additionally, funded10
by the EU projects IAGOS-DS and IAGOS-ERI. The MOZAIC-IAGOS data are available viaCNES/CNRS-INSU Ether web site http://www.pole-ether.fr. ECMWF and ForschungszentrumJülich are acknowledged for providing supercomputer time, and we thank Claire Granier andHugo Denier van der Gon for helpful discussions.
15
The service charges for this open access publicationhave been covered by a Research Centre of theHelmholtz Association.
References
Amann, M., Bertok, I., Cofala, J., Gyarfas, F., Heyes, C., Klimont, Z., Schöpp, W., and Wini-20
warter, W.: Baseline Scenarios for the Clean Air for Europe (CAFE) Programme, ContractNo B4-3040/2002/340248/MAR/C1, 2005.
Arellano Jr., A. F., Kasibhatla, P. S., Giglio, L., van der Werf, G. R., and Randerson, J. T.:Correction to “Top-down estimates of global CO sources using MOPITT measurements”,Geophys. Res. Lett., 31, L12108, doi:10.1029/2004GL020311, 2004.25
Arellano Jr., A. F., Kasibhatla, P.-S., Giglio, L., van der Werf, G. R., Randerson, J. T., andCollatz, G. J.: Time-dependent inversion estimates of global biomass-burning CO emissionsusing Measurement of Pollution in the Troposphere (MOPITT) measurements, J. Geophys.Res., 111, D09303, doi:10.1029/2005JD006613, 2006.
273

ACPD14, 245–301, 2014
On the wintertimelow bias of NorthernHemisphere CO in
global model studies
O. Stein et al.
Title Page
Abstract Introduction
Conclusions References
Tables Figures
J I
J I
Back Close
Full Screen / Esc
Printer-friendly Version
Interactive Discussion
Discussion
Paper
|D
iscussionP
aper|
Discussion
Paper
|D
iscussionP
aper|
Bergamaschi, P., Hein, R., Heimann, M., and Crutzen, P. J.: Inverse modeling of the global COcycle: 1. Inversion of CO mixing ratios, J. Geophys. Res., 105, 1909–1927, 2000.
Castellanos, P., Marufu, L. T., Doddridge, B. G., Taubman, B. F., Schwab, J. J., Hains, J. C.,Ehrman, S. H., and Dickerson, R. R.: Ozone, oxides of nitrogen, and carbon monoxide dur-ing pollution events over the eastern United States: an evaluation of emissions and vertical5
mixing, J. Geophys. Res., 116, D16307, doi:10.1029/2010JD014540, 2011.Clerbaux, C., Boynard, A., Clarisse, L., George, M., Hadji-Lazaro, J., Herbin, H., Hurtmans, D.,
Pommier, M., Razavi, A., Turquety, S., Wespes, C., and Coheur, P.-F.: Monitoring of atmo-spheric composition using the thermal infrared IASI/MetOp sounder, Atmos. Chem. Phys., 9,6041–6054, doi:10.5194/acp-9-6041-2009, 2009.10
Conrad, R.: Soil microorganisms as controllers of atmospheric trace gases (H2, CO, CH4, OCS,N2O, and NO), Microbiol. Rev., 60, 609–640, 1996.
Conrad, R. and Seiler, W.: Influence of temperature, moisture, and organic carbon on the fluxof H2 and CO between soil and atmosphere: field studies in subtropical regions, J. Geophys.Res., 90, 5699–5709, 1985.15
Cristofanelli, P., Fierli, F., Marinoni, A., Calzolari, F., Duchi, R., Burkhart, J., Stohl, A.,Maione, M., Arduini, J., and Bonasoni, P.: Influence of biomass burning and anthropogenicemissions on ozone, carbon monoxide and black carbon at the Mt. Cimone GAW-WMOglobal station (Italy, 2165 m a.s.l.), Atmos. Chem. Phys., 13, 15–30, doi:10.5194/acp-13-15-2013, 2013.20
Dee, D. P., Uppala, S. M., Simmons, A. J., Berrisford, P., Poli, P., Kobayashi, S., Andrae, U.,Balmaseda, M. A., Balsamo, G., Bauer, P., Bechtold, P., Beljaars, A. C. M., van de Berg, L.,Bidlot, J., Bormann, N., Delsol, C., Dragani, R., Fuentes, M., Geer, A. J., Haimberger, L.,Healy, S. B., Hersbach, H., Hólm, E. V., Isaksen, L., Kållberg, P., Köhler, M., Matricardi, M.,McNally, A. P., Monge-Sanz, B. M., Morcrette, J.-J., Park, B.-K., Peubey, C., de Rosnay, P.,25
Tavolato, C., Thépaut, J.-N., and Vitart, F.: The ERA-Interim reanalysis: configuration andperformance of the data assimilation system, Q. J. Roy. Meteor. Soc., 137, 553–597,doi:10.1002/qj.828, 2011.
Deeter, M. N., Emmons, L. K., Edwards, D. P., Gille, J. C., and Drummond, J. R.: Verticalresolution and information content of CO profiles retrieved by MOPITT, Geophys. Res. Lett.,30
31, L15112, doi:10.1029/2004GL020235, 2004.
274

ACPD14, 245–301, 2014
On the wintertimelow bias of NorthernHemisphere CO in
global model studies
O. Stein et al.
Title Page
Abstract Introduction
Conclusions References
Tables Figures
J I
J I
Back Close
Full Screen / Esc
Printer-friendly Version
Interactive Discussion
Discussion
Paper
|D
iscussionP
aper|
Discussion
Paper
|D
iscussionP
aper|
Deeter, M. N., Worden, H. M., Edwards, D. P., Gille, J. C., Mao, D., and Drummond, J. R.:MOPITT multispectral CO retrievals: origins and effects of geophysical radiance errors, J.Geophys. Res., 116, D15303, doi:10.1029/2011JD015703, 2011.
Deeter, M. N., Worden, H. M., Edwards, D. P., Gille, J. C., and Andrews, A. E.: Evaluation of MO-PITT retrievals of lower-tropospheric carbon monoxide over the United States, J. Geophys.5
Res., 117, D13306, doi:10.1029/2012JD017553, 2012.Deeter, M. N., Martínez-Alonso, S., Edwards, D. P., Emmons, L. K., Gille, J. C., Worden, H. M.,
Pittman, J. V., Daube, B. C., and Wofsy, S. C.: Validation of MOPITT Version 5 thermal-infrared, near-infrared, and multispectral carbon monoxide profile retrievals for 2000–2011,J. Geophys. Res.-Atmos., 118, 6710–6725, doi:10.1002/jgrd.50272, 2013.10
Denier van der Gon, H., Visschedijk, A., van Gijlswijk, R., and Kuenen, J.: High resolutionEuropean emission inventory for the years 2003–2007, TNO report TNO-060-UT-2011-0058,49, 2011.
Dentener, F., Drevet, J., Lamarque, J.-F., Bey, I., Eickhout, B., Fiore, A. M., Hauglustaine, D.,Horowitz, L. W., Krol, M., Kulshrestha, U. C., Lawrence, M., Galy-Lacaux, C., Rast, S., Shin-15
dell, D., Stevenson, D., Van Noije, T., Atherton, C., Bell, N., Bergman, D., Butler, T., Cofala,J., Collins, B., Doherty, R., Ellingsen, K., Galloway, J., Gauss, M., Montanaro, V., Müller, J.-F., Pitari, G., Rodriguez, J., Sanderson, M., Solmon, F., Strahan, S., Schultz, M., Sudo, K.,Szopa, S., and Wild, O.: Nitrogen and sulfur deposition on regional and global scales: A multi-model evaluation, Global Biogeochem. Cy., 20, GB4003, doi:10.1029/2005GB002672, 2006.20
Drori, R., Dayan, U., Edwards, D. P., Emmons, L. K., and Erlick, C.: Attributing and quantifyingcarbon monoxide sources affecting the Eastern Mediterranean: a combined satellite, mod-elling, and synoptic analysis study, Atmos. Chem. Phys., 12, 1067–1082, doi:10.5194/acp-12-1067-2012, 2012.
Drummond, J. R. and Mand, G. S.: The Measurements of Pollution in the Troposphere (MO-25
PITT) instrument: overall performance and calibration requirements, J. Atmos. Ocean. Tech.,13, 314–320, 1996.
Duncan, B. N. and Bey, I.: A modeling study of the export pathways of pollution from Eu-rope: seasonal and interannual variations (1987–1997), J. Geophys. Res., 109, D08301,doi:10.1029/2003JD004079, 2004.30
Duncan, B. N. and Logan, J. A.: Model analysis of the factors regulating the trends and vari-ability of carbon monoxide between 1988 and 1997, Atmos. Chem. Phys., 8, 7389–7403,doi:10.5194/acp-8-7389-2008, 2008.
275

ACPD14, 245–301, 2014
On the wintertimelow bias of NorthernHemisphere CO in
global model studies
O. Stein et al.
Title Page
Abstract Introduction
Conclusions References
Tables Figures
J I
J I
Back Close
Full Screen / Esc
Printer-friendly Version
Interactive Discussion
Discussion
Paper
|D
iscussionP
aper|
Discussion
Paper
|D
iscussionP
aper|
Duncan, B. N., Logan, J. A., Bey, I., Megretskaia, I. A., Yantosca, R. M., Novelli, P. C.,Jones, N. B., and Rinsland, C. P.: Global budget of CO, 1988–1997: source estimates andvalidation with a global model, J. Geophys. Res., 112, D22301, doi:10.1029/2007JD008459,2007.
EEA: European Union emission inventory report 1990–2011 under the UNECE Convention on5
Long-range Transboundary Air Pollution (LRTAP), Technical Report 10, European Environ-ment Agency, Copenhagen, doi:10.2800/44480, 2013.
Ehhalt, D. H. and Rohrer, F.: The tropospheric cycle of H2: a critical review, Tellus B, 61, 500–535, doi:10.1111/j.1600-0889.2009.00416.x, 2009.
Elguindi, N., Clark, H., Ordóñez, C., Thouret, V., Flemming, J., Stein, O., Huijnen, V.,10
Moinat, P., Inness, A., Peuch, V.-H., Stohl, A., Turquety, S., Athier, G., Cammas, J.-P., andSchultz, M.: Current status of the ability of the GEMS/MACC models to reproduce the tropo-spheric CO vertical distribution as measured by MOZAIC, Geosci. Model Dev., 3, 501–518,doi:10.5194/gmd-3-501-2010, 2010.
Emmons, L. K., Walters, S., Hess, P. G., Lamarque, J.-F., Pfister, G. G., Fillmore, D., Granier, C.,15
Guenther, A., Kinnison, D., Laepple, T., Orlando, J., Tie, X., Tyndall, G., Wiedinmyer, C.,Baughcum, S. L., and Kloster, S.: Description and evaluation of the Model for Ozoneand Related chemical Tracers, version 4 (MOZART-4), Geosci. Model Dev., 3, 43–67,doi:10.5194/gmd-3-43-2010, 2010.
Eyring, V., Isaksen, I. S. A., Berntsen, T., Collins, W. J., Corbett, J. J., Endresen, O.,20
Grainger, R. G., Moldanova, J., Schlager, H., and Stevenson, D. S.: Transportimpacts on atmosphere and climate: Shipping, Atmos. Environ., 44, 4735–4771,doi:10.1016/j.atmosenv.2009.04.059, 2010.
Fisher, J. A., Jacob, D. J., Purdy, M. T., Kopacz, M., Le Sager, P., Carouge, C., Holmes, C. D.,Yantosca, R. M., Batchelor, R. L., Strong, K., Diskin, G. S., Fuelberg, H. E., Holloway, J. S.,25
Hyer, E. J., McMillan, W. W., Warner, J., Streets, D. G., Zhang, Q., Wang, Y., and Wu, S.:Source attribution and interannual variability of Arctic pollution in spring constrained by air-craft (ARCTAS, ARCPAC) and satellite (AIRS) observations of carbon monoxide, Atmos.Chem. Phys., 10, 977–996, doi:10.5194/acp-10-977-2010, 2010.
Flemming, J., Inness, A., Flentje, H., Huijnen, V., Moinat, P., Schultz, M. G., and Stein, O.:30
Coupling global chemistry transport models to ECMWF’s integrated forecast system, Geosci.Model Dev., 2, 253–265, doi:10.5194/gmd-2-253-2009, 2009.
276

ACPD14, 245–301, 2014
On the wintertimelow bias of NorthernHemisphere CO in
global model studies
O. Stein et al.
Title Page
Abstract Introduction
Conclusions References
Tables Figures
J I
J I
Back Close
Full Screen / Esc
Printer-friendly Version
Interactive Discussion
Discussion
Paper
|D
iscussionP
aper|
Discussion
Paper
|D
iscussionP
aper|
Fortems-Cheiney, A., Chevallier, F., Pison, I., Bousquet, P., Szopa, S., Deeter, M. N., and Cler-baux, C.: Ten years of CO emissions as seen from Measurements of Pollution in the Tropo-sphere (MOPITT), J. Geophys. Res., 116, D05304, doi:10.1029/2010JD014416, 2011.
Ganzeveld, L. and Lelieveld, J.: Dry deposition parameterization in a chemistry general circu-lation model and its influence on the distribution of reactive trace gases, J. Geophys. Res.,5
100, 20999–21012, 1995.Ganzeveld, L., Lelieveld, J., and Roelofs, G.-J.: Dry deposition parameterization of sulfur oxides
in a chemistry and general circulation model, J. Geophys. Res., 103, 5679–5694, 1998.Gao, J., Wang, T., Ding, A., and Liu, C.: Observational study of ozone and carbon monoxide
at the summit of mount Tai (1534 m a.s.l.) in Central-Eastern China, Atmos. Environ., 39,10
4779–4791, 2005.George, M., Clerbaux, C., Hurtmans, D., Turquety, S., Coheur, P.-F., Pommier, M., Hadji-
Lazaro, J., Edwards, D. P., Worden, H., Luo, M., Rinsland, C., and McMillan, W.: Carbonmonoxide distributions from the IASI/METOP mission: evaluation with other space-borne re-mote sensors, Atmos. Chem. Phys., 9, 8317–8330, doi:10.5194/acp-9-8317-2009, 2009.15
Granier, C., Lamarque, J. F., Mieville, A., Muller, J. F., Olivier, J., Orlando, J., Peters, J.,Petron, G., Tyndall, G., and Wallens, S.: POET, a database of surface emissions of ozoneprecursors, available at: http://eccad.sedoo.fr/ (last access: October 2013), 2005.
Granier, C., Bessagnet, B., Bond, T., D’Angiola, A., Denier van der Gon, H., Frost, G. J., Heil, A.,Kaiser, J. W., Kinne, S., Klimont, Z., Kloster, S., Lamarque, J.-F., Liousse, C., Masui, T.,20
Meleux, F., Mieville, A., Ohara, R., Raut, J.-C., Riahi, K., Schultz, M. G., Smith, S. G., Thomp-son, A., van Aardenne, J., van der Werf, G. R., and van Vuuren, D. P.: Evolution of anthro-pogenic and biomass burning emissions of air pollutants at global and regional scales duringthe 1980–2010 period, Climatic Change, 109, 163–190, doi:10.1007/s10584-011-0154-1,2011.25
Guenther, A., Karl, T., Harley, P., Wiedinmyer, C., Palmer, P. I., and Geron, C.: Estimatesof global terrestrial isoprene emissions using MEGAN (Model of Emissions of Gases andAerosols from Nature), Atmos. Chem. Phys., 6, 3181–3210, doi:10.5194/acp-6-3181-2006,2006.
Guenther, A. B., Jiang, X., Heald, C. L., Sakulyanontvittaya, T., Duhl, T., Emmons, L. K.,30
and Wang, X.: The Model of Emissions of Gases and Aerosols from Nature version 2.1(MEGAN2.1): an extended and updated framework for modeling biogenic emissions, Geosci.Model Dev., 5, 1471–1492, doi:10.5194/gmd-5-1471-2012, 2012.
277
ACPD14, 245–301, 2014
On the wintertimelow bias of NorthernHemisphere CO in
global model studies
O. Stein et al.
Title Page
Abstract Introduction
Conclusions References
Tables Figures
J I
J I
Back Close
Full Screen / Esc
Printer-friendly Version
Interactive Discussion
Discussion
Paper
|D
iscussionP
aper|
Discussion
Paper
|D
iscussionP
aper|
Hooghiemstra, P. B., Krol, M. C., Meirink, J. F., Bergamaschi, P., van der Werf, G. R., Nov-elli, P. C., Aben, I., and Röckmann, T.: Optimizing global CO emission estimates using afour-dimensional variational data assimilation system and surface network observations, At-mos. Chem. Phys., 11, 4705–4723, doi:10.5194/acp-11-4705-2011, 2011.
Hooghiemstra, P. B., Krol, M. C., Bergamaschi, P., de Laat, A. T. J., van der Werf, G. R., Nov-5
elli, P. C., Deeter, M. N., Aben, I., and Röckmann, T.: Comparing optimized CO emissionestimates using MOPITT or NOAA surface network observations, J. Geophys. Res., 117,D06309, doi:10.1029/2011JD017043, 2012.
Horowitz, L. W., Walters, S., Mauzerall, D. L., Emmons, L. K., Rasch, P. J., Granier, C., Tie, X.,Lamarque, J.-F., Schultz, M. G., Tyndall, G. S., Orlando, J. J., and Brasseur, G. P.: A global10
simulation of tropospheric ozone and related tracers: description and evaluation of MOZART,version 2, J. Geophys. Res., 108, D24784, doi:10.1029/2002JD002853, 2003.
Huijnen, V., Williams, J., van Weele, M., van Noije, T., Krol, M., Dentener, F., Segers, A., Houwel-ing, S., Peters, W., de Laat, J., Boersma, F., Bergamaschi, P., van Velthoven, P., Le Sager, P.,Eskes, H., Alkemade, F., Scheele, R., Nédélec, P., and Pätz, H.-W.: The global chemistry15
transport model TM5: description and evaluation of the tropospheric chemistry version 3.0,Geosci. Model Dev., 3, 445–473, doi:10.5194/gmd-3-445-2010, 2010.
Hurtmans, D., Coheur, P.-F., Wespes, C., Clarisse, L., Scharf, O., Clerbaux, C., Hadji-Lazaro, J.,George, M., and Turquety, S.: FORLI radiative transfer and retrieval code for IASI, J. Quant.Spectrosc. Ra., 113, 1391–1408, doi:10.1016/j.jqsrt.2012.02.036, 2012.20
Inness, A., Baier, F., Benedetti, A., Bouarar, I., Chabrillat, S., Clark, H., Clerbaux, C., Coheur, P.,Engelen, R. J., Errera, Q., Flemming, J., George, M., Granier, C., Hadji-Lazaro, J., Huij-nen, V., Hurtmans, D., Jones, L., Kaiser, J. W., Kapsomenakis, J., Lefever, K., Leitão, J.,Razinger, M., Richter, A., Schultz, M. G., Simmons, A. J., Suttie, M., Stein, O., Thépaut, J.-N.,Thouret, V., Vrekoussis, M., Zerefos, C., and the MACC team: The MACC reanalysis: an 8 yr25
data set of atmospheric composition, Atmos. Chem. Phys., 13, 4073–4109, doi:10.5194/acp-13-4073-2013, 2013.
Janssens-Maenhout, G., Petrescu, A. M. R., Muntean, M., and Blujdea, V.: Verifying green-house gas emissions: methods to support international climate agreements, GreenhouseGas Measurement and Management, 1, 124 pp., doi:10.1080/20430779.2011.579358,30
2010.
278

ACPD14, 245–301, 2014
On the wintertimelow bias of NorthernHemisphere CO in
global model studies
O. Stein et al.
Title Page
Abstract Introduction
Conclusions References
Tables Figures
J I
J I
Back Close
Full Screen / Esc
Printer-friendly Version
Interactive Discussion
Discussion
Paper
|D
iscussionP
aper|
Discussion
Paper
|D
iscussionP
aper|
Kaiser, J. W., Heil, A., Schultz, M. G., Stein, O., van der Werf, G. R., Wooster, M. J., andXu, W.: Final report on implementation and quality of the D-FIRE assimilation system, MACCdeliverable D-FIRE 7, ECMWF, 2011.
Kaiser, J. W., Heil, A., Andreae, M. O., Benedetti, A., Chubarova, N., Jones, L., Morcrette, J.-J.,Razinger, M., Schultz, M. G., Suttie, M., and van der Werf, G. R.: Biomass burning emissions5
estimated with a global fire assimilation system based on observed fire radiative power,Biogeosciences, 9, 527–554, doi:10.5194/bg-9-527-2012, 2012.
Kerzenmacher, T., Dils, B., Kumps, N., Blumenstock, T., Clerbaux, C., Coheur, P.-F., De-moulin, P., García, O., George, M., Griffith, D. W. T., Hase, F., Hadji-Lazaro, J., Hurtmans, D.,Jones, N., Mahieu, E., Notholt, J., Paton-Walsh, C., Raffalski, U., Ridder, T., Schneider, M.,10
Servais, C., and De Mazière, M.: Validation of IASI FORLI carbon monoxide retrievals usingFTIR data from NDACC, Atmos. Meas. Tech., 5, 2751–2761, doi:10.5194/amt-5-2751-2012,2012.
King, G. M.: Characteristics and significance of atmospheric carbon monoxide consumption bysoils, Chemosphere, 1, 53–63, doi:10.1016/S1465-9972(99)00021-5, 1999.15
Kinnison, D. E., Brasseur, G. P., Walters, S., Garcia, R. R., Marsh, D. R, Sassi, F., Harvey, V. L.,Randall, C. E., Emmons, L., Lamarque, J. F., Hess, P., Orlando, J. J., Tie, X. X., Randel, W.,Pan, L. L., Gettelman, A., Granier, C., Diehl, T., Niemeier, U., and Simmons, A. J.: Sensitivityof Chemical Tracers to Meteorological Parameters in the MOZART-3 Chemical TransportModel, J. Geophys. Res., 112, D03303, doi:10.1029/2008JD010739, 2007.20
Klemp, D., Mihelcic, D., and Mittermaier, B.: Messung und Bewertung von Verkehrsemis-sionen, Schriften des Forschungszentrums Jülich, Reihe Energie und Umwelt, vol. 21,Forschungszentrum Jülich, Jülich, 2012 (in German).
Klonecki, A., Pommier, M., Clerbaux, C., Ancellet, G., Cammas, J.-P., Coheur, P.-F., Cozic, A.,Diskin, G. S., Hadji-Lazaro, J., Hauglustaine, D. A., Hurtmans, D., Khattatov, B., Lamar-25
que, J.-F., Law, K. S., Nedelec, P., Paris, J.-D., Podolske, J. R., Prunet, P., Schlager, H.,Szopa, S., and Turquety, S.: Assimilation of IASI satellite CO fields into a global chemistrytransport model for validation against aircraft measurements, Atmos. Chem. Phys., 12, 4493–4512, doi:10.5194/acp-12-4493-2012, 2012.
Kopacz, M., Jacob, D. J., Fisher, J. A., Logan, J. A., Zhang, L., Megretskaia, I. A., Yan-30
tosca, R. M., Singh, K., Henze, D. K., Burrows, J. P., Buchwitz, M., Khlystova, I., McMil-lan, W. W., Gille, J. C., Edwards, D. P., Eldering, A., Thouret, V., and Nedelec, P.: Global es-timates of CO sources with high resolution by adjoint inversion of multiple satellite datasets
279

ACPD14, 245–301, 2014
On the wintertimelow bias of NorthernHemisphere CO in
global model studies
O. Stein et al.
Title Page
Abstract Introduction
Conclusions References
Tables Figures
J I
J I
Back Close
Full Screen / Esc
Printer-friendly Version
Interactive Discussion
Discussion
Paper
|D
iscussionP
aper|
Discussion
Paper
|D
iscussionP
aper|
(MOPITT, AIRS, SCIAMACHY, TES), Atmos. Chem. Phys., 10, 855–876, doi:10.5194/acp-10-855-2010, 2010.
Kurokawa, J., Ohara, T., Morikawa, T., Hanayama, S., Greet, J.-M., Fukui, T., Kawashima, K.,and Akimoto, H.: Emissions of air pollutants and greenhouse gases over Asian regions during2000–2008: Regional Emission inventory in ASia (REAS) version 2, Atmos. Chem. Phys.5
Discuss., 13, 10049–10123, doi:10.5194/acpd-13-10049-2013, 2013.Lamarque, J.-F., Bond, T. C., Eyring, V., Granier, C., Heil, A., Klimont, Z., Lee, D., Liousse, C.,
Mieville, A., Owen, B., Schultz, M. G., Shindell, D., Smith, S. J., Stehfest, E., Van Aar-denne, J., Cooper, O. R., Kainuma, M., Mahowald, N., McConnell, J. R., Naik, V., Riahi, K.,and van Vuuren, D. P.: Historical (1850–2000) gridded anthropogenic and biomass burn-10
ing emissions of reactive gases and aerosols: methodology and application, Atmos. Chem.Phys., 10, 7017–7039, doi:10.5194/acp-10-7017-2010, 2010.
Lamarque, J.-F., Emmons, L. K., Hess, P. G., Kinnison, D. E., Tilmes, S., Vitt, F., Heald, C. L.,Holland, E. A., Lauritzen, P. H., Neu, J., Orlando, J. J., Rasch, P. J., and Tyndall, G. K.: CAM-chem: description and evaluation of interactive atmospheric chemistry in the Community15
Earth System Model, Geosci. Model Dev., 5, 369–411, doi:10.5194/gmd-5-369-2012, 2012.Law, K. S. and Stohl, A.: Arctic air pollution: origins and impacts, Science, 315, 1537–1540,
2007.Li, Q., Jacob, D. J., Bey, I., Palmer, P. I., Duncan, B. N., Field, B. D., Martin, R. V., Fiore, A. M.,
Yantosca, R. M., Parrish, D. D., Simmonds, P. G., and Oltmans, S. J.: Transatlantic transport20
of pollution and its effects on surface ozone in Europe and North America, J. Geophys. Res.,107, 4166, doi:10.1029/2001JD001422, 2002.
Liu, H., Jacob, D. J., Bey, I., Yantosca, R. M., Duncan, B. N., and Sachse, G. W.: Transportpathways for Asian pollution outflow over the Pacific: interannual and seasonal variations, J.Geophys. Res., 108, 8786, doi:10.1029/2002JD003102, 2003.25
Mao, J., Fan, S., Jacob, D. J., and Travis, K. R.: Radical loss in the atmosphere from Cu-Fe redox coupling in aerosols, Atmos. Chem. Phys., 13, 509–519, doi:10.5194/acp-13-509-2013, 2013.
Marenco, A., Thouret, V., Nédélec, P., Smit, H., Helten, M., Kley, D., Karcher, F., Simon, P.,Law, K., Pyle, J., Poschmann, G., Von Wrede, R., Hume, C., and Cook, T.: Measurement30
of ozone and water vapour by Airbus in-service aircraft: the MOZAIC airborne program, anoverview, J. Geophys. Res., 103, 25631–25642, doi:10.1029/98JD00977, 1998.
280

ACPD14, 245–301, 2014
On the wintertimelow bias of NorthernHemisphere CO in
global model studies
O. Stein et al.
Title Page
Abstract Introduction
Conclusions References
Tables Figures
J I
J I
Back Close
Full Screen / Esc
Printer-friendly Version
Interactive Discussion
Discussion
Paper
|D
iscussionP
aper|
Discussion
Paper
|D
iscussionP
aper|
Miller, S. M., Matross, D. M., Andrews, A. E., Millet, D. B., Longo, M., Gottlieb, E. W.,Hirsch, A. I., Gerbig, C., Lin, J. C., Daube, B. C., Hudman, R. C., Dias, P. L. S., Chow, V. Y.,and Wofsy, S. C.: Sources of carbon monoxide and formaldehyde in North America de-termined from high-resolution atmospheric data, Atmos. Chem. Phys., 8, 7673–7696,doi:10.5194/acp-8-7673-2008, 2008.5
Moss, R. H., Edmonds, J. A., Hibbard, K., Manning, M., Rose, S. K., van Vuuren, D. P.,Carter, T. R., Emori, S., Kainuma, M., Kram, T., Meehl, G., Mitchell, J., Nakicenovic, N.,Riahi, K., Smith, S. J., Stouffer, R. J., Thomson, A., Weyant, J., and Wilbanks, T.: The nextgeneration of scenarios for climate change research and assessment, Nature, 463, 747–756,doi:10.1038/nature08823, 2010.10
Müller, J.-F. and Stavrakou, T.: Inversion of CO and NOx emissions using the adjoint of theIMAGES model, Atmos. Chem. Phys., 5, 1157–1186, doi:10.5194/acp-5-1157-2005, 2005.
Novelli, P. C., Masarie, K. A., and Lang, P. M.: Distributions and recent changes ofcarbon monoxide in the lower troposphere, J. Geophys. Res., 103, 19015–19033,doi:10.1029/98JD01366, 1998.15
Ohara, T., Akimoto, H., Kurokawa, J., Horii, N., Yamaji, K., Yan, X., and Hayasaka, T.: An Asianemission inventory of anthropogenic emission sources for the period 1980–2020, Atmos.Chem. Phys., 7, 4419–4444, doi:10.5194/acp-7-4419-2007, 2007.
Parrish, D. D.: Critical evaluation of US on-road vehicle emission inventories, Atmos. Environ.,40, 2288–2300, 2006.20
Pétron, G., Granier, C., Khattatov, B., Lamarque, J., Yudin, V., Müller, J., and Gille, J.:Inverse modeling of carbon monoxide surface emissions using climate monitoringand diagnostics laboratory network observations, J. Geophys. Res., 107, D24761,doi:10.1029/2001JD001305, 2002.
Pétron, G., Granier, C., Khattatov, B., Yudin, V., Lamarque, J.-F., Emmons, L., Gille, J., and25
Edwards, D. P.: Monthly CO surface sources inventory based on the 2000–2001 MOPITTsatellite data, Geophys. Res. Lett., 31, L21107, doi:10.1029/2004GL020560, 2004.
Pfister, G., Emmons, L. K., Hess, P. G., Lamarque, J.-F., Walters, S., Guenther, A., Palmer, P. I.,and Lawrence, P.: Contribution of isoprene to chemical budgets: a model tracer study withthe NCAR CTM MOZART-4, J. Geophys. Res., 113, D05308, doi:10.1029/2007JD008948,30
2008.
281

ACPD14, 245–301, 2014
On the wintertimelow bias of NorthernHemisphere CO in
global model studies
O. Stein et al.
Title Page
Abstract Introduction
Conclusions References
Tables Figures
J I
J I
Back Close
Full Screen / Esc
Printer-friendly Version
Interactive Discussion
Discussion
Paper
|D
iscussionP
aper|
Discussion
Paper
|D
iscussionP
aper|
Pison, I., Bousquet, P., Chevallier, F., Szopa, S., and Hauglustaine, D.: Multi-species inversionof CH4, CO and H2 emissions from surface measurements, Atmos. Chem. Phys., 9, 5281–5297, doi:10.5194/acp-9-5281-2009, 2009.
Pommier, M., Law, K. S., Clerbaux, C., Turquety, S., Hurtmans, D., Hadji-Lazaro, J., Co-heur, P.-F., Schlager, H., Ancellet, G., Paris, J.-D., Nédélec, P., Diskin, G. S., Podolske, J. R.,5
Holloway, J. S., and Bernath, P.: IASI carbon monoxide validation over the Arctic dur-ing POLARCAT spring and summer campaigns, Atmos. Chem. Phys., 10, 10655–10678,doi:10.5194/acp-10-10655-2010, 2010.
Pouliot, G., Pierce, T. E., Denier van der Gon, H., Schaap, M., Moran, M., and Nopmongeol, U.:Comparing Emission Inventories and Model-Ready Emission Datasets between Europe and10
North America for the AQMEII Project, Atmos. Environ., 53, 4–14, 2012.Prather, M., Ehhalt, D., Dentener, F., Derwent, R. G., Dlugokencky, E., Holland, E., Isaksen, I. S.
A., Katima, J., Kirchhoff, V., Matson, P., Midgley, P. M., and Wang, M.: Atmospheric chemistryand greenhouse gases, in: Climate Change 2001, edited by: Houghton, J. T., CambridgeUniv. Press, New York, 239–287, 2001.15
Prather, M. J., Holmes, C. D., and Hsu, J.: Reactive greenhouse gas scenarios: systematicexploration of uncertainties and the role of atmospheric chemistry, Geophys. Res. Lett., 39,L09803, doi:10.1029/2012GL051440, 2012.
Price, C., Penner, J., and Prather, M.: NOx from lightning 1. Global distribution based on light-ning physics, J. Geophys. Res., 102, 5929–5941, 1997.20
Riahi, K., Rao, S., Krey, V., Cho, C., Chirkov, V., Fischer, G., Kindermann, G., Nakicenovic, N.,and Rafaj, P.: RCP 8.5 – a scenario of comparatively high greenhouse gas emissions, Cli-matic Change, 109, 33–57, doi:10.1007/s10584-011-0149-y, 2011.
Richter, C. and Schultz, M. G.: Impact of emission changes on climate, in: CITYZEN ClimateImpact Studies, edited by: Schultz, M. G., Schriften des Forschungszentrums Jülich, Reihe25
Energie & Umwelt/Energy & Environment, Forschungszentrum Jülich, Jülich, 116, 17–38,2011
Rodgers, C. D.: Inverse Methods for Atmospheric Sounding, Theory and Practice, World Sci-entific, Singapore, 2000.
Sander, S. P., Friedl, R. R., Golden, D. M., Kurylo, M. J., Moortgat, G. K., Keller-Rudek, H.,30
Wine, P. H., Ravishankara, A. R., Kolb, C. E., Molina, M. J., Finlayson-Pitts, B. J., Huie, R. E.,and Orkin, V. L.: Chemical Kinetics and Photochemical Data for Use in Atmospheric Studies,
282
ACPD14, 245–301, 2014
On the wintertimelow bias of NorthernHemisphere CO in
global model studies
O. Stein et al.
Title Page
Abstract Introduction
Conclusions References
Tables Figures
J I
J I
Back Close
Full Screen / Esc
Printer-friendly Version
Interactive Discussion
Discussion
Paper
|D
iscussionP
aper|
Discussion
Paper
|D
iscussionP
aper|
Evaluation Number 15, JPL Publication 06-02, Jet Propulsion Laboratory, Pasadena, Calif.,2006.
Sanderson, M. G., Collins, W. J., Derwent, R. G., and Johnson, C. E.: Simulation of globalhydrogen levels using a Lagrangian three-dimensional model, J. Atmos. Chem., 46, 15–28,2003.5
Sanhueza, E., Dong, Y., Scharffe, D., Lobert, J. M., and Crutzen, P. J.: Carbon monoxide up-take by temperate forest soils: the effects of leaves and humus layers, Tellus B, 50, 51–58,doi:10.1034/j.1600-0889.1998.00004.x, 1998.
Schultz, M. G. and Rast, S.: Emission datasets and methodologies for estimating emissions,available at: http://retro.enes.org (last access: 27 December 2013), RETRO Report D1-6,10
2007.Shindell, D. T., Faluvegi, G., Stevenson, D. S., Krol, M. C., Emmons, L. K., Lamarque, J.-F.,
Pétron, G., Dentener, F. J., Ellingsen, K., Schultz, M. G., Wild, O., Amann, M., Atherton, C.S., Bergmann, D. J., Bey, I., Butler, T., Cofala, J., Collins, W. J., Derwent, R. G., Doherty, R.M., Drevet, J., Eskes, H. J., Fiore, A. M., Gauss, M., Hauglustaine, D. A., Horowitz, L. W.,15
Isaksen, I. S. A., Lawrence, M. G., Montanaro, V., Müller, J.-F., Pitari, G., Prather, M. J., Pyle,J. A., Rast, S., Rodriguez, J. M., Sanderson, M. G., Savage, N. H., Strahan, S. E., Sudo,K., Szopa, S., Unger, N., van Noije, T. P. C., and Zeng, G.: Multimodel simulations of carbonmonoxide: comparison with observations and projected near-future changes, J. Geophys.Res., 111, D19306, doi:10.1029/2006JD007100, 2006.20
Shindell, D. T., Chin, M., Dentener, F., Doherty, R. M., Faluvegi, G., Fiore, A. M., Hess, P.,Koch, D. M., MacKenzie, I. A., Sanderson, M. G., Schultz, M. G., Schulz, M., Steven-son, D. S., Teich, H., Textor, C., Wild, O., Bergmann, D. J., Bey, I., Bian, H., Cuvelier, C., Dun-can, B. N., Folberth, G., Horowitz, L. W., Jonson, J., Kaminski, J. W., Marmer, E., Park, R.,Pringle, K. J., Schroeder, S., Szopa, S., Takemura, T., Zeng, G., Keating, T. J., and Zuber, A.:25
A multi-model assessment of pollution transport to the Arctic, Atmos. Chem. Phys., 8, 5353–5372, doi:10.5194/acp-8-5353-2008, 2008.
Stein, O., Flemming, J., Inness, A., Kaiser, J. W., and Schultz, M. G.: Global reactive gases andreanalysis in the MACC project, Journal of Integrative Environmental Sciences, 9, 57–70,doi:10.1080/1943815X.2012.696545, 2012.30
Stevenson, D. S.: Multimodel ensemble simulations of present-day and near-future troposphericozone, J. Geophys. Res., 111, D08301, doi:10.1029/2005JD006338, 2006.
283

ACPD14, 245–301, 2014
On the wintertimelow bias of NorthernHemisphere CO in
global model studies
O. Stein et al.
Title Page
Abstract Introduction
Conclusions References
Tables Figures
J I
J I
Back Close
Full Screen / Esc
Printer-friendly Version
Interactive Discussion
Discussion
Paper
|D
iscussionP
aper|
Discussion
Paper
|D
iscussionP
aper|
van der Werf, G. R., Randerson, J. T., Giglio, L., Collatz, G. J., Kasibhatla, P. S., and Arel-lano Jr., A. F.: Interannual variability in global biomass burning emissions from 1997 to 2004,Atmos. Chem. Phys., 6, 3423–3441, doi:10.5194/acp-6-3423-2006, 2006.
van der Werf, G. R., Randerson, J. T., Giglio, L., Collatz, G. J., Mu, M., Kasibhatla, P. S., Mor-ton, D. C., DeFries, R. S., Jin, Y., and van Leeuwen, T. T.: Global fire emissions and the5
contribution of deforestation, savanna, forest, agricultural, and peat fires (1997–2009), At-mos. Chem. Phys., 10, 11707–11735, doi:10.5194/acp-10-11707-2010, 2010.
van Vuuren, D. P., Edmonds, J., Kainuma, M., Riahi, K., Thomson, A. Hibbard, K., Hurtt, G. C.,Kram, T., Krey, V., Lamarque, J.-F., Masui, T., Meinshausen, M., Nakicenovic, N., Smith, S. J.,and Rose, S. K.: The representative concentration pathways: an overview, Climatic Change,10
109, 5–31, doi:10.1007/s10584-011-0148-z, 2011.Wang, Y. X., McElroy, M. B., Wang, T., and Palmer, P. I.: Asian emissions of CO and
NOx: constraints from aircraft and Chinese station data, J. Geophys. Res., 109, D24304,doi:10.1029/2004JD005250, 2004.
Wesely, M. L.: Parameterization of surface resistance to gaseous dry deposition in regional-15
scale numerical models, Atmos. Environ., 23, 1293–1304, 1989.Wesely, M. L. and Hicks, B. B.: A review of the current status of knowledge in dry deposition,
Atmos. Environ., 34, 2261–2282, 2000.Worden, H. M., Deeter, M. N., Edwards, D. P., Gille, J. C., Drummond, J. R., and Nédélec, P. P.:
Observations of near-surface carbon monoxide from space using MOPITT multispectral re-20
trievals, J. Geophys. Res., 115, D18314, doi:10.1029/2010JD014242, 2010.Worden, H. M., Deeter, M. N., Frankenberg, C., George, M., Nichitiu, F., Worden, J., Aben, I.,
Bowman, K. W., Clerbaux, C., Coheur, P. F., de Laat, A. T. J., Detweiler, R., Drummond, J. R.,Edwards, D. P., Gille, J. C., Hurtmans, D., Luo, M., Martínez-Alonso, S., Massie, S., Pfis-ter, G., and Warner, J. X.: Decadal record of satellite carbon monoxide observations, Atmos.25
Chem. Phys., 13, 837–850, doi:10.5194/acp-13-837-2013, 2013.Yonemura, S., Kawashima, S., and Tsuruta, H.: Carbon monoxide, hydrogen, and methane
uptake by soils in a temperate arable field and a forest, J. Geophys. Res., 105, 14347–14362,2000.
284
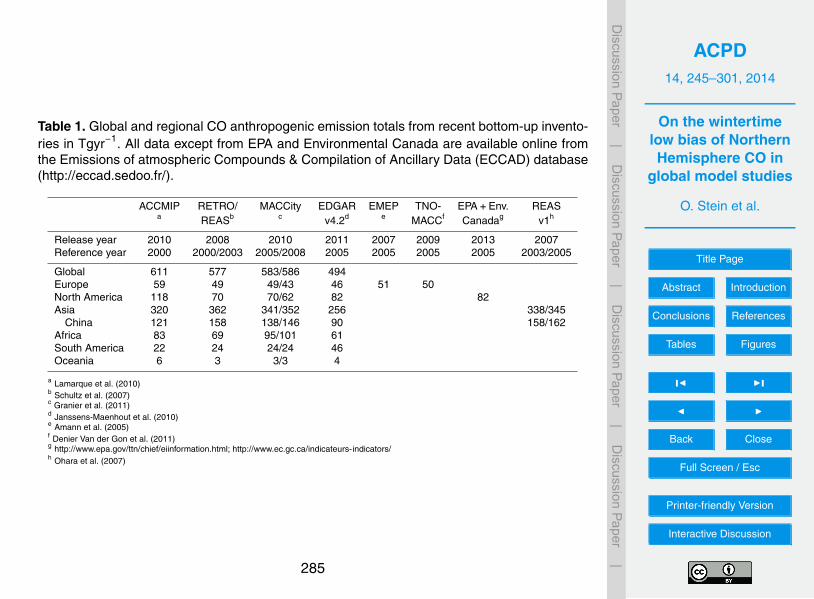
ACPD14, 245–301, 2014
On the wintertimelow bias of NorthernHemisphere CO in
global model studies
O. Stein et al.
Title Page
Abstract Introduction
Conclusions References
Tables Figures
J I
J I
Back Close
Full Screen / Esc
Printer-friendly Version
Interactive Discussion
Discussion
Paper
|D
iscussionP
aper|
Discussion
Paper
|D
iscussionP
aper|
Table 1. Global and regional CO anthropogenic emission totals from recent bottom-up invento-ries in Tgyr−1. All data except from EPA and Environmental Canada are available online fromthe Emissions of atmospheric Compounds & Compilation of Ancillary Data (ECCAD) database(http://eccad.sedoo.fr/).
ACCMIP RETRO/ MACCity EDGAR EMEP TNO- EPA+Env. REASa REASb c v4.2d e MACCf Canadag v1h
Release year 2010 2008 2010 2011 2007 2009 2013 2007Reference year 2000 2000/2003 2005/2008 2005 2005 2005 2005 2003/2005
Global 611 577 583/586 494Europe 59 49 49/43 46 51 50North America 118 70 70/62 82 82Asia 320 362 341/352 256 338/345
China 121 158 138/146 90 158/162Africa 83 69 95/101 61South America 22 24 24/24 46Oceania 6 3 3/3 4
a Lamarque et al. (2010)b Schultz et al. (2007)c Granier et al. (2011)d Janssens-Maenhout et al. (2010)e Amann et al. (2005)f Denier Van der Gon et al. (2011)g http://www.epa.gov/ttn/chief/eiinformation.html; http://www.ec.gc.ca/indicateurs-indicators/h Ohara et al. (2007)
285

ACPD14, 245–301, 2014
On the wintertimelow bias of NorthernHemisphere CO in
global model studies
O. Stein et al.
Title Page
Abstract Introduction
Conclusions References
Tables Figures
J I
J I
Back Close
Full Screen / Esc
Printer-friendly Version
Interactive Discussion
Discussion
Paper
|D
iscussionP
aper|
Discussion
Paper
|D
iscussionP
aper|
Table 2. Global and regional 2005 CO emission totals from recent biomass burning and bio-genic emission inventories in Tgyr−1. Data are available from the ECCAD database.
Biomass burning BiogenicGFEDv2 GFEDv3 GFASv1 MEGANv2 MEGAN-MACC
Release year 2006 2010 2012 2009 2012Reference year 2005 2008 2008 2000 2008Global 416 277 325 76 84global range 369–599a 252–595b 305–404c 83–93d
Europe 19 38 66 5 4North America 19 16 20 9 7Asia 82 22 41 18 15Africa 183 152 140 18 27South America 101 37 48 19 22Oceania 11 11 12 7 8
a 1997–2005b 1997–2010c 2003–2011d 2000–2010
286

ACPD14, 245–301, 2014
On the wintertimelow bias of NorthernHemisphere CO in
global model studies
O. Stein et al.
Title Page
Abstract Introduction
Conclusions References
Tables Figures
J I
J I
Back Close
Full Screen / Esc
Printer-friendly Version
Interactive Discussion
Discussion
Paper
|D
iscussionP
aper|
Discussion
Paper
|D
iscussionP
aper|
Table 3. Description of MOZART 2008 sensitivity simulations.
simulation Anthropogenic Biogenic Biomass Dry Global total COemissions emissions burning deposition source added to
emissions MI in Tgyr−1
MI MACCity MEGANv2.0 GFASv1 ECHAM5/MOZ –MI+AN MACCity, anthropogenic CO MEGANv2.0 GFASv1 ECHAM5/MOZ 586
emissions doubledMI+VOC MACCity, anthropogenic VOC MEGANv2.0 GFASv1 ECHAM5/MOZ 84
emissions doubledMI+BIO MACCity MEGANv2.0, biogenic CO and GFASv1 ECHAM5/MOZ 535
VOC emissions doubledMI+BB MACCity MEGANv2.0 GFASv1, CO biomass ECHAM5/MOZ 323
burning emissions doubledMI-DEP MACCity MEGANv2.0 GFASv1 Sanderson et al. (2003) 68MI-OPT MACCity, refined traffic CO scaling MEGANv2.0 GFASv1 Sanderson et al. (2003) 87
for North America and Europe only
287

ACPD14, 245–301, 2014
On the wintertimelow bias of NorthernHemisphere CO in
global model studies
O. Stein et al.
Title Page
Abstract Introduction
Conclusions References
Tables Figures
J I
J I
Back Close
Full Screen / Esc
Printer-friendly Version
Interactive Discussion
Discussion
Paper
|D
iscussionP
aper|
Discussion
Paper
|D
iscussionP
aper|
Table 4. Monthly scaling factors for CO traffic emissions over North America and Europe asapplied in simulation MI-OPT.
Jan Feb Mar Apr May Jun Jul Aug Sep Oct Nov Dec
North America 1.25 1.5 2 1.33 1 1 1 1 1 1 1 1Europe 4.5 3.33 3.33 3 1.5 1 1 1.25 1.5 2 2.5 2.5
288

ACPD14, 245–301, 2014
On the wintertimelow bias of NorthernHemisphere CO in
global model studies
O. Stein et al.
Title Page
Abstract Introduction
Conclusions References
Tables Figures
J I
J I
Back Close
Full Screen / Esc
Printer-friendly Version
Interactive Discussion
Discussion
Paper
|D
iscussionP
aper|
Discussion
Paper
|D
iscussionP
aper|
76
585
323
93
846
36 584
2325
188
984
975
CH4 877
Fig. 1. The global CO budget: sources and sinks. Numbers are in Tgyr−1 as estimated fromthis study using MACCity/MEGAN/GFAS emissions for the year 2008.
289

ACPD14, 245–301, 2014
On the wintertimelow bias of NorthernHemisphere CO in
global model studies
O. Stein et al.
Title Page
Abstract Introduction
Conclusions References
Tables Figures
J I
J I
Back Close
Full Screen / Esc
Printer-friendly Version
Interactive Discussion
Discussion
Paper
|D
iscussionP
aper|
Discussion
Paper
|D
iscussionP
aper|
1000
900
800
700
600
500
400
300
200
hPa
Fig. 2. Mean CO bias in % of modelled minus MOZAIC profiles. Black: MACC reanalysis. Red:control simulation without data assimilation. The solid lines show the means for NH extratropicalairports (north of 30◦ N), the dashed lines the means for tropical airports (30◦ S–30◦ N). Dataare averaged over the period January 2003 to December 2010.
290

ACPD14, 245–301, 2014
On the wintertimelow bias of NorthernHemisphere CO in
global model studies
O. Stein et al.
Title Page
Abstract Introduction
Conclusions References
Tables Figures
J I
J I
Back Close
Full Screen / Esc
Printer-friendly Version
Interactive Discussion
Discussion
Paper
|D
iscussionP
aper|
Discussion
Paper
|D
iscussionP
aper|
m s-1
Fig. 3. Monthly mean dry deposition velocities in ms−1 for January (left) and July (right). Toppanels: data derived with the ECHAM5/MOZ parameterization, bottom panels: data derivedwith the parameterization from Sanderson et al. (2003).
291

ACPD14, 245–301, 2014
On the wintertimelow bias of NorthernHemisphere CO in
global model studies
O. Stein et al.
Title Page
Abstract Introduction
Conclusions References
Tables Figures
J I
J I
Back Close
Full Screen / Esc
Printer-friendly Version
Interactive Discussion
Discussion
Paper
|D
iscussionP
aper|
Discussion
Paper
|D
iscussionP
aper|
Fig. 4. Locations of the surface stations (red diamonds) and MOZAIC airports (turquoise trian-gles) used for the model evaluation. Selected evaluation regions are marked with blue boxes.
292
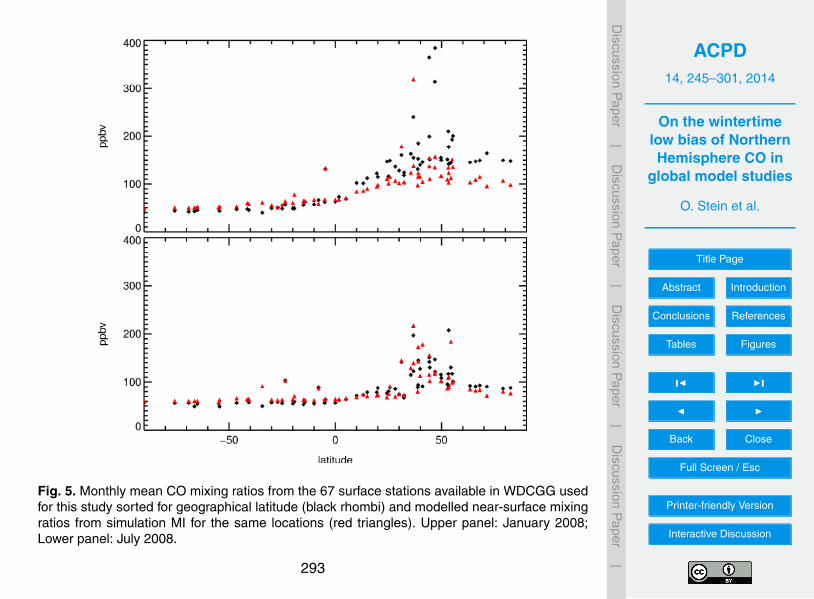
ACPD14, 245–301, 2014
On the wintertimelow bias of NorthernHemisphere CO in
global model studies
O. Stein et al.
Title Page
Abstract Introduction
Conclusions References
Tables Figures
J I
J I
Back Close
Full Screen / Esc
Printer-friendly Version
Interactive Discussion
Discussion
Paper
|D
iscussionP
aper|
Discussion
Paper
|D
iscussionP
aper|
Fig. 5. Monthly mean CO mixing ratios from the 67 surface stations available in WDCGG usedfor this study sorted for geographical latitude (black rhombi) and modelled near-surface mixingratios from simulation MI for the same locations (red triangles). Upper panel: January 2008;Lower panel: July 2008.
293

ACPD14, 245–301, 2014
On the wintertimelow bias of NorthernHemisphere CO in
global model studies
O. Stein et al.
Title Page
Abstract Introduction
Conclusions References
Tables Figures
J I
J I
Back Close
Full Screen / Esc
Printer-friendly Version
Interactive Discussion
Discussion
Paper
|D
iscussionP
aper|
Discussion
Paper
|D
iscussionP
aper|
Fig. 6. Monthly mean CO total column densities for January and July 2008 as calculated fromsimulation MI smoothed by MOPITT averaging kernels, and observed from MOPITT and IASI.
294

ACPD14, 245–301, 2014
On the wintertimelow bias of NorthernHemisphere CO in
global model studies
O. Stein et al.
Title Page
Abstract Introduction
Conclusions References
Tables Figures
J I
J I
Back Close
Full Screen / Esc
Printer-friendly Version
Interactive Discussion
Discussion
Paper
|D
iscussionP
aper|
Discussion
Paper
|D
iscussionP
aper|
▬▬ MI ▬▬ MI+AN ▬▬ MI+BIO ▬▬ MI+BB
Fig. 7. Bias of modelled 2008 monthly mean surface level mixing ratios from the MOZART sim-ulations MI, MI+AN, MI+BIO, and MI+BB compared to observations from WDCGG. n denotesthe number of stations used.
295

ACPD14, 245–301, 2014
On the wintertimelow bias of NorthernHemisphere CO in
global model studies
O. Stein et al.
Title Page
Abstract Introduction
Conclusions References
Tables Figures
J I
J I
Back Close
Full Screen / Esc
Printer-friendly Version
Interactive Discussion
Discussion
Paper
|D
iscussionP
aper|
Discussion
Paper
|D
iscussionP
aper|
▬▬ MOPITT - - - IASI ▬▬ MI ▬▬ MI+AN ▬▬ MI+BIO ▬▬ MI+BB
Fig. 8. CO total columns from MOPITT and IASI satellite observations compared to 2008monthly modelled columns from the MOZART simulations MI, MI+AN, MI+BIO, and MI+BB.
296

ACPD14, 245–301, 2014
On the wintertimelow bias of NorthernHemisphere CO in
global model studies
O. Stein et al.
Title Page
Abstract Introduction
Conclusions References
Tables Figures
J I
J I
Back Close
Full Screen / Esc
Printer-friendly Version
Interactive Discussion
Discussion
Paper
|D
iscussionP
aper|
Discussion
Paper
|D
iscussionP
aper|
▬▬ MI ▬▬ MI+VOC ▬▬ MI-DEP ▬▬ MI-OPT
Fig. 9. As Fig. 7, but simulations MI (red), MI+VOC (grey), MI-DEP (light blue), and MI-OPT(dark blue).
297

ACPD14, 245–301, 2014
On the wintertimelow bias of NorthernHemisphere CO in
global model studies
O. Stein et al.
Title Page
Abstract Introduction
Conclusions References
Tables Figures
J I
J I
Back Close
Full Screen / Esc
Printer-friendly Version
Interactive Discussion
Discussion
Paper
|D
iscussionP
aper|
Discussion
Paper
|D
iscussionP
aper|
Fig. 10. Annual CO anthropogenic emissions 2000–2050 from different sectors in the RCP8.5scenario, world-wide, for OECD countries and for Asia.
298

ACPD14, 245–301, 2014
On the wintertimelow bias of NorthernHemisphere CO in
global model studies
O. Stein et al.
Title Page
Abstract Introduction
Conclusions References
Tables Figures
J I
J I
Back Close
Full Screen / Esc
Printer-friendly Version
Interactive Discussion
Discussion
Paper
|D
iscussionP
aper|
Discussion
Paper
|D
iscussionP
aper|
▬▬ MOPITT - - - IASI ▬▬ MI ▬▬ MI-OPT
Fig. 11. As Fig. 8, but simulations MI (red) and MI-OPT (dark blue).
299

ACPD14, 245–301, 2014
On the wintertimelow bias of NorthernHemisphere CO in
global model studies
O. Stein et al.
Title Page
Abstract Introduction
Conclusions References
Tables Figures
J I
J I
Back Close
Full Screen / Esc
Printer-friendly Version
Interactive Discussion
Discussion
Paper
|D
iscussionP
aper|
Discussion
Paper
|D
iscussionP
aper|
Fig. 12. Monthly averaged CO profiles from MOZAIC ascents and descents at selected airportsevaluated at model levels (black solid lines). North_America composes of 6 airports in theUnited States and Canada, n is the total number of flights. The coloured lines depict modelresults interpolated to the same time and position from the simulations MI (red) and MI-OPT(blue). Horizontal lines give the range of the model results, black dotted lines the range of theMOZAIC observations.
300

ACPD14, 245–301, 2014
On the wintertimelow bias of NorthernHemisphere CO in
global model studies
O. Stein et al.
Title Page
Abstract Introduction
Conclusions References
Tables Figures
J I
J I
Back Close
Full Screen / Esc
Printer-friendly Version
Interactive Discussion
Discussion
Paper
|D
iscussionP
aper|
Discussion
Paper
|D
iscussionP
aper|
Fig. 13. Bias (MI-OPT – MI-DEP) of monthly mean surface level mixing ratios for January(left) and July (right) 2008. Top panels: Surface level CO absolute bias in ppb. Middle panels:Surface level ozone absolute bias in ppb. Bottom panels: OH relative bias in % and absoluteMI-DEP zonal mean in ppt at 700 hPa. July CO differences are always lower than 5 ppb and aretherefore not shown.
301