one hundred thirty-five copies of this report were printed
TRANSCRIPT

EVALUATION OF PERFORMANCE AND OPERATIONAL COSTS FOR THREE BIOLOGICAL NUTRIENT REMOVAL SCHEMES AT A
FULL-SCALE WASTEWATER TREATMENT PLANT
Karl G. Linden Department of Civil and Environmental Engineering
Duke University Durham, NC 27708
and
James M. Hawkins, and Mary P. Bonislawsky
Black & Veatch Charlotte, NC
The research on which this report is based was supported by funds provided by the North Carolina Urban Water Consortium through the Water Resources Research Institute of The University of North Carolina.
Contents of this publication do not necessarily reflect the views and policies of the Urban Water Consortium or the Water Resources Research Institute, nor does the mention of trade names or commercial products constitute endorsement by the State of North Carolina.
WRRI Project No. 50244
June 2001

One hundred thirty-five copies of this report were printed at a cost of $1 175.65 or $8.71 per copy.

ACKNOWLEDGMENTS
The research was carried out in the Department of Civil Engineering at The University of North Carolina at Charlotte, in the Department of Civil and Environmental Engineering at Duke University, and the McDowell Creek Wastewater Treatment Plant in Charlotte, NC. The authors would like to thank Dr. Helene Hilger, Dr. James Bowen, and Dr. Martin Kane at The University of North Carolina at Charlotte for their assistance in serving, along with Dr. Karl G. Linden and Mr. James M. Hawkins, on the masters thesis committee of Mary Bonislawsky. In addition the invaluable assistance of Mr. Pete Goins, Mr. Jerome Lucky and Mr. David Parker for their insight and technical support as a part of the project team is appreciated. The support of Mr. Don Brown and the entire McDowell Creek WWTP staff is greatly appreciated. This research was funded by the North Carolina Urban Water Consortium through the Water Resources Research Institute. We appreciate the use of McDowell Creek WWTP by Charlotte-Mecklenburg Utilities. For data and technical information pertaining to the other North Carolina utilities involved with this study, we would like to acknowledge Mr. Arthur White of Greensboro, Mr. Walter Gottschalk of Carrboro, Mr. Bill Telford of Durham, and Mr. Richard Alexander of Raleigh. Finally the authors would like to thank the anonymous reviewers of this final report for their insightful commentary and feedback on our work.


ABSTRACT
A two-year nutrient removal study was conducted at McDowell Creek Wastewater Treatment Plant in Charlotte, North Carolina. The overall objective of the research was to evaluate performance and operational costs for three biological nutrient removal schemes implemented at the plant, including documenting and monitoring effluent nitrogen and phosphorus levels for each configuration, and tracking the operations, maintenance and chemical input costs for operation. The nutrient removal schemes evaluated included the University of Cape TownNirginia Initiative Plant (UCTNIP) process, the Charlotte North Carolina (CNC) process, the modified Orange Water and Sewer Authority (OWASA) process, and the chemical phosphorus removal process. All processes were successful in removing phosphorus and nitrogen from the wastewater to meet permit limits of 1 mgL and 10 mgL for total phosphorus and nitrogen respectively. All processes required supplemental acetic acid feed to assist in anaerobic phosphorus release. Problems with process stability were encountered due to the plant expansion underway, and it was discovered that each process must be closely monitored to ensure efficient removal. Low levels of alum addition for phosphorus precipitation were necessary to meet regulatory limits during periods of instability.
(Biological Treatment, Wastewater, Nutrient Removal)


TABLE OF CONTENTS
LIST OF FIGURES vii
LIST OF TABLES xii
SUMMARY AND CONCLUSIONS Impact of BNR and Stringent Limits on McDowell Creek
RECOMMENDATIONS Continuation/lmprovement of Study The Future of McDowell Creek WWTP
INTRODUCTION Scope of Study Study Objectives Study Site Evaluation and Implementation of BNR Processes at Mallard Creek WWTP
BACKGROUND General Description of Biological Nitrogen Removal General Description of Biological Phosphorus Removal General Description of Chemical Phosphorus Removal
LITERATURE REVIEW Introduction Biological Nitrogen Removal Processes
Modified Ludzack-Ettinger (MLE) Process Four-Stage Bardenpho Process
Biological Phosphorus Removal Processes Optimizing Anaerobic Zone Performance Impact of Sidestream Effect of Anaerobic/Aerobic Contact Time on PAOs NOTM or Phoredox Process PhostripB Process
Processes that Remove Both Nitrogen and Phosphorus A~/OTM Process Five-Stage Bardenpho University of Cape Town (UCT) Process Modified University of Cape Town (MUCT) Process Virginia Initiative Plant (VIP) Process Orange Water and Sewer Authority (OWASA) Process Charlotte North Carolina (CNC) Process
Chemical and Biological Nutrient Removal
xiv xiv
xvi
vii

Treatment of Wastewater in Europe Utilizing Different Biological Phosphorus Removal Technologies
Cost Analyses of BNR Processes Operational Issues Associated with BNR Processes
B OD-Nutrient Ratios Storm Water Impacts Solid Issues Operational Issues Monitoring Needs
METHODS AND MATERIALS Experimental Design
Operation Sampling Procedure Performance Costs Laboratory Calculations Analytical Methods
RESULTS AND DISCUSSION Baseline Data
Phosphorus Theoretical Biological Phosphorus Release and Uptake in Relation
to VFA Feed Nitrogen COD Recycle Rates Second Treatment Train
Sidestream Effects Co-Thickening of WAS Digester supernatant Belt Press Filtrate Alum Addition
Example Calculations for Alum Addition Mechanical Failures Operational Failures
Phase 1 - Start Up and BNR Acclimation Phase 2 - Start Up and Operation of the UCTNIP Process Phase 3 - Operation of the UCTNIP Process with
Supplemental Chemical Phosphorus Removal Phase 4 - Start Up and Operation of the CNC Process Phase 5 - Start Up and Operation of the Modified OWASA Process Phase 6 - Re-evaluation of All Three BNR Process Configurations (UCTNIP,
CNC, Modified OWASA) for Comparison of Performance and Cost Process Differences
. . . Vll l

Temperature Flow Acetic Acid Waste Rate, SRT, MLSS
Phosphorus Release and Uptake Phosphorus Profiles Nitrogen Profiles Alkalinity Comparison of Performance Comparison of Operation Comparison of Cost Cost of Alum Addition
Summary of Phase 6 Phosphorus Release and Uptake Cost Comparison
Other NC Utilities Neuse River WWTP Mason Farm WWTP T.Z. Osbourne WWTP North Durham WWTP
REFERENCES
LIST OF PATENTS AND PUBLICATIONS
GLOSSARY
APPENDICES APPENDIX A: RAW DATA APPENDIX B: ALUM ADDITION APPENDIX C: SURVEY FORM FOR OTHER NC UTILITIES


LIST OF FIGURES
FIGURE 1 : Process Flow Schematic of the UCTNIP Process as Implemented at McDowell Creek WWTP
FIGURE 2: Process Flow Schematic of the Modified OWASA Process as Implemented at McDowell Creek WWTP
FIGURE 3: Process Flow Schematic of the CNC Process as Implemented at McDowell Creek WWTP
FIGURE 4: Overview of McDowell Creek WWTP Parallel Process Treatment Trains
FIGURE 5: The Bioreactor of a BNR System - Anaerobic, Anoxic and Aerobic Zones
FIGURE 6: The Relationship of Phosphorus and Organic Matter Metabolism in the Anaerobic and Aerobic Zones of the BNR Process
FIGURE 7: Schematic of the MLE Process
FIGURE 8: Schematic of the Four-Stage Bardenpho Process
FIGURE 9: Schematic of the A/OTM or Phoredox Process
FIGURE 10: Schematic of the PhostripO Process
FIGURE 1 1 : Schematic of the A~IOTM Process
FIGURE 12: Schematic of the Five-Stage Bardenpho Process
FIGURE 13 : Schematic of the UCT Process
FIGURE 14: Schematic of the MUCT Process
FIGURE 15: Schematic of the VIP Process
FIGURE 16: Schematic of the OWASA Process
FIGURE 17: Schematic of the CNC Process
FIGURE 18: Average Profile of COD Concentrations in All Operational Phases Throughout the Treatment Process (Day 1-541)

FIGURE 19: Comparison of Phosphorus Concentrations in Parallel Treatment Trains During Phase 2 on April 2 (Day 86)
FIGURE 20: Phosphorus Concentration (as PO4-P) of the Plant Influent and the Primary Clarifier Effluent During the First Month of Operation in Phase 2
FIGURE 2 1 : Phosphorus Profile Throughout the Plant During Phase 2 on February 22 (Day 47) After supernatant Addition fkom the Digesters to the Head of the Plant
FIGURE 22: Summary of Effluent Phosphorus Concentrations While Periodically Decanting the Digesters to the Head of the Plant During Phase 2
FIGURE 23: Phosphorus Profile Throughout the Plant During Phase 2 on March 20 (Day 73) After Filtrate Addition from the Belt Press to the Head of the Plant
FIGURE 24: Comparison of Treatment Process without Supplemental Acetic Acid (December 18, 1998) and with Supplemental Acetic Acid (February 6, 1999 - Day 3 1)
FIGURE 25: Typical Profile of Phosphorus, Nitrate, and Ammonia Throughout the lSt Treatment Train on Day 95 During the UCTNIP BNR Process Configuration (Phase 2)
FIGURE 26: Typical Profile of Phosphorus, Nitrate, and Ammonia Throughout the 2nd Treatment Train on Day 95 During the UCTNIP BNR Process Configuration (Phase 2)
FIGURE 27: Comparison of Phosphorus Concentrations Through Parallel Treatment Trains During Phase 3 on Day 140 When Acetic Acid was Not Fed to Train 1
FIGURE 28: Comparison of Phosphorus Concentrations During Phase 3 on Day 147 as Biological Removal Efficiency was Improved and Alum Feed was Reduced
FIGURE 29: Nitrate Concentrations Throughout the Treatment Process on Day 135 During Phase 3 When a Slug Input of Belt Press Filtrate was Added Directly to the Head of the Plant
xii

FIGURE 30: Nitrate Concentrations Throughout the Plant During Phase 3 on Day 142 When Use of Denitrification Filters Following Final Clarification was Necessary After a Slug Input of Belt Press Filtrate was Added Directly to the Head of the Plant
FIGURE 3 1 : Summary of Effluent Phosphorus Concentrations During Phases 2 and 3 (Day 1 - Day 238)
FIGURE 32: Summary of Effluent Nitrate Concentrations During Phases 2 and 3 (Day 1 - Day 238)
FIGURE 3 3 : Typical Profile of Phosphorus, Nitrate and Ammonia Throughout the Treatment Process on Day 274 During the CNC BNR Process Configuration (Phase 4)
FIGURE 34: Summary of Effluent Phosphorus Concentrations During Phase 4 (Day 239 - Day 323)
FIGURE 3 5 : Summary of Effluent Nitrate Concentrations During Phase 4 (Day 239 - Day 323)
FIGURE 36: Water Temperature During the CNC Process Evaluation (Phase 4, Day 239 - 323)
FIGURE 37: Phosphorus and Nitrate Data Collected during Efficient CNC Process Performance (Day 274) and Operational Failure (Day 303)
FIGURE 38: Preliminary Evaluation of First Stage (Modified OWASA) and Second Stage (UCTNIP) on Day 408 during Phase 5
FIGURE 39: Typical Profile of Phosphorus, Nitrate and Ammonia Throughout the Treatment Process on Day 433 During the Modified OWASA BNR Process Configuration (Phase 5)
FIGURE 40: Wastewater Temperature Throughout Phase 6
FIGURE 41 : Plant Influent Flow Throughout Phase 6
FIGURE 42: Comparison of Release and Uptake in the First and Second Treatment Trains on Day 52 of Phase 6 During the Modified OWASA Process Configuration
FIGURE 43 : Phosphorus Concentrations in the Primary Clarifier Effluent And Plant Effluent Throughout Phase 6

FIGURE 44: Phosphorus Release Versus Uptake for Each BNR Process During Phase 6
FIGURE 45: Phosphorus Release in the Anaerobic Zone Versus VFA Feed for Each BNR Process During Phase 6
FIGURE 46: Phosphorus Uptake in the Aerobic Zone Versus VFA Feed For Each BNR Process During Phase 6
FIGURE 47: Primary Clarifier Effluent Phosphorus Mass, Phosphorus Release in the Anaerobic Zone, and Phosphorus Uptake in the Aerobic Zone During Phase 6
FIGURE 48: Phosphorus Release in the Anaerobic Zone Versus Effluent Phosphorus Concentration for All BNR Processes During Phase 6
FIGURE 49: Profile of Average Phosphorus ( m a as PO4-P) Concentrations Throughout the Treatment Process for Each BNR Configuration During Phase 6
FIGURE 50: Profile of Average Phosphorus (lbs of PO4-P) Mass Throughout the Treatment Process for Each BNR Configuration During Phase 6
FIGURE 5 1 : Average Phosphorus Profile for the Modified OWASA Process During Phase 6. Error Bars for Each Point in the Treatment Process Represent the Standard Deviation
FIGURE 52: Average Phosphorus Profile for the CNC Process During Phase 6. Error Bars for Each Point in the Treatment Process Represent the Standard Deviation
FIGURE 53: Average Phosphorus Profile for the UCTNIP Process During Phase 6. Error Bars for Each Point in the Treatment Process Represent the Standard Deviation
FIGURE 54: Profile of Average Nitrate (mgL as NO3-N) Concentrations Throughout the Treatment Process for Each BNR Configuration During Phase 6
FIGURE 55: Profile of Average Nitrate (lbs as NO3-N) Mass Throughout the Treatment Process for Each BNR Configuration During Phase 6
FIGURE 56: Profile of Average Ammonia (mgL as NH3-N) Concentrations Throughout the Treatment Process for Each BNR Configuration During Phase 6
FIGURE 57: Profile of Average Ammonia (lbs as NH3-N) Mass Throughout the Treatment Process for Each BNR Configuration During Phase 6
xiv

FIGURE 58: Average Nitrate Profile for the Modified OWASA Process During Phase 6. Error Bars for Each Point in the Treatment Process Represent the Standard Deviation
FIGURE 59: Average Nitrate Profile for the CNC Process During Phase 6. Error Bars for Each Point in the Treatment Process Represent the Standard Deviation
FIGURE 60: Average Nitrate Profile for the UCTNIP Process During Phase 6. Error Bars for Each Point in the Treatment Process Represent the Standard Deviation 88
FIGURE 61 : Average Ammonia Profile for the Modified OWASA Process During Phase 6. Error Bars for Each Point in the Treatment Process Represent the Standard Deviation 89
FIGURE 62: Average Ammonia Profile for the CNC Process During Phase 6. Error Bars for Each Point in the Treatment Process Represent the Standard Deviation 89
FIGURE 63: Average Ammonia Profile for the UCTNIP Process During Phase 6. Error Bars for Each Point in the Treatment Process Represent the Standard Deviation 90
FIGURE 64: Alkalinity Concentrations Across the Anoxic and Aerobic Zones for Each BNR Process Configuration During Phase 6 92
FIGURE 65: Cost per Million Gallons for Blower Operation, Treatment and Acetic Acid Feed for the UCTNIP, CNC and Modified OWASA Processes 94


LIST OF TABLES
TABLE 1: NPDES Permit Limits for McDowell Creek WWTP
TABLE 2: Summary of BNR Process Zones
TABLE 3: Summary of BNR Process Advantage and Disadvantages
TABLE 4: Summary of BNR WWTPs by Process Type
TABLE 5: Summary of Reported BNR O&M Costs (adapted from Reardon, 1994)
TABLE 6: BNR Cost Factors
TABLE 7: Summary of Sampling Locations
TABLE 8: Maximum, Minimum, and Average COD concentrations in all Operational Phases Throughout the Treatment Process (Day 1 - Day 541)
TABLE 9: Grab Sample Concentrations of the RAS During the Modified OWASA BNR Process Configuration
TABLE 10: Comparison of cfm and amps Recorded During the UCTNIP Process While Configured in Air-Flow Mode and Automatic DO Mode
TABLE 11: Average MLSS, SRT, and Waste Rate for Each BNR Process Configuration During Phase 6
TABLE 12: Average Flow (mgd) in Each Zone for Each BNR Configuration
TABLE 13: Mean (Standard Deviation) for Each Phosphorus Point in the Treatment Process for Each BNR Configuration During Phase 6
TABLE 14: The Minimum, Maximum, Median, and Average Phosphorus Concentrations for Each Point in the Treatment Process for Each BNR Configuration During Phase 6
TABLE 15: Mean (Standard Deviation) for Each Nitrate Point in the Treatment Process for Each BNR Configuration During Phase 6
TABLE 16: Mean (Standard Deviation) for Each Ammonia Point in the Treatment Process for Each BNR Configuration During Phase 6
xvii

TABLE 17: The Minimum, Maximum, Median, and Average Nitrate Concentrations for Each Point in the Treatment Process for Each BNR Configuration During Phase 6
TABLE 18: The Minimum, Maximum, Median, and Average Ammonia Concentrations for Each Point in the Treatment Process for Each BNR Configuration During Phase 6
TABLE 19: Comparison of Cost Per Million Gallons Treated for Each BNR Process 93
TABLE 20: Comparison of BNR costs at McDowell Creek WWTP to BNR costs reported by Reardon (1 994)
TABLE 2 1 : Process Comparison Matrix for NC Utilities 98
xviii

SUMMARY AND CONCLUSIONS
Three different BNR processes were studied over 2 years. The UCTNIP process was on-line for approximately 18 months, the CNC process was on-line for approximately 4 months, and the modified OWASA process was on-line for approximately 2 months. The original objective was to operate each BNR process for the same amount of time. However, this was not possible due to operational issues, continuing upgrades, commitment to effluent quality, and time constraints. The UCTNIP process appeared to be the most stable of the three processes; therefore, plant operators preferred that this process remained on-line throughout most of the study.
Each BNR process was analyzed similarly by profiling nutrients throughout the treatment train and documenting chemical usage and power consumption. On a cost basis, there was not a significant difference between processes. The ability to meet effluent limits, with the least operational difficulty, became priority.
Two sidestream processes (CNC and modified OWASA) and one mainstream process (UCTNIP) were analyzed. At McDowell Creek WWTP, it appeared as if the mainstream process was more stable than the sidestream processes. The disadvantages to using a mainstream process result from the influent wastewater flow being routed through the anaerobic zone. During high flows, unstable conditions may occur. Influent wastewater may contain high levels of DO or low substrate levels. If these situations occurred regularly, it would be more efficient to switch to a sidestream process where the anaerobic zone is protected fiom the influent flow.
Nitrogen removal at McDowell Creek WWTP was achieved without much emphasis on process control. Because the phosphorus limits were the more stringent, process control focused on phosphorus removal. In general, sidestream processes appear to work better in the warmer summer months, whereas the UCTNIP process was favored in the colder winter months.
Results of the cost comparison indicated that costs do not vary significantly between the three BNR processes. Acetic acid and alum are the chemical additions that increase operational costs. Optimization and further analysis of chemical addition is necessary.
IMPACT OF BNR AND STRINGENT NUTRIENT LIMITS ON MCDOWELL CREEK
Prior to May 1, 1999, McDowell Creek WWTP did not have total phosphorus or nitrogen limits. A water quality monitoring program has been ongoing jointly between the NC Division of Water Quality and the Mecklenburg County Department of Environmental Protection (MCDEP). The water in McDowell Creek and McDowell Cove in Mountain Island Lake had been identified as having only faidgood water qualit;.. Water quality indices from Mountain Island Lake in 1999 ranged from fair to excellent. Poorer ratings were seen in McDowell Creek Cove due primarily to higher nutrient levels and algae growth in the cove. MCDEP has established a water quality index based on a scale of 1 to 100, with 50 as fair and 100 as excellent water quality. In 1999, the annual average water quality indices in McDowell Creek and in the McDowell Creek cove were 66 and 64, respectively (MCDEP, 2000).
Water quality in McDowell Creek Cove has frequently been rated of poorer quality than the rest of Mountain Island Lake, due to point source inputs of nutrients fiom McDowell Creek WWTP and
xix

nonpoint source inputs of nutrients fiom surface runoff. However, these treatment plant nutrient inputs were reduced once BNR was implemented, and the state of North Carolina placed limits on the amount of phosphorus and nitrogen that can be discharged by the plant (MCDEP 2000).
The McDowell Creek Monitoring Plan was initiated in November 1998. The objective of the study was to assess the effectiveness of nutrient removal systems installed at McDowell Creek WWTP at reducing nutrient levels and improving water quality conditions in McDowell Creek and McDowell Creek Cove. In order to accomplish this objective, additional monitoring upstream and downstream of the WWTP discharge was performed by MCDEP (MCDEP 2000).
Since the implementation of nutrient removal, the total phosphorus levels in McDowell Creek downstream of the WWTP discharge have decreased dramatically. The decrease of total phosphorus concentrations in lower McDowell Creek fiom November 1998 - November 1999 was approximately 3 mg/L. The concentration of total phosphorus in McDowell Creek continues to remain below MCDEP action level for streams (0.5 m e ) . While the water quality rating at the sampling location in McDowell Creek Cove improved slightly this year, it still ranks below other locations on the lake. It may be several years before the full effect of this reduction is seen due to stored nutrients in the sediments of the cove and nonpoint inputs fiom the McDowell Creek Watershed (MCDEP 2000).

RECOMMENDATIONS
The results of the study showed that BNR is more sensitive than conventional treatment and must be monitored closely to achieve efficient operation. Operation of WWTPs is site-specific, thus a significant period of trial must be completed before performance optimization can properly be assessed and assured over the long-term.
Regular maintenance inspections are necessary to ensure proper mechanical performance. If a pump or mixer breaks down, it usually leads to operational failure. Keeping backup pumps available (when reasonable) may help ensure quality mechanical performance. Optimization of chemical inputs, such as acetic acid and alum, is necessary after steady state operation of the BNR process has been achieved. Belt press filtrate and any other return streams must be monitored and regulated as closely as possible to eliminate slug inputs of nutrients that may lead to upsets in the BNR balance.
CONTlNUATION/IMPROVEMENT OF STUDY
A continuation of the study would provide more conclusive data for the BNR processes at McDowell Creek WWTP. Now that all of the baseline data have been collected, continuing the study would focus on optimizing each BNR process over a longer time period and comparing under equal operating conditions. Due to uncontrollable operational upsets and continuing upgrades, an extensive long-term study was not possible during the period of work described herein.
THE FUTURE OF MCDOWLL CREEK WWTP
Black & Veatch (2000) will expand McDowell Creek WWTP to 15 mgd capacity by 2005. In light of the current operational issues the facility has encountered, many upgrades will be included in the expansion. The expansion of the McDowell Creek WWTP is planned in two phases. The first phase will increase the plant capacity to 9 mgd. Proposed improvements for the first phase will include a new 3-mgd basin to implement 5-stage BNR, membrane filtration, permanent belt filter presses for dewatering, thickening equipment to eliminate co-thickening in the primary clarifiers, a filtrate equalization basin, sidestream treatment for dewatered sludge filtrate, and electrical and instrumentation system improvements. The alum feed system will be upgraded so alum feed can be initiated to the primary clarifiers or to the final clarifiers. Multiple alum dosage points offer maximum flexibility in meeting effluent phosphorus limits. The flexibility offered is to use one or both of the dose points to optimize phosphorus removal performance. A five-stage BNR configuration is planned to increase denitrification in the biological basin and to minimize tertiary denitrification filter usage. If the tertiary denitrification filters are overfed acetic acid, the result could be an excessive amount of BOD in the plant effluent, which may result in violation of permit limits.
The second phase will increase the plant capacity to 15 mgd. Proposed improvements for the second phase will include storm equalizatiodday tank basin, two additional new 3-mgd basins to implement 5-stage BNR, a new anaerobic digester, standby power improvements, electrical and instrumentation system improvements, and new maintenance facilities.
xxi

Construction of the 9 mgd improvements is expected to begin in December 2001 and will overlap with construction of the 15 mgd improvements, which are expected to begin in June 2002. The proposed two-phase expansion is expected to have the capacity to service the area through 2029. When applying for new NPDES permit limits, it is expected that the concentration of nutrients permitted for discharge to McDowell Creek will decrease in order to maintain the mass of nutrients currently discharged into the stream. These plant modifications will provide improved effluent quality, particularly for solids and nutrients. The microfiltration equipment will eliminate virtually all solids in the plant discharge. The fmal design of the plant improvements will ensure compliance with all applicable regulations, particularly in regard to the water quality in McDowell Creek and Mountain Island Lake.
xxii

INTRODUCTION
Eutrophication is the process by which a body of water undergoes an input of excessive nutrients, primarily nitrogen and phosphorus, initiating a sequence of algal growth (bloom) and decay that ultimately depletes oxygen and alters biodiversity. Some algae species may produce toxins that lead to fish lesions and threaten local economy and health. Algal blooms can reduce water quality to the point where it is no longer suitable as a drinking water source, even after treatment (Hecky and Glham, 1988).
Inputs from both point and non-point sources may elevate nutrient levels in lakes and rivers. Stormwater run-off is typically the most significant contributor in wet weather conditions, and wastewater treatment plants (WWTPs) are often the major contributors in dry weather conditions. The level of impact in the receiving water is not only dependent on pollutant loading, but also the degree of dispersion and dilution available, as well as the characteristics of the specific aquatic ecosystem. Nutrient levels in rivers and streams are fundamentally linked to flow conditions. Especially during periods of low flow, fine sediment, organic matter, and sediment-bound phosphorus accumulate within rivers and streams, increasing nutrient levels. Inputs from WWTPs are diluted less when stream flows are low (Hecky and Kilham, 1988).
Concerns over nutrient enrichment of surface waters with nitrogen and phosphorus loads from both point and non-point sources are growing in North Carolina and elsewhere. Because of these concerns, WWTPs are facing stringent limits on concentrations of effluent nutrients discharged into nutrient sensitive waters. To control wastewater nutrient inputs, a number of biological and chemical processes may be utilized at a wastewater treatment facility.
Early wastewater treatment systems were designed to remove organic matter. As industrialization and population growth continued, design of wastewater treatment systems began focusing on removing the nutrients that cause eutrophication. Research during the last two decades has focused on processes to remove nutrients in a cost effective and efficient manner (Grady et al., 1999).
Much research has resulted in the development of numerous nutrient removal processes. The basic activated sludge process is a flexible, reliable process capable of removing soluble organic matter, stabilizing insoluble organic matter, and achieving a high degree of nitrification. The addition of denitrification and phosphorus removal to the activated sludge process was necessary to prevent discharges of high nutrient concentrations to receiving waters. This need led to the development of biological nutrient removal (BNR). BNR is a modification of the basic activated sludge process and is distinguished by the division of the bioreactor into alternative biochemical environments. BNR systems are capable of removing a high degree of nitrogen and phosphorus from the wastewater. Supplemental chemical additions may also be utilized, depending on the degree of removal to be achieved (Grady et al., 1999).
Charlotte-Mecklenburg Utilities operates five WWTPs that serve the City of Charlotte and Mecklenburg County, North Carolina. The City is in the process of evaluating operations at all of the WWTPs it controls to optimize performance and lower costs while meeting regulatory water quality limits. The purpose of this research was to achieve steady state operation for three BNR process configurations and evaluate cost and operating differences at McDowell Creek

WWTP. Although not a primary research objective, the results of the research may be usehl in developing an operational plan that will determine the seasonal and flow-based operation. This study was unique because it evaluated the performance and operations and maintenance costs associated with distinct modes of BNR at a single WWTP, thus eliminating confounding variables such as differences in flow treated, influent characteristics, and environmental factors. It also s p a ~ e d a timeframe that allows for variations in seasons and inflow.
SCOPE OF STUDY
This study was designed to provide information on the performance, and operations and maintenance costs associated with three modes of BNR at McDowell Creek WWTP. The plant discharges to the nutrient sensitive waters of Mountain Island Lake, one of three City of Charlotte drinking water supplies. In 1995, when applying for an expansion to treat and discharge 6.0 million gallons per day (mgd) of wastewater effluent, McDowell Creek WWTP was issued a National Pollutant Discharge Elimination System (NPDES) permit with total nitrogen and phosphorus limits, shown in Table 1. These limits are required to protect and maintain the water quality in Mountain Island Lake. To meet the discharge limits, the plant expansion included development of the capability for biological nitrogen and phosphorus removal as well as chemical phosphorus removal. The BNR modifications provide flexibility to operate the plant in one of several different BNR configurations.
Table 1. NPDES Permit Limits for McDowell Creek WWTP.
I Permit Limits I Parameter
low (MGD)' BOD5 (mgl~)'
1 monthly average 2 monthly average based on 5 composite samples per week 3 monthly average based on weekly composite samples
Total Nitrogen ( r n g l ~ ) ~
Total Phosphorus ( m a l ~ ) ~
The three modes of BNR implemented in this study were the University of Cape TownNirginia Initiative (UCTNIP) process (Figure I), and the modified Orange Water and Sewer Authority (OWASA) process (Figure 2), and the Charlotte North Carolina (CNC) process (Figure 3). These processes differ mainly in their recycle piping arrangement and mainstream flow pattern. Operational modifications deemed necessary for optimizing performance over a variety of seasonal, flow, and sidestream conditions were implemented. This study has also documented, for the first time, the steady state performance of the CNC process (submitted for a patent by Black & Veatch in 1995).
Summer
6.0 5.0
Winter
6.0 10.0
10.0
1 .O
10.0
1 .O

Anaerobic 7 , n . u - Anoxic Zone -
Aerobic Effluent A
1 2 Zone
7 Nitrified Recycle Optional
Alum Feed Optional VFA Feed
Denitrified Recycle
Return Activated Sludge Waste Sludge .
Primary Treated Influent
Figure 1. Process flow schematic of the UCTNIP process as implemented at McDowell Creek WWTP.
Anaerobic
Primary Treated Influent
Return Activated Sludge
Anoxic Zone
VFA Feed
Figure 2. Process flow schematic of the modified OWASA process as implemented at McDowell Creek WWTP.
Aerobic Effluent A
Zone
bL
1
Nitrified Recycle
2
Optional Alum Feed

Anaerobic
Primary Treated Influent
Aerobic
Nitrified
I I Recycle
Denitrified
Return
VFA Feed
Optional Alum Feed
Qctivated Sludge Waste Sludge b
Figure 3. Process flow schematic of the CNC process as implemented at McDowell Creek WWTP.
The ability of each BNR mode to produce effluent that could meet nitrogen and phosphorus NPDES limits over long-term steady-state operation was evaluated. An attempt was made to identify the least cost mode of BNR that maintained compliance with existing discharge limits. However, confounding factors, as discussed in the report, did not allow an absolute direct comparison among the BNR processes regarding cost and performance trade-offs. Data describing the performance, and operations and maintenance costs of nutrient removal schemes at treatment plants operated by the City of Raleigh, City of Durham, Orange Water and Sewer Authority (OWASA), and City of Greensboro were also reviewed. The City of Charlotte and other municipalities across the State may utilize the information to evaluate nutrient removal options for wastewater treatment plants attempting to meet stringent nutrient discharge limits.
This study involved the cooperation of Charlotte-Mecklenburg Utilities, operators and staff at McDowell Creek WWTP, faculty at the University of North Carolina at Charlotte, faculty at Duke University, and engineers from Black & Veatch Consulting Engineers (Charlotte, NC). During the first part of the research effort, McDowell Creek WWTP was still undergoing upgrades. The data collected during this portion of the research effort was used to draw conclusions pertaining to the operation of each process implemented, but a comparative analysis of the data was not performed due to the continuing upgrades.

STUDY OBJECTIVES
The goal of this research was to determine the least cost mode of BNR for the McDowell Creek WWTP while meeting NPDES permit limits. The specific objectives of the research were:
To achieve steady state operation at full-scale for three different BNR configurations (UCTNIP process, CNC process, modified OWASA process).
To document and monitor effluent nitrogen and phosphorus levels for each BNR configuration.
To track the operations, maintenance, energy utilization (for aeration and pumping), and chemical input costs for each BNR configuration.
To compare the cost and performance of the nutrient removal configurations.
To document the cost and performance data for nutrient removal processes operated by the wastewater utilities in the City of Raleigh, City of Durham, City of Greensboro, and the Orange County Water and Sewer Authority.
To develop a plan for operation of the BNR configuration at McDowell Creek WWTP that will define the optimum seasonal, flow and sidestream-based operation.
STUDY SITE
The McDowell Creek Watershed covers 28 square miles, and it is located in one of Mecklenburg County's most rapidly growing areas. These changes have led to an increased need to preserve water quality. The stringent NPDES permit limits (based on an average daily flow of 6.0 mgd) for McDowell Creek WWTP became effective May 1, 1999.
The McDowell Creek WWTP is located in northern Mecklenburg County and began operation in 1979. The plant receives primarily domestic wastewater and was originally designed to provide advanced treatment with complete nitrification at an average daily flow of 3.0 mgd. In 1999, the plant was expanded to implement BNR activated sludge tertiary treatment for discharge into McDowell Creek, which empties into Mountain Island Lake, one of three City of Charlotte drinking water supplies. Flow through the plant is equally routed through two identical treatment trains. An overview of McDowell Creek WWTP is illustrated in Figure 4.

Anoxic 1
Anoxic 2
Aerobic
Aeration Basin
Aeration Basin
Primary
Influ
-
TREATMENT TRAIN 1
TREATMENT TRAIN 2
Anaerobic
Anoxic 2
Aerobic 7 Aeration
Basin
D- Nite Filters
U fl
Sludge Holding
Figure 4. Overview of McDowell Creek WWTP parallel process treatment trains.
EVALUATION AND IMPLEMENTATION OF BNR PROCESSES AT MALLARD CREEK WWTP
The UCT and OWASA processes are two of the several schemes and variations of BNR processes available that are used at North Carolina WWTPs. Hawkins et al. (1996) developed the CNC process at Mallard Creek WWTP in Charlotte. The process was evaluated at Mallard Creek WWTP in 1994 and was implemented at McDowell Creek WWTP during this research for evaluation and comparison with other BNR schemes.
Mallard Creek WWTP is a conventional activated sludge tertiary treatment plant. In the late- 1 98Os, Charlotte-Mecklenburg Utilities decided to implement BNR treatment at Mallard Creek WWTP in anticipation of regulations limiting the discharge of nutrients in the future. The initial goal was to gain operating experience prior to mandated discharge limits.
Mallard Creek WWTP and McDowell Creek WWTP are both capable of implementing several modes of BNR operation, including (1) VIP process, (2) UCT process, (3) modified UCT process, (4) modified OWASA process, and (5) CNC process. These activated sludge processes have been developed to remove phosphorus andlor nitrogen from wastewater employing anaerobic-anoxic-aerobic process treatment.

Evaluation of the CNC process began at Mallard Creek WWTP in 1995 but was discontinued after several months. Charlotte-Mecklenburg Utilities priorities changed with the advent of city council mandate to privatize city services and focus was changed to optimizing plant operation and reducing costs. Evaluation of the various BNR processes was scheduled to resume after the BNR upgrade was complete at McDowell Creek WWTP in 1998. Some of the data and information collected during the 1995 trials at the Mallard Creek WWTP were applicable to the McDowell Creek WWTP expansion project that began in 1995 (Hawkins et al., 1996).
Nitrogen process data was collected while operating in VIPIMUCT and CNC process modes. Both processes yielded similar removal efficiencies, which was expected because their flow schemes for nitrification and denitrification are similar. Very little phosphorus process data was collected during the BNR evaluation due to mixing problems in the anaerobic zone, and supplemental volatile fatty acid (VFA) feed to the anaerobic zone was not implemented.
During the Mallard Creek WWTP trials, it was noted that flow and load variation could adversely impact phosphorus release in the anaerobic zone with the UCT and VIP processes. The modified OWASA process was unable to achieve simultaneous low effluent phosphorus and nitrogen. Insufficient data was collected during these trials to determine the operational parameters of the CNC process for phosphorus removal. For nitrogen removal, the parameters required for CNC operation are similar to the BNR processes using similar nitrificatioddenitrification schemes.


BACKGROUND
Biological nutrient removal (BNR) systems are modifications of the basic activated sludge process. In the basic activated sludge process, a flocculent slurry of microorganisms (mixed liquor) is maintained in an aerated bioreactor to remove soluble and particulate organic matter from the influent waste stream. Subsequent quiescent settling in a clarifier is used to recover the biological floc from the process flow stream. Return activated sludge (RAS) is the settled solids that are recycled as concentrated slurry from the clarifier back to the bioreactor. Waste activated sludge (WAS) is the excess solids that are wasted to maintain a designated solids retention time (SRT) to a desired value (Grady et al., 1999).
The distinguishing feature of a BNR system is the division of the bioreactor to provide alternative biochemical environments. A BNR system may consist of biological phosphorus removal, biological nitrogen removal, or both biological phosphorus and nitrogen removal. The bioreactor may be divided into anaerobic, anoxic, and aerobic zones, with provision for biomass recycle, as illustrated in Figure 5. The terminal electron acceptor utilized distinguishes these zones. Oxygen is the electron acceptor in the aerobic zone, while nitrate is used as the electron acceptor in the anoxic zone, and neither oxygen nor nitrate is present for respiration in the anaerobic zone (Grady et al., 1999).
Influen Effluenl Anaerobic Anoxic Aerobic Clarifier j
Nitrified I Recycle I
Return Activate1 d Sludge Waste Sludge _______)
Figure 5. The bioreactor of a BNR system - anaerobic, anoxic, and aerobic zones.
The anaerobic zone provides favorable conditions for the growth of phosphorus accumulating organisms (PAOs). The aerobic zone provides oxygen for respiration and nitrification, and it is instrumental in phosphorus removal by PAOs. At the end of the aerobic zone, the biomass is rich with PAOs, which is the mechanism by which phosphorus is removed from the wastewater. Phosphorus removal is achieved when excess solids are removed in the WAS. In the anoxic zone, nitrate can be used for anaerobic respiration, which allows for denitrification, thereby removing nitrogen as nitrogen gas (N2). The aerobic zone is necessary for the growth of

nitrifying bacteria and PAOs and BOD removal. Table 2 summarizes the biochemical transformations occurring in the various zones of a BNR process (Grady et al., 1999).
Table 2. Summary of BNR Process Zones.
( Zone 1 I(
Fermentation of readily biodegradable matter by heterotrophic bacteria
Denitrification
1 ~ i t rogen removal
Biochemical Transformation
Uptake and storage of VFAs by PAOS
I Anoxic Alkalinity production
Nitrification Metabolism of stored and exogenous substrate by PAOs
Phosphorus uptake consumption
I ~ i t r o ~ e n removal
Selection of P A O ~ Conversion of nitrate to nitrogen gas Selection of denitrifying bacteria
Conversion of ammonia to nitrite and nitrate Nitrogen removal through gas stripping
Formation of polyphosphate Phosphorus removal
Functions
Phosphorus removal
GENERAL DESCRIPTION OF BIOLOGICAL NITROGEN REMOVAL
Zone Required for
Nitrogen removal occurs through the processes of nitrification and denitrification. Nitrification is the biological oxidation of ammonia to nitrate by aerobic nitrifying organisms (N&+ 3 NO2- 3 NO^-^). It is a two-step autotrophic reaction that occurs in the aerobic zone. Nitrosomonas species oxidize ammonia to nitrite, using oxygen and producing acid. Nitrobacter species oxidize nitrite to nitrate using oxygen. Nitrosomonas obtains more energy per mole of nitrogen oxidized than Nitrobacter. Assuming that the cell synthesis per unit of energy produced is equal, there should be greater mass of Nitrosomonas formed than Nitrobacter per mole of nitrogen oxidized. Nitrobacter is more sensitive to changes in environmental conditions, such as low dissolved oxygen or an extreme pH, than Nitrosomonas. Nitrifying organisms have a slow growth rate, and do not form floc. They are trapped in the floc created by heterotrophic organisms. If there is insufficient carbonaceous biochemical oxygen demand (cBOD) to form a good biological floc, the nitrifying organisms can be washed out of the system. A longer SRT must be utilized to keep the nitrifying organisms in the system (Argaman et al., 1991).
Biological denitrification converts nitrate or nitrite to nitrogen gas (NO3- 3 NO? 9 N2). A relatively broad range of bacterial species, including Psuedomonas, Micrococcus, Archromobacter and Bacillus accomplishes biological denitrification. These groups accomplish nitrate reduction by dissimilation, a process whereby nitrate or nitrite replaces oxygen in the respiratory processes of the organism under anoxic conditions. Because of the ability of these organisms to use either nitrate or oxygen as the terminal electron acceptors while oxidizing organic matter, these organisms are termed facultative heterotrophic bacteria (Argaman et al., 1991).

When using an alternating aerobic-anoxic sequence, the influent wastewater is the primary organic carbon source for denitrification. In the first anoxic zone, the denitrification rate is rapid because of the readily biodegradable substrate available from the influent wastewater. The denitrification rate in the second anoxic zone is usually much slower because the concentration of biodegradable substrate is low. Alternative organic carbon sources, such as methanol, acetone, acetate and ethanol can also be used. During denitrification, organic carbon is consumed and alkalinity is produced. However, the alkalinity added is insufficient to offset the alkalinity loss caused by nitrification. A supplemental alkalinity source, such as lime, may be required (Argaman et al., 1991).
The final aerobic zone is responsible for stripping the inert nitrogen gas generated by denitrification. The nitrogen gas escapes to the air. Since the air is 79% nitrogen, N2 h m denitrification is readily assimilated into the atmosphere and is not considered a pollutant (Argaman et al., 1991).
GENERAL DESCRIPTION OF BIOLOGICAL PHOSPHORUS REMOVAL
Phosphorus is found in wastewater in three principal forms: orthophosphate (ortho-P) ions, polyphosphates, and organic phosphorus compounds. During wastewater treatment, significant changes take place. Much of the polyphosphate and organic phosphate content is converted to ortho-P, and inorganic phosphates are utilized in forming biological floc. Treatment plant removal efficiency must be based on total phosphorus entering the plant in the raw wastewater and total phosphorus discharged in the plant effluent (Grady et al., 1999).
Biological phosphorus removal is a two-step process of microbial phosphorus release and uptake under alternating anaerobic and aerobic conditions. It is accomplished by certain facultative anaerobes, such as Acinetobacter, which are capable of accumulating phosphorus. PAOs possess a metabolic capability not commonly found in other bacteria. The PAOs store the inorganic phosphate as polyphosphate, and have the ability to uptake quantities of phosphorus in excess of their synthesis requirements ("luxury uptake"). The uptake occurs in the aerobic zone following exposure to anaerobic conditions. Although this increases the phosphorus content of the activated sludge, the intercellular phosphorus is ultimately removed from the wastewater as the phosphorus-rich bacteria are captured in the secondary clarifier (Barnard, 1976).
PAOs are present in significant numbers in the aeration tank of activated sludge systems. They will store large quantities of phosphate when they are subjected to alternating anaerobic and aerobic conditions by being recycled between these two zones. The anaerobic zone provides the selective advantage for the PAOs by allowing them to grow at the expense of other oxygen- dependent heterotrophic bacteria. Oxygen and nitrate are absent in the anaerobic zone, therefore, no terminal electron acceptor is present. This makes it impossible for most species of heterotrophic bacteria to transport and store or metabolize organic matter. Facultative heterotrophs can carry out fermentation reactions, which is the anaerobic oxidation of carbon compounds by enzyme actions, resulting in the production of volatile fatty acids (VFAs). Fermentation also occurs in the sewer if detention times are long enough, resulting in a high influent VFA concentration (Argaman et al., 1991).

PAOs are able to take up VFAs and store them as poly-P-hydroxybutyrate (PHB) and other carbon storage polymers, using energy from the cleavage of intracellular polyphosphate, releasing inorganic phosphate. The VFAs are then unavailable to the other heterotrophic bacteria, leaving only the slowly biodegradable substrate when the mixed liquor suspended solids (MLSS) flow into the aerobic tank. In the aerobic basin, the PAOs use the stored substrate (VFA) for growth and to provide energy for reforming polyphosphate from inorganic phosphate, and it is at this point that the "luxury uptake" occurs. Figure 6 shows the relationship between phosphorus and organic matter metabolism in the anaerobic and aerobic zones of the biological phosphorus removal process. In the anaerobic zone, the PAOs transport and store VFAs into the cell, releasing inorganic phosphate. In the aerobic zone, the PAOs use the stored substrate for growth and energy for reforming polyphosphate from inorganic phosphate in the wastewater (Grady et al., 1999).
Substrate
Short-Chain Fatty Acids
-+ - Fermentation
Products
I Facultative PAOs Bacteria
ANAEROBIC New Cell
C 0 2 + H20 AEROBIC Production
Figure 6. The relationship of phosphorus and organic matter metabolism in the anaerobic and aerobic zones of the BNR process.
PAOs can only transport and store the short chain VFAs in the anaerobic zone. The fermentation that produces VFAs proceeds at a slower rate than the uptake of WAS, and it can be the rate limiting reaction in the anaerobic zone. A supplemental source of WAS, such as acetic acid or propionic acid, can be provided from an external source. A supplemental source of VFAs is common in treatment processes using solely biological phosphorus removal (Grady et al, 1999).
Nitrification can adversely impact biological phosphorus removal if the nitrate produced is recycled to the anaerobic zone. Denitrifying bacteria will compete with the PAOs for WAS, and interfere with the selector effect of the process. Denitrifying bacteria will utilize the W A S for denitrification. As a result, fewer PAOs will grow, the phosphorus content of the MLSS is decreased, and the efficiency of phosphorus removal declines (Barnard, 1985).

GENERAL DESCRIPTION OF CHEMICAL PHOSPHORUS REMOVAL
In utilizing chemical precipitation for phosphorus removal, the ortho-P is the easiest form to precipitate. Typical agents used to precipitate dissolved phosphorus are salts of calcium ( ~ a ' ~ ) , iron (either ~ e ' ~ or ~ e + ~ ) , or aluminum [either alum, A12(S04)3* 18 H20 or sodium aluminate, Na2A1204]. The most commonly used chemicals for phosphorus removal are alum and ferric chloride (USEPA, 1987b). They may be added at any suitable point in a treatment plant. The concentration of phosphorus species in the influent wastewater and the degree of removal required determine the quantity of chemical addition. Other factors, such as pH, alkalinity, ratio of metal salt to phosphorus, intensity of mixing, and the presence of interfering substances, will also affect the quantity of chemical required to attain a specific phosphorus reduction. Conditions vary between treatment plants, so site specific dose rates should be determined using jar tests, pilot plants, or hll-scale studies. Besides forming precipitates, these agents also improve the flocculation of suspended solids, which enhances their settling.


LITERATURE REVIEW
INTRODUCTION
Aerobic, anoxic and anaerobic zones form the basis for BNR systems, which were conceptualized in the 1960s. Initially, BNR was discussed extensively in the literature but received little full-scale use due to high capital and operating costs. To implement BNR, a WWTP upgrade is required to operate in the BNR configurations, which can be quite costly, depending on the size of the plant. For more than a decade the mechanisms of phosphorus removal were poorly understood. The first commercial biological phosphorus removal process, the Phostrip@ process, incorporated both biological and chemical phosphorus removal. With this background, the basic concepts were integrated into the single-sludge biological phosphorus and nitrogen removal processes.
The initial advances in BNR came from work done by Barnard (1975), who integrated aerobic and anoxic zones, along with nitrate recycle, to create the effective and cost competitive single- sludge nitrogen removal system. This process is now known as the four-stage Bardenpho process. Barnard (1976) observed that biological phosphorus removal would occur in these systems if nitrate were sufficiently depleted in the initial anoxic zone. An initial anaerobic zone was added to the nitrogen removal system to obtain the five-stage Bardenpho process, which removes both nitrogen and phosphorus.
Many BNR system variations have been developed since that time because further study of the mechanisms, microbiology, stoichiometry, and kinetics of BNR systems has lead to the development of many system variations. A sufficient understanding of BNR systems has allowed the design and operation of facilities that achieve reliable and predictable results. The following review of biological nitrogen and phosphorus removal was adapted from Grady et al., 1999, Argaman et al., 199 1, Brown and Caldwell 1997, and Droste 1997.
BIOLOGICAL NITROGEN REMOVAL PROCESSES
Numerous configurations of biological nitrogen removal processes are possible, resulting in a variety of performance capabilities and operational characteristics. Biological nitrogen removal processes incorporate an aerobic zone for nitrification and an anoxic zone for denitrification. Mixed liquor recycled to the anoxic zone transfers the nitrate produced in the aerobic zone to the anoxic zone for denitrification.
Modified Ludzack-Ettinger (MLE) Process
The MLE process is a simple process where nitrification and denitrification occur. Two bioreactors are arranged in series, as illustrated in Figure 7. The first bioreactor maintains an anoxic zone, the second bioreactor maintains an aerobic zone, and aerated mixed liquor is recycled back to the anoxic zone. Nitrification occurs in the aerobic zone, and nitrates are recycled in the mixed liquor to the anoxic zone for denitrification. The biodegradable carbonaceous substrate present in the influent wastewater acts as an electron donor for denitrification, which occurs readily.

Because nitrification occurs in the last bioreactor (aerobic zone), reductions in the effluent nitrate concentration are limited by the recycle rate of mixed liquor to the upstream anoxic zone. The amount of mixed liquor recycled to the anoxic zone, and the sizes of the anoxic and aerobic zones are two variables that can be altered in the MLE system. Mixed liquor recycle rates typically range between one and four times the influent flow rate.
A longer SRT is required for nitrification because nitrifying organisms have a relatively slow growth rate. The SRT in the anoxic zone is typically between 1-4 days. The SRT in the aerobic zone is controlled to maintain stable nitrification, and depending on temperature, typically ranges between 4-12 days. The mass of biomass in the system is fixed once the SRT has been fixed, and the hydraulic retention time (HRT) in the anoxic zone typically ranges between 1-4 hours, and the HRT in the aerobic zone typically ranges between 4-12 hours. The HRT depends on the chosen MLSS concentration. Excellent nitrification and a good degree of denitrification (effluent nitrate concentrations of 4-8 mg/L) can be achieved with this process.
Mixed Liquor Recycle
Influent Effluent Anoxic Aerobic Clarifier 4
- Figure 7. Schematic of the MLE Process.
Four-Stage Bardenpho Process
Return Activated Sludge
The four-stage Bardenpho process employs a series of four bioreactors, as illustrated in Figure 8. The first and third bioreactors are anoxic, and the second and fourth bioreactors are aerobic. By adding an anoxic zone after the aerobic zone, further denitrification can occur by biomass decay and utilization of the slowly biodegradable substrate. The second aerobic zone is generally small, and is used to prevent biomass settling problems associated with denitrification in the final clarifier, strip nitrogen gas, and oxygenate the mixed liquor before entering the final clarifier. The wastewater influent, return activated sludge (RAS) from the final clarifier, and recycle from the second aerobic zone are input to the first anoxic zone.
Waste Sludge D

The best combination of reactor sizes is complex and requires the use of pilot scale studies and system simulation to arrive at a sound design (Youker, 1998). Typically, anoxic SRTs range between 2-4 days, resulting in HRTs of 2-4 hours. The final aerobic zone is small to minimize decay reactions, and the HRT is typically around 30 minutes. Studies have shown that the Bardenpho process achieves more denitrification than the MLE process because of the second anoxic zone, resulting in an effluent with lower ammonia and nitrate concentrations (Randall,
Mixed Liquor Recycle
Effluenl Anoxic Aerobic Anoxic Aerobic 1
Waste Sludge - I
Figure 8. Schematic of the Four-Stage Bardenpho Process.
BIOLOGICAL PHOSPHORUS REMOVAL PROCESSES
Biological phosphorus removal processes select for PAOs by coupling an anaerobic zone with an aerobic zone. Phosphorus is removed from the wastewater as the PAOs are removed from the activated sludge system in the waste stream. Biological phosphorus removal systems are designed to maximize phosphorus release and uptake, and to eliminate interference of nitrates and secondary release of phosphorus. Barnard et al. (1985) termed a system with an extensive anaerobic contact time resulting in no uptake of VFAs a "secondary release", however, Fuhs and Chen (1975) are generally credited with its discovery. Fuhs and Chen found that a substantial release of phosphorus occurs when carbon dioxide bubbles or acid is added to PAOs. The release is not associated with the uptake of energy and storage of PHB. Therefore, no energy is available in the aerobic zone for subsequent uptake of the released phosphorus.
Optimizing Anaerobic Zone Performance
Optimizing the performance of the anaerobic zone is important to maximize the primary release of phosphorus, select for PAOs and minimize the secondary release of phosphorus. Optimum performance should result in the primary release of orthophosphate at concentrations of between

5 and 10 times the influent phosphorus concentration. For example, an influent phosphorus concentration of 6 mg/L should result in an anaerobic zone phosphorus concentration of between 30 and 60 mg/L. To achieve optimum performance, the design must provide an adequate source of VFAs, minimize nitrates and dissolved oxygen, limit fermentation and provide optimum detention time (Bamard and Hawkins, Black & Veatch, July, 2000).
Short-chain VFAs such as acetic and propionic acids are necessary for optimal phosphorus removal. VFA concentrations of 5 mgL as COD to 1 m g L of phosphorus are optimum in most full-scale plants. Acetic acid is commonly used and feed dosages are simple to calculate because 1 mgL acetic acid is approximately 1 mg/L COD (Water Environment Federation, 1998).
In the presence of dissolved oxygen, aerobic microorganisms will oxidize the VFAs to carbon dioxide and water, making them unavailable for uptake of PAOs. Therefore, dissolved oxygen concentrations of zero are optimum for anaerobic basin operation. In the presence of nitrate, denitrifying organisms will oxidize VFAs making them unavailable for uptake by PAOs. Therefore, nitrate concentrations of zero are optimum for anaerobic basin operation (Water Environment Federation, 1998).
Detention time in the anaerobic zone should be managed to prevent secondary release of phosphorus. In most applications, a detention time of between 0.5 and 2 hours (detention time measured based on main plant flow) will minimize secondary release (Barnard and Hawkins, Black & Veatch, July, 2000). A pilot study was conducted by Daigger et al., 1988, at the Lamberts Point WWTP @art of the Hampton Roads Sanitation District) to enhance BNR. The results of the study indicated that an anaerobic HRT between 0.7 and 2.4 hours was optimal for complete phosphorus release to occur.
Impact of Sidestreams
Many BNR plants find that the impact of in-plant sidestreams can have a dramatic impact on plant performance. These sidestreams can add additional loads on the liquid train operation and reduce the effectiveness of the treatment if not properly managed. Solids handling systems such as sludge thickening, dewatering equipment and digestion processes are usually the most problematic. For example, the filtrate of anaerobically digested sludge can contain 60 to 200 mgL of orthophosphate and 500 to 1000 mg/L of ammonia. Even though the volume of these sidestreams are often only a fraction of the influent flow to the plant, their mass load can add significant concentrations of phosphorus and ammonia to the plant. To minimize these effects, sidestream treatment is often required at BNR plants.
Effect of Anaerobic/Aerobic Contact Time on PAOs
Anaerobic/aerobic contact times are one of the most important desigdoperation factors influencing PA0 selection and phosphorus removal efficiency. Wang and Park (1 998) studied the effect of contact times on the nature and amount of intercellular storage energy in two different types of PAOs that were developed from acetate-fed and glucose-fed sequential batch reactors (SBRs). When acetate-fed, PA0 cells contained 20-23% PHB-P or phosphorus as PHB; when glucose-fed they contained 10- 15% glycogen-P or phosphorus as glycogen.
A longer anaerobic contact time resulted in a secondary phosphorus release that was not

associated with internal cellular energy synthesis, but a longer aerobic contact time resulted in a depletion of cellular energy. PAOs with lower cellular energy may not be able to compete with other microorganisms in the biological phosphorus removal system. In order to avoid overdesign and optimize removal efficiency, Wang and Park (1 998) recommend that anaerobic contact time be based on the VFA uptake rate or the fermentation rate. Aerobic contact time should be based on the amount of internal energy (VFA) stored during the anaerobic stage and the target effluent concentration.
NOTM or Phoredox Process
The term A/OTM stands for anaerobidoxic (oxic = aerobic) and represents the sequence of zones in this process. The NOTM configuration was patented by Air Products and Chemicals, Inc. of Allentown, Pennsylvania, but was first presented in the literature by Barnard (1975), who called it the Phoredox process. The only difference between the NOTM configuration and the Phoredox configuration is that in the Phoredox process, the anaerobic and aerobic zones are divided into a number of equal compartments. Two bioreactors are used in series, as illustrated in Figure 9. The first bioreactor is anaerobic, and the second is aerobic. The mixed liquor is recycled upstream to the anaerobic zone. This process is referred to as a mainstream biological phosphorus removal process because the anaerobic zone is contained in the main process stream and not located in a sidestream reactor.
The SRT in an NOTM or Phoredox system typically ranges between 3-5 days, with an anaerobic SRT of about 25 to 30% of the total SRT. The SRT in the aerobic zone is as low as 2-3 days to prevent nitrification from occumng and influencing the anaerobic zone. The resulting HRT typically ranges between 3-6 hours. High-rate operation maximizes phosphorus removal by minimizing nitrification and maximizing solids production. High-solids production is desirable because phosphorus is removed from the system by wasting the biomass.
Waste Sludge I
Figure 9. Schematic of the NOTM or Phoredox Process.

Phostripo Process
The PhostripB process consists of a conventional activated sludge system that passes 30 to 40% of the RAS flow through a stripper tank, as illustrated in Figure 10. The stripper tank is similar in configuration to a gravity thickener and maintains the RAS under anaerobic conditions in a sludge blanket, with a residence time of 8-12 hours. The stripper is a sidestream anaerobic zone where the phosphorus release occurs, while the aerobic zone, contained in the main stream, is where the phosphorus uptake occurs. The Phostrip@ process is referred to as a sidestream biological phosphorus removal process since the anaerobic zone is provided in a sidestream reactor. In order for phosphorus removal to occur, an external stream, such as a small portion of the influent wastewater, is added to the stripper. The particulates in the raw wastewater can be solubilized and fermented into VFAs, which are taken up by the PAOs. The stripper overflow has a high phosphorus concentration, and is typically treated with lime to precipitate the phosphorus. Consequently, two phosphorus removal mechanisms operate in this process: biological removal through the waste activated sludge, and chemical removal in the stripper overflow.
Influent Aerobic
Effluent
Return Activated Sludge 1 Waste Sludge I
Overflow to Treatment Elutriant Anaerobic
Figure 10. Schematic of the PhostripB Process.

PROCESSES THAT REMOVE BOTH NITROGEN AND PHOSPHORUS
Anaerobic, anoxic and aerobic zones, along with mixed liquor recycle, are incorporated into the processes that remove both nitrogen and phosphorus from the waste stream. Since both nitrification and phosphorus removal occur in these processes, control of nitrate addition to the anaerobic zone is a key consideration in the design of these processes.
A*/OTM Process
The term A~IOTM stands for anaerobiclanoxicloxic and represents the sequence of zones in this process, as illustrated in Figure 1 1. This process is a combination of the modified Ludzack- Ettinger (MLE) process for nitrogen removal, and the NOTM (AnaerobicIOxic) or Phoredox process for phosphorus removal. When the two processes are combined to create the ~ ~ 1 0 ~ ~ process, the efficiency of nitrogen removal is the same as the MLE process, but the removal of phosphorus is not as efficient, due to the recycle of nitrate to the anaerobic zone. Although recycle to the anoxic zone results in substantial removal of nitrate, complete removal is not possible, and some nitrate is recycled to the anaerobic zone. The impact of the nitrate on the anaerobic zone depends on the organic content of the wastewater. If the organic content is high, denitrifying organisms will oxidize the VFAs, making the VFAs unavailable for uptake by PAOs, thus reducing the release of phosphorus and the efficiency of phosphorus removal. Maintenance of a solids blanket (the settled solids) in the final clarifier has been used with this process to allow denitrification of the RAS in the solids blanket of the final clarifier to reduce nitrate recycle to the anaerobic zone. Maintenance of the solids blanket requires carefbl clarifier operation to prevent clumping and floating sludge.
MLSS recycle rates typically range between one to two times the influent flow rate. The SRT in the anoxic zone is similar to that used in the NOTM process (0.75 to 1.5 days), and the SRTs in the anoxic and aerobic zones are similar to those used in the MLE process. The HRTs are also correspondingly similar.
Figure 1 1. Schematic of the ~ ~ 1 0 ~ ~ Process.
Effluent b
Nitrified Recycle
Return Activated Sludge Waste Sludge b

Five-stage Bardenpho Process
The five-stage Bardenpho process is essentially the same as the four-stage Bardenpho nitrogen removal process with the addition of an anaerobic zone divided into multi-staged compartments to achieve phosphorus removal, by minimizing nitrate recycle to the anaerobic zone, as illustrated in Figure 12. In the five-stage Bardenpho process, the anaerobic zone is added before the first anoxic zone and receives the RAS from the final clarifier. The overall process SRTs and HRTs in the anoxic and aerobic zones are similar to the corresponding SRTs and HRTs in the four-stage process. The HRT in the anaerobic zone is usually 0.75-1.5 hours, resulting in a SRT of 0.75- 1.5 days.
Mixed Liquor Recycle
Effluenl D
\
Return Activated Sludge Waste Sludge - Figure 12. Schematic of the Five-Stage Bardenpho Process.
University of Cape Town, South Africa (UCT) Process
Marais and his co-workers determined the detrimental effects of nitrates entering the anaerobic zone on the performance of biological phosphorus removal processes (Randall et al., 1992). They developed a modification of the three-stage Phoredox process that eliminated the recycle of nitrates in the RAS to the anaerobic zone. This process, which they named the University of Cape Town (UCT) process, consists of anaerobic, anoxic, and aerobic zones, with the RAS directed to the anoxic zone for denitrification, as illustrated in Figure 13. Nitrified mixed liquor from the aerobic zone is also directed to the anoxic zone to increase nitrogen removal through denitrification. Denitrified MLSS from the end of the anoxic zone is recycled to the anaerobic zone to provide the microorganisms needed there for phosphorus removal to occur.
The wastewater influent flows directly into the anaerobic zone, which provides a source of

organic matter to the anaerobic zone. Because the RAS is not recycled to the anaerobic zone, longer HRTs (1-2 hours) are needed to achieve the desired solids retention times. Anoxic and anaerobic S R T ~ and HRTs are similar to those used in the MLE process. Anoxic and mixed liquor recycle rates are typically double the influent flow rate.
I Recycle
Effluenl L D
Nitrified Optional Optional Recycle Alum Feed VFA Feed
(Acetic Acid)
Figure 13. Schematic of the UCT Process.
Modified University of Cape Town, South Africa (MUCT) Process
Return Activated Sludge
The MUCT process was designed to improve upon the UCT process and is unique in that the anoxic zone is divided into two cells, as illustrated in Figure 14. The upstream anoxic cell is reserved specifically for receiving and denitrifying the RAS. The second anoxic cell receives and denitrifies the mixed liquor from the aerobic zone. Primary treated influent is mixed with denitrified anoxic recycle from the second anoxic cell and is routed into the anaerobic zone, where multi-staged compartments are used to minimize nitrate recycle to the anaerobic zone. Flow from the anaerobic zone then enters the first and second anoxic cells, and onto the aerobic zone where nitrification occurs. The nitrified aerobic effluent is recycled back to the second cell anoxic zone for denitrification. This discharge of the aerobic recycle to the second cell of the anoxic zone limits the amount of nitrates returned to the first anaerobic cell, which improves nitrogen and phosphorus removal performance compared to the traditional UCT process.
Waste Sludge
The disadvantage of the UCT and MUCT processes is that the influent flows directly into the anaerobic zone, which can result in unstable conditions when high flow rates occur, or when the wastewater contains high levels of dissolved oxygen or low substrate levels.
D

I Recycle I
Effluenl I
Nitrified Optional Optional Recycle Alum Feed VFA Feed
(Acetic Acid)
I Return Activated Sludge 1 waste ~ludgf
Figure 14. Schematic of the MUCT Process.
Virginia Initiative Plant (VIP) Process
The VIP process was developed in the late-1980s for Hampton Roads Sanitation District, Hampton Roads, Virginia (Daigger et al., 1990). This process is said to be an improvement over the UCT Process because all zones consist of at least two completely mixed cells in series. The VIP process consists of anaerobic, anoxic, and aerobic zones, with the RAS mixed with the nitrified mixed liquor from the aerobic zone and is directed to the anoxic zone for denitrification, as illustrated in Figure 15. Denitrified mixed liquor from the end of the anoxic zone is recycled to the anaerobic zone to provide the microorganisms needed in the anaerobic zone. The wastewater influent flows directly into the anaerobic zone, which provides a source of organic substrate to the anaerobic zone. This process is designed as high-rate, and all zones consist of at least two cells in a series. A short SRT is used to maximize phosphorus removal.
The disadvantage of the VIP process is the same as the UCT and MUCT processes, in that the influent flows directly into the anaerobic zone, which can result in unstable conditions when high flow rates occur, or when the wastewater contains high levels of dissolved oxygen or low substrate levels.
Mines and Thomas (1 996) conducted a four-month bench-scale study to assess the nitrogen and phosphorus removal efficiencies of the VIP process. This study was performed because the VIP process was thought to be ideal for wastewater facilities in Florida that reuse treated effluent by land irrigation. The results indicated that the VIP process was successful in meeting the effluent limits for wastewater reuse applications but was unsuccessful in meeting the more stringent limits set for wastewater treatment facilities that discharge to surface waters.

/ Optional VFA Feed
(Acetic Acid)
Nitrified
Effluent A b
optional Alum Feed
Return Activated Sludge Waste Sludge b
Figure 15. Schematic of the VIP Process.
The Orange Water and Sewer Authority (OWASA) Process
The OWASA process was developed in the late-1980s for phosphorus removal at the Mason Farm WWTP for the Orange Water and Sewer Authority, Chapel Hill, North Carolina (Kalb et al., 1990). This process consists of anaerobic, anoxic, and aerobic zones. The anaerobic zone is provided in a sidestream reactor, as illustrated in Figure 16. The primary settled wastewater flows to the aerobic zone where BOD is reduced and ammonia is converted to nitrate or nitrite, then to the anoxic zone for denitrification, and finally to another aerobic zone for stripping of the nitrogen gas generated by denitrification. RAS, to provide the microorganisms, and a substrate source are combined in the anaerobic zone.
Primary sludge fermentation has been shown to be a good source of VFAs and has been used to enhance a number of BNR processes. A portion of the raw wastewater is routed through the sludge fermenter. The fermented sludge is combined with the RAS in the anaerobic zone to facilitate phosphorus release. Phosphorus uptake occurs in the aerobic zone, and concentrations in the aerobic effluent are typically less than 1.0 mg/L (Kalb, 1993).
Because the OWASA process was developed for phosphorus removal, it does not optimize nitrogen removal. There is no mechanism to use carbon substrate in the influent to enhance denitrification in the anoxic zone. Therefore, a supplemental substrate must be added to the anoxic zone to ensure low total nitrogen in the secondary effluent. The fermented sludge that provides the VFA source to the anaerobic zone can also be fed to the anoxic zone to enhance denitrification. Poor denitrification can also impact phosphorus removal by allowing excess

nitrate in the RAS to enter the anaerobic zone. If the organic content is high in the presence of nitrate, the denitrifying organisms will oxidize the VFAs, making them unavailable for uptake by PAOs. The result is reduced phosphorus release and reduced overall phosphorus removal efficiency.
Biological Reactors n Influent Effluent
D
VFA's
Return Activated Sludge Waste Sludge D u , Raw
Sludge
Figure 16. Schematic of the OWASA Process.
Charlotte, North Carolina (CNC) Process
The CNC process was developed by Hawkins et al. (1996) at the Mallard Creek WWTP, Charlotte, North Carolina, for Charlotte-Mecklenburg Utilities. The process was developed to overcome some of the problems of the existing three zone BNR processes used for phosphorus and nitrogen removal. Like the OWASA process, anaerobic, anoxic, and aerobic zones are used, with the anaerobic zone as a sidestream reactor, as illustrated in Figure 17. The primary clarifier effluent flows into the anoxic zone, which is used for denitrification and reduction of BOD. Flow proceeds to the aerobic zone, where BOD and ammonia are oxidized, and phosphorus uptake occurs. RAS and mixed liquor recycle streams are directed to the anoxic zone to enhance BOD reduction and denitrification. The two recycle streams are independent and can be varied to optimize treatment. This part of the process is similar to the MLE process. It also incorporates improvements to the anoxic zone similar to those used in the VIP and MUCT processes, where a multiple cell anoxic zone is used to minimize nitrate recycle to the anaerobic zone. Denitrified mixed liquor from the anoxic zone is recycled to the anaerobic zone and combined with a supplemental substrate, such as acetic acid.
The detention time in the aerobic zone is dictated by the time required to oxidize ammonia to nitrate, and a 6-day SRT is typical. The resulting HRT varies between 4-10 hours to achieve a low soluble BOD concentration. The detention time in the anoxic zone is adjusted according to the nitrate concentration recycled to the anoxic zone and the desired effluent nitrate concentration. The detention time in the anaerobic zone is typically between 0.5-1.5 hours, and it is used as a microbial selector to optimize phosphorus uptake in the aerobic zone.

Figure 17. Schematic of the CNC Process.
BNR processes are selected on a site-specific basis, and depend on many factors, including influent wastewater characteristics and level of treatment to be achieved. A summary of the advantages and disadvantages of each BNR process is presented in Table 3.

Table 3. Summary of BNR process advantages and disadvantages. Process
MLE
Four-Stage Bardenpho Reduced oxygen requirement Simple control Minimum reactor volume
Advantages Good nitrogen removal Moderate reactor volume Alkalinity recovery Good solids settleability Reduced oxygen requirement Simple control Excellent nitrogen removal Alkalinity recovery Good solids settleability
Phosphorus removal adversely impacted if A10
Disadvantages High level of nitrogen removal not generally possible Not designed for phosphorus removal
Large reactor volume Not designed for phosphorus removal
VIP
Good phosphorus removal Good solids settleability Sim~le o~eration
Complex operation Phosphorus removal adversely impacted if nitrification occurs Cost of chemicals to precipitate Phos Not designed for nitrogen removal High level of nitrogen removal not generally possible Moderate phosphorus removal
Phostrip
A*/O
Simple control Good nitrogen removal Good phosphorus removal
nitrification occurs Not designed for nitrogen removal
, ' - a -
Good phosphorus removal
Good nitrogen removal Moderate reactor volume Alkalinity recovery Good solids settleability Reduced oxvaen reauirement
High level of nitrogen removal not generally possible
--
hiah rate ~rocess I -- 1
Moderate reactor volume Alkalinity recovery Good solids settleability Reduced oxvaen reauirement
[Simple control I I
An additional mixed liquor recycle step is required
UCT
Good nitrogen removal Good phosphorus removal Moderate reactor volume Alkalinitv recoverv Good solids settleability
Sim~le control
High level of nitrogen removal not generally possible An additional mixed liquor recycle step is reauired
MUCT
Five-Stage Bardenpho
OWASA
CNC
Good nitrogen removal Good phosphorus removal Moderate reactor volume Alkalinity recovery Multiple anoxic cells to improve performance
High level of nitrogen removal not generally possible An additional mixed liquor recycle step is required
Good solids settleability Reduced oxygen requirement Simple control Excellent nitrogen removal Alkalinity recovery Good solids settleability Reduced oxygen requirement Simple control Good phosphorus removal
Large reactor volume Moderate to poor phosphorus removal
Not configured to optimize nitrogen Sidestream anaerobic zone
Good nitrogen removal Good phosphorus removal Sidestream anaerobic zone Multiple anoxic cells to improve
removal Phosphorus removal adversely impacted if nitrification occurs An additional mixed liquor recycle step is required External VFA source is required
.b

CHEMICAL AND BIOLOGICAL NUTRIENT REMOVAL
Chemical precipitation preceded the use of biological methods to remove phosphorus, and it is still used either alone or combined with BNR. Facilities using biological methods commonly have chemical addition equipment to provide backup and effluent polishing. Aluminum sulfate (alum), ferrous salts, and lime are the most common chemicals used.
Metal salts react directly with orthophosphate to form insoluble precipitates that are subsequently settled out of solution. Lime is typically used to elevate the pH. The required metal salt dosage is primarily a function of the phosphorus concentration in the wastewater, while the required lime dosage is based more on the alkalinity of the wastewater and the degree of removal required (U.S. Environmental Protection Agency, 1987b).
Disadvantages of chemical precipitation for phosphorus removal include increased sludge production, high chemical consumption, and chemical storage and handling requirements. Although a high degree of phosphorus removal can be obtained, operational costs tend to be high. Biological phosphorus removal has limitations, but it can be an economical alternative to chemical methods, even if chemical addition is needed to provide backup or effluent polishing (Reinhart, 1985).
Thomas et al. (1996) conducted a study to optimize phosphorus removal by incorporating a chemical dosing facility in an existing BNR activated sludge plant at Albury in Australia. The three-stage BNR process had been relatively successful in removing nutrients, however, a requirement to further reduce phosphorus levels in the effluent led to the installation of a chemical dosing facility. Jar test experiments were designed to measure a number of different dose rate responses, using both alum and ferric chloride. The investigation was carried out using jar tests, pilot studies, and the full-scale plant.
The results indicated that both alum and ferric chloride satisfactorily removed the orthophosphate fraction from the clarifier effluent, with no significant difference in chemical costs. On a molar equivalent basis, alum was superior to the ferric chloride. When alum precipitation was combined with biological phosphorus removal, effluent orthophosphate concentrations as low as 0.01 mg/L could be achieved, with the average effluent total phosphorus concentrations measuring 0.5 mgIL. Therefore, alum was chosen as the preferred chemical for use in the full-scale plant.
TREATMENT OF WASTEWATER IN EUROPE UTILIZING DIFFERENT BIOLOGICAL PHOSPHORUS REMOVAL TECHNOLOGIES
In Europe, Denmark, Norway, Sweden and Switzerland have the highest percentage of wastewater treatment plants using phosphorus removal techniques (Heme, 1996). Chemical precipitation is the most common process. However, in recent years there has been an increase in biological phosphorus removal (BPR) with simultaneous chemical precipitation. BPR has become increasingly popular because of low sludge production, the fertilizer value of the bio-P sludge, and the use of wastewater components as process "chemicals". The processes implemented most often are the Bardenpho, UCT, and Phoredox, which are all mainstream

processes. The Phostrip or OWASA sidestream processes are also used.
Chemical precipitation is sometimes used with BPR as a polishing process to further decrease the effluent phosphorus concentration. The polishing chemical precipitation of phosphorus can be made with pre-precipitation, simultaneous precipitation, post-precipitation or contact filtration (Argaman et al., 199 1). Pre-precipitation refers to the addition of chemicals to the raw wastewater and removal of the formed precipitates together with the primary sludge. Simultaneous precipitation refers to the addition of chemicals so that the formed precipitates are removed together with the WAS. Points of chemical addition that accomplish this are the primary effluent or the mixed liquor, either in the aeration basin itself or to the aeration effluent prior to final clarification. Post-precipitation is the addition of chemicals at a point after both the primary and secondary treatment processes. An additional solids separation device removes the formed precipitates. Contact filtration combines polishing chemical precipitation with final filtration. Use of this method results in achieving very low effluent phosphorus concentrations.
Many types of chemicals can be used, including ferrous sulfate, ferric chloride and aluminum sulfate. Aluminum salts have properties that can differ from the others so that alkalinity and the coagulation of particles are affected. Due to its low cost, ferrous sulfate is a popular polishing precipitant. The ferrous iron is oxidized in the aeration tank to femc iron before the precipitation occurs. The use of ferric chloride is increasing because it is easier to handle and needs no oxidation for activation of its precipitating potential (Heme, 1996).
The use of precipitating chemicals does not inhibit the BPR process, but overdosing can reduce biological phosphorus activity. Data has been collected from several WWTPS utilizing BPR in various parts of Europe to compare efficiency between technologies. The least operational problems and most efficient effluent phosphorus concentrations resulted from the use of simultaneous precipitation and contact filtration (Heme, 1996).
COST ANALYSES OF BNR PROCESSES
Although the operation and performance of BNR processes has been well- documented (CH2M Hill, 1989), the costs to build and operate BNR facilities has not (Reardon, 1994). Cost comparisons are difficult, because each case must be considered individually, taking into account the local conditions, local costs, particular characteristics of the wastewater, mean temperature, influx of groundwater, cost of alternative methods of treatment, and many other conditions (Argaman et al., 199 1).
Reardon (1 994) conducted an evaluation of the costs associated with BNR processes using two parallel methods. First, engineering evaluations were used to establish the parameters having the greatest impact on the cost of conventional treatment versus BNR treatment. Second, a survey was conducted of operating BNR facilities to obtain information on the construction and annual operating costs that are incurred at full-scale facilities.
As of 1992, a total of 208 facilities were using a BNR process. The BNR processes utilized at these facilities is summarized in Table 4. The majority of these facilities (127) have design capacities under 0.5 MGD, 69 are between 0.5 MGD and 2.0 MGD capacity, and 19 are greater than 2.0 MGD capacity.

Table 4. Summary of BNR WWTPs by process type.
I I Number in I 1 Number in I Process Type I operatione I Process Type 1 operationa I
I I
A10 ~ ~ 1 0
Bardenpho
* As of 1992 (from Reardon, 1994)
Denitrification Filters In-Channel Oxidation Ditch Denitrification
Intermittent Aeration
MLE Modified Bardenpho
Mutiple Sludge
The need to maintain a minimum SRT, the need to supply additional oxygen, and in some cases, the need to supply an external alkalinity source, were found to be the major costs associated with nitrification. The effects of these requirements on cost varied directly with the magnitude of the influent organic carbon and nitrogen loads. Denitrification can impose additional costs and operating requirements. However, the recovery of oxygen and alkalinity that occurs with denitrification can result in a reduction of operating costs. The potential savings will be greatest for wastewaters with low BOD/TKN ratios, insufficient alkalinity, and low recycle requirements.
21 12
3
The costs associated with phosphorus removal were most impacted by the BODITP ratio and the quantity of phosphorus in the influent wastewater. As the mass of phosphorus to be removed increased, a point was reached when normal metabolic needs were insufficient to remove the required amount. Additional measures, such as supplemental chemical removal, were required. When the mass of phosphorus to be removed was small, then the costs for chemical removal tended to be less than the costs associated with biological phosphorus removal. This was the result of the low capital cost for chemical feed systems, the low dosage of chemical required, and the small increase in sludge production. When low effluent phosphorus concentrations ( 4 . 0 mg/L) were required, the necessary chemical doses and sludge production became too large. At this point, biological phosphorus removal tended to be cheaper than chemical phosphorus removal. However, the addition of supplemental chemical removal (metal salts andlor a VFA source) may also be required to meet stringent limits.
10
24
2 25
35 6
The final construction costs for plants in the survey represented a large range of design, sludge treatment, and effluent discharge conditions. Due to the methods used and the time available, no attempt was made to separate costs not directly associated with the liquid treatment process. The survey results indicated that construction costs for BNR WWTPs are greater than for secondary
Orbal Simpre Other AnoxicIAerobic Processes Oxidation Ditch with Integral Anoxic Zone
7 10
5
Phase Isolation Ditch
PhoStrip
Schreiber Sequencing Batch Reactor Submerged Packed Bed
VIPIUCT TOTAL
6 9
19 10 2
2
208

WWTPs. A large amount of data was also collected on the cost to operate BNR treatment facilities. Due to large differences in which individual facilities track and account for these costs, it is impossible to make specific comparisons. However, cost data do provide an overall range of operating costs incurred by BNR treatment plants. Table 5 presents a summary of the yearly operating costs reported by the facilities surveyed.
Table 5. Summary of Reported BNR O&M Costs (adapted fiom Reardon, 1994)
Cost Component
Chemical Cost
Labor Cost
* Note: Totals do not equal sum of components
Maintenance Cost
Miscellaneous Cost
Power Cost
This cost evaluation suggests that the requirement for nutrient removal will typically increase the capital costs and decrease the operating costs for municipal WWTPs. Many design or operational factors exist that can have a significant impact on the overall cost of building and operating a BNR WWTP. Table 6 lists ten factors that can strongly influence the costs for a BNR WWTP, as reported by Reardon (1994).
Reported Unit Operating Costs, $11 00m3 ($11 0001gal)
Table 6. BNR Cost Factors
Average
1.43 (0.054) 8.40 (0.31 8)
1.84 (0.070) 8.61 (0.326)
5.13 (0.194)
- - -
Ilnfluent Carbon Type and Mass Load 1 lnfluent Nutrient Load I
TOTAL COST I 22.56 (0.854)
Maximum
5.92 (0.224)
32.50 (1.23) 5.07 (0.192)
34.61 (1.31) 13.58 (0.514)
lsludRe Treatment and Disposal Costs l~hemical Costs I
Minimum
0.0022 (0.00008) 2.09 (0.0791
0.21 (0.008) 0.72 (0.027)
0.32 (0.012)
57.07 (2.1 6)
Minimum Wastewater Temperature
Power Cost
Influent Alkalinitv
OPERATIONAL ISSUES ASSOCIATED WITH BNR PROCESSES
6.66 (0.252)
Permit Limits: Species and Concentration Aeration Efficiency
O~eration and Maintenance Labor Reauirements
Cooper et al. (1 995) conducted an investigation of design and operational difficulties encountered in BNR WWTPs in the United Kingdom (UK). Control of sludge age, recycle streams, and oxygen input are established difficulties associated with nitrifying activated-sludge systems. The investigation focused on BNR-related issues that were new to the UK industry.

BOD-Nutrient Ratios
A BODIP ratio of at least 20: 1 is required in the anaerobic zone for a good release of phosphorus, and 7.5 m g L of VFAs are required to release 1 mg/L of phosphorus. Weak wastewater (BODIP ratio < 20: 1) creates conditions of insufficient substrate to initiate phosphorus release in the anaerobic zone. A common solution for insufficient VFAs in the influent wastewater is a supplemental VFA source (acetic acid, propionic acid) fed into the anaerobic zone. Some facilities utilize on-site fermenters, which are capable of producing high VFA concentrations that are injected into the anaerobic zone. Fermenters have a retention period of 3 to 5 days dependent on temperature. Fermentation can decrease waste gas in the digesters. At plants that reuse gas it would be a disadvantage, whereas at plants that bum gas, it would be an advantage to reduce the amount of gas.
Storm Water Impacts
Many WWTPs in the UK receive storm water and wastewater combined. Wet weather flows can reach 2.5-3 times the dry-weather flow. Increased flows can exceed the hydraulic capacity of the plant, and reduce the amount of substrate utilized by the PAOs in the anaerobic zone. Equalization tanks can regulate the flow to the BNR system. The equalization tanks can also provide a buffer for the return of high ammonia and phosphorus waste streams to the sludge- processing facility.
Solids Issues
Pilot studies conducted by the Water Research Centre (1995), on behalf of a group of water companies, have shown that both mainstream processes and sidestream processes are capable of producing effluent phosphorus concentrations of less than 1.0 mg/L. In a BNR process, the phosphorus is bound up with the sludge. Phosphorus content of the solids is approximately 5%. Therefore, it is important to keep suspended solids in the effluent to a minimum. Good solids retention is essential in the clarifier. To meet stringent limits of less than 1 mg/L, tertiary filtration can be required.
Control of dissolved oxygen concentrations is necessary to achieve efficient denitrification and phosphorus removal; however, this can create oxygen-deficient zones, which promotes proliferation of filaments. Filamentous sludge organisms manifest themselves as a floating scum or stable foam. These foams get trapped behind baffle walls of the reactors and can stabilize to dramatic levels, passing into the final clarifier and contaminating the effluent.
Baffle walls separate the reactor zones and prevent back-mixing between zones. Sub-surface baffles could be designed as cascades between reactors to ensure that scums and foams are transported to the final clarifier. Since it is important that these scums and foams are transported out of the sludge inventory, an effective scum removal system is needed in the final clarifier.
Operational Issues
Although BNR plants can be designed and operated to remove nutrients to an efficient level, or to meet permit limits, it is still necessary to provide chemical back-up systems for phosphorus removal. The failure of a blower, clarifier mechanism, recycle pump, or VFA fermenter are

examples of situations where supplementary chemical back-up can be required to comply with targeted values or permit limits. Supplementary dosages of metal salts can have a beneficial effect on biological phosphorus removal of BNR systems. However, excessive addition of chemical can have an inhibitory effect on the biological uptake of phosphorus. Control of the BNR system and of supplementary chemical feeds is essential for cost and optimization of biological phosphorus removal.
The biologically removed phosphorus is taken up in the bacterial cells. The first stage of sludge treatment (thickening) should be aerobic so the phosphorus remains with the thickened sludge. Under anaerobic conditions, the phosphorus is released to the liquid phase. After subsequent dewatering, the return filtratelconcentrate may have to be treated chemically to remove the phosphorus before being returned to the plant.
Monitoring needs
BNR processes are more difficult to control and operate than conventional activated-sludge processes. To reduce the difficulty of operation, operators should be thoroughly trained on the mechanisms of nutrient removal, sampling and monitoring, analytical test kits, and detecting operational issues. On-line sensors and monitoring devices are important to continuously monitor variables such as DO, alkalinity, pH, ammonia, nitrate and phosphorus. Measuring these variables is important for adjusting recycle rates, optimizing anaerobic and anoxic zones, and for generally monitoring the efficiency of the process.

METHODS AND MATERIALS
In this section, details will be given describing the experimental design and methods and materials used for this research. Methods of sampling and analysis, performance evaluation, and cost analysis will also be presented.
The research was divided into six phases. These phases are listed, followed by a sampling plan and table describing the methods used in the analysis of the samples. A description of the facilities available for successfbl completion of the research is then presented.
EXPERIMENTAL DESIGN
A full-scale BNR activated sludge WWTP was utilized to compare the performance and costs of three different BNR configurations. The daily operation of the facility was also analyzed to determine and implement solutions to operational issues associated with the different BNR configurations and sidestream flows. The three BNR processes chosen for comparison were the UCTNIP process, the CNC process, and the modified OWASA process. Operational issues evaluated during the research included sidestream flows (waste activated sludge, digester supernatant, and belt press filtrate), supplemental acetic acid addition, supplemental alum addition, and implementation of tertiary denitrification filters. The six phases of research were:
Phase 1. Background research and laboratory methods development.
Phase 2. Start up and operation of the UCTNIP process.
Phase 3. Operation of the UCTNIP process with supplemental chemical phosphorus removal.
Phase 4. Start up and operation of the CNC process.
Phase 5. Start-up and operation of the modified OWASA process.
Phase 6. Start up and operation of all three BNR process configurations (UCTNIP, CNC, and modified OWASA) for comparison of performance and cost under equal operating conditions.
During each phase of the research, data were collected to enable evaluation of the operation, performance, and costs associated with the specific nutrient removal configuration being investigated.
Operation
Grab samples were collected at a minimum of twice per week by the research team and analyzed to provide a phosphorus and nitrate profile throughout the treatment process. Other parameters, such as COD, ammonia, DO, pH, and alkalinity, were also periodically analyzed to further track the operation of each BNR process. In addition to the research team, grab samples were collected daily by the treatment plant staff for routine phosphorus and nitrate monitoring. Composite samples for compliance with the NPDES permit are collected by Charlotte- Mecklenburg Utilities and analyzed at an off-site laboratory. Prior to beginning the research, a sampling program was developed along with the advisory committee. Table 7 summarizes the

locations in the treatment process from which samples were collected.
Table 7. Summary of sampling locations.
ANA:EFF l~naerobic Effluent Ice114 - Both Trains I
Abbreviation INFL PCE ANA-INF
I "
; FCE 1 ~ i n a l Clarifier Effluent l~rough of Final Clarifier I
Sample Plant Influent Primary Clarifier Effluent Anaerobic lnfl uent
ANX-INF ANX-EFF AER FCI
Location in treatment process Influent Wet Well Trough of Primary Clarifier Cell 1 - Both Trains
-
ANX-MID i~nox ic Middle 1 ~ffluent of Anoxic Cell 1 - Both Trains I
Anoxic Influent Anoxic Effluent Aerobic Effluent Final Clarifier Influent
EFFL (plant Effluent l ~ f t e r UV Disinfection at Re-aeration Cascades Additional sample locations:
Sampling Procedure
Anoxic Zone Influent Channel - Both Trains Cell 2 of Anoxic Zone Before Baffle Wall - Both Trains Spillway at effluent of Aerobic Zone - Both Trains Trouah of Round Aerobic Basins - Both Trains
All grab samples were taken manually in plastic bottles using a dipper. The bottles were rinsed
After Bar Screening and Grit Removal Effluent Filter Building from Pipe Effluent Filter Building from Pipe Filtrate Holding Basin Effluent Beginning of Aerobic Zone - Near Baffle Wall - Both Trains Middle of Aerobic Zone - Both Trains
PC1 , RAS WAS Filtrate AER-INF AER-M I D
with distilled water prior to sampling according to Standard Methods for the Examination of Water and Wastewater, 2oth Edition (APHA, 1998). All samples were taken from the stations
Primary Clarifier Influent Return Activated Sludge Waste Activated Sludge Filtrate Aerobic Influent Aerobic Middle
listed in Table 7. The sample bottles were stored on ice until analysis commenced at the treatment plant laboratory approximately 15 to 30 minutes following sample collection.
Performance
To determine overall removal efficiency of each configuration, the primary clarifier effluent and plant effluent levels of nitrate and phosphorus were monitored. The primary clarifier effluent was monitored instead of the plant influent because it was more representative of what was entering the biological process due to the recycle of sidestreams that were high in nutrient concentrations to the head of the plant.
Costs
Methods for cost evaluation included on-line power meters, chemical invoices, power bills, maintenance/operator logs, and wet lab costs. Power consumption related to mixing, aeration and pumping was indirectly monitored and determined using calculations provided by the electrical engineering department at Black & Veatch Consulting Engineers (Charlotte, NC). Chemical feeds were computer controlled and were recorded by daily usage. Chemical invoices

were used to determine the actual cost of chemical feed. Maintenance and operator logs were monitored to record repairs and operational changes throughout the plant. Operator logs were also used to estimate operator time spent on process control. Wet lab costs were determined from extra lab supplies necessary for monitoring each BNR process.
Laboratory
The laboratory analyses of the samples were conducted at the Environmental Engineering Research Laboratories at UNC-Charlotte during the first two phases of research. Data collection efforts were coordinated with the treatment plant staff to complement rather than repeat the data collected and develop a fuller operations database. Beginning in March 1999, all laboratory analyses were conducted at the laboratory located on-site at McDowell Creek WWTP. The decision to change laboratories was made to initiate a collaborative effort with the treatment plant staff, and to experience the daily operation of the facility.
Calculations
The following calculations were used for plant operation, power consumption and chemical addition: acetic acid addition to the anaerobic zone andlor the denitrification filters, alum addition to the final clarifiers, RAS flow rate, WAS flow rate, oxic recycle flow rate, power consumption by blowers, and power consumption by treatment trains.
20% Acetic Acid Feed to Anaerobic Zones:
Gallons = Flow (MGD) * P (rng/L) * 5 (mg/L acetic acid) * 8.34 lb/gal* (.20) of acetic acid 8.34 lblgal * 1.1 (specific gravity)
20% Acetic Acid Feed to DenitriJication Filters:
Pump Rate of FFP at 100% = 1 18 galhour Pump Rate % is set manually. Maximum Daily Flow = 18 MGD
Gallons = Actual Pump Rate (%) * (Average Daily Flow) * 1 18 galhour * of acetic acid (Maximum Daily Flow) day
Amount of Alum Fed to Final Clarifiers:
Pump Rate of VFP at 100% = 52.89 galhr Pump Rate % is set manually.
Gallons of Alum = Actual Pump Rate (%) * 52.89 g a l h * hrs/day

RAS Flow:
RAS Flow (MGD) = MLSS (mg/L) RAS (mg/L) - MLSS (mg/L)
* Raw Influent Flow (MGD)
WAS Flow:
MLSS = the aeration basin mixed liquor suspended solids concentration (mg/L) Volume of Basins = Total volume of the BNR train components "in use":
First treatment train = 1.55 MG Second treatment train = 1.46 MG
SRT (d) = Mass of sludge in the reactor - - (V) (VSS in reactor) Mass removal rate of sludge from the reactor (Flow rate of WAS) (VSS in WAS)
WAS (mg/L) = concentration of RAS flow diverted to the anaerobic digesters.
WAS Flow (MGD) = MLSS (mg/L) * Volume of Basins (MG) SRT (d) * WAS (mg/L)
Oxic Recycle Pump (ORP) Flow:
Step 1. Determine the ratio of raw influent TKN concentration to final effluent nitrate-N concentration.
Step 2. Determine the difference between the raw influent flow rate and the RAS flowrate.
ORP Flow (MGD) = (Step 1) * (Step 2)
Power Consumption by Blowers:
Calculate kW Blower Volts = 480 V Blower Power Factor = 0.913
kW = Voltage * Power Factor * Amps * 43 1000
Power consumption per day (kwh) = kW * hrs/day
Power Conszrmption by Treatment Trains:
RAS pumps (2) = 29.8 kW

ARP pumps (4) = 4 kW ORP Pumps (4) = 29.8 kW Acetic Acid Feed Pumps (2) = 0.37 kW Alum Feed Pumps (2) = 0.37 kW Anaerobic Mixers (8) = 4 kW Anoxic Mixers (8) = 7 kW Aeration Basin Mixers (6) = 6 kW
kwh = Sum of pumps and mixers (kW) * 24 hrs
Cost:
Acetic Acid (obtained fiom supplier invoice) = $0.48 per gallon Alum (obtained from supplier invoice) = $1 S O per gallon
Power cost (per kwh) was obtained by averaging one year of electric bills (June 1999 - May 2000) to account for coincident peak time-of-day service. Power = $0.028 per kwh
Laboratory supplies (obtained fiom supplier invoice) = approximately $500 per month
Analytical Methods
All samples were brought back to the laboratory immediately following each sampling event. Analytical methods employed for measuring the monitored parameters were performed according to Standard Methods for the Examination of Water and Wastewater, 20" Edition (APHA, 1998). Each sample was allowed to settle, and the liquid portion of each sample was used in all analyses. Filtration of the samples was not performed thus discrete values for dissolved constituents were not evaluated.
Reactive Phos~horus (PO;-
Reactive phosphorus (low range) was measured using the HACH Phos VerTM 3 Method, Test 'N Tube ProcedureTM (HACH Method 8048). This procedure is equivalent to Standard Method 4500-PE for wastewater. Small volumes of the water sample are pipetted into vials containing deionized water. Orthophosphate reacts with molybdate in an acid medium to produce a phosphomolybdate complex. Ascorbic acid then reduces the complex, resulting in an intense molybdenum blue color. The reactive phosphorus measurement was made with the spectrophotometer.
Reactive Phosphorus ( p o i -
Reactive phosphorus (high range) was measured using the HACH Amino Acid Method ( HACH Method 8 178). This procedure was adapted from Standard Methods for wastewater. Twenty- five milliliters of the water sample are pipetted into a sample cell. In a highly acidic solution, ammonium molybdate reacts with orthophosphate to form molybdophosphoric acid. This

complex is then reduced by the amino acid reagent to yield an intensely colored molybdenum blue compound. The reactive phosphorus measurement was made with the spectrophotometer.
Nitrate (NO?-N)
Nitrate was measured using the HACH Cadmium Reduction Method (HACH Method 8039). This procedure is equivalent to Standard Method 4500-N03E for wastewater. Small volumes of the water sample are pipetted into vials containing the premeasured reagents. Cadmium metal reduces nitrates present in the sample to nitrite. The nitrite ion reacts in an acidic medium with sulfanilic acid to form an intermediate diazonium salt. This salt couples to gentisic acid to form an amber-colored product. The nitrate measurement was made with the spectrophotometer.
Chemical Oxvgen Demand (COD)
COD was measured using the HACH Dichromate Reactor Digestion Method (HACH Method 8000). This procedure is approved and accepted for reporting by the USEPA. Small volumes of the water sample are pipetted into vials containing the premeasured reagents, including catalysts and chloride compensator. The vials are incubated until digestion is complete and then cooled. The COD measurement was made with the spectrophotometer. When the wastewater contains only readily biodegradable organic bacterial food and no toxic matter, the COD test results provide a good estimate of BOD values.
Ammonia @XE&-N)
Ammonia was measured using the HACH Salicylate Method (HACH Method 1003 1). This procedure is an adaptation of the Standard Nesslerization Method (4500-NH3C) for wastewater. Small volumes of the water sample are pipetted into vials containing the premeasured reagents. Ammonia compounds combine with chlorine to form monochloramine. Monochloramine reacts with salicylate to form 5-aminosalicylate. The 5-aminosalicylate is oxidized in the presence of a sodium nitroprusside catalyst to form a blue colored compound. The blue color is masked by the yellow color from the excess reagent to give a green solution. The ammonia measurement was made with the spectrophotometer.
Alkalinity
Alkalinity was measured using the on-line Alka-Pro monitoring system at the facility. Alkalinity measurements are made every 15 minutes at several locations throughout the plant.
Dissolved Oxygen
DO was measured using the on-line Alka-Pro monitoring system at the facility. DO measurements are made every 15 minutes at several locations throughout the plant.
pH was measured using the on-line Alka-Pro monitoring system at the facility. pH measurements are made every 15 minutes at several locations throughout the plant.

RESULTS AND DISCUSSION
The results are reported from each of six phases of plant operation in order to distinguish between varieties of operating conditions. The phases are categorized as:
Phase 1 : BNR Acclimation
September 1, 1998 - January 6, 1999
Phase 2: UCTNIP Operation
January 7, 1999 - May 5, 1999 (Day 1 - 119)
Phase 3: UCTNIP Operation and Chemical Phosphorus Removal
May 6,1999 - September 1,1999 (Day 120 - 238)
Phase 4: CNC Operation
September 2, 1999 - November 25,1999 (Day 239 - 323)
Phase 5: Modified OWASA Operation
February 12,2000 - April 16,2000 (Day 402 - 466)
Phase 6: BNR Re-Evaluation
Modified OWASA: February 12,2000 - April 16,2000 (Day 1 - 65)
CNC: April 17,2000 - May 2 1,2000 (Day 66 - 100)
UCTNIP: May 22,2000 - July 3 1,2000 (Day 101 - 171)
The plant upgrades continued throughout the first five phases of the study. During Phase 6, the different BNR processes were implemented for re-evaluation. Process, performance, and cost data were collected and compared for each BNR configuration. All raw data for each research phase, except Phase 1, are presented in Appendix A.
The overall goal of this study was to achieve steady state operation for three BNR process configurations and evaluate cost and operating differences at McDowell Creek WWTP. Nitrogen, phosphorus, energy utilization (for aeration and pumping) and chemical inputs were evaluated at steady state. The research is valuable to assist wastewater utilities in selecting and optimizing the lowest cost BNR plant operation. Although not a primary research objective, the results presented here are also useful to determining the optimum seasonal operation that may include changing BNR configurations throughout the year. Ideas for minimizing adverse operational issues and maximizing efficient performance are suggested, as well as recommendations for future operation of the facility.

During the course of this research, the plant initiated BNR for the first time in December 1998. The first five phases of the study were utilized for baseline data collection, gaining familiarity with BNR processes, establishing process stability, evaluating biological responses to stresses, and solving operational issues. The raw wastewater characteristics remained fairly constant throughout the study; however, the average daily flow increased fiom approximately 3.0 mgd to approximately 4.5 mgd. By March 1999, both treatment trains were in service.
The results for the first five phases presented the operational issues encountered, and actions taken. A summary of operational issues and solutions is presented below. Because this was an operating municipal full-scale plant, the effluent quality could not be compromised. This limitation prevented full investigation and study of operational failures, but it also provided opportunity to study real-time management of effluent quality and decision making.
BASELINE DATA
This section presents an overview of typical parameters common to all phases of plant operation.
Phosphorus
The typical influent phosphorus concentration ranged from 5-7 mg/L. The primary clarifier phosphorus concentration ranged fiom 7-14 mgL, and was dependent upon sidestream flows. Sidestream flows were routed to the plant influent, and included digester supernatant, belt press filtrate, and WAS. Based on an influent phosphorus concentration of 5-7 mg/L and an expected primary release of 5- 10 times the influent phosphorus concentration, the expected operational range for phosphorus release is 25-70 mgL.
The luxury uptake of phosphorus occurred in the aerobic zone, and the phosphorus was removed from the system by the wasting of phosphorus-rich biomass fiom the final clarifiers. For normal operation and efficient removal of phosphorus to produce an effluent concentration of less than 1.0 mg/L, concentrations of less than 0.5 mg/L should be achieved in the aerobic zone. Although normal operation and efficient removal still occurred if phosphorus concentrations in the aerobic zone were slightly higher than 0.5 m a , frequent process control testing indicated achieving phosphorus concentrations of less than 0.5 mg/L resulted in optimal performance of BPR. The Water Environment Federation (1998) states that an indicator of efficient biological phosphorus removal is when the biomass contains 3 to 5 times the phosphorus concentration of normal biomass. Alum was available for further polishing if phosphorus concentrations were elevated entering the final clarifiers. Operators typically implemented alum addition if phosphorus concentrations reached 0.80 mg/L or higher entering the final clarifiers, or when a suspected upset would occur. Consistent achievement of low phosphorus levels necessitates a provision for an alum-polishing step.
Theoretical Biological Phosphorus Release and Uptake in Relation to VFA Feed
The amount of substrate stored by the PAOs in the anaerobic zone is a function of the quantity and types of VFAs available, the mass and types of PAOs available, the quantity of stored phosphorus contained by the PAOs when they enter the anaerobic zone, the mass of electron acceptors (DO and nitrate) entering the anaerobic zone per unit of time, the cations available in

the anaerobic zone, the HRT and temperature of the anaerobic zone, and the pH of the anaerobic zone. Phosphorus removal can be limited by any of these factors (WEF 1998).
Theoretically, 5 mg1L of VFAs are necessary per 1 m g L of phosphorus to be removed. The range of 20% acetic acid needed in the anaerobic zone varied between 600-2000 gallons (28-92 m a ) since the range of influent phosphorus treated ranged from 5-14 mglL, and the flow varied. It was most efficient to feed acetic acid conservatively in order to maximize phosphorus release. However, phosphorus uptake in the aerobic zone does not begin until all of the VFAs have been removed from the solution. The breakthrough of W A S into the aerobic zone did not seem to occur during the study, as indicated by the fact that phosphorous uptake did not appear limited. Furthermore, the existence of an anoxic zone between the anaerobic and aerobic zones would lead to consumption of any leftover VFAs during denitrification. However, W A S were not measured to clarify these assumptions.
Good operational phosphorus release ranges from 5- 10 times the influent phosphorus concentration. If 5 m a of phosphorus was to be treated, then the release in the anaerobic zone should range fiom 25-50 m g L Whereas, if 12 m g L of phosphorus was to be treated, then the release in the anaerobic zone should range fiom 60-120 m a . When slugs of filtrate or supernatant entered the system, the amount of phosphorus increased dramatically throughout the whole system.
In a typical wastewater treatment system, biomass contains 1.5 to 2.5% phosphorus per mass of volatile solids. In alternating anaerobic-aerobic conditions (BPR), the biomass will accumulate phosphorus levels far in excess of nutritional requirements to 5 to 7 % phosphorus, and even as high as 12 to 15%. Phosphorus removal efficiency depends on the phosphorus content of the sludge removed and the efficiency of the solids separation process (Grady et al., 1999).
Actual operating data remained fairly consistent with the theoretical data, given the ranges of operation. During times of operational upset, the system was overloaded with nutrients. Extremely high concentrations of phosphorus and ammonia did not allow the biological system to work efficiently.
Nitrogen
Influent nitrogen was primarily ammonia, which is usually the case for municipal WWTPs. Typical influent ammonia concentrations ranged from 25-30 mg1L. Typical influent nitrate concentrations ranged from 0.5-1.0 mgL. Ammonia is nitrified in the aerobic zone, then recycled to the anoxic zone for denitrification. For normal operation and efficient removal of nitrogen to produce an effluent concentration of less than 10.0 mglL as N, nitrate concentrations of less than 8.0 mg/L should be achieved in the aerobic zone. Tertiary denitrification filters were available for further denitrification after the final clarifiers. Operators typically implement tertiary denitrification if nitrate concentrations reached 9.0 mg/L or higher entering the final clarifiers. If the limits were lower, other control strategies would need to be evaluated.
Very few of the operational upsets affected nitrogen removal. Ammonia was the primary source of nitrogen in the plant influent. High concentrations of ammonia were also returned to the plant influent in the digester supernatant and belt press filtrate. Nitrification was extremely efficient,

and slug inputs of ammonia usually resulted in limited denitrification. The ammonia concentration in the WAS was typically less than 0.3 mg/L, because nitrification had already occurred.
Acetic acid was fed to tertiary denitrification filters if complete denitrification did not occur in the anoxic zone. The denitrification filters were used occasionally, usually because of a slug input of ammonia. The reduction of nitrates was typically about 50% due to denitrification.
COD
The minimum, maximum and average COD values are summarized in Table 8. An average profile of COD throughout the treatment process is illustrated in Figure 18. Because the COD concentrations throughout the plant were comparable for each BNR process, this profile was obtained by averaging data fiom each process. The typical influent COD concentrations ranged from 200-250 mgL, and they steadily decreased throughout the plant as soluble organics were removed from the waste stream. The results from COD profiles were used to monitor the degradation of soluble organics throughout the treatment process. The typical effluent COD concentration ranged from 8- 15 mgL.
Table 8. Maximum, minimum and average COD concentrations in all operational phases throughout the treatment process (Day 1 - Day 541).
D-NITE 21
0
. 10
FCI 89
0
. 36
OXlC 72
0
, 41
FCE 29
0
. 13
ANX- EFF 93 5
53
ANA- EFF 252
37 , 112
ANA- INF 244
43 119
ANX-INF 94
20
, 55
PCE 394
126 208
COD (mglL)
Maximum Minimum Average
INFL 304
182 231

Figure 18. Average profile of COD concentrations in all operational phases throughout the treatment process (Day 1 - 541).
INFL
231
Recycle Rates
The recycle rates were kept fairly constant throughout all phases of the study. The anoxic recycle rate was 65% of the influent flow, the aerobic recycle rate was 85% of the influent flow,
PCE
208
and the RAS rate was 80% of the influent flow.
Second Treatment Train
An identical treatment train was placed in service parallel to the first train on March 5,
ANA-INF
119
(Day 58), with flow routed equally through both trains. Comparative analyses of grab samples collected throughout each of the parallel treatment trains indicated that both were operating similarly. Representative data from this comparative analysis are presented in Figure 19.
ANA-EFF
112
ANX-INF
55
ANX-EFF
53
AER
41
FCI
36
FCE
I 3
EFFl
10

30 Day 86 Flow = 4.060 MGD Acetic Acid = 668 gpd
3C:- -. -- - - --
Figure 19. Comparison of phosphorus concentrations in parallel treatment trains during Phase 2 on April 2 (Day 86).
SIDESTREAM EFFECTS
Co-Thickening of WAS
The final clarifier waste sludge was not sent to the digester directly but was routed back to the influent flow and co-thickened in the primary clarifier with the influent solids. It was imperative to maintain low sludge blankets in the primary clarifiers to minimize secondary phosphorus release. Secondary phosphorus release in the primary clarifiers varied and appeared to be dependent on the wasting rate and whether or not alum was added to the final clarifiers. As the wasting rate increased, the phosphorus concentration in the primary clarifier effluent increased as well. Figure 20 compares the raw influent phosphorus concentration to the primary clarifier effluent phosphorus concentration. These data were collected early in Phase 2, prior to other sidestream additions (supernatant, filtrate) to the head of the plant. The comparison indicates that phosphorus was released in the primary clarifier. The percent of phosphorus released in the primary clarifiers ranged from 0 - 50% release, with an average of 17% release.

10 I Dlnfluent
Figure 20. Phosphorus concentration (as POrP) of the plant influent and the primary clarifier effluent during the first month of operation in Phase 2.
Digester Supernatant
Prior to mechanical dewatering, the digesters were periodically decanted to thicken the digester sludge. The return of this supernatant to the head of the plant had a significant impact on plant operation, as illustrated in Figure 2 1. Elevated levels of phosphorus occurred throughout the plant. The phosphorus concentration increased by approximately 6.0 mg/L (approximately 50 pounds of phosphorus per million gallons) between the plant influent and the primary clarifier effluent. The uptake of phosphorus in the aerobic zone resulted in a phosphorus concentration of 7.42 mgIL leaving the aerobic zone. The final clarifier effluent phosphorus concentration was 8.02 mgL, considerably higher than the fbture discharge limit of 1.0 mgL. Once the supernatant slug was completely through the system, phosphorus levels returned to less than 1 rng/L, indicating a return to stable performance. Figure 22 summarizes the effluent phosphorus concentrations over the time when periodic decanting of the digesters occurred. Since the addition of mechanical dewatering, the digesters were decanted only when absolutely necessary.

I+ Phosphoru!
Future NPDES permit limit for P = 1.0 mglL
Figure 21. Phosphorus profile throughout the plant during Phase 2 on February 22 (Day 47) after supernatant addition from the digesters to the head of the plant.
- -- -. -
Process Start Up
EFFL
8.74
Figure 22. Summary of effluent phosphorus concentrations while periodically decanting the digesters to the head of the plant during Phase 2.
FCE
8.02
FCI
8.55
AER
7.42
EFF
9.34
ANX-INF
9.17
ANA- EFF
23.70
INFL
3.66
PCE
9.48
ANA-INF
15.66

Belt Press Filtrate
A mobile dewatering facility (belt press) was installed in February 1999, which eliminated decanting the digesters back through the plant. The filtrate from the belt press was sent directly to the head of the plant and/or to a filtrate holding basin where it was discharged to the head of the plant over a 24-hour period, thus eliminating spiked input levels of phosphorus. The impact of the returned filtrate was not as significant as the impact of the supernatant from the digesters, but the concentration of phosphorus throughout the plant increased, as illustrated in Figure 23. Periodic alum addition to the final clarifiers was necessary to reduce the effluent phosphorus concentration to less than 1.0 mg/L.
=
EFF AER FCI FCE EFFL ANA- ANX-INF
EFF INFL PCE
INF
6.50 12.20 17.40 25.90 13.80 12.80 1.90 1.66 0.15 0.18
Figure 23. Phosphorus profile throughout the plant during Phase 2 on March 20 (Day 73) after filtrate addition from the belt press to the head of the plant.
Grab samples of the belt press filtrate were analyzed. The ammonia concentration was typically greater than 300 mg/L, and the phosphorus concentration was greater than 100 mgL.
Alum Addition
Operators typically implemented alum addition if phosphorus concentrations reached 0.80 mg/L or higher entering the final clarifiers, or when a suspected upset would occur. Upsets were

primarily caused by slug inputs of digester supernatant or belt press filtrate, or increased wasting to the primary clarifiers. Data for each day of alum addition are presented in Appendix B.
Alum was fed to the distribution box that routed flow to the final clarifiers. Addition of alum upstream of the final clarifiers provides a high level of phosphorus removal. At this point in the treatment process phosphorus was typically in the form of orthophosphate, which can be precipitated with alum or included with the biomass (Argaman et al., 1991).
One mole of alum will precipitate one mole of phosphorus. However, the other competing reactions and their associated equilibrium constants must be considered, along with the effects of the alkalinity, pH, trace elements, and ligands found in wastewater (Metcalf & Eddy 199 1). Calculated directly, 0.28 pounds of alum are required to precipitate 1.0 pound of phosphorus. A safety factor of at least 1.5 is recommended, therefore 0.42 pounds of alum should be used for each pound of phosphorus. The Water Environment Federation (1998) provides a plot for estimating the alum to phosphorus ratio by choosing a residual phosphorus concentration. Based on an effluent phosphorus concentration of less than 1.0 mg/L, using a 1.5 alum to 1.0 phosphorus ratio was reasonable.
Alum feed was initiated for the first time on March 1, 1999, (Day 54) during Phase 2 when the plant was operating in the UCTNIP process configuration. Due to impending NPDES permit limits, Charlotte-Mecklenburg Utilities issued an internal mandate to meet future permit limits beginning March 1, 1999. Alum was fed for 30 days. It was found that two to five times the theoretical amount of alum needed to precipitate the additional phosphorus was used after comparing the pounds of alum theoretically needed to the actual pounds of alum used. This overuse suggests that alum addition can be further optimized to lower costs of treatment.
Many operational changes and upsets occurred at the plant during Phase 3 (UCTMP process with supplemental alum addition). NPDES permit limits had been implemented, and it was necessary to supplement BNR with alum addition for 3 % months. Alum addition was optimized based on the concentration of phosphorus entering the final clarifiers.
Supplemental alum addition also occurred during Phase 4, when the CNC process failed in late October 1999, and when the filtrate basin was emptied in late December 1999. Periodic alum additions also occurred throughout 2000 (Phase 5 and 6) when necessary.
As the concentration of phosphorus to be removed increased, a point was reached at which typical metabolic needs were insufficient to remove the required amount. Supplemental alum addition was then necessary to meet the discharge limits. In most cases, the phosphorus concentration was between 1 .O-2.0 mg/L in the aerobic zone effluent. A low dosage of alum was fed to precipitate the additional phosphorus, resulting in effluent concentrations typically less than 0.2 m a .
The addition of alum for phosphorus removal results in more sludge production. Chemical sludge, because of alum addition, results from aluminum phosphate precipitate, and aluminum hydroxide precipitate formed from aluminum in excess of stoichiometric amounts. A significant increase in sludge production did not occur during the study due to the low dosage of alum needed for additional phosphorus removal.

Although BNR plants are designed and operated to perform as expected, it is still necessary to provide chemical backup for phosphorus removal. Use of alum as a backup or supplement for biological phosphorus removal at McDowell Creek WWTP proved to be very successful. Most supplemental alum additions resulted from belt press filtrate addition. However, mechanical failures at the plant necessitated the use of alum additions on occasion, such as when the acetic acid pump failed.
Example Calculations for Alum Addition
Given an influent phosphorus concentration of 5 mgL, a flow of 1.0 mgd, and a effluent phosphorus limit of 1.0 mgL, the theoretical amount of alum that should be added to meet permit limits can be calculated. The total mass of phosphorus in the influent is approximately 42 pounds per day. To meet effluent permit limits, approximately 34 pounds per day of phosphorus needs to be removed. Based on the molar ratio of 1 mole alum to 1 mole phosphorus, 0.28 pounds of alum needs to be added to precipitate 1 pound of phosphorus. Accounting for the effects of competing reactions, and to be certain effluent permit limits are met, typically a safety factor of 1.5 is used. The result is 0.42 pounds of alum needed for each pound of phosphorus. In this scenario, 14.28 pounds (203 gallons) of alum are used per day.
Mechanical Failures
Miscellaneous mechanical failures occurred during the study and seriously impacted the BNR process. An acetic acid pump was removed from service, eliminating the supplemental VFA fed to the first anaerobic zone. This compromised the biological process, and the aerobic uptake in the first treatment train was minimal. When flows from both treatment trains were combined, phosphorus concentrations were greater than 1.0 mg/L and supplemental alum addition was necessary.
The pump that controlled filtrate addition to the head of the plant failed and filtrate was sent directly to the head of the plant while the belt press was in operation. The belt press was typically in operation 6-8 hours per day, except weekends. The unregulated return of filtrate resulted in operational upset, and the initiation of alum addition and the use of denitrification filters were necessary.
Emergency generators are available in the case of a power failure. When the power source is switched, many computer-generated controls must be reset. In the time it takes an operator to make hisher way around the facility, power failures can result in operational upsets. Experience with power failures has led to the development of an operator checklist, and fewer operational upsets.
Operational Failures
McDowell Creek WWTP was retrofitted from conventional activated sludge treatment to full BNR capability. All of the previous basins were used in the upgrade, which presented some constraints on the design of the facility. Although few, operational failures occurred throughout the study. After extensive process testing and data analysis, three areas of the treatment system were targeted as "problem areas".

The anaerobic zone contains four complete mix cells. It was difficult to distinguish when the primary phosphorus release had occurred and whether a secondary release of phosphorus had occurred as a result of extended detention time. Secondary phosphorus release is triggered by the absence of nitrate and oxygen thereby resulting in anaerobic conditions with no carbon source available for uptake by the PAOs. A secondary release in the anaerobic zone was occumng during the CNC process configuration, so two cells were taken off-line.
The anoxic zone contains two complete mix cells. Denitrification occurred rapidly in the first cell, and it was necessary to maintain a sufficient carbon source throughout the anoxic zone to prevent secondary phosphorus release. Secondary phosphorus release occurred periodically in the second cell of the anoxic zone. If additional acetic acid was fed to the anaerobic zone, denitrification was enhanced in the anoxic zone, and secondary phosphorus release did not occur.
The aeration basins are old final clarifiers that receive the flow from the large rectangular oxic basins and recycle flow to the anoxic zone. The aeration basins have course bubble diffusers and can maintain a low DO. Complete nitrification and phosphorus uptake occurred in the first oxic zone. It was necessary to maintain a positive DO level in the aeration basins to prevent secondary release of phosphorus and denitrification from occurring.
PHASE 1 - START UP AND BNR ACCLIMATION
The McDowell Creek WWTP BNR process upgrades were in start-up mode during the first two months of the study. Although the biological nitrogen removal process was in operation and performing efficiently within a month of start-up, the biological phosphorus removal was not performing efficiently. Since the plant was not yet required to meet NPDES permit limits for phosphorus and nitrogen, start-up mode was utilized for BNR optimization, operator training, laboratory methods development, and background research.
PHASE 2 - START UP AND OPERATION OF THE UCTIVIP PROCESS
When the UCTNIP process was initially put on-line, acetic acid was not fed to the anaerobic zone. The primary clarifier effluent is routed through the anaerobic zone, and if sufficient influent VFAs are available, phosphorus removal will occur. After monitoring the process and testing for influent VFAs, it was determined that a supplemental VFA source was necessary in the anaerobic zone to enhance phosphorus release and subsequent uptake in the aerobic zone. Black & Veatch sent influent composite samples on two different occasions to an outside laboratory to analyze for the following VFAs: acetic acid, propionic acid, isobutync acid, butync acid, isovaleric acid, valeric acid, isocaproic acid, caproic acid, and heptanoic acid. The results indicated that VFAs were non-detectable in the influent. Figure 24 compares the results of the treatment process with and without a supplemental acetic acid feed. The first phosphorus profile was analyzed on December 18, 1998, prior to supplemental acetic acid addition to the anaerobic zones. The second phosphorus profile was analyzed on February 6, 1999 (Day 3 l), approximately 3 weeks after supplemental acetic acid addition was initiated to the anaerobic zones. In the second profile, the phosphorus release increased by approximately 5.0 mg/L. The uptake of phosphorus in the aerobic zone was significant and resulted in a phosphorus concentration well below 1.0 mg/L leaving the aerobic zone, compared to 1.90 mg/L of phosphorus leaving the aerobic zone when no acetic acid was added. The final effluent

phosphorus concentration was less than 0.20 m g L in the process supplemented with VFA addition, but 1.75 mg/L when no supplement was provided.
+without supplemental VFAs
- 4 - with supplemental VFAs
I
Anaerobic P , ' ', Release I ' I
, ' - - - - - - - - , *- -
I '
. - - - - - a
INFL ANA-INF ANA-EFF AER-INF AER-EFF EFFL
5.48 20.51 22.38 3.68 1 .90 1.75
5.39 22.58 29.50 3.24 0.39 0.19
Figure 24. Comparison of treatment process without supplemental acetic acid (December 18, 1998) and with supplemental acetic acid (February 6, 1999 - Day 3 1).
Typical profiles of nitrate, phosphorus, and ammonia throughout the first and second treatment trains during the UCTNIP process are illustrated in Figures 25 and 26, respectively. The influent and effluent anaerobic cell concentrations illustrate the phosphorus release that occurred in the anaerobic zone. The phosphorus release typically yielded phosphorus concentrations between 25-35 mg/L in the anaerobic effluent, which was within good operating range. In the aerobic zone, the luxury uptake of phosphorus reduced the concentration of phosphorus to less than 0.5 mg/L. Effluent phosphorus concentrations of less than 0.2 mg/L were achieved. The release of phosphorus that occurred in the second treatment train was consistently greater than that of the first treatment train, but each train operated within the expected range for phosphorus release.
The ammonia was nitrified in the aerobic zone resulting in a nitrate concentration of 5-7 mgL, which was within good operating range. The nitrified recycle to the anoxic zone resulted in a nitrate concentration of less than 2 mg/L, which indicated efficient denitrification. Typical final clarifier effluent nitrate concentration ranges from 5-7 mglL were achieved, while ammonia was reduced to less than 0.1 mg/L.

Figure 25. Typical profile of phosphorus, nitrate, and ammonia throughout the 1'' treatment train on Day 95 during the UCTNIP BNR process configuration (Phase 2).

Figure 26. Typical profile of phosphorus, nitrate, and ammonia throughout the 2nd treatment train on Day 95 during the UCTMP BNR process configuration (Phase 2).
- - . - - -- --
Acetic Acid_=J72 gpd
-
5 - - - --- -- -
The UCTNIP was successful in removing phosphorus and nitrogen from the wastewater to meet permit limits. The process required close monitoring to ensure efficient removal. When operational changes occurred, it was mandatory to take the steps necessary to meet permit limits. Operational changes that occurred during Phase 2 included supernatant and filtrate releases to the head of the plant, and start-up of a second treatment train. The plant must always have alum on site so the phosphorus removal can be carried out chemically with alum precipitation in the final clarifier in case of operational problems with the biological nutrient removal. Denitrification filters after the final clarifiers are also available to supplement denitrification of the wastewater before leaving the plant.
+Ammonia
+Nitrate
+Phosphorus
PHASE 3 - OPERATION OF THE UCTPVIP PROCESS WITH SUPPLEMENTAL CHEMICAL PHOSPHORUS REMOVAL
Effective May 1, 1999, the plant was required to meet new NPDES permit limits based on 6.0 MGD discharge as previously shown in Table 1. To ensure compliance with the NPDES mandated phosphorus and nitrogen limits, provisions for supplementary alum dosing (chemical phosphorus precipitation) and denitrification filters were made if biological removal processes proved insufficient for nutrient removal to meet permit limits.
INFL
28.50
0.80
7.17
PCE
21.80
0.90
7.76
ANA-INF
7.90
0.70
14.30
EFF
8.70
0.70
32.30
ANX-INF
6.90
1.60
20.80
EFF
6.70
0.60
16.60
AER
0.11
5.70
0.20
FCI
0.06
5.10
0.27
FCE
0.06
5.80
0.19
EFFL
0.01
6.10
0.22

The acetic acid pump that fed the first treatment train failed on May 5 (Day 119) and was out of service for 3 months. The loss of the acetic acid feed into the first treatment train prevented VFA uptake and subsequent phosphorus release, so that the aerobic luxury uptake was minimal. Although the second treatment train was still operating efficiently, when flows from the two treatment trains were combined, phosphorus concentrations in the final clarifier were elevated. Alum was dosed to the final clarifier influent stream to precipitate phosphorus. Figure 27 illustrates the differences that occurred between train 1, where there was little release of phosphorus in the anaerobic zone, a secondary release of phosphorus across the anoxic zone, and the uptake up phosphorus in the aerobic zone resulted in 3.80 mg/L of phosphorus leaving the aerobic zone; and train 2, where a good release of phosphorus occurred in the anaerobic zone, and the uptake of phosphorus in the aerobic zone resulted in 0.90 mg/L of phosphorus in the aerobic effluent.
- 4 - Train 2 Phosphorus
DAY 140 *Train 1 Phosphorus - 4 - Train 2 Phos~horus
ANA- ANA- ANX- ANX- lNFL I I INF I EFF / INF / EFF / AER I FCI I FCE I EFFL
Figure 27. Comparison of phosphorus concentrations through parallel treatment trains during Phase 3 on Day 140 when acetic acid was not fed to train 1.
The acetic acid pump that feeds the second treatment train was adjusted to pump acetic acid to both treatment trains. Although the first treatment train did not receive as much acetic acid as the second treatment train, the biomass in the first treatment train was able to return to fairly efficient performance. The pump rate of alum into the final clarifier was decreased daily based

on the performance of the biological phosphorus removal process and eventually discontinued, as illustrated in Figure 28.
- - Train 2 Phosphorus
DAY 147 A -Train 1 Phosphorus - - Train 2 Phosphorus
ANA- ANA- ANX- ANX- lNFL I PCE I INF I EFF I INF I EFF 1 I FCI I FCE I EFFL
Figure 28. Comparison of phosphorus concentrations during Phase 3 on Day 147 as biological removal efficiency was improved and alum feed was reduced.
A temporary increase in nitrate concentrations also occurred throughout the plant in the beginning of Phase 3. The effluent nitrate concentration increased to approximately 10 m a , as illustrated in Figure 29. The increase in nitrates appeared to be due to an increased frequency of belt press filtrate addition directly to the head of the plant when the filtrate holding basin was full. The belt press filtrate acted as a slug input and added a substantial concentration of ammonia to the treatment process. For hrther denitrification, the denitrification filters were utilized, and a significant decrease in effluent nitrates was achieved, as illustrated in Figure 30. The nitrate concentration in the final clarifier effluent was 10.9 mg/L before the filters were put on-line and 5.2 m g L after they were in use.

1 4 - Nitratt
DAY 135
Figure 29. Nitrate concentrations throughout the treatment process on Day 135 during Phase 3 when a slug input of belt press filtrate was added directly to the head of the plant.
DAY 142
Filtrate Addition (high in NH,)
FCE
10.20
* Denitrification Filters
1
EFFL
9.80
ANX-INF
2.20
ANA-EFF
0.60
Figure 30. Nitrate concentrations throughout the plant during Phase 3 on Day 142 when use of denitrification filters following final clarification was necessary after a slug input of belt press
filtrate was added directly to the head of the plant.
ANA-INF
0.70
INFL
0.70
ANX-EFF
1.30
PCE
0.90
AER
8.90
FCI
10.40

The UCTNIP BNR process with supplemental chemical nutrient removal was on-line through the summer of 1999. Biological phosphorus removal was not able to consistently reduce the effluent phosphorus concentration to less than 1.0 mg/L, due to the loss of first stage acetic acid and the return of phosphorus-laden filtrate to the head of the plant. Biological nitrogen removal was unable to consistently reduce the effluent nitrate concentration to less than 10 m a , due to the return of filtrate with a high ammonia concentration to the head of the plant. The BNR process was overloaded with high nutrient concentrations. Alum addition to the final clarifiers and acetic acid addition to the denitrification filters was monitored closely by the plant staff and adjusted as necessary to meet NPDES nutrient discharge limits. The acetic acid pump was replaced in August, and the pump rate of alum into the final clarifier was decreased daily based on the performance of the biological phosphorus removal. Steady state operation was achieved within 2 weeks of replacing the acetic acid feed to the first stage anaerobic zone.
A summary of the effluent phosphorus and nitrate concentrations throughout the second and third phases of research is summarized in Figures 3 1 and 32, respectively. Operational problems and process changes that occurred during these phases are noted in the figures. Identifying the cause of the problem, the impacts on the BNR process, and the remedy action taken aided in determining the potential problems and solutions for long term BNR operation. The first three phases were a trial period for the plant staff and researchers. Valuable data were collected and knowledge gained for later phases of the research and for future operation of BNR facilities.
During short periods from day 75 to day 130, some of the higher nitrate levels were due to slug inputs of the belt press filtrate. Low nitrate data points of less than 4 mg/L were typically achieved though use of the denitrification filters.
10
- .-- - - - - (no alum) 9 -
Effluent Phosphorus Supernatant Release -- - - - - - - -- - --
Start up
- . - - - - - - - -
NPDES permit limit (Beginning
Figure 3 1. Summary of effluent phosphorus concentrations during Phases 2 and 3 (Day 1 - Day 238).

( A Effluent Nitrate I A
NPDES permit limit (Beginning
4 Day 11 5) for NO3-N = 10.0 mg/L --
A A A
A A A A A A A
A A A A A A
AA - - - - - - -- - + - -
A: \ - --!?
--- A
A 1--
& A C A
4 A A A A r A A C ~ A A
- - - - - - - - - A -: A -& A A A A A A % - &:A A-yA A A +
A A + A A A 4 A A A
A . A 1::. ;:
Figure 32. Summary of effluent nitrate concentrations during Phases 2 and 3 (Day 1 - Day 238).
PHASE 4 - START UP AND OPERATION OF THE CNC PROCESS
The BNR configuration was changed to the CNC process on September 2, 1999, (Day 239) once the previous BNR process (UCTNIP) had achieved steady state operation. The transition between process modes was smooth, however a small dose of alum was fed to the final clarifiers as a precautionary measure. A typical profile of nitrate, phosphorus and ammonia concentrations recorded during steady state operation of the CNC process is illustrated in Figure 33. The phosphorus release typically yielded phosphorus concentration ranges of 35-45 mg/L in the anaerobic effluent, which was within a good operating range of 25-70 m a . Similar to the results of the UCTMP process, effluent phosphorus concentrations of less than 0.2 mg/L were achieved. Typical effluent nitrate concentration ranged from 5-7 m a , while ammonia was reduced to less than 0.1 m g L

I+ Phosphorus
I-+ Nitrate
Flow = 3.996 MGD Acetic Acid = 1600 gpd
- - - - - - - -
- - - -- - - - - -
- -
Figure 33. Typical profile of phosphorus, nitrate and ammonia throughout the treatment process on Day 274 during the CNC BNR process configuration (Phase 4).
The CNC process was successful in meeting permit limits with belt press filtrate additions for about 2 months. At the end of October, effluent phosphorus and nitrate concentrations increased. Effluent phosphorus and nitrate concentrations during the CNC process are summarized in Figures 34 and 35, respectively.

1 rn Effluent Phosphorus 1
NPDES permit limit for P = 1.0 mglL I , rn
- - - - - - - - - - - - -. - - - .-
5 , , .,+-.. + . ly 5.: -,. . .= . , ,
Process Failure I I I I I I . I
Figure 34. Summary of effluent phosphorus concentrations during Phase 4 (Day 239 - Day 323).
A Effluent Nitrate
NPDES ~ e r m i t limit for N = 10 mnlL
Denitrification -) Filters Operating
4- Process Failure
Figure 35. Summary of effluent nitrate concentrations during Phase 4 (Day 239 - Day 323).

Extensive process control tests were run to determine the change in the system. At meetings involving plant operations staff, several hypotheses were posed to explain the process changes, including nitrate inhibition in the anaerobic zone caused by incomplete denitrification, cold weather stress, and prolonged anaerobic detention time (resulting in secondary phosphorus release) perhaps caused by failure of an anoxic recycle pump. Cold weather stress is an unlikely cause since BNR processes operate successfblly in much colder climates and lower water temperature. A plot of water temperature data collected is illustrated in Figure 36. During the CNC process, the water temperature decreased from 26OC to 18OC. However, BNR processes should operate efficiently at 18OC. The reported failure of the anoxic recycle pump and resulting secondary release of phosphorus seems to confirm a prolonged detention time. However, limited plant operational records and insufficient data were available during this event to reach a conclusion.
Figure 36. Water temperature during the CNC process evaluation (Phase 4, Day 239 - 323).
Figure 37 compares phosphorus and nitrate data collected on October 7 (Day 274) during efficient performance of the CNC process with phosphorus and nitrate data collected on November 5 (Day 303) during operational failure. During operational failure, there was virtually no phosphorus release in the anaerobic zone, a secondary release of phosphorus across the

anoxic zone, and the uptake of phosphorus in the aerobic zone resulted in a phosphorus concentration of 4.87 m a , significantly higher than the optimal 0.5 mg/L. Nitrate concentrations were greater than 13 mg/L in the aerobic zone, and showed no indication that denitrification was occumng across the anoxic zone. Nitrate concentrations in the plant effluent were significantly elevated. When the CNC process was performing efficiently, a good phosphorus release occurred in the anaerobic zone, and the uptake of phosphorus in the aerobic zone resulted in 0.42 mg/L of phosphorus in the aerobic effluent. Sufficient denitrification occurred in the anoxic zone, resulting in 5.30 mg/L of nitrate in the plant effluent.
Day 274 I I
Flow = 4.300 MGD I I A - Nitrate (Day 274)
35 --Alum-= 0 gpd - --- 7 - - - -
I s I
Day 303 I I
30 --Flow=-4;447-MGD- I- - - - t - - - -- - -
Alum = 381 gpd I
Acetic to filters = , I
- - - - - -
- - Phosphorus (Day 274) 7.10 9.82 27.84 38.51 14.23 13.60 0.42 0.14 0.13 0.1
- A - Nitrate (Day 274) 0.80 0.90 0.60 0.60 1.00 0.50 5.80 5.10 5.00 5.3
-&-Phosphorus(Day303) 7.00 13.40 24.97 25.19 14.61 19.12 4.87 3.16 0.99 0.9 Y Nitrate (Day 303) 0.90 0.80 0.70 1.20 3.10 5.50 13.70 14.20 13.00 13.1
Figure 37. Phosphorus and nitrate data collected during efficient CNC process performance (Day 274) and operational failure (Day 303).
After extensive process testing and the use of the backup protocol to meet permit limits, the plant manager decided to return to the UCTNIP BNR process because it had previously proven its ability to meet permit limits.
The CNC process was successfd in removing phosphorus and nitrogen from the wastewater to meet permit limits. This was the first time data were collected and documented for the CNC process. Due to the operational issues that occurred during this phase, further evaluation of the CNC process was necessary to form conclusions. The CNC process was revisited during Phase 6.

PHASE 5 - START UP AND OPERATION OF THE MODIFIED OWASA PROCESS
Before changing the BNR treatment process to the modified OWASA process, a series of process tests was performed. It was concluded that the UCTNIP process was performing efficiently and was operating in steady state. A grab sample of the RAS was tested for phosphorus and nitrate. The results indicated a phosphorus concentration of 2.5 mgL and a nitrate concentration of 5.0 mgL. Because the RAS is recycled to the anaerobic zone, there was concern that the nitrate in the RAS would inhibit the PAOs and result in consumption of the VFA feed intended for the PAOs. It was expected that the acetic acid feed would need to be increased for this configuration. On February 18,2000, (Day 408) the BNR process of the first treatment train was changed to the modified OWASA (MO) configuration for process stabilization and preliminary evaluation. When the change was first initiated, a valve was left cracked to let a small flow of primary clarifier effluent into the anaerobic zone along with the RAS. The acetic acid fed to the first stage anaerobic zone was significantly increased to provide sufficient VFAs for the PAOs. Typically 600 gallons of 20% acetic acid per day were fed to each anaerobic zone. The acetic acid feed was initially increased in the first stage anaerobic zone to 900 gallons per day. The amount of acetic acid fed to the first stage anaerobic zone was decreased daily. The nitrate concentration in the RAS was higher during the preliminary evaluation because it contained solids from both treatment trains (the second treatment train was still being operated in UCTNIP mode). The first treatment train performed efficiently after the acetic acid feed was reduced to normal, and the primary clarifier effluent feed was eliminated. A comparison of the treatment trains, each configured in a different BNR process, is illustrated in Figure 38. The amount of phosphorus release that occurred in each zone was comparable. The modified OWASA process maintained a higher concentration of phosphorus by approximately 10 mgL because only the RAS is routed into the anaerobic zone. In the UCT process configuration, the primary clarifier effluent is routed directly into the anaerobic zone and combined with the anoxic recycle flow.

Day 408 rn * , Flow = 5.040 MGD , ,
~ c e t i c ~ Z d ~ = 2 5 5 0 gpd; ,
- 4 - MO nitrate
1 *UCTNIP nitrate I
Figure 38. Preliminary evaluation of first train (modified OWASA) and second train (UCTNIP) on Day 408 during Phase 5.
On March 2 (Day 42 I), the second treatment train was changed to the modified OWASA process using the same methods of changeover implemented with the first treatment train. The acetic acid feed and primary clarifier effluent flow were decreased over the proceeding weeks. A typical profile of phosphorus, nitrate, and ammonia concentrations during steady state operation of the modified OWASA process is illustrated in Figure 39. The operating ranges of nutrients are comparable to the resulting profile of the UCTNIP process. However, the ammonia concentration is very low in the anaerobic zone because the RAS has already been nitrified.

I -m- Phosphorus 1
O I FF FCE EFFL
I
FCI
I+ phosphorus 6.70 7.21 16.49 26.95 18.33 12.60 0.27 0.21 0.18 0.11 r.30 6.70
Figure 39. Typical profile of phosphorus, nitrate and ammonia throughout the treatment process on Day 433 during the modified OWASA BNR process configuration (Phase 5).
Results from additional grab samples of the RAS are presented in Table 9. The nitrate concentration of the RAS is not as high as the other BNR configurations, however, the recycle of RAS resulted in an increase of nitrates in the anaerobic zone. Typical nitrate concentrations in the anaerobic zone during other BNR configurations range from 0.5-0.9 m a . During the modified OWASA process, typical ranges of nitrates in the anaerobic zone were 1 .O- 1.5 mgL. The acetic acid feed was increased to compensate for the additional nitrate concentrations, which were essentially making the first anaerobic cell anoxic.
During Phase 5 there were no significant problems with the belt press filtrate return. However, the back up nutrient removal protocol was required periodically throughout the operation of the modified OWASA process. Overall, the modified OWASA process was successful in removing phosphorus and nitrogen from the wastewater to meet permit limits. An increase in acetic acid feed was necessary to ensure efficient phosphorus removal. A comparison of all three BNR processes was conducted during Phase 6.

Table 9. Grab sample concentrations of phosphorus and nitrate (mgL as PO4-P and NO3-N) in the RAS during the modified OWASA BNR process configuration.
PHASE 6 - RE-EVALUATION OF ALL THREE BNR PROCESS CONFIGURATIONS (UCTNIP, CNC, AND MODIFIED OWASA) FOR COMPARISON OF PERFORMANCE AND COST
Phosphorus 4.00 4.90 6.40 5.00 4.50 2.50 3.30 2.00 3.40
Plant upgrades continued during the first five phases of research. The final upgrade was the addition of automatic DO mode in January 2000, which permits computer-controlled blower and DO regulation. The DO level was set at 5.0 mg/L in the aerobic zone, and the blowers operated to maintain a constant DO concentration of 5.0 mglL. Prior to automatic DO mode, the plant operated in air-flow mode, with the air flow operated at a constant 24-hour feed rate of 2500 cubic feet per minute (cfm). During low flow, treatment can be achieved at levels as low as 1500 cfm, and the additional air to the aeration basins skewed the power costs and treatment performance. Therefore, processes were not compared until the automatic DO mode was put on- line.
Nitrate 4.90 3.40 0.35 1.69 0.93 1.52 0.38 2.92 1.23
Table 10 compares data collected from both air modes during the UCTNIP process. Data fiom the blower building were recorded by the plant operators 5 times per day. A day in late- December operating in air-flow mode was compared to a day in early June operating in automatic DO mode. The cfm of air to the aeration basins for a 24-hour period was approximately 1250 cfm higher for the constant air flow mode, showing that the automatic DO mode is more cost efficient than the air-flow mode.
Phase 6 overlapped Phase 5, and commenced when the modified OWASA process was on-line. Once each process reached steady state, process and energy data were collected, and performance was evaluated. Steady state was assumed after a duration of at least one sludge age, which was approximately 10 days, and after process data showed consistent trends. Sludge age was calculated by dividing the mass of solids in the aeration basin by the solids removal rate from the system. The equation used to calculate sludge age was as follows:
Sludge Age (days) = Aeration volume (gal) * MLSS (mg/L) WAS (gal/day) * (1,000,000/Sludge Volume Index)

Table 10. Comparison of cfm and amps recorded during the UCTNIP process during air-flow mode and automatic DO mode.
The three BNR processes were compared based on cost and performance. Performance was rated on the efficiency of meeting permit limits without the initiation of chemical feeds. Costs were compared based on power consumption and chemical feeds. Data were reported by day number, with Day 1 starting on February 12,2000 when the modified OWASA process was implemented.
Process Differences
The modified OWASA process was evaluated from February 12 to April 16 (Day 1 - 65), the CNC process was evaluated from April 17 to May 2 1 (Day 66 - loo), and the UCTNIP process was evaluated from May 22 to July 3 1 (Day 10 1 - 17 1). Each process performed efficiently, and steady state performance and cost data were collected. The UCTNIP process utilizes all pumps and mixers. The CNC process requires only half the detention time in the anaerobic zones as the UCTNIP process, so two anaerobic cells from each treatment train were taken off-line, along with two mixers. The modified OWASA process also operates with two anaerobic cells from each treatment train off-line and does not have an anoxic recycle to the anaerobic zone. Therefore, along with four mixers, four anoxic pumps were taken off-line.
The CNC and modified OWASA processes are sidestream processes and the primary clarifier effluent is routed through the anoxic zone instead of the anaerobic zone. A smaller volume in the anaerobic zone is necessary to achieve the same retention time as a mainstream process, due to the reduced flow.
Temperature
Phase 6 began in February and ended in July. The change in temperature throughout Phase 6 was approximately 10°C, and is illustrated in Figure 40.

Flow
Modified OWASA CNC
Figure 40. Wastewater temperature throughout Phase 6.
As shown in Figure significantly during
41, the average daily flow was approximately 4.5 mgd, and did not vary Phase 6.
Acetic Acid
The amount of 20% acetic acid fed to the anaerobic zone is flow-paced and based on 5 mg/L of VFA to remove 1 mg/L of phosphorus (Grady et al, 1999). Although the influent phosphorus concentration typically ranged between 5-7 mg/L of phosphorus, the return of belt press filtrate to the head of the plant resulted in a phosphorus concentration range of 10-14 mg/L to be treated. Based on a flow of 4.5 mgd and a phosphorus concentration range of 10 mg/L - 14 mg/L, the acetic acid feed to the anaerobic zone should be approximately 1200 - 1600 gallons (55-75 mg/L) per day. The acetic acid is fed by a variable speed pump and adjusts as the flow varies throughout the day to provide a constant acetic acid feed of 55-75 mg/L.

Figure 41. Plant influent flow throughout Phase 6.
In late August, after the study was completed, it was discovered that only the acetic acid to the first treatment train was operating at a variable speed. The acetic acid pump that fed the second treatment train was operating at a constant rate of approximately 850 gpd. The acetic acid pump rate was dependent on the amount of phosphorus to be removed, and was set by the operators. Therefore, the acetic acid fed on a daily basis varied. More acetic was fed to the second train than to the first when less than 1700 gpd of total acetic acid were used in one day.
In reviewing the data from Phase 6, and comparing the first and second treatment trains, the second train performed more efficiently when less than 1700 gpd of acetic acid were used, likely because it received a constant 850 gpd, regardless of total acetic acid used. Figure 42 compares the parallel treatment trains on Day 52 of Phase 6 during the modified OWASA process configuration. A total of 1230 gallons of acetic acid were used, and since the second treatment train received 850 gallons, the first treatment train only received 380 gallons. The uptake of phosphorus in the first aerobic zone resulted in a phosphorus concentration of 2.69 mgL, whereas the uptake of phosphorus in the second aerobic zone resulted in a concentration of 0.22 mg1L. The difference in performance between the treatment trains was consistent.

4 1st Train
- - 1 - - 2nd Train
Day 52 Modified OWASA -Acetic-Acidto- - 1st Train = 380 gpd 2nd Train = 850 gpd
- - - . - - - - - T -
-- - - - - - - - - - - -
Acetic Acid Addition
Figure 42. Comparison of release and uptake in the first and second treatment trains on Day 52 of Phase 6 during the modified OWASA process configuration.
I
Waste Rate, SRT, MLSS
ANA-INF
22.48
18.92
For efficient BNR, deBarbadillo and Wallis-Lage (Black & Veatch, July, 2000) recommend maintaining a younger sludge by increasing the wasting rate and decreasing the SRT. Because of their recommendation, throughout Phase 6, the MLSS in the aerobic zone and the SRT decreased, while the wasting rate was increased. The average MLSS, SRT, waste rate and primary clarifier effluent phosphorus concentration for each BNR configuration during Phase 6 is presented in Table 1 1.
Table 1 1. Average MLSS, SRT, and waste rate for each BNR process configuration during Phase 6.
ANA-EFF
32.16
25.36
ANX-EFF
13.72
10.71
BNR Process Configuration
Modified OWASA
CNC UCTNIP
OXlC
2.69
0.22
MLSS
(mglL) 3500
3000 2500
SRT
(days) 9.0
7.5 4.0
Waste rate
( g ~ d ) 60,000 90,000 120,000
Primary Clarifier Effluent Phosphorus (mg1L)
8.14 11.27 12.62

The WAS was co-thickened in the primary clarifiers, therefore as the waste rate increased, the concentration of phosphorus in the primary clarifiers increased. The phosphorus concentration in the primary clarifier effluent and plant effluent throughout Phase 6 is illustrated in Figure 43. On Day 1, the MLSS was 4000 mg/L and the SRT was 15 days. On Day 17 1, the MLSS was 1900 mg/L and the SRT was 3 days. When the process was changed to the CNC process, the waste rate was increased and phosphorus concentrations in the primary clarifier effluent were elevated. Alum feed was initiated periodically to chemically precipitate the additional phosphorus loading.
It was difficult to compare the BNR processes due to the frequent adjustments of the wasting rate. Increasing the phosphorus loading throughout the treatment system resulted in the addition of alum to the final clarifiers to meet permit limits. Although the processes were still performing biologically, each process was operated differently, making it difficult to draw absolute comparisons during the three BNR processes.
17 4-1 Effluent - -- --
Figure 43. Phosphorus concentrations in the primary clarifier effluent and plant effluent throughout Phase 6.

Phosphorus Release and Uptake
Each BNR process configuration evaluated differs mainly in flow and recycle. Phosphorus release and uptake were calculated in pounds to normalize for the varying flows in the different zones of each process. Figure 44 presents phosphorus release versus phosphorus uptake for each BNR process. There does not appear to be any unique relationship between phosphorus release and phosphorus uptake for any BNR process based on regression analysis of the data.
Uptake - MO
. - - -- - . - - - - - - - -- - --. -- Uptake -CNC
0 Uptake - UCTNIP
- - - Linear (Uptake - MO)
I - Linear (Uptake - CNC) - - Linear (Uptake - UCTNIP)
I I I I I
0 100 200 300 400 500 600
Release (Ibs)
Figure 44. Phosphorus release versus uptake for each BNR process during Phase 6.
Supplemental VFA feed (acetic acid) was based on the amount of phosphorus to be removed. Phosphorus release in the anaerobic zone as a function of VFA feed for each BNR process is presented in Figure 45. Flows in each zone varied by BNR configuration. Phosphorus release was calculated as follows:
Phosphorus Release (lbs) = (mgL anaerobic effluent - mg/L anaerobic influent) * 8.34 lb * Flow in anaerobic zone (MGD) 1 o6 gal

Phosphorus uptake in the aerobic zone as a function of VFA feed for each BNR process is presented in Figure 46. Phosphorus uptake was calculated as follows:
Phosphorus Uptake (lbs) = (mgL anoxic effluent - mg/L aerobic effluent) * 8.34 lb * Flow in aerobic zone (MGD) 1 o6 gal
Based on various studies, excess phosphorus uptake should be associated with the degree of release. However, phosphorus uptake is also associated with the growth phase of the biomass in the MLSS. In laboratory studies, complete removal of phosphorus occurred during the stationary growth phase (Momba and Cloete, 1996). A larger uptake of phosphorus was expected in the aerobic zone as a result of a larger release of phosphorus in the anaerobic zone. Although the data do not illustrate this relationship, it is possible that not enough data were collected under optimal operating conditions to be statistically significant.
Release - MO
Release - CNC
0 Release - UCTNIP
- - - Linear (Release - MO)
- Linear (Release - CNC)
- - Linear (Release - UCTNIP)
0 50 I00 150 200 250 300
VFA (I bs)
Figure 45. Phosphorus release in the anaerobic zone versus VFA feed for each BNR process during Phase 6.

Figure 46. Phosphorus uptake in the aerobic zone versus VFA feed for each BNR process during Phase 6.
1600
1400
1200 -
h
U)
G w 2 w (P 1000 -
P 3
800 -
600 -
400
During the UCTNIP process, the uptake of phosphorus increased as the VFA feed increased ( R ~ = 0.86). None of the other processes showed a significant relationship between phosphorus release or uptake as a function of VFA feed. An optimal level of acetic acid addition must be maintained for efficient phosphorus removal. Enough acetic acid must be added to enhance phosphorus release under anaerobic conditions, however excessive acetic acid will break through into the aerobic zone and hinder phosphorus uptake. Each BNR process differs by flows and recycles, and these differences must be accounted for when determining optimal acetic acid feed rates. Although the data do not illustrate this relationship, it is possible that not enough data were collected under optimal operating conditions to be statistically significant.
Phosphorus release and uptake appeared to be more dependent on the primary clarifier effluent phosphorous than the amount of VFAs fed to the anaerobic zone. Primary clarifier effluent phosphorus mass, phosphorus release in the anaerobic zone, and phosphorus uptake in the aerobic zone during Phase 6 are presented in Figure 47. The phosphorus release and uptake increases and decreases as the primary clarifier effluent phosphorus mass increases and decreases. This is probably due to increased levels of background phosphorus, as well as varied acetic acid and alum additions. Note that the mass balance for the amount of phosphorous taken up does not always equal the amount released plus the amount in the primary clarifier effluent. The reason for this is unknown and not explored further but it may be due to the sampling method not accounting for phosphorous mass in the solids settled out. Another explanation may
0 50 100 1 50 200 250 300
VFA (I bs)
0 . -- 1- - R' = 0.8635# --
8
/
0 I
/ @ R~ = 0.0407 -- -- - - - -- - - - - - -_ -_ - -,,-I-'_ -. -
0 I
I - - - -
- - - . - - - - . - - - s - - - j !- -,.-
- ' N 8 -
-
- - - - - -- .- - - - - - - - - -'
/ El
0 - - - - - -- r -
/#
I , I I I
Uptake - MO
Uptake -CNC
Uptake - UCTNIP
- Linear (Uptake - CNC) - - Linear (Uptake - UCTNIP)
- - - Linear (Uptake - MO)

be that the grab samples were collected from the anaerobic influent (Cell 1) and the anaerobic effluent (Cell 4). Phosphorous release in the anaerobic zone occurred rather quickly, and only 2 cells (instead of 4) are frequently used. It is possible that the grab sample was collected after phosphorous release started to occur. Therefore, the pounds of release would appear smaller than actual. The phosphorous in the PCE may vary as well, due to all the background phosphorous, most of that possibly still in the biomass when leaving the primary clarifiers.
Modified OWASA I CNC
Figure 47. Primary clarifier effluent phosphorus mass, phosphorus release in the anaerobic zone, and phosphorus uptake in the aerobic zone during Phase 6.
It was expected that the effluent phosphorus concentration would be dependent on the uptake of phosphorus in the aerobic zone; however, that was not the case. Also, the effluent phosphorus concentration was not dependent on the release of phosphorus that occurred in the anaerobic zone for any of the BNR processes. Figure 48 presents the phosphorus release in the anaerobic zone and the effluent phosphorus concentration throughout Phase 6. In most BPR situations, VFAs, phosphorous release, etc. are the controlling factors. That is the case at McDowell, but McDowell has a unique case of PCE-P also becoming a controlling factor - due to WAS co- thickening in the primary clarifiers and belt press filtrate that is returned to the head of the plant which ends up in the primary clarifiers. These 2 additions cause the PCE-P concentration to vary between 6-14 mg/L. This concentration has a big effect on the BPR process. High P concentrations cannot be efficiently handled. Since the conclusion of this research project, alum is now fed to the primary clarifier influent when P concentrations are high. The alum feed maintains the PCE-P concentration at about 6 mg/L. The BPR process has been stable for many

months under this scenario. The success of the alum feed indicates that the varying phosphorous influent concentration did have a significant effect on the BPR process, therefore was a controlling factor.
/ . Release - MO
1 Release - CNC
n a Release - UCTNIP
0 - Alum addition a
0.0 0.2 0.4 0.6 0.8 1 .O 1.2
Effluent Phosphorus (mglL as PO4-P)
Figure 48. Phosphorus release in the anaerobic zone versus effluent phosphorus concentration for all BNR processes during Phase 6.
Phosphorus Profiles
Each BNR process was efficient in removing phosphorus to meet permit limits. Occasional chemical polishing was necessary during operation of each BNR process. A profile of average phosphorus (mg/L as PO4-P) concentrations throughout the treatment process for each BNR configuration is illustrated in Figure 49. Each BNR process performed similarly, although the average phosphorus concentration in the primary clarifier effluent to be treated was higher during the CNC process and UCTNIP process trials.

Figure 49. Profile of average phosphorus (mg/L as PO4-P) concentrations throughout the treatment process for each BNR configuration during Phase 6.
Table 12 presents the average flow in each zone for each BNR configuration. Since each process differs in flow route and recycle flow, Figure 50 presents mass profiles of phosphorus (lbs as PO4-P) throughout the treatment process for each BNR configuration. By converting concentrations of PO4-P to mass of PO4-P, the flow in each zone is taken into account.

INFL 1 PCE I ANA-INF I ANA-EFF I ANX-INF I ANX-EFF I OXlC I FCI 1 FCE 1 D-NITE
Figure 50. Profile of average phosphorus (lbs as POrP) mass throughout the treatment process for each BNR configuration during Phase 6.
Table 12. Average flow (mgd) in each zone for each BNR configuration.
The modified OWASA process is a sidestream process. Therefore, the anaerobic zone had a lower overall phosphorus mass because the only flow it received was the RAS. A release of phosphorus occurred in the anaerobic zone, and flow was routed to the anoxic zone, where it combined with primary clarifier effluent flow (minimal phosphorus approximately 5 mg/L) and aerobic recycle (low phosphorus < 1mgIL) flow. Mass of phosphorus was highest in the anoxic zone, since all the flows combined here. When the flow reached the aerobic zone, a significant uptake of phosphorus occurred.
BNR Process , Confiauration Modified OWASA CNC UCTNIP
The CNC process configuration, like the modified OWASA process, is a sidestream process. The only flow to the anaerobic zone is the anoxic recycle. The CNC process performed similarly to the modified OWASA process; however, phosphorus concentrations were higher throughout
INFL (MGD)
4.5 4.5 4.5
PCE (MGD)
4.6 4.6 4.6
ANA-INF (MGD)
1.8 1.9 7.0
ANA-EFF (MGD)
1.8 1.9 7.0
ANX-INF (MGD)
10.5 11.0 12.3
ANX-EFF (MGD)
10.5 11.0 12.3
OXlC (MGD 10.5 11.0 12.3
FCI (MGD)
4.5 4.5 4.5
FCE (MGD)
4.5 4.5 4.5
D-NITE (MGD)
4.5 4.5 4.5

the anaerobic process. The increase in waste to the primary clarifiers returned an elevated phosphorus concentration to the treatment system.
The UCTNIP process configuration is a mainstream process, and primary clarifier effluent flow is routed directly into the anaerobic zone. This explains the much higher phosphorus mass in the anaerobic zone as illustrated in Figure 50. The UCTNIP process also performed similarly to the modified OWASA and CNC processes.
Figures 5 1,52, and 53 illustrate the average phosphorus profiles of the modified OWASA, CNC, and UCTNIP processes respectively. Error bars show the standard deviation, which are also presented in Table 13. For each process, the most deviation occurs in the anaerobic and anoxic zones. This deviation appears to occur due to the varying primary clarifier effluent phosphorus concentration, which ranges between 6 m g L and 14 mgIL, and even higher in some cases. The minimum, maximum, median, and average phosphorus concentrations for each point in the treatment process for each BNR configuration is shown in Table 14.
'r - - - INFL PCE ANA-INF ANA-EFF ANX-INF ANX-EFF OXlC FCI FCE D-NITE
6.80 8.14 17.59 27.13 13.05 10.51 0.68 0.66 0.41 0.29
Figure 5 1. Average phosphorus profile for the modified OWASA process during Phase 6. Error bars for each point in the treatment process represent one standard deviation.

. I----,- - -_-___I ,
INFL I PCE I ANA-INF I ANA-EFF 1 ANX-INF I ANX-EFF I OXlC I FCI I FCE I D-NITE
Figure 52. Average phosphorus profile for the CNC process during Phase 6. Error bars for each point in the treatment process represent one standard deviation.
Figure 53. Average phosphorus profile for the UCTNIP process during Phase 6. Error bars for each point in the treatment process represent one standard deviation.

Table 13. Mean (standard deviation) for each phosphorus point in the treatment process for each BNR configuration during Phase 6.
Table 14. The minimum, maximum, median, and average phosphorus concentrations ( m a as PO4-P) for each point in the treatment process for each BNR configuration during Phase 6.
BNR Process Configuration
ModifiedOWASA
CNC
UCTNIP
l ~ t a n d a r d Deviation 1 0.26 1 0.83 1 3.96 1 6.28 1 7.12 1 4.40 1 0.82 1 0.69 1 0.64 1 0.34 1
INFL (mglL) 6.80
(0.26)
6.35 (0.59)
6.00 (0.40)
BNR Process Configuration
PCE (mglL) 8.14
(0.83)
12.62 (5.05)
11.27 (1.43)
INFL PCE
UCTNIP Minimum
Nitrogen Profiles
Maximum Median
Average Standard Deviation
Each BNR process was efficient in removing nitrogen to meet perrnit limits. Occasional tertiary denitrification was necessary during operation of each BNR process, but only for a short time. A profile of average nitrate concentrations, mglL as NO3-N and lbs as NO3-N, throughout the treatment process for each BNR configuration are illustrated in Figure 54 and 55, respectively. A profile of average ammonia concentrations, mg/L as NH3-N and lbs as NH3-N, throughout the treatment process for each BNR configuration are illustrated in Figure 56 and 57, respectively. Each BNR process performed similarly, and the only differences in concentrations were noted in the process zones that vary in flow (previously discussed). Ammonia concentrations in the
ANA-INF (mglL) 17.59 (3.96)
29.06 (4.27)
16.65 (4.50)
ANA- INF
5.50 6.52 6.02 6.00 0.40
ANA-EFF (mglL) 27.13 (6.28)
41.94 (1 1.97)
21.85 (5.30)
ANA- EFF
8.60 13.55 11.53 11.27 1.43
ANX-INF (mglL) 13.05 (7.12)
12.40 (3.55)
12.38 (5.15)
ANX- INF
10.90 27.40 15.98 16.65 4.50
ANX-EFF (mglL) 10.51 (4.40)
10.49 (3.31)
10.64 (3.33)
ANX- EFF
14.50 31.70 21.50 21.85 5.30
OXlC (mglL) 0.68
(0.82)
1.24 (0.86)
1.35 (0.85)
OXlC
5.60 22.40 11.05 12.38 5.15
FCI (mglL) 0.66
(0.69)
0.71 (0.69)
1.28 (0.85)
FCI
6.65 14.30 10.80 10.64 3.33
FCE (mglL) 0.41
(0.64)
0.25 (0.08)
0.54 (0.25)
FCE
0.19
D-NITE (mglL) 0.29
(0.34)
0.26 (0.33)
0.33 (0.26)
D-NITE
3.38 1.18 1.35 0.84
0.26 3.05 1.01 1.28 0.85
0.20 0.03 0.83 0.47 0.54 0.25
1.18 0.24 0.33 0 76

anaerobic zone are significantly lower in the modified OWASA configuration because the only flow to the anaerobic zone is the RAS, which has already been nitrified. The nitrate in the RAS is rapidly denitrified when it reaches the anaerobic zone. The first cell of the anaerobic zone in the modified OWASA configuration is essentially anoxic for denitrification of the RAS. TKN was only measured in the plant effluent and was consistently less than 1.0 m a .
lNFL I PCE 1 ANA-INF 1 ANA-EFF I ANX-INF 1 ANX-EFF 1 OXlC 1 FCI 1 FCE I D-NITE
Figure 54. Profile of average nitrate ( m a as NO3-N) concentrations throughout the treatment process for each BNR configuration during Phase 6.

Figure 55. Profile of average nitrate (lbs as NO3-N) mass throughout the treatment process for each BNR configuration during Phase 6.
Figure 56. Profile of average ammonia (mgL as NH3-N) concentrations throughout the treatment process for each BNR configuration during Phase 6.

Figure 57. Profile of average ammonia (lbs as NH3-N) mass throughout the treatment process for each BNR configuration during Phase 6.
Figures 58,59, and 60 illustrate the average nitrate profiles of the modified OWASA, CNC, and UCTNIP processes, respectively. Figures 6 1,62, and 63 illustrate the average ammonia profiles of the modified OWASA, CNC, and UCTNIP, respectively. Error bars on each point through the treatment process represent the standard deviation. The standard deviation for each point in each process for nitrate and ammonia is presented in Tables 15 and 16 respectively. In each process, the most deviation occurred in the aeration basin through the plant effluent. This deviation was likely due to variations in ammonia loading and levels of nitrification and denitrification. The most deviation for ammonia concentrations in the modified OWASA configuration occurred in the plant influent and anoxic zones. The most deviation for ammonia concentrations in the CNC configuration occurred in the plant influent and anoxic effluent. The most deviation for ammonia concentrations in the UCTNIP configuration occurred in the plant influent and anaerobic zone. The variation in the anaerobic zone for the UCTNIP configuration is because the primary clarifier effluent flows directly to the anaerobic zone, whereas in the modified OWASA and CNC processes, the primary clarifier effluent flows directly into the anoxic zone. The minimum, maximum, median, and average nitrate and ammonia concentrations for each point in the treatment process for each BNR configuration are shown in Tables 17 and 1 8, respectively.

INFL PCE ANA-INF ANA-EFF ANX-INF ANX-EFF OXlC FCI FCE D-NITE
Figure 58. Average nitrate profile for the modified OWASA process during Phase 6. Error bars for each point in the treatment process represent one standard deviation.
O INFL I PCE I ANA-INF I ANA-EFF 1 ANX-INF / ANX-EFF I OXlC 1 FCI I FCE 1 D-NITE
Figure 59. Average nitrate profile for the CNC process during Phase 6. Error bars for each point in the treatment process represent one standard deviation.

INFL 1 PCE I ANA-INF / ANA-EFF I ANX-INF 1 ANX-EFF / OXlC I FCI I FCE I D-NITE
Figure 60. Average nitrate profile for the UCTNIP process during Phase 6. Error bars for each point in the treatment process represent one standard deviation.
Table 15. Mean (standard deviation) for each nitrate point in the treatment process for each BNR configuration during Phase 6.
PCE (mdU
0.63 (0.17)
0.53 (0.15)
0.79 (0.21 )
- -
BNR Process Configuration
Modified OWASA
CNC
UCTNIP
INFL (rnalL)
0.74 (0.10)
0.60 (0.08)
0.80 (0.07)
FCE (rnalL)
5.66 (1 .19)
1.66 (6.35)
7.53 (1.45)
D-NITE (rnalL)
5.98 (1.18)
6.67 (1.33
6.18 (1.60)
ANX-EFF (mcllL1
0.61 (0.18)
0.97 (0.58)
1.05 (0.34)
ANX-INF IrnalL)
0.86 10.49)
1.28 (0.681
2.61 (1.02)
ANA-INF (rnalL)
0.81 (0.43)
0.21 (0.04)
0.70 (0.21)
ANA-EFF (rnalL)
0.59 (0.14)
0.79 (0.991
0.84 (0.13)
OXlC (malL1
6.85 (1.95)
6.27 (1.67)
6.41 (1.82)
FCI IrnalL)
6.00 11.08)
5.45 (1.43)
6.17 (1.63)

Figure 6 1. Average ammonia profile for the modified OWASA process during Phase 6. Error bars for each point in the treatment process represent one standard deviation.
Figure 62. Average ammonia profile for the CNC process during Phase 6. Error bars for each point in the treatment process represent one standard deviation.
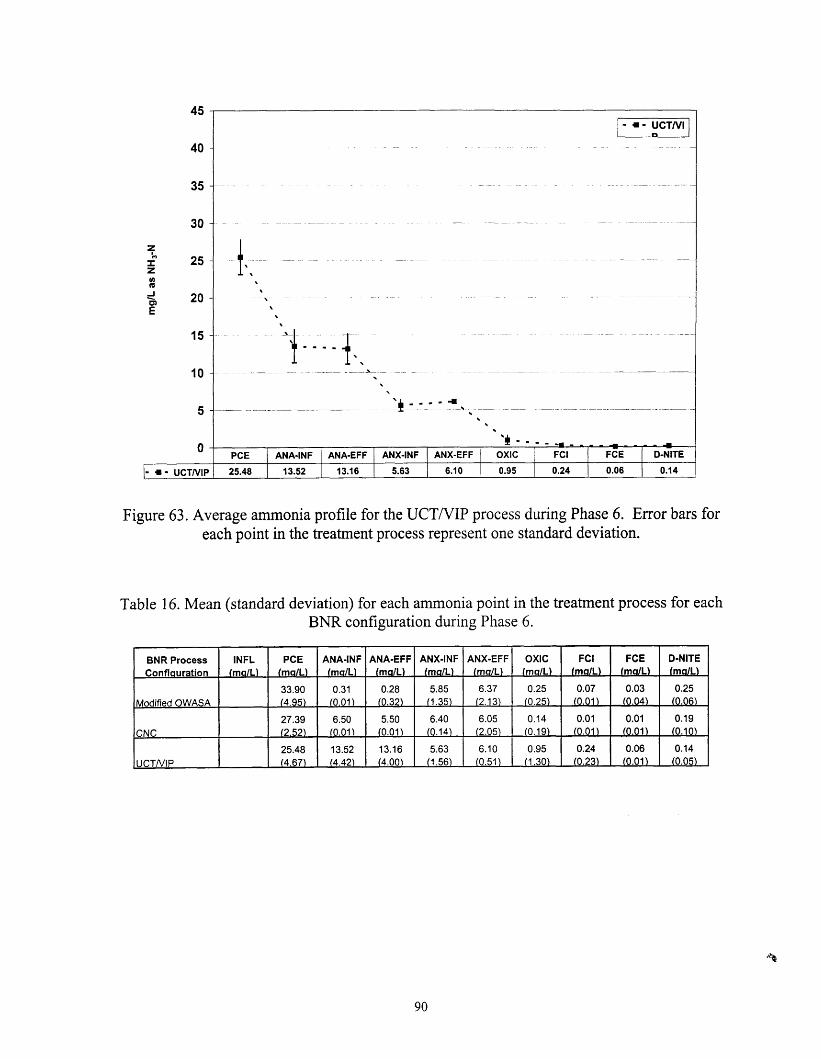
PCE ANA-INF ANA-
Figure 63. Average ammonia profile for the UCTNIP process during Phase 6. Error bars for each point in the treatment process represent one standard deviation.
Table 16. Mean (standard deviation) for each ammonia point in the treatment process for each BNR configuration during Phase 6.
- --
BNR Process , Confiauration
Modified OWASA
CNC
UCTNIP
ANA-INF (rnalLI
0.31 (0.01)
6.50 I 10.011
I 13.52 1 (4.42)
D-NITE
0.14
ANA-EFF (rnalL)
0.28 10.32)
5.50 (0.01)
13.16 (4.00)
INFL (malLI
ANX-INF IrnaIL)
5.85 (1.35)
6.40 (0.14)
5.63 11 S6)
PCE (malL1
33.90 14.95)
27.39 12.52)
25.48 (4.67)
ANX-EFF IrnalL)
6.37 (2.13)
6.05 12.05)
6.10 10.51)

Table 17. The minimum, maximum, median, and average nitrate concentrations for each point in the treatment process for each BNR configuration during Phase 6.
1 Standard Deviation ( 0.07 ( 0.21 1 0.21 1 0.13 1 1.02 1 0.34 1 1.82 1 1.63 1 1.45 1 1.60 1
Minimum Maximum Median Average
Standard Deviation
Table 18. The minimum, maximum, median, and average ammonia concentrations for each point in the treatment process for each BNR configuration during Phase 6.
0.50 0.70 0.60 0.60 0.08
BNR Process Configuration
0.40 0.80 0.50 0.53 0.15
Maximum Median Average
Standard Deviation
PCE (mg/L)
0.30 0.40 0.30 0.32 0.04
31.30 24.20 25.48 4.67
ANA-INF (mglL)
0.30 3.00 0.40 0.79 0.99
17.10 14.90 13.52 4.42
ANA-EFF (mg1L)
0.40 2.70 1.35 1.28 0.68
18.30 13.50 13.16 4.00
ANX-INF (mglL)
0.30 2.20 0.85 0.97 0.58
6.80 6.15 5.63 1.56
ANX-EFF (mg/L)
3.80 9.60 5.85 6.27 1.67
6.60 6.30 6.10 0.51
OXlC (mglL)
3.60 7.70 5.50 5.45 1.43
2.80 0.50 0.95 1.30
FCI (mg/L)
4.10 8.20 6.50 6.35 1.66
0.40 0.24 0.24 0.23
1.80 9.20 6.80 6.67 1.33
FCE (mg/L)
D-NITE (mgIL)
0.06 0.06 0.06 0.00
0.22 0.14 0.14 0.05

Alkalinity
Alkalinity profiles for each BNR process across the anoxic and aerobic zones are shown in Figure 64. The alkalinity entering the anoxic zone is typically 110-130 mg/L (as CaC03). In the aeiobic zone, nitrification consumes 7.1 mg/L (as CaC03) of alkalinity per mg/L of ammonia nitrified, and denitrification produces 3.6 mg/L (as CaC03) of alkalinity per m g L of nitrate reduced (Brown and Caldwell 1997). Denitrification occurs rapidly in the anoxic zone.
Figure 64. Alkalinity concentrations across the anoxic and aerobic zones for each BNR process configuration during Phase 6.
Comparison of Performance
The modified OWASA, CNC, and UCTNIP BNR processes all performed efficiently. Each process evaluated was capable of removing phosphorus and nitrogen to meet NPDES permit limits.
Comparison of Operation
The UCTNIP process appeared to have the least operational upsets and the quickest turn around time when an operational upset did occur. However, not as much time was spent optimizing the

modified OWASA and CNC processes. With further optimization, their reliability might prove equivalent to the UCTNIP configuration.
Comparison of Cost
Costs were based on the power and chemical costs necessary for BNR. The cost per million gallons treated did not vary significantly between the processes, as shown in Table 19 and Figure 65. The average amount of acetic acid needed for each process varied and was the main factor in cost differences between the processes. Since the acetic acid additions were not optimized, as evidenced by comparison of actual feed to the amount theoretically needed, the relative costs could change following better control of acetic acid feed. Thus at this point it would be premature to conclude that the modified OWASA process requires more acetic acid than the others studied. The study did not compare optimum acetic acid doses among the processes because the plant operators were understandably reluctant to alter the acetic acid feed rates when the process was performing well and possibly jeopardize compliance. As illustrated in Figures 45 and 46, there was no strong correlation drawn between either phosphorous release or phosphorous uptake and acetic acid feed rates other than for the UCTNIP process phosphorous uptake.
As illustrated in Figure 65, the major cost component to running any of the BNR processes investigated in this study was the acetic acid feed. The cost of acetic acid was approximately 90 percent of the total cost per million gallons treated for all the BNR processes. These data indicate that optimization of the acetic acid feed for BNR processes is a research area in need of further investigation. The potential cost savings of optimization of acetic acid feed is significant.
Table 19. Comparison of cost per million gallons treated for each BNR process.
Process
UCTNI P
CNC
Modified OWASA
Blowers (kwh) 980
$27.44
980 $27.44
980
Train 1 (kwh) 767
$21.48
690
$1 9.32
61 3
Train 2 (kwh) 767
$21.48
690 $1 9.32
613
Acetic Acid (gal)
1300
$624.00
1400
$672.00
1600
Total (per MG)
$694.39
$738.08

I ta Acetic Acid 1
UCTNIP CNC Modified OWASA
Figure 65. Cost per million gallons for blower operation, treatment and acetic acid feed for the UCTNIP, CNC, and modified OWASA processes.
Costs obtained for chemicals and power usage for BNR at McDowell Creek WWTP were compared to those reported by Reardon (1994) in Table 20. Chemical cost at McDowell is $84 more per million gallons treated than reported by Reardon in 1994. The chemical cost at McDowell Creek WWTP was based on the acetic acid fed to the anaerobic zone, and was probably higher due to the elevated amount of acetic acid necessary at McDowell Creek WWTP compared to facilities that can utilize naturally occurring VFAs. Alum was not included in the chemical cost for McDowell Creek WWTP. Chemical costs reported by Reardon included supplemental alkalinity addition, and were based on average costs from a variety of WWTPs. Chemical cost for McDowell Creek WWTP did not include costs for supplemental alkalinity addition. Reardon provided no information on types of chemicals included in the cost analysis so a detailed comparison was not possible. However, given these uncertainties, the costs are not significantly different.
Power usage at McDowell Creek WWTP was comparable to the power usage reported by Reardon (1994) per million gallons treated. Power usage at McDowell was determined from blowers, mixers and pumps utilized in the BNR process. The cost per kwh reported by Reardon was $0.08, whereas the cost per kwh at McDowell Creek WWTP was $0.028, so overall power cost at McDowell was $123 less per million gallons treated than that reported by Reardon. However when cost per kwh was compared on an equivalent $/kwh basis, then the power cost at McDowell Creek WWTP was only $7 more per million gallons treated. Thus it appears that

the costs incurred at McDowell Creek WWTP are well in line with those from other BNR facilities and as the full regime of power controls and flow pacing becomes integrated, these costs should be trimmed even further.
Table 20. Comparison of BNR costs at McDowell Creek WWTP to BNR costs reported by Reardon (1 994).
I I Reported Unit Operating Costs ($lMG) I
Cost of Alum Addition
Cost Component Chemical Cost Power Cost @ $0.08
The cost of supplemental alum addition or use of tertiary denitrification filters was not included in the cost comparison. Alum and the acetic acid used for fkrther denitrification had an impact on the cost of each process. However, the use of these supplemental chemicals was initiated by process upsets caused by outside influences, such as increased waste to the primary clarifiers, increased belt press filtrate return, and digester supernatant return.
Some facilities constantly feed a low dosage of alum to polish the effluent. Consistent alum addition ensures efficient phosphorus removal and compliance with NPDES permit limits. The cost for alum addition would be the same for all BNR process configurations.
McDowell $624 $201
SUMMARY OF PHASE 6
Reardon $540 $1 94
Phase 6 was incorporated into the last 6 months of the study (February - July 2000). Each BNR process was re-evaluated to draw conclusions about the performance and cost of each configuration. All of the upgrades at the plant were finished in January 2000. However, BNR configurations were still under analysis and frequently changed.
The most significant parameters that affected results during Phase 6 included (1) a gradual temperature increase (time of year); (2) a SRT decrease; (3) a MLSS decrease, and (4) a waste rate increase. It was planned to study each BNR configuration under equal operating conditions during Phase 6. However, Black & Veatch process engineers made several visits to the facility during this time to assist in optimizing the BNR process. They suggested increasing the wasting rate because BNR systems operate more efficiently with a younger sludge. The majority of operational upsets that occurred during Phase 6 were related to the amount of WAS sent to the primary clarifiers and to occasional overloads of belt press filtrate added to the system.
Phosphorus Release and Uptake
For all three BNR process configurations, phosphorus release and uptake appeared to depend more on the primary clarifier effluent phosphorus concentration than on the amount of VFAs fed

to the anaerobic zone. Only the UCTNIP process showed any statistically significant relationship between VFA feed and phosphorus uptake in the aerobic zone increased. When the average pounds of phosphorus throughout the treatment system were compared for each BNR configuration, they were very similar. The pounds of phosphorus release and uptake were also similar. The UCTNIP released slightly more phosphorus than the other two processes, but it is a mainstream process, and more flow is routed through the anaerobic zone of this BNR configuration. In all configurations, the largest amount of performance variability occurred in the anaerobic and anoxic zones. This seemed to occur because the mass of phosphorus was based on averages for the entire process trial, and the anaerobic and anoxic zones had the most fluctuation.
Cost Comparison
Cost for each BNR process was compared based on power consumption (aeration, mixers, and pumps) and acetic acid addition. Other factors, such as operator time and laboratory costs, were eliminated because they remained the same for each process. Alum addition varied, but it was a function of operating conditions and not the BNR process configuration.
The UCTNIP used the least amount of acetic acid of the three BNR processes. It is the only mainstream process, and it can take advantage of influent wastewater characteristics. The CNC process used slightly more acetic acid than the UCTNIP process. The only flow to the anaerobic zone in the CNC process configuration is the anoxic recycle. All of the VFAs needed for phosphorus removal must be added to the anaerobic zone. The modified OWASA used the most acetic acid of the three processes. It was necessary to feed excess acetic acid to denitrify any nitrate return in the RAS. Although there was variation in the acetic acid feed rate for each process, the cost differences were relatively minor. Over a year, based on an average flow of 4.5 MGD, the difference between each process is approximately $100,000.
In order to lower costs, the acetic acid feed for each process must be optimized. The amount of acetic acid necessary is based on the amount of phosphorus to be treated. Due to the variation in sidestream return at the plant, the amount of phosphorus to remove from the system varies as well. Phosphorus concentrations in the primary clarifier effluent should be analyzed frequently, and the acetic acid feed rate should be adjusted as necessary.
OTHER NC UTILITIES
It was difficult to make a comparison of cost and performance between all five facilities because the amount of data received from each plant varied. The following are the most common differences between facilities (adapted from Reardon, 1994):
Local conditions
Local costs
Wastewater characteristics
Temperature

Method of treatment
Level of treatment
Method of tracking and accounting for costs
Construction
Four other wastewater utilities in North Carolina were visited to evaluate their method of nutrient removal and performance. The supervisor of each facility was asked to complete a survey form, shown in Appendix C. However, the amount of data received from each plant varied significantly, and it was ultimately impossible to reliably compare costs and performance between plants, therefore these data are not presented. A comparison of the treatment processes and chemicals utilized by each facility is presented in Table 2 1. This matrix illustrates the broad range of treatment methods utilized.
Neuse River WWTP
The Neuse River WWTP is located in Raleigh, NC and has the capacity to treat 60 MGD. A combination of biological and chemical nutrient removal has been implemented. A modified four-stage Bardenpho BNR process is supplemented with methanol and tertiary denitrification filters for denitrification. Ferrous sulfate is added at a constant rate to the collection system near the head of the plant for chemical precipitation of phosphorus. Alum is used as back-up if hrther chemical polishing is necessary in the final clarifiers. The NPDES permit limits for total nitrogen and total phosphorus are 5.6 m g L and 2.0 mgIL respectively.
Operational Issues and Response
Operational issues that occur at the Neuse River WWTP include an increase in MLSS due to poor settleability, variations in DO in the aeration basins, and elevated BOD in the plant effluent caused by high doses of methanol to the denitrification filters. To minimize operational problems, secondary clarifier blankets are closely monitored in order to maintain the MLSS concentration, DO profiles are assessed frequently, and the amount of methanol fed to the denitrification filters is calculated based on nitrate concentration to ensure proper dosing.
The Neuse River WWTP faces more stringent total nitrogen limits than total phosphorus limits. Unlike McDowell Creek WWTP, the Neuse River WWTP aims to optimize nitrate removal and focuses on denitrification, which occurs in the anoxic zone., McDowell Creek WWTP focuses mainly on phosphorus control throughout the treatment process, while the Neuse River WWTP focuses mainly on nitrate throughout the treatment process.

Table 2 1. Process comparison matrix for NC utilities.
Charlotte McDowell
Treatment Process Permitted Capacity (MGD) Flow Equalization Flow Pacing
I Screening (1st) I 1 " I X I 114" 1 318" 1 318" I
Raleigh Neuse
Greensboro T.Z.
Gravity Flow PRELIMINARY TREATMENT
Creek WWTP
6.0
X
Durham
X
Influent Pumping Screening (2nd)
OWASA
River WWTP
60.0
Grit Removal Intermediate Pumping
X
X 318"
Sludge Fermentation PRIMARY TREATMENT
Primary Clarifiers Trickling Filters
SECONDARY TREATMENT Anaerobic Zone
chemical supplements Anoxic Zone
chemical supplements Aerobic Zone
fine bubble course bubble jet aeration
Recycle Pumping Intermediate Pumping Final Clarifiers
Osbourne WWTP
22.0 X
*available X
X
chemical supplements TERTIARY TREATMENT
Shallow Bed Filters Deep Bed Filters Chlorine Disinfection Dechlorination UV Disinfection Reaeration Effluent Pumping
DIGESTERS Anaerobic
X
X
X
acetic acid X
X X
ARP, ORP, RAS
X
Aerobic Sludge Thickening DEWATERING
*available = present, but not currently in use
N. Durham WRF 20.0
X X
X
alum
X
X X
X
Centrifuge Belt Press
Incinerator Drying Beds FiltrateKentrate return
Returned to
Mason Farm WWTP
9.0
X
X
X
X methanol
X X
X
ORP, RAS
X
X X
X
X
X X
reuse
X
X X
influent
X
X
*available
*available
X X
RAS
X sodium
X
X
X X
aluminate
X
X X
X
X
X X
X
X
X
X X
X
ORP, RAS
X
X
X
X X
X fermentation
product
X
X
RAS X X
alum
X
X X
X
X
X X X
X aerobic
X X
X
X
X X
primary X
influent

Mason Farm WWTP
The Mason Farm WWTP is located in Chapel Hill, NC, and has the capacity to treat 12 MGD. The facility is currently being expanded to treat 20 MGD. The OWASA BNR process is used for biological phosphorus and ammonia removal. The primary sludge is fermented to form VFAs and fed into the anaerobic zone. Acetic acid is used as a back- up source of VFAs, and alum is used as back-up if further chemical polishing is necessary in the final clarifiers. Regular process control testing is done to profile the phosphorus through the treatment process. Phosphorus release and uptake is a good indication of sufficient or insufficient VFAs, and elevated levels of phosphorus in the final aerobic zone triggers alum addition. NPDES permit limits for ammonia and phosphorus are 2.0 mg/L and 0.6 mg/L, respectively. Acetic acid and alum back-up is used periodically. Most supplemental feeds have been related to construction occurring on the plant site.
Operational Issues and Response
Operational issues that occur at the Mason Farm WWTP include an increase in solids due to Dissolved Air Floatation Thickener (DAFT) failures, and fermentation of the raw wastewater not providing sufficient VFAs to the anaerobic zone.
T.Z. Osbourne WWTP
The T.Z. Osboume WWTP is located in Greensboro, NC and has the capacity to treat 22 MGD. A combination of biological nitrification and chemical phosphorus removal is used. An extended aeration process is supplemented with sodium aluminate for precipitation of phosphorus. The NPDES permit limits for ammonia and phosphorus are 3.0 mg/L and 2.0 mgL, respectively.
Operational Issues and Response
Operational issues that occur at the T.Z. Osboume WWTP include clogs in the sodium aluminate feed lines, incinerator failures or inspection shut-downs, and no redundancy in the treatment process to ensure complete nitrification. To minimize the operational problems, sodium aluminate lines are flushed regularly, back-up belt presses and centrifuges are used to handle solids, (which are landfilled), and detention time in the aeration basins can be increased if complete nitrification is not occumng.
North Durham WWTP
The North Durham WWTP is located in Durham, NC, and has the capacity to treat 20 MGD. The plant was expanded and upgraded in 1996 to implement a five-stage Bardenpho BNR process for biological phosphorus and ammonia removal. A variety of flow and recycle schemes are available. Alum is used as back-up if further chemical polishing is necessary in the final clarifiers. The NPDES permit limits for ammonia and phosphorus are 1.0 mg/L and 0.5 mg/L, respectively.

Operational Issues and Response
Operational problems that occur at the North Durham WWTP include difficulty in pumping thick sludge to the digester, and the lack of sufficient data to detect problems early. If reduced performance is not noticed immediately, alum must be fed constantly to meet permit limits. Thick sludge is routed to the primary clarifiers and co-thickened. However, it is necessary to monitor the primary clarifiers closely for increase in solids and phosphorus concentrations.

REFERENCES
American Public Health Association (APHA), American Water Works Association (AWWA), and Water Environment Federation (WEF). 1998. Standard Methods for the Examination of Water and Wastewater. Baltimore, MD: United Book Press, Inc.
Argaman, Y., J.L. Bamard, G.T. Daigger, W.W. Eckenfelder, Jr., S.W. Hermanowicz, D. Jenkins, S.R. Polson, T.W. Sigmund, H.D. Stensel. 199 1. Phosphorus and Nitrogen Removal from Municipal Wastewater, Principles and Practice, Second Edition. New York: The Soap and Detergent Association.
Bamard, J.L. 1 975. Biological Nutrient Removal Without the Addition of Chemicals. Water Research 9:485-490.
Bamard, J.L. 1976. A Review of Biological Phosphorus Removal in the Activated Sludge Process. Water SA 2: 136- 144.
Bamard, J.L., G.M. Stevens, and P.J. Leslie. 1985. Design Strategies for Nutrient Removal Plant. Vat. Sci. Tech. 17:233-242.
Black & Veatch. 2000. McDowell Creek Wastewater Treatment Plant Environmental Assessment for Expansion and Facilities Improvements DRAFT. Prepared for North Carolina Department of Environment and Natural Resources, Division of Water Quality.
Brown and Caldwell. 1997. Keys to Biological Nutrient Removal. Portland, Oregon: Book by Brown and Caldwell for a Process Optimization Workshop.
CH2M Hill. 1989. Final Report POTW Nutrient Removal Retrofit Study. Prepared for the Commonwealth of Virginia State Water Control Board.
Cooper, P., J.E. Upton, M. Smith, J. Churchley. 1995. Biological Nutrient Removal: Design Snags, Operational Problems and Costs. Journal of Water and Environmental Management 9:7- 18.
Daigger, G.T., G.D. Waltrip, E.D. Romm, and L.M. Morales. 1988. Enhanced Secondary Treatment Incorporating Biological Nutrient Removal. J. Water Pollut. Control Fed., 60: 1833-1842.
Daigger, G.T., L.M. Morales, and J.R. Borberg. 1990. New plant provides a unique opportunity. Water Environment & Technology 2: 8-9.
Droste, R.L. 1997. Theory and Practice of Water and Wastewater Treatment. New York: John Wiley & Sons, Inc.

Fuhs, G. W. and Chen, M. 1975. Microbiological basis of phosphate removal in the activated sludge process for the treatment of wastewater. Microbial Ecology 2 1 19- 138.
Grady, L.C.P, Daigger, G.T., and Lim, H.C. 1999. Biological Wastewater TreatmentJSecond Edition, Revised and Expanded). New York: Marcel Decker, Inc.
HACH Water Analysis Handbook, 3rd Edition. 1997. Loveland, CO: HACH Company.
Hawkins, J., C. Wallis-Lage, and J. Alexander. 1996. Evaluation and Implementation of a New BNR Process. Paper presented at the Annual Meeting of the North Carolina Section AWWAfWEA, Pinehurst, North Carolina, November 1996.
Hecky, R.E. and P. Kilham. 1988. Nutrient limitation of phytoplankton in freshwater and marine environments: A review of evidence on the effects of enrichment. Limnology and Oceanography 33 :796-822.
Henze, M. 1996. Biological Phosphorus Removal from Wastewater: Processes and Technology. Water Quality International JulyIAugust: 3 2-3 7
Kalb, K. R., R. Williamson, and W.M. Frazier. 1990. Nutrified Sludge - An Innovative Process for Removing Nutrients from Wastewater. Paper presented at the Annual Meeting of the North Carolina Section AWWAIWPCA, High Point, November 13- 15, 1990.
Kalb, K.R. 1993. BNR with Trickling Filters. Paper presented at the University of Florida, Biological Nutrient Removal: The Florida Experience I11 and Beyond, Orlando, Florida, March 1993.
Mecklenburg County Department of Environmental Protection (MCDEP). 2000. State of the Environment Report. Charlotte, NC.
Metcalf & Eddy. 199 1. Wastewater Engineering, Treatment, Disposal, Reuse (Third Edition). New York: McGraw-Hill, Inc.
Mines, Jr., R.O., and W.C. Thomas IV. 1996. Biological Nutrient Removal Using the VIP Process. J. Environ. Sci. Health A3 1 :2557-2575.
Momba, M.N.B. and T.E. Cloete. 1996. The Relationship of Biomass to Phosphate Uptake by Acinetobacter Junii in Activated Sludge Mixed Liquor. Wat. Res. 30(2): 364-370.
Randall, C. W., J.L. Bamard, H.D. Stensel. 1992. Design and Retrofit of Wastewater Treatment Plants for Biological Nutrient Removal. Lancaster, PA: Technomic Publishing Company, Inc.
Randall, C.W. 1984. The Development of Energy Efficient Activated Sludge Systems Through Utilization of Nutrient Removal Processes. Paper presented at the Sixteenth Mid-Atlantic Industrial Waste Conference, Pennsylvania State University. June 24-26, 1984

Reardon, R. 1994. Cost Implication of Design for Nutrient Removal. Paper presented at the 67" Annual Conference & Exposition, Water Environment Federation, Chicago, Illinois, October 18-22, 1997
~einhart , D. 1985. Biological Phosphorus Removal. Paper presented at the 54" Annual Conference of the Georgia Water and Pollution Control Association, Savannah, Georgia, August 11-14, 1985.
Sears, K., J.A. Oleszkiewicz, T. Takach, and P. Lagasse. 1998. Pushing the Limits of Nitrification - Low Temperature, pH, and Hydraulic Retention Time. Paper presented at WEFTECB '98 7 1'' Annual Conference and Exposition.
Thomas, P.R., D. Allen and D.L. McGregor. 1996. Evaluation of Combined Chemical and Biological Nutrient Removal. Wat. Sci. Tech. 34( 1 -2):2 85-292.
United States Environmental Protection Agency 1987a. Design Manual: Nitrogen Removal. United States Environmental Protection Agency, Cincinnati.
United States Environmental Protection Agency 1987b. Design Manual: Phosphorus Removal. United States Environmental Protection Agency, Cincinnati.
Wang, J.C., and J.K. Park. 1998. Effect of AnaerobidAerobic Contact Time on the Change of Internal Storage Energy in Two Different Phosphorus-Accumulating Organisms. Paper presented at WEFTECO '98 7 1'' Annual Conference and Exposition, October 3-7, 1998.
Water Environment Federation. 1998. Biological and Chemical Systems for Nutrient Removal : a special publication / prepared by Task Force on biological and chemical systems for nutrient removal : under the direction of the Municipal Subcommittee of the Technical Practice Committee. Alexandria, VA.
Water Environment Federation. 1996. Operation of Municipal Wastewater Treatment Plants. FiJih Edition. Manual of Practice, Vol. 3. Alexandria, VA.
Water Research Centre. 1995. Biological phosphorus removal in the activated-sludge process. WRC Report UC-1905.
Youker, B.A. 1998. Design of single-sludge systems: the modified Ludzack-Ettinger and Bardenpho processes. Master of Engineering Report, Clemson University, Clemson, South Carolina.


LIST OF PATENTS AND PUBLICATIONS
1. Bonislawsky, M. and KG. Linden "Costs and performance for 3 BNR schemes at a full scale wastewater treatment plant" Proceedings, North Carolina A WWA/WEA Annual Meeting, Asheville, NC, November 13- 15, 1999.
2. Lucky, J. and M. Bonislawsky "Side stream effects on three BNR schemes" Proceedings, North Carolina A WWA/WEA Annual Meeting, Charlotte, NC, November, 2000


AER
Alum
ANA-EFF
ANA-NF
ANX-EFF
ANX-INF
NOTM
A*IOTM
BNR
BPR
BOD
CNC
COD
DEM
DO
EFFL
EPA
FCE
gpd
HRT
INFL
MCDEP
GLOSSARY
Aerobic
Aluminum Sulfate
Anaerobic Effluent
Anaerobic Influent
Anoxic Effluent
Anoxic Influent
AnaerobicIOxic
Anaerobic/Anoxic/Oxic
Biological Nutrient Removal
Biological Phosphorus Removal
Biochemical Oxygen Demand
Charlotte North Carolina
Chemical Oxygen Demand
Department of Environmental Management
Dissolved Oxygen
Effluent
Environmental Protection Agency
Final Clarifier Effluent
Gallons per Day
Hydraulic Retention Time
Influent
Mecklenburg County Department of Environmental Protection
Million Gallons per Day
Milligrams per Liter

MLE
MLSS
MO
MUCT
NPDES
O & M
Ortho-P
OWASA
PA0
PHB
PCE
PPm
RAS
SRT
TKN
TN
TP
TSS
UCT
VFA
VIP
WAS
WWTP
Modified Ludzack-Ettinger
Mixed Liquor Suspended Solids
Modified OWASA
Modified University of Cape Town
National Pollutant Discharge Elimination System
Operations and Maintenance
Orthophosphate
Orange Water and Sewer Authority
Phosphorus Accumulating Organism
Poly- P-Hydroxybutyrate
Primary Clarifier Effluent
parts per million
Return Activated Sludge
Solids Retention Time
Total Kjeldahl Nitrogen
Total Nitrogen
Total Phosphorus
Total Suspended Solids
University of Cape Town
Volatile Fatty Acid
Virginia Initiative Plant
Waste Activated Sludge
Wastewater Treatment Plant

APPENDICES
APPENDIX A: RAW DATA

NITRATE (ma/L as NOYN)

I NITRATE (mg/L as NO3-N) I

I NITRATE (malL as NO,-N) I


NITRATE (mslL as NO& I

APPENDIX B: ALUM ADDITION -
Day 54 - 55 - 56 - 57 - 58 59 60
6 1 62
63 64 65
66 - 67 68 69 70 - 71 72
73 - 74 - 75 - 76 - 77 - 78 - 79 - 80 - 8 1 - 82 - 83 - 84 - 116 y7'- 118
Flow
0 4.117
3.933 3.71 8
1st Train 1st Train 2nd Train 2nd Train Total Aeration Aeration Aeration Aeration Total p
PO4-P PO4-P PO4-P PO4-P PO4-P Limit
(rnglL) (Ibs) (mglL) (Ibs) (Ibs) (Ibs) 0.05 1.72 1.72 34.34
32.80 0.40 12.40 12.40 31.01

1st Train 1st Train 2nd Train 2nd Train Total Aeration Aeration Aeration Aeration Total p
Po4-P PO4-P PO4-P PO4-P Po4+ Limit
(mglL) (Ibs) (mg1L) (Ibs) (Ibs) (Ibs) 34.64
Alum Needed
Alum Alum to Meet Added Added Limits (gal) (Ibs) (Ibs)
0 0.0 190 13.4 254 17.9 317 22.4

Alum 2nd Train Total Needed Aeration Total P Alum Alum to Meet
P04-P P04-P Limit Added Added Limits (Ibs) (Ibs) (Ibs) (gal) (Ibs) (Ibs)
33.14 381 26.9 9.14 15.64 35.14 381 26.9 6.6
35.56 381 26.9
2nd Trair Aeration
PO4-P (mglL) Date
711 0199 711 1199 7/12/99 711 3/99 711 4199 711 5199 711 6/99 711 7199 711 8/99 711 9/99 7120199 7121 199 7/22/99 7/23/99 7/24/99 7125199 7126199 7/27/99 7/28/99 7/29/99 7130199 713 1 199 8/1/99 8/2/99 8/3/99 8/4/99 8/5/99 8/6/99 8/7/99 818199 819199
811 0199 811 1/99 10/21199 10122/99 ;
10123l99 I0124199 1 10125/99 / 1 0126199 I0127199 10/28/99 I0129199 10/30/99

Date Day (mgd) 11/8/99 306 4.532
11/17/99 315 4.630 11/18/99 316 4.809 11/19/99 317 4.460 11/20/99 318 4.465 11/21/99 319 4.970
1st Train 1st Train Aeration Aeration
Po4-P Po4-P
(mglL) (Ibs) 0.49 9.26 3.89 75.10 3.86 77.41 4.69 87.23 3.36 62.56 3.40 70.46
2nd Train 2nd Train Aeration Aeration Total
Po4-P Po4-P Po4-P
(mglL) (Ibs) (Ibs) 0.33 6.24 15.50 2.60 50.20 125.30 2.18 43.72 121.12 3.42 63.61 150.83 2.12 39.47 102.03 4.27 88.50 158.96
Total P
Limit (I bs)
37.80 - 38.61
Needed
52.6


Date Day 2/26/00 416 2/27/00 417
I Flow
0 4.930 4.263 4.556 4.591 4.223 4.082 4.146 4.266 3.700 4.384 4.450 4.399 4.01 6 4.432 5.707 4.106 4.658 4.869 7.019 5.457 5.038 4.437 4.135 4.739 4.61 7 4.630 4.397 4.439 4.575 3.960 4.41 6 4.562 4.707 4.1 22 4.585 4.351 4.140 4.930 4.638 4.421 3.849 4.273 4.200 4.200 6.200 5.441 4.369 4.489 4.507 4.491 4.242
2nd Train 2nd Train Aeration Aeration Total
Po4-P Po4-P Po4-P
(mg/L) (Ibs) (Ibs) 0.31 6.37 17.47 0.10 1.78 4.62
Total P
Limit ~ (lbs) 41.12 35.55 38.00 38.29 35.22
Alum Needed
Alum Alum to Meet Added Added Limits (gal) (Ibs) (Ibs)
0 0.0 7.3 0 0.0 1.9 0 0.0 3.8 0 0.0 4.1 0 0.0 2.7

Total
35.75
' Alum Needed to Meet Limits (I bs) 36.2
Total PO4-P (I bs)

Alum Needed to Meet Limits (I bs) 16.5 30.5 22.4 33.5 29.7 33.6 23.6 26.8 23.9 23.0
1st Train 1st Train 2nd Train 2nd Train Aeration Aeration Aeration Aeration Total
Flow po4-P Po4-P Po4-P Po4-P Po4-P Day (mgd) (mglL) (Ibs) (mglL) (Ibs) (Ibs) 518 4.126 1.59 27.36 0.70 12.04 39.40
Total P
Limit (I bs) 34.41

1st Train 1st Train 2nd Train 2nd Train Aeration Aeration Aeration Aeration Total
Po4-P 1 Po4-P 1 P 0 . P 1 Po4-P / Po4-. (mg /~ ) I (~bs) I (mg/L) 1 (Ibs) I (Ibs)
Total P
Limit (I bs) 32.69
Added kl Needed Alum to Meet
Added Limits (lbs) I 1 4.2 6.2


FORM 3 - Questionnaire
APPENDIX C: SURVEY FORMS
Utility - Completed by -
1. What type on nutrient removal does your facility use?
2. Process control - list sampline stations, parameters sampled, and frequency.
3. What types of operational issues has your facility encountered, and what actions were taken?
4. List any repairs or maintenance costs related to nutrient removal.
5. How manv operators does your facility employ, and how much time per day is dedicated to nutrient removal process control?

6. Power Usage
Blowers (aeration) - How much energy do the blowers use per day? Are they constant or
flow-paced?
scfm
amps
Recycle pumps (include head loss)
RAS
Anoxic Recycle Pumps
Oxic Recycle Pumps
Chemical Feed Pumps (include head loss)
Acetic Acid Pumps
Alum Pumps
Other -
Other -
Mixers
location -
number -
h p h -
location -
number -
hplkw -
location -
number -
hpkw -

FORM 1 - Daily Data Sheet
--
NOTES:

YkelLZ Day 8 9 10 I 1 12 13 14 Date 218100 219100 211 0100 211 1100 2/12/00 211 3100 211 4100 Time Operator Average Daily Flow (MGD) Average Daily Lab Cost
Alum Methanol Sodium Aluminate Sodium Hydroxide
Chemical Feed N and P removal
Acetic Acid
NOTES:
1