ontario labour relations board annual …...judith a. rundle jul 17/04 – jul 16/07 july 17, 1986...
TRANSCRIPT

ONTARIO LABOUR RELATIONS BOARD ANNUAL REPORT 2005-2006 June 2006 Chair – Kevin Whitaker

Table of Contents OLRB Annual Report 2005-2006 Chair’s Message 2005-2006 Accountability Statement ....................................................................... 1 Preface ...................................................................................................... 1 I Organizational Overview:
- Key Program Activities, Legislative Authority and Mandate 2 - Order in Council Appointments ............................................. 4 - Board Staff ............................................................................. 5 - Organizational Chart ............................................................... 6
II Executive Summary Operational Performance:
- Caseload Analysis .................................................................. 7 - Statistical Tables and Graphs ................................................. 15 - Case Management Efficiencies .............................................. 39
III Measuring Performance – Achieving Goals
- 2005-2006 OLRB Performance Measures ............................. 40 IV Financial Performance – Managing the Dollars
- 2005-2006 OLRB Budget Allocation and Expenditures ........ 41

Chair’s Message 2005-2006
For the last 62 years, the first priority of the Ontario Labour Relations Board has remained the
fair, practical, quick and effective resolution of labour and employment disputes. While the Board’s
jurisdiction and statutory responsibilities in 2006 now go far beyond its traditional role, our central
mission remains the same.
Last year, the Labour Relations Act was significantly amended. Effective June 13, 2005 certain
powers and responsibilities were provided to the Board:
-The Board may now certify a trade union where an employer commits unfair labour practices
during an organizing drive. Similarly, the Board may dismiss an application for certification
where a trade union commits unfair labour relations practices during the course of organizing;
-The Board may now certify a construction trade union as bargaining agent on the basis of
membership cards filed without the necessity of holding a vote in the workplace;
-The Board may reinstate an employee discharged during an organizing campaign on an
interim basis before a full hearing into the complaint occurs.
In the case of each of these changes to the Labour Relations Act, the Board has developed a
process tailored to ensure that these new powers can be exercised in a manner that is expeditious and
responsive to the needs of employees, trade unions and employers.
In these areas as well as others, the Board has continued to expand the use of the consultation
process and mediation/adjudication as alternatives to the traditional hearing process. In this way we
improve our ability to shorten the time between the filing of a complaint and the final resolution of a
dispute either by agreement or decision.
The Board remains a leader in procedural innovation and is regularly consulted for advice and
assistance by other administrative tribunals inside Ontario, in other provinces and in the federal sector.
The Board is committed to maintaining strong and direct links with our communities of users.
This year, we established an Interim Community Advisory Committee to assist in the establishment of a
permanent Advisory Committee.
Perhaps the Board’s greatest strength lies in the significant accumulation of expertise across our
entire organization. Whether it is administrative staff, adjudicators or mediators, we recruit and retain
highly skilled staff who come from the labour relations and employment community. I would like to
thank our staff for their tireless dedication to the highest standards of public service.
As always, we are grateful for the ongoing support and guidance that we get from you, the users
of our services. We look forward to another year of providing the best workplace and employment
problem solving. We welcome your comments and suggestions.
Kevin Whitaker
Chair:
Ontario Labour Relations Board
Colleges Relations Commission
Education Relations Commission

OLRB Annual Report 2005-2006 Accountability Statement The OLRB’s Annual Report for the fiscal year ending March 31, 2006 was prepared under my direction for submission to the Minister of Labour in accordance with the Agency Establishment and Accountability Directive – February 2000, as issued by Management Board of Cabinet . Preface The Public Accounts of Ontario are the annual financial statements that are prepared in compliance with the requirements of Section 13 of the Ministry of Treasury and Economics Act. The Public Accounts consist of the financial report of the Government of Ontario and the financial reports of each ministry. In accordance with the Ministry of Labour’s Delegation of Financial Authority Framework, financial authority is delegated to the agency. Each year the OLRB verifies that all its transactions are reflected accurately and completely in the Public Accounts through the execution of a Certificate of Assurance. The Results Based Plan of the Ministry of the Labour, which is to be released in the fall of each year, contains the Ministry’s mission and accountability statements, the consolidated financial/allocation statements of the Ministry and an annual comparison of actual performance results to desired results set out in the Ministry business plan. As an agency of the Ministry of Labour, the OLRB’s Annual Report is subject to the minimum reporting requirements established in the Agency Establishment and Accountability Directive, including: • financial statements that have been audited or subject to the appropriate level of external assurance; • analysis of operational performance; • analysis of financial performance; • names of appointees and term of appointments • performance measures, targets achieved/not achieved and action to be taken. This report covers the fiscal year April 1, 2005 to March 31, 2006.
OLRB Annual Report 2005 – 2006 OLRB - Core Business

I Organizational Overview | 2
_____________________________________________________________________________
I Organizational Overview
- Key Program Activities, Legislative Authority, Mandate - OICs and Staff
OLRB – Key Program Activities The Board is an independent tribunal mandated to handle a variety of different applications, under a number of different pieces of legislation, including: • Colleges Collective Bargaining Act, R.S.O. 1990, c. C.15 • Community Small Business Investment Funds Act, S.O 1992, c.18. • Crown Employees Collective Bargaining Act, 1993, S.O. 1993, c. 38 • Education Act, R.S.O. 1990, c. E.2 • Employment Standards Act, R.S.O. 1990, c.E.14 • Environmental Bill of Rights Act, 1993, S.O. 1993, c. 28 • Environmental Protection Act, R.S.O. 1990, c. E.19 which gives the Board jurisdiction under the following legislation: * Environmental Assessment Act, R.S.O. 1990, c. E.18 * Environmental Protection Act, R.S.O. 1990, c. E.19 * Ontario Water Resources Act, R.S.O. 1990, c. O.40 * Pesticides Act, R.S.O. 1990, c. P.11 * Fisheries Act, R.S.C. 1970, c. F-14 • Fire Protection and Prevention Act, 1997, S.O. 1997, c.4 • Hospital Labour Disputes Arbitration Act, R.S.O. 1990, c. H.14 • Labour Relations Act, 1995, S.O. 1995, c. 1, Sch. A • Occupational Health and Safety Act, R.S.O. 1990, c. O.7 • Public Sector Labour Relations Transition Act, 1997, S.O. 1997, c. 21 • Public Service Act, R.S.O. 1990, c. P.47 • Smoking in the Workplace Act, R.S.O. 1990, c. S.13 The Ontario Labour Relations Board (the “Board”) was established by section 2 of the Labour Relations Act, 1948 (the “Act”) and is continued by subsection 110(1) of the Labour Relations Act, 1995 S.O. 1995, C1, as amended. The Board is an adjudicative agency of the Government of Ontario and its staff is appointed under the Public Service Act. The Board is an independent, adjudicative tribunal issuing decisions based upon the evidence presented and submissions made to it by the parties, and upon its interpretation and determination of the relevant legislation and jurisprudence. It plays a fundamental role in the labour relations regime in Ontario and encourages harmonious relations between employers, employees and trade unions by dealing with matters before it as expeditiously and as fairly as reasonably possible. The Board's primary work is administering the Labour Relations Act, 1995, which regulates many aspects of collective bargaining in Ontario. The legislative policy underlying the Act is set out in section 2: 2. The following are the purposes of the Act:
OLRB Annual Report 2005 – 2006 OLRB - Core Business

I Organizational Overview | 3
1. To facilitate collective bargaining between employers and trade unions that are the freely designated representatives of the employees.
2. To recognize the importance of workplace parties adapting to change.
3. To promote flexibility, productivity and employee involvement in the workplace.
4. To encourage communication between employers and employees in the workplace.
5. To recognize the importance of economic growth as the foundation for mutually beneficial relations amongst employers, employees and trade unions.
6. To encourage co-operative participation of employers and trade unions in resolving workplace issues.
7. To promote the expeditious resolution of workplace disputes. With this policy as a basis, the Act confers on the Board the authority over many important aspects of labour relations, including the certification of unions to represent employees, unfair labour practices, successor bargaining rights, strikes and lock-outs, first contract directions, jurisdictional disputes and the arbitration of grievances in the construction industry. In order to carry out this mandate, the full Board is composed of a Chair, an Alternate Chair, Vice-Chairs, and Board Members. These individuals draw upon specialized expertise in labour relations in hearing and determining cases before them. The Board strives to keep its procedures informal, expeditious and fair, and to avoid being overly technical or legalistic. However, it is important to recognize that legal rights are in issue, the statutory framework is often complex, and, these days, it is common for parties to be represented by lawyers. Under section 114(1) of the Labour Relations Act, 1995, the Board has the exclusive jurisdiction to exercise the power conferred upon it and to determine all questions of fact or law that arise. Its decisions are not subject to appeal and a privative clause in the Act limits the scope of judicial review. The Board does have the power to reconsider any of its decisions, although it exercises this jurisdiction carefully in the interests of finality and fairness. The Board is also entitled to determine its own practices and procedures and to make rules. Those rules and the forms for commencing or responding to cases are available on the OLRB’s website www.gov.on.ca/lab/olrb/eng/homeeng.htm or, directly, from the Board at 505 University Avenue, 2nd Floor, Toronto, Ontario, M5G 2P1, in both paper form and computer disk.
OLRB Annual Report 2005 – 2006 OLRB - Core Business

I Organizational Overview | 4
Order in Council (OIC) Appointments: CHAIR
Kevin Whitaker Sep 20/04 – Sep 19/07 Sep 20/01-C; Mar 22/95-VC; PT- June 24/98-Dec 22/99
ALTERNATE CHAIR Mary Ellen Cummings Aug 13/05 – Aug 12/08 Jan 1/99 – Alt; Aug 13/97– VC VICE-CHAIRS (Full Time) – 15 Ian B. Anderson Mar 24/04 – Mar 23/07 March 24, 2004 Peter F. Chauvin Mar 24/04 – Mar 23/07 March 24, 2004 Harry Freedman Jul 08/04 – Jul 07/07 July 8, 1998 Patrick M. Kelly May 18/05 – May 17/08 May 17, 1999 David A. McKee Apr 29/05 – Apr 28/08 April 29, 1999 Mary Anne McKellar Jan 24/04 – Jan 23/07 January 24, 2001 Brian C. McLean Jul 08/04 – Jul 07/07 July 8, 1998 Corinne F. Murray Feb 03/06 – Feb 02/09 February 3, 2003 Caroline Rowan May 06/05 – May 05/08 May 6, 1999 Timothy W. Sargeant Feb 28/05 – Feb 27/08 February 28, 1996 Susan J. Serena May 28/06 – May 27/09 May 28/03 Marilyn Silverman Apr 29/05 – Apr 28/08 April 29, 1999 Jack J. Slaughter Feb 03/06 – Feb 02/09 February 3, 2003 Tanja Wacyk May 28/06 – May 27/09 May 28, 2003 Kelly A. Waddingham Jan 01/05 – Dec 31/07 PT April 7 – Dec 31, 2004
FT Jan 1/05 VICE-CHAIRS (Part Time) - 3Christopher J. Albertyn Sep 01/04 – Aug 31/07 Oct 7/94; PT to Mar 8/95;
PT – Sep 1/04 Bruce Binning Aug 25/04 – Aug. 24/07 PT August 24, 2004 Norman Jesin Aug 25/04 – Aug 24/07 PT August 25, 2004
BOARD MEMBERS PERIOD ORIGINAL APPT. EMPLOYERS – Full Time - 5
Richard J. O’Connor Nov 06/05 – Nov 05/008 November 6, 2002 Glenn A. Pickell Mar 25/04 – Mar 24/07 March 25, 1998 R.D. Paul LeMay Dec 15/05 – Dec 14/08 December 15, 2005 Judith A. Rundle Jul 17/04 – Jul 16/07 July 17, 1986 John A.Tomlinson Nov 06/05 – Nov 05/08 November 6, 2002 EMPLOYEES – Full Time - 5
Alan Haward Mar 25/04 – Mar 24/07 March 25, 1998 Richard A. Baxter Apr 03/06 – Apr 02/09 April 3, 2006 Rene R. Montague Mar 06/04 – Mar 05/07 March 6, 1986 David A. Patterson Apr 02/04 – Apr 01/07 April 2, 1986 Shannon R. B. McManus Dec 15/05 – Dec. 14/08 December 15, 2005
OLRB Annual Report 2005 – 2006 Order In Council Appointments

I Organizational Overview | 5
Board Staff and Key Activities The OLRB's operations and staff can be broadly divided into: The Board, Administration, Field Services (mediation), and Legal Services. The administrative, field, and legal staff are civil service appointments. The Board is composed of a Chair, an Alternate Chair, Vice-Chairs and Board Members. The Chair, Alternate Chair, Vice-Chairs and Board Members are appointed by the Lieutenant Governor in Council as Order in Council appointments (OIC). ADMINISTRATION: Office of the Director and Registrar The Director and Registrar is the chief administrative officer of the Board. He is responsible for the overall administration of the Board’s businesses: operations, mediation and adjudication. The Director and Registrar oversees the effective processing and scheduling of each case, and communicates with the parties in matters relating to the mediation of cases, scheduling of hearings or on particular problems in the processing of any given case. Every application received by the Board enters the system through the Director and Registrar's office. Manager of Administration The Manager of Administration is responsible for the efficient operation of the Board through the effective and efficient coordination of the procurement and budget functions, human resources functions, client services, Information and Information Technology, and the provision of administrative direction for all shared/common services. Library Services In December 1998 the Ontario Labour Relations Board Library was merged with the Workplace Safety and Insurance Appeals Tribunal Library and the Pay Equity Commission Library to form the new Ontario Workplace Tribunals Library. The library is situated in the same building as the Board – 505 University Avenue – currently on the 7th floor. Library holdings related to the OLRB include all reported OLRB decisions from 1944 to date, all judicial reviews of OLRB decisions from 1947 to date, all bargaining unit certificates issued by the OLRB from 1962 forward. In addition, the Library has a collection of all Employment Standards review decisions from 1970 to date and all Occupational Health and Safety appeal decisions from 1980 to date. Textbooks, journals and case reports in the areas of labour, administrative and constitutional law are also held. Field Services: (Mediation) The Board is a pioneer in the area of alternative dispute resolution. The Manager of Field Services, Labour Relations Specialists, and Labour Relations Officers, are responsible for mediating settlements in all of the Board's cases. In addition to settling cases, Labour Relations Officers assist parties in identifying issues and streamlining the cases that do get adjudicated in order to avoid unnecessary litigation. They also, along with the Board’s Conciliation Officers, carry out the Board’s pre and post vote phone mediation program and conduct representation and final offer votes. Legal Services: Legal Services to the Board are provided by the Solicitors' Office, which consists of two Board Solicitors. The Solicitors provide legal research, advice, opinions and memoranda to the Chair, Vice-Chairs, Board Members, Labour Relations Officers and administrative staff. They are extensively involved in changes to the Board's rules of procedure and forms and contribute to the continuing education of staff. The Board's Solicitors also represent the Board in court proceedings, including applications for judicial review.
OLRB Annual Report 2005 – 2006 Board Staff

ONTARIO LABOUR RELATIONS BOARD
OLR
B A
nnual Report 2005 – 2006
O
rganizational Chart
THE BOARD
• VICE-CHAIRS • MEMBERS
SOLICITOR’S OFFICE
• SOLICITOR • SOLICITORS’ ASSISTANTS
SECRETARY TO CHAIR
DIRECTOR AND REGISTRAR
• REGISTRAR’S ASSISTANTS, • REGISTRAR’S SECRETARIES • CLIENT SERVICE COORDINATOR
MANAGER FIELD SERVICES
• LABOUR RELATIONS SPECIALISTS • LABOUR RELATIONS OFFICERS • LABOUR RELATIONS CONCILIATORS • FIELD SERVICES ASSISTANTS
DEPUTY REGISTRAR
• CASE PROCESSING MANAGERS • CASE PROCESSING ASSISTANTS • VICE-CHAIR ASSISTANTS
MANAGER OF ADMINISTRATION
• ADMINISTRATIVE ASSISTANT • IT/SYSTEMS • OFFICE SERVICES
ALTERNATE CHAIR
CHAIR OLRB
March 2006
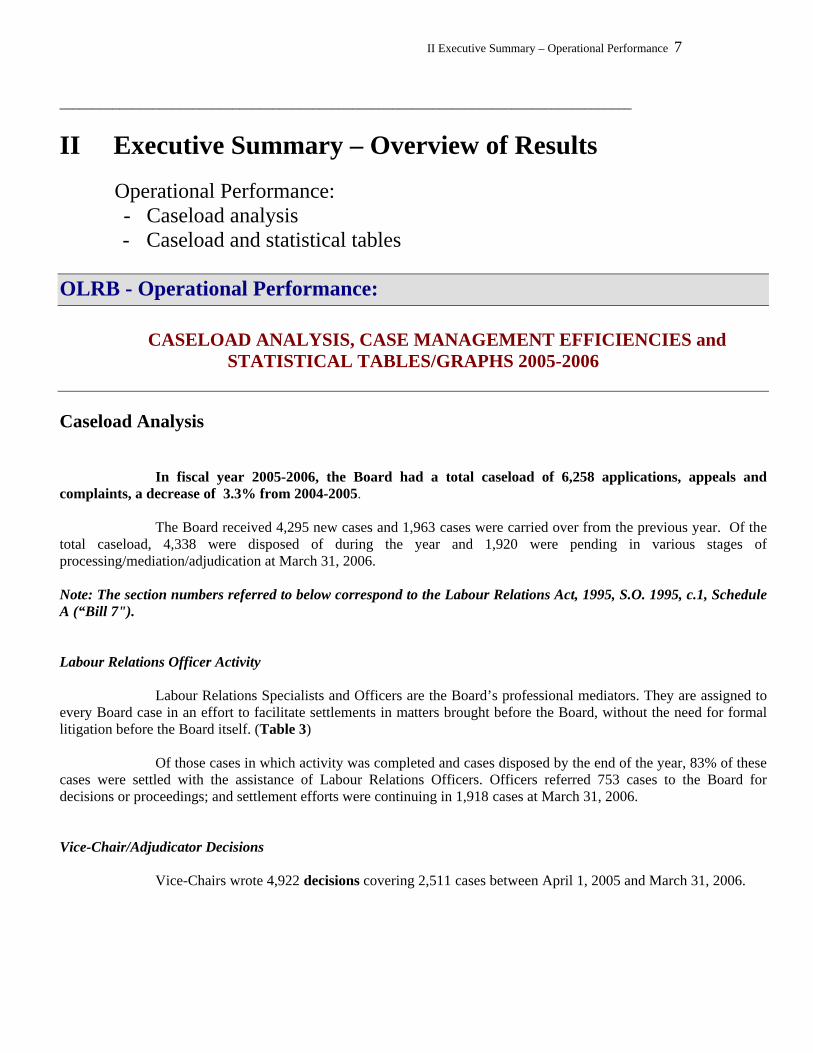
II Executive Summary – Operational Performance 7
______________________________________________________________________________________
II Executive Summary – Overview of Results Operational Performance: - Caseload analysis
- Caseload and statistical tables
OLRB - Operational Performance:
CASELOAD ANALYSIS, CASE MANAGEMENT EFFICIENCIES and STATISTICAL TABLES/GRAPHS 2005-2006
Caseload Analysis In fiscal year 2005-2006, the Board had a total caseload of 6,258 applications, appeals and complaints, a decrease of 3.3% from 2004-2005. The Board received 4,295 new cases and 1,963 cases were carried over from the previous year. Of the total caseload, 4,338 were disposed of during the year and 1,920 were pending in various stages of processing/mediation/adjudication at March 31, 2006. Note: The section numbers referred to below correspond to the Labour Relations Act, 1995, S.O. 1995, c.1, Schedule A (“Bill 7"). Labour Relations Officer Activity Labour Relations Specialists and Officers are the Board’s professional mediators. They are assigned to every Board case in an effort to facilitate settlements in matters brought before the Board, without the need for formal litigation before the Board itself. (Table 3) Of those cases in which activity was completed and cases disposed by the end of the year, 83% of these cases were settled with the assistance of Labour Relations Officers. Officers referred 753 cases to the Board for decisions or proceedings; and settlement efforts were continuing in 1,918 cases at March 31, 2006. Vice-Chair/Adjudicator Decisions Vice-Chairs wrote 4,922 decisions covering 2,511 cases between April 1, 2005 and March 31, 2006.

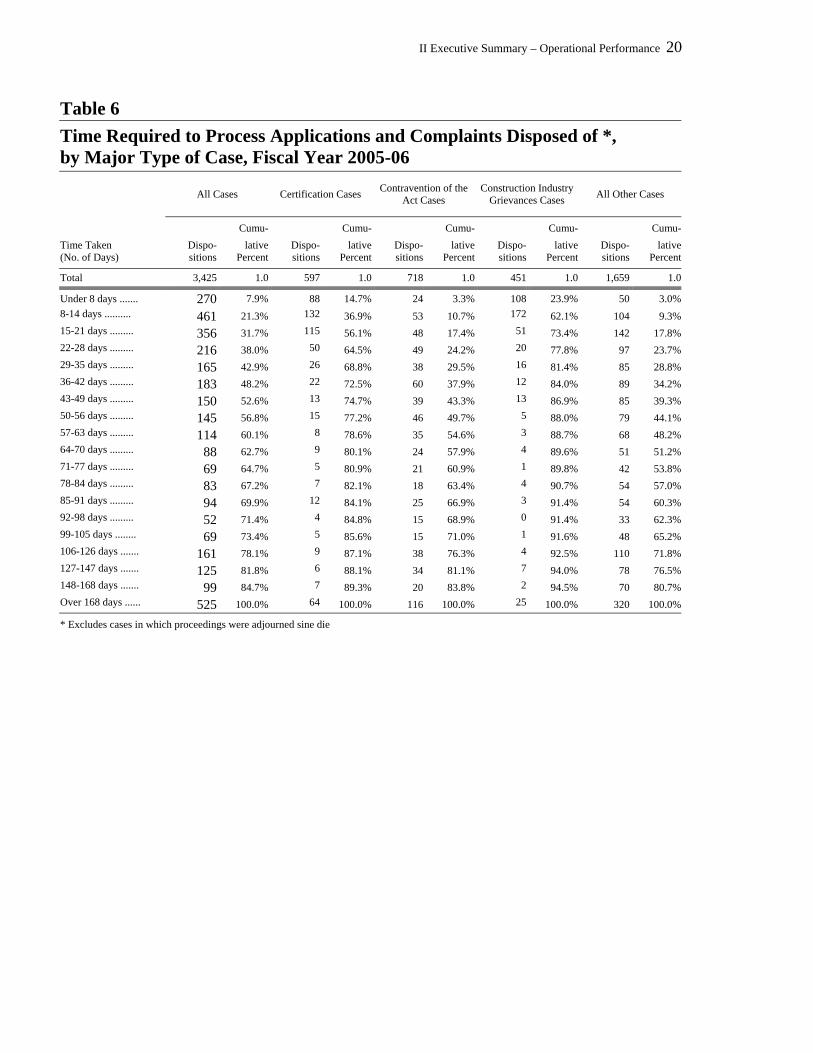
II Executive Summary – Operational Performance 8
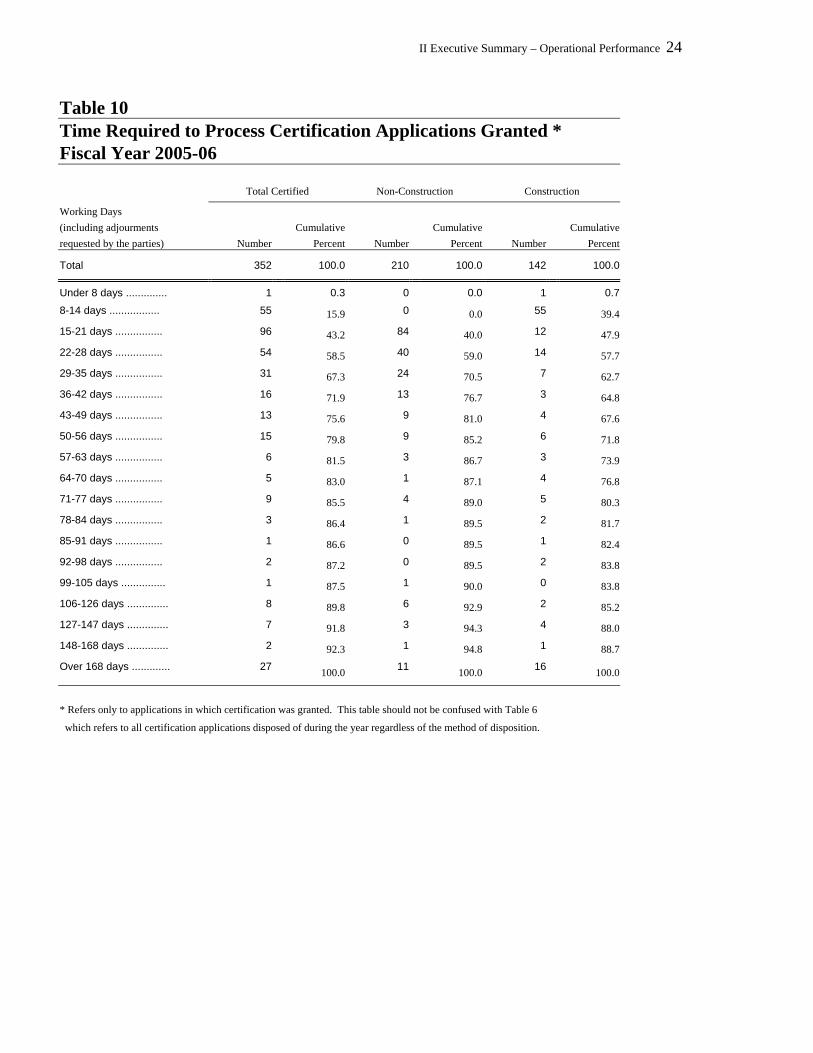
Disposition Time – Major Categories Table 6 provides statistics on the time taken by the Board to process the 3,425 cases disposed of in 2005-2006, excluding cases in which proceedings were adjourned sine die. Information is shown separately for the three major categories of cases handled by the Board – Certification applications, complaints of Contravention of the Act, and Referrals of Grievances under Construction Industry Collective Agreements – and for the remaining categories combined. Overall median times to proceed from filing to disposition for the 3,425 cases was 46 days. Median times for the three major categories of cases: 597 certification applications were processed in a median of 18 days; 718 complaints of contravention of the Act took 59 days; 451 referrals of construction industry grievances required 10 days, and the remaining 1,659, for all other categories combined, took 69 days. Certification of Bargaining Agents In 2005-2006, the Board received 631 applications for certification of trade unions as bargaining agents of employees, a decrease of 16.86 percent from 2004-2005. (Table 1) In addition to the 631 applications received, 241 cases were carried over from last year, making a total certification caseload of 872 in 2005-2006. Of the total caseload, 661 were disposed of and 211 cases were pending at March 31, 2006. Of the 661 dispositions, certification was granted in 352 cases; 146 cases were dismissed; 3 cases were terminated; and 160 cases were settled. The certified cases represented 53.25 percent of the total dispositions. (Table 1) Of the 498 applications that were either certified or dismissed, final decisions in a number of cases were based on the results of representation votes. Of the 394 votes conducted, 359 involved a single union on the ballot, and 35 were between two unions. Applicants won in 251 of the votes and lost in the other 143. (Table 5) A total of 21,606 employees were eligible to vote in the 394 elections, of whom 17,966 or 83.2 percent cast ballots. In the 251 votes that were won and resulted in certification, 11,598 or 64.6 percent of the 17,966 employees eligible to vote cast ballots. Of these voters, 7,930 or 77.8 percent favoured union representation. In the 143 elections that were lost and resulted in dismissals, 6,368 employees participated, and, of these, 2,260 or 35.5 percent voted for union representation. (Table 5) Eight unions, each with more than 25 applications, accounted for 65.3 percent of the total filings: Labourers (167), Carpenters (48), Canadian Auto Workers (38), Canadian Union of Public Employees (CUPE) (29), Teamsters (36), Painters (37), Food and Commercial Workers (31), United Steelworkers (26). In contrast, twelve unions filed fewer than five applications each. These unions together accounted for 5.07 percent of the total certification filings. (Table 7) Table 8 gives the industrial distribution of the certification applications received and disposed of during the year. Non-manufacturing industries accounted for 95.6 percent of the applications received, concentrated in construction (273) and other services (200). These two groups comprised 74.9 percent of the total non-manufacturing applications. The 28 applications involving establishments in manufacturing industries comprised 4.43% percent of the new applications. Size and Composition of Bargaining Units

II Executive Summary – Operational Performance 9
Small units continued to be the predominant pattern of union organizing efforts through the certification process in 2005-2006. The average size of the 352 bargaining units in the 352 applications that were certified was 19 employees, compared with 43 employees in 2004-2005. The 142 units in construction certifications averaged 8 employees, and the 210 units in non-construction certifications averaged 25 employees. Seventy-six point seven percent of the total certification applications involved units of fewer than 40 employees, and 44 percent applied to units of fewer than ten employees. The total number of employees covered by the certification applications granted increased to 14,461 from 11,610 in 2005-2006. (Table 9) Of the employees covered by the certification applications granted, 207, or 1.43 percent, were in bargaining units that comprised full-time employees or in units that excluded employees working 24 hours or less a week. Units composed of employees working 24 hours or less a week accounted for 4 employees. Full-time and part-time employees were represented in units covering 37 employees, including units that did not specifically exclude employees working 24 hours or less a week. (Tables 11 and 12) Seventeen point four (17.4) percent of the employees, or 2,508 were employed in production and related occupations. (Tables 13 and 14) Disposition Time – Certifications Granted A median time of 20 calendar days was required to complete the 352 certification applications granted from receipt to disposition. For non-construction certification, the median time was 22 days for 210 cases; and for construction certification, the median time was 25 days for 142 cases. (Table 10) Eighty-six (86.0) percent of the 352 certification applications granted were disposed of in 84 days (3 months) or less. (Table 10). Termination of Bargaining Rights In 2005-2006, the Board received 95 applications under sections 63, 65, 66, 67, and 132 of the Act, seeking termination of the bargaining rights of trade unions. In addition, 34 cases were carried over from 2004-2005. (Table 1) Of the 129 cases processed, bargaining rights were terminated in 2 cases, 31 cases were dismissed, 14 cases were settled and 32 cases were pending at March 31, 2006. 62 representation votes were held on 81 cases that were either granted or dismissed. A total of 5,207 employees were eligible to vote in the 62 elections that were held, of whom 4,059 or 77 percent cast ballots. Of those who cast ballots, 318 voted for continued representation by unions and 1,628 voted against. (Table 5) Representation Votes In 2005-2006, the Board's Labour Relations Officers and Conciliators conducted a total of 454 representation votes among employees in one or more bargaining units. Of the 454 votes conducted, 386 involved certification applications, and 68 were held in applications for termination of existing bargaining rights. (Table 4)

II Executive Summary – Operational Performance 10
Of the certification votes, 359 involved a single union on the ballot, and 27 involved two unions. A total of 27,305 employees were eligible to vote in the 454 elections that were conducted, of whom 22,217 or 81.0 percent cast ballots. Of those who participated, 53.0 percent voted in favour of union representation. In the 386 elections in certification applications, 82.0 percent of the eligible voters cast ballots, with 44.0 percent of the participants voting for union representation. In the 68 votes in applications for termination of bargaining rights, 78.0 percent of the eligible voters cast ballots, with only 50.0 percent of those who participated voting for the incumbent unions. Final Offer Votes In addition to taking votes ordered in its cases, the Board's Registrar was requested by the Minister to conduct votes among employees on employers' last offer for settlement of a collective agreement dispute under section 42(1) of the Act. Although the Board is not responsible for the administration of votes under that section, the Board's Registrar and field staff are assigned to conduct these votes because of their expertise and experience in conducting representation votes under the Act. Of the 18 requests dealt with by the Board during the fiscal year, 4 cases were granted, 10 cases were dismissed, 3 cases were settled, and the remaining case was pending at March 31, 2006. (Table 1) In the 17 votes held, employees accepted the employer's offer in 4 cases and rejected the offer in 10 cases. Declaration of Successor Trade Union In 2005-2006, the Board dealt with 81 applications for declarations under section 68 of the Act concerning the bargaining rights of successor trade unions resulting from a union merger or transfer of jurisdiction. Affirmative declarations were issued by the Board in 42 cases. (Table 1) Declaration of Successor or Common Employer Status In 2005-2006, the Board dealt with 328 applications for declarations under section 69 of the Act concerning the bargaining rights of trade unions of a successor employer resulting from a business sale, or for declarations under section 1(4) to treat two companies as one employer. The two types of requests are often made in a single application. Affirmative declarations were issued by the Board in 39 cases, 5 applications were dismissed, 125 cases were settled and 159 cases were pending at March 31, 2006. (Table 1) Declaration/Direction of Unlawful Strike In 2005-2006, the Board dealt with 14 applications seeking a declaration under section 100 regarding an alleged unlawful strike by employees in the non-construction industry. Ten cases were settled, no cases were granted. Two cases were pending at March 31, 2006. (Table 1)

II Executive Summary – Operational Performance 11
Consent to Prosecute In 2005-2006, the Board dealt with 4 applications under section 109 of the Act requesting consent to institute prosecution in court against unions and employers for alleged commission of offences under the Act. Three cases were settled, the remaining case was pending at March 31, 2006. (Table 1) Complaints of Contravention of Act Complaints alleging contravention of the Act may be filed with the Board under section 96 of the Act. In handling these cases the Board emphasizes settlements facilitated by its labour relations officers. In 2005-2006, the Board received 1,450 complaints under this section. In complaints against employers, the principal charges were alleged illegal discharge of or discrimination against employees for union activity in violation of section 70 and 72 of the Act, illegal changes in wages and working conditions contrary to section 86, and failure to bargain in good faith under section 17. These charges were made mostly in connection with applications for certification. The principal charge against trade unions was alleged failure to represent employees fairly in grievances against their employer. In addition to the complaints received, 496 cases were carried over from 2004-2005. Of the 1,450 cases processed, 687 were settled, and 540 cases were pending at March 31, 2006. (Table 1) In 910, or 62.0 percent, of the 1,450 dispositions, settlements and withdrawals of the complaint were secured by labour relations officers (Table 3). Remedial orders were issued by the Board in 21 cases, 197 cases were dismissed, and 5 cases were terminated. (Table 1) Construction Industry Grievances Grievances over alleged violation of the provisions of a collective agreement in the construction industry may be referred to the Board for resolution under section 133 of the Act. As with complaints of contravention of the Act, the Board encourages settlement of these cases by the parties involved, with the assistance of a labour relations officer. In 2005-2006, the Board received 888 cases under this section. The principal issues in these grievances were alleged failure by employers to make required contributions to health and welfare, pension and vacation funds, failure to deduct union dues, and alleged violation of the subcontracting and hiring arrangements in the collective agreement. In addition to the cases received, 217 were carried over from 2004-2005. Of the total 1,105 processed, 905 were disposed of; of these, awards were made by the Board in 175 cases, 10 cases were dismissed, and 200 cases were pending at March 31, 2006. (Table 1) In 905, or 81.0, percent of the 1,105 dispositions, settlements and withdrawal of the grievance were obtained by labour relations officers. (Table 3)
.

II Executive Summary – Operational Performance 12
MISCELLANEOUS APPLICATIONS AND COMPLAINTS Religious Exemption – Exemption from Union Security Provision in Collective Agreement One application was processed under section 52 of the Act, seeking exemption for employees from the union security provisions of collective agreements because of their religious beliefs. One application was granted. (Table 1) Early Termination of Collective Agreements Eleven applications were processed under section 58(3) of the Act, seeking early termination of collective agreements. Consent was granted in nine cases, and settled in two cases. (Table 1) Union Financial Statements Four complaints were dealt with under section 92 of the Act, alleging failure by trade unions to furnish members with audited financial statements of the union's affairs. Four applications were settled. (Table 1) Jurisdictional Disputes Ninety-one complaints were dealt with under section 99 of the Act involving union work jurisdiction. An assignment of work in dispute was made by the Board in seven cases, 32 cases were settled, 9 cases were dismissed, and 41 cases were pending at March 31, 2006. (Table 1) Referral on Employee Status The Board dealt with 32 applications under section 114(2) of the Act, seeking decisions on the status of individuals as employees under the Act. Twelve cases were settled by the parties in discussions with labour relations officers. One case was granted, two cases were dismissed and the remaining seventeen cases were pending at March 31, 2006. (Table 1) Referrals by Minister of Labour In 2003-2004, the Board dealt with 8 cases referred by the Minister under section 115 of the Act for opinions or questions related to the Minister's authority to appoint a conciliation officer under section 18 of the Act, or an arbitrator under sections 48 or 49. One application was granted, three applications were settled, and the remaining four cases were pending at March 31, 2006. (Table 1) The Board also dealt with 6 cases referred by the Minister under subsection 3(2) of the Hospital Labour Disputes Arbitration Act. Three applications were granted, one was dismissed, one was settled and the remaining case was pending at March 31, 2006. (Table 1)

II Executive Summary – Operational Performance 13
First Agreement Arbitration In 2005-2006, the Board processed 14 applications for directions to settle first agreements by arbitration. Nine cases were settled, three were granted and two cases were pending at March 31, 2006. (Table 1) Occupational Health and Safety Act In 2005-2006, the Board received 176 complaints under section 50 of the Occupational Health and Safety Act alleging wrongful discipline or discharge for acting in compliance with the Act. Fifty-two cases were carried over from 2005-2006. Of the total 176 cases processed, 120 cases were disposed of. Of these, 101 cases were settled by the parties in discussions with labour relations officers (Table 3). Seventeen cases were dismissed, one case was terminated, and the remaining 56 were pending at March 31, 2006. Appeals under The Employment Standard Act The Employment Standards Act deals with workplace rights such as minimum wage, hours of work, overtime, vacation or public holiday pay, termination issues, and severance pay. The Board dealt with 1,573 appeals during 2005-2006. Of the 1,046 cases that were disposed of, 84 were granted, 207 were dismissed, 700 cases were settled, 55 were terminated, and 527 cases were pending at March 31, 2006. (Table 1) Appeals under The Occupational Health and Safety Act The Occupational Health and Safety Act and its regulations ensure that workers' health and safety in the workplace is protected. Violations of the Act are investigated by health and safety inspectors; orders or decisions of inspectors are the subject of appeals to the Ontario Labour Relations Board. Two hundred and ninety-eight appeals were dealt with by the Board in 2005-2006. Of the 211 cases that were disposed of, 7 appeals were granted, 65 were dismissed, 136 cases were settled, 3 were terminated and 87 cases were pending at March 31, 2006. (Table 1) Applications under The Public Sector Labour Relations Transitions Act The Public Sector Labour Relations Transition Act, 1997 established a separate regime of successor rights governing matters that arise out of restructuring and amalgamations in the broader public sector. The Act gives the Board the power to determine new bargaining unit configurations, to appoint new bargaining agents, and to address other collective bargaining issues that may arise from municipal amalgamations, school board changes and hospital restructuring. In 2005-2006, the Board processed 7 applications under the Public Sector Labour Relations Transition Act, 1997. Of the 5 cases that were disposed of, 3 cases were granted and 2 were pending at March 31, 2006.. (Table 1)

II Executive Summary – Operational Performance 14
COURT ACTIVITY 2005-2006 On April 1, 2005, there were twenty-four Board matters pending before the Courts, twenty-two at Divisional Court, and one matter seeking leave before each of the Court of Appeal for Ontario and the Supreme Court of Canada. During the 2005-2006 fiscal year, there were eight new applications for judicial review of Board decisions filed with the Divisional Court. There were three applications for leave to the higher courts: one to the Court of Appeal and two to the Supreme Court of Canada
Two plaintiffs sought to sue the Board in Small Claims Court. Both claims were dismissed.
Twenty-one matters were disposed of by the Divisional Court. Sixteen applications for judicial review were
dismissed; three were abandoned. The Board was asked to state two cases for contempt to the Divisional Court. In each matter, contempt was found and the offending parties were fined. The Ontario Court of Appeal received one new motion for leave to appeal, in addition to entertaining one earlier pending matter. Both leave applications were dismissed.
The Supreme Court of Canada dismissed the one pending leave application. Two fresh ones have been filed by
the applicants who were unsuccessful at the Court of Appeal. On March 31, 2006, there were thirteen outstanding court applications, eleven applications for judicial review at Divisional Court, and two motions for leave at the Supreme Court of Canada.

II Executive Summary – Operational Performance 15
Table 1
Total Applications and Complaints Received, Disposed of and Pending Fiscal Year 2005-06
Caseload
Disposed of Fiscal Year 2005-06
Settled Type of Case Total
Pending April 1,
2005
Received Fiscal Year
2005-06 Total
Granted* Dismissed Terminated Withdrawn/ Sine Die
Pending March 31,
2006
Total 6,258 1,963 4,295 4,338 805 705 81 2,747 1,920 CERTIFICATION OF BARGAINING AGENTS 872 241 631 661 352 146 3 160 211 DECLARATION OF TERMINATION OF BARGAINING RIGHTS 129 34 95 97 50 31 2 14 32 ACCREDITATION 3 0 3 1 1 0 0 0 2 DECLARATION OF SUCCESSOR TRADE UNION 81 53 28 69 42 2 9 16 12
DECLARATION OF SUCCESSOR EMPLOYER OR COMMON EMPLOYER STATUS 328 165 163 169 39 5 0 125 159
DECLARATION AND DIRECTION OF UNLAWFUL STRIKE 14 3 11 12 0 2 0 10 2
DECLARATION AND DIRECTION OF UNLAWFUL LOCKOUT 4 0 4 3 0 1 0 2 1 CONSENT TO PROSECUTE 4 2 2 3 0 0 0 3 1 CONTRAVENTION OF ACT 1,450 496 954 910 21 197 5 687 540
EXEMPTION FROM UNION SECURITY PROVISION IN COLLECTIVE AGREEMENT 1 1 0 1 1 0 0 0 0 EARLY TERMINATION OF COLLECTIVE AGREEMENT 11 1 10 11 9 0 0 2 0 TRADE UNION FINANCIAL STATEMENT 4 1 3 4 0 0 0 4 0 JURISDICTIONAL DISPUTE 91 40 51 50 7 9 2 32 41 REFERRAL ON EMPLOYEE STATUS 32 18 14 15 1 2 0 12 17 REFERRAL FROM MINISTER ON APPOINTMENT OF CONCILIATION OFFICER OR ARBITRATOR OR UNDER HLDAA
14 3 11 9 4 1 0 4 5
II Executive Sum
mary –
Operational Perform
ance 15
REFERRAL OF CONSTRUCTION INDUSTRY GRIEVANCE 1,105 217 888 905 175 10 1 719 200
COMPLAINT UNDER OCCUPATIONAL HEALTH AND SAFETY ACT 176 52 124 120 1 17 1 101 56
COMPLAINT UNDER THE ENVIRONMENTAL PROTECTION ACT 2 0 2 1 0 0 0 1 1
COMPLAINT UNDER THE SMOKING IN THE WORKPLACE ACT 1 1 0 1 0 0 0 1 0
FIRST AGREEMENT ARBITRATION DIRECTION 14 6 8 12 3 0 0 9 2
DETERMINATION OF SECTOR OF CONSTRUCTION WORK 9 6 3 1 0 0 0 1 8
FINAL OFFER VOTE** 18 1 17 17 4 10 0 3 1
EMPLOYMENT STANDARDS ACT (APPEAL) 1,573 529 1,044 1,046 84 207 55 700 527 OCCUPATIONAL HEALTH AND SAFETY ACT (APPEAL) 298 86 212 211 7 65 3 136 87 PUBLIC SECTOR LABOUR RELATIONS TRANSITION ACT, 1997 7 0 7 5 3 0 0 2 2 PROJECT AGREEMENT APPLICATION 0 0 0 0 0 0 0 0 0 AMBULANCE SERVICES COLLECTIVE BARGAINING ACT, 2001 5 4 1 2 1 0 0 1 3 OTHER CASE TYPES 12 3 9 2 0 0 0 2 10 * Includes cases in which a request was granted or a determination made by the Board.
** For final Offer Votes, "Granted" indicates that the offer was accepted and "Dismissed" indicates a rejection.

Table 2 Applications and Complaints Received and Disposed of Fiscal Years 2001-02 to 2005-06 Number Received, Fiscal Year Number Disposed of, Fiscal Year TYPE OF CASE Total 2001-02 2002-03 2003-04 2004-05 2005-06 Total 2001-02 2002-03 2003-04 2004-05 2005-06
Total 21,401 3,900 4,324 4,316 4,566 4,295 20,917 3,958 4,039 4,133 4,449 4,338
CERTIFICATION OF BARGAINING AGENTS 3,401 624 658 729 759 631 3,369 686 627 584 811 661
DECLARATION OF TERMINATION OF BARGAINING RIGHTS 628 180 108 113 132 95 639 174 125 102 141 97ACCREDITATION 6 1 1 1 0 3 8 4 0 2 1 1 DECLARATION OF SUCCESSOR TRADE UNION 205 38 13 3 123 28 202 44 15 4 70 69DECLARATION OF SUCCESSOR EMPLOYER OR COMMON EMPLOYER STATUS 758 149 158 144 144 163 737 162 161 130 115 169DECLARATION AND DIRECTION OF UNLAWFUL STRIKE 105 35 22 16 21 11 105 33 21 21 18 12
DECLARATION AND DIRECTION OF UNLAWFUL LOCKOUT 10 3 2 1 0 4 10 2 3 2 0 3
CONSENT TO PROSECUTE 19 3 5 4 5 2 19 3 3 5 5 3
CONTRAVENTION OF ACT 4,500 842 912 879 913 954 4,382 871 837 848 916 910RIGHT OF ACCESS 0 0 0 0 0 0 0 0 0 0 0 0EXEMPTION FROM UNION SECURITY PROVISION IN COLLECTIVE AGREEMENT 16 9 4 1 2 0 20 5 9 4 1 1
EARLY TERMINATION OF COLLECTIVE AGREEMEN T 43 10 8 8 7 10 45 10 9 9 6 11
TRADE UNION FINANCIAL STATEMENT 21 2 9 4 3 3 25 5 2 6 8 4
JURISDICTIONAL DISPUTE 204 30 49 31 43 51 179 24 39 39 27 50
REFERRAL ON EMPLOYEE STATUS 99 14 33 12 26 14 104 14 44 12 19 15
REFERRAL FROM MINISTER ON APPOINTMENT OF CONCILIATION OFFICER OR ARBITRATOR OR UNDER HLDAA
63 21 13 11 7 11 65 21 15 13 7 9
REFERRAL FROM MINISTER ON CONSTRUCTION BARGAINING AGENC Y 1 1 0 0 0 0 1 0 1 0 0 0 REFERRAL OF CONSTRUCTION INDUSTRY GRIEVANCE 4,204 706 820 844 946 888 4,111 669 831 844 862 905
COMPLAINT UNDER OCCUPATIONAL HEALTH AND SAFETY ACT 534 97 96 112 105 124 513 91 101 94 107 120
COMPLAINT UNDER THE ENVIRONMENTAL PROTECTION AC T 5 0 0 3 0 2 5 0 1 0 3 1
COMPLAINT UNDER THE SMOKING IN THE WORKPLACE AC T 1 1 0 0 0 0 2 0 1 0 0 1
FIRST AGREEMENT ARBITRATION DIRECTIO N 48 14 9 11 6 8 49 15 9 9 4 12
DETERMINATION OF SECTOR OF CONSTRUCTION WOR K 16 0 6 3 4 3 9 1 2 3 2 1
FINAL OFFER VOTE 99 31 17 15 19 17 102 32 19 13 21 17EMPLOYMENT STANDARDS ACT (APPEALS) 5,189 739 1,024 1,221 1,161 1,044 5,006 744 834 1,211 1,171 1,046
OCCUPATIONAL HEALTH AND SAFETY ACT (APPEAL) 823 161 175 142 133 212 799 145 167 149 127 211
PUBLIC SECTOR LABOUR RELATIONS TRANSITION ACT, 1997 56 40 6 3 0 7 73 51 11 4 2 5
CROWN EMPLOYEES COLLECTIVE BARGAINING ACT 146 146 0 0 0 0 147 147 0 0 0 0
PROJECT AGREEMENT APPLICATION 5 3 1 1 0 0 3 0 1 0 0 4
FIRE PROTECTION AND PREVENTION ACT 0 0 0 0 0 0 2 1 1 0 0 4
AMBULANCE SERVICES COLLECTIVE BARGAINING ACT, 2001 11 0 2 3 5 1 0 0 2 4 2 8
OTHER CASE TYPES 185 0 173 1 2 9 175 0 151 21 1 2
II Executive Sum
mary –
Operational Perform
ance 16

II Executive Summary – Operational Performance 17
Table 3 Labour Relations Officer Activity in Cases Processed * Fiscal Year 2005-06 Cases in Which Activity Completed
Pending April 1, 2005
Total
Cases Referred Sine
Type of Case Assigned Total Number Percent to Board Die Pending**
Total 6,258 4,337 3,584 83% 753 913 1,918
CERTIFICATION OF BARGAINING AGENTS 872 661 567 86% 94 64 211
SUCCESSOR EMPLOYER OR COMMON EMPLOYER STATUS 328 169 132 78% 37 56 159
REFERRAL ON EMPLOYEE STATUS 32 15 13 87% 2 5 17
CONTRAVENTION OF ACT 1,450 910 772 85% 138 192 540
REFERRAL OF CONSTRUCTION INDUSTRY GRIEVANCE 1,105 905 809 89% 96 454 200
COMPLAINT UNDER THE OCCUPATIONAL HEALTH AND SAFETY ACT 176 120 104 87% 16 18 56
EMPLOYMENT STANDARD ACTS (APPEAL) 1,573 1,046 766 73% 280 35 527
OCCUPATIONAL HEALTH AND SAFETY ACT (APPEALS) 298 211 192 91% 19 51 87
ALL OTHER CASE TYPES 424 300 229 76% 77 38 121
*Includes all cases assigned to labour relations officers, which may or may not have been disposed of by the end of the year.
**Includes all cases in which the officer activity may or may not be complete but which was not disposed of by the end of the year.

II Executive Summary – Operational Performance 18
Table 4 Results of Representation Votes Conducted * Fiscal Year 2005-06
Ballots Cast
Type of Case Number of
VotesEligible
Employees TotalIn Favour of
Unions
Total 454 27,305 22,217 11,835
Certification 386 22,195 18,230 9,837
Regular cases One union 303 17,368 14,969 7,233
Two unions 25 4,103 2,533 2,384
Construction cases One union 56 674 680 172
Two unions 2 50 48 48
Termination of Bargaining Rights One union 68 5,110 3,987 1,998
* Refers to all representation votes conducted and the results counted during the fiscal year, regardless of whether
or not the case was disposed of during the year.

II Executive Sum
mary –
Operational Perform
ance 19Table 5 Results of Representation Votes in cases Disposed of * Fiscal Year 2005-06
Number of Votes Eligible Votes All Ballots Cast Ballots Cast in Favour of Unions
In Votes In Votes In Votes
Type of Case Total Appl. Won Appl.
Lost Total Won Lost Total Won Lost Total Won Lost
Total 456 296 160 26,813 15,695 11,118 22,025 12,777 9,248 12,136 8,248 3,888
Certification 394 251 143 21,606 14,234 7,372 17,966 11,598 6,368 10,190 7,930 2,260
Regular cases One union
286 193 93
16,418 10,816 5,602
14,151 9,204 4,947
7,210 5,769 1,441 Two unions 24 18 6 4,158 2,985 1,173 2,551 1,907 644 2,517 1,879 638
Construction cases One union 73 34 39 861 328 533 954 358 596 283 184 99
Two unions 11 6 5 169 105 64 310 129 181 180 98 82
Termina tion One union 62 45 17 5,207 1,461 3,746 4,059 1,179 2,880 1,946 318 1,628
* Refers to final representation votes conducted in cases disposed of during the fiscal year. This table should not be confused with Table 4 which refers to all representation votes conducted during the year regardless of whether or not the case was disposed of during the year.
II Executive Summary – Operational Performance 20
Table 6 Time Required to Process Applications and Complaints Disposed of *, by Major Type of Case, Fiscal Year 2005-06
All Cases Certification Cases Contravention of the Act Cases
Construction Industry Grievances Cases All Other Cases
Cumu- Cumu- Cumu- Cumu- Cumu-Time Taken Dispo- lative Dispo- lative Dispo- lative Dispo- lative Dispo- lative(No. of Days) sitions Percent sitions Percent sitions Percent sitions Percent sitions Percent
Total 3,425 1.0 597 1.0 718 1.0 451 1.0 1,659 1.0
Under 8 days ....... 270 7.9% 88 14.7% 24 3.3% 108 23.9% 50 3.0%8-14 days .......... 461 21.3% 132 36.9% 53 10.7% 172 62.1% 104 9.3%15-21 days ......... 356 31.7% 115 56.1% 48 17.4% 51 73.4% 142 17.8%22-28 days ......... 216 38.0% 50 64.5% 49 24.2% 20 77.8% 97 23.7%29-35 days ......... 165 42.9% 26 68.8% 38 29.5% 16 81.4% 85 28.8%36-42 days ......... 183 48.2% 22 72.5% 60 37.9% 12 84.0% 89 34.2%43-49 days ......... 150 52.6% 13 74.7% 39 43.3% 13 86.9% 85 39.3%50-56 days ......... 145 56.8% 15 77.2% 46 49.7% 5 88.0% 79 44.1%57-63 days ......... 114 60.1% 8 78.6% 35 54.6% 3 88.7% 68 48.2%64-70 days ......... 88 62.7% 9 80.1% 24 57.9% 4 89.6% 51 51.2%71-77 days ......... 69 64.7% 5 80.9% 60.9% 1 89.8% 42 53.8%2178-84 days ......... 83 67.2% 7 82.1% 18 63.4% 4 90.7% 54 57.0%85-91 days ......... 94 69.9% 12 84.1% 25 66.9% 3 91.4% 54 60.3%92-98 days ......... 52 71.4% 4 84.8% 15 68.9% 0 91.4% 33 62.3%99-105 days ........ 69 73.4% 5 85.6% 15 71.0% 1 91.6% 48 65.2%106-126 days ....... 161 78.1% 9 87.1% 38 76.3% 4 92.5% 110 71.8%127-147 days ....... 125 81.8% 6 88.1% 34 81.1% 7 94.0% 78 76.5%148-168 days ....... 99 84.7% 7 89.3% 20 83.8% 2 94.5% 70 80.7%Over 168 days ...... 525 100.0% 64 100.0% 100.0% 25 100.0% 320 100.0%116
* Excludes cases in which proceedings were adjourned sine die

II Executive Summary – Operational Performance 21
Table 7 Union Distribution of Certification Applications Received and Disposed of Fiscal Year 2005-06 Number of Applications Disposed of Number of Applications Union Received Total Certified Dismissed* Settled** All Unions 631 597 352 149 96
ASBESTOS WORKERS 2 0 0 0 0
4 4 3 1 0 AUTO WORKERS
5 3 3 0 0 BOILERMAKERS BREWERY AND SOFT DRINK WORKERS 16 14 10 2 2
BRICKLAYERS INTERNATIONAL 2 2 2 0 0
CANADIAN AUTO WORKERS 38 44 26 14 4
CANADIAN UNION OF PUBLIC EMPLOYEES (CUPE) 29 33 19 9 5
CARPENTERS 48 57 26 16 15
CHRISTIAN LABOUR ASSOCIATION 13 12 7 2 3
CLOTHING AND TEXTILE WORKERS 8 8 7 1 0
COMMUNICATIONS, ENERGY AND PAPERWORKERS UNION OF CANADA
8 9 7 1 1
ELECTRICAL WORKERS (IBEW) 20 21 14 2 5
FOOD AND COMMERCIAL WORKERS 31 31 21 8 2
FOOD AND SERVICE WORKERS 10 10 7 1 2
GRAPHIC COMMUNICATION UNION 2 2 0 1 1
HOTEL EMPLOYEES 2 1 0 0 1
INDEPENDENT LOCAL UNION 1 1 1 0 0
INTERNATIONAL OPERATING ENGINEERS 20 15 7 5 3
LABOURERS 167 146 80 36 30 MACHINISTS 3 4 3 1 0 NEWSPAPER GUILD 3 1 0 1 0 OFFICE AND PROFESSIONAL EMPLOYEES 4 3 1 2 0
ONTARIO NURSES ASSOCIATION 7 7 5 1 1 ONTARIO PUBLIC SCHOOL TEACHERS 1 0 0 0 0 ONTARIO PUBLIC SERVICE EMPLOYEES 6 8 8 0 0 OTHER UNIONS, INCLUDING EMPLOYEE ASSOCIATIONS 5 4 3 1 0 PAINTERS 37 29 17 6 6 PLUMBERS 24 14 7 4 3 RETAIL WHOLESALE EMPLOYEES 6 5 1 4 0 SERVICE EMPLOYEES INTERNATIONAL 25 21 17 2 2 SHEET METAL WORKERS 4 5 4 1 0 STRUCTURAL IRON WORKERS 10 10 7 0 3 TEACHERS FEDERATION 4 4 3 1 0
TEAMSTERS 36 38 18 17 3 THEATRICAL STAGE EMPLOYEES 6 6 5 0 1 UNITED STEELWORKERS 26 25 13 9 3
*Includes cases which were closed for administrative purposes **Excludes cases in which proceedings were adjourned sine die

II Executive Summary – Operational Performance 22
Table 8 Industry Distribution of Certification Applications Received and Disposed of Fiscal Year 2005-06 Number of Applications Disposed of Number of
Applications
Industry Received Total Certified Dismissed* Settled** All Industries 631 597 352 149 96
Manufacturing 28 21 15 5 1
FABRICATED METALS 1 1 1 0 0
FOOD, BEVERAGES 12 10 8 2 0
MACHINERY 3 2 1 1 0
PETROLEUM 0 1 0 0 1
PRINTING, PUBLISHING 2 1 1 0 0
RUBBER, PLASTICS 1 1 0 1 0
TEXTILES 1 1 1 0 0
WOOD 2 1 1 0 0
OTHER MANUFACTURING 6 3 2 1 0
Non-Manufacturing 603 576 337 144 95
ACCOMMODATION, FOOD SERVICES 6 7 3 4 0
CONSTRUCTION 273 241 136 47 58
EDUCATION, RELATED SERVICES 2 0 0 0 0
ELECTRIC, GAS, WATER 1 1 1 0 0
FINANCE, INSURANCE CARRIERS 2 2 1 1 0
HEALTH, WELFARE SERVICES 27 26 16 6 4
HOSPITAL 5 2 1 1 0
LOCAL GOVERNMENT 1 3 2 1 0
MINING, QUARRYING 1 1 0 1 0
MUNICIPAL 1 2 2 0 0
PERSONAL SERVICES 4 4 2 1 1
RECREATIONAL SERVICES 1 1 1 0 0
RETAIL TRADE 2 2 2 0 0
SCHOOL BOARD 1 1 1 0 0
STORAGE 1 1 0 1 0
TRANSPORTATION 8 10 9 1 0
OTHER SERVICES 200 204 123 59 22
OTHER NON-MANUFACTURING 67 68 37 21 10
*Includes cases which were closed for administrative purposes
**Excludes cases in which proceedings were adjourned sine die

II Executive Summary – Operational Performance 23
Table 9 Size of Bargaining Units in Certification Applications Granted Fiscal Year 2005-06 Total Construction ** Non-Construction
Employee Size *
Number of Applications
Number of Employees
Number of Applications
Number of Employees
Number of Applications
Number of Employees
Total 352 14,461 142 1,057 210 13,404
0-9 employees 155 672 113 420 42 252
10-19 employees 72 995 21 267 51 728
20-39 employees 43 1,194 4 97 39 1,097
40-99 employees 48 3,078 4 273 44 2,805
100-199 employees 22 2,860 0 0 22 2,860
200-499 employees 9 2,929 0 0 9 2,929
500 employees or more 3 2,733 0 0 3 2,733
* Refers to the total number of employees in one or more bargaining units certified in an application. A total of 348 bargaining units were certified in the 352 applications in which certification was granted.
** Refers to cases processed under the construction industry provisions of the Act. This figure should not be
confused with the figure in Table 8, which includes all applications involving construction employers
whether processed under the construction industry provisions of the Act or not.
II Executive Summary – Operational Performance 24
Table 10 Time Required to Process Certification Applications Granted * Fiscal Year 2005-06
Total Certified Non-Construction Construction
Working Days (including adjourments Cumulative Cumulative Cumulative requested by the parties) Number Percent Number Percent Number Percent
Total 352 100.0 210 100.0 142 100.0
Under 8 days .............. 1 0.3 0 0.0 1 0.7 8-14 days ................. 55 15.9 0 0.0 55 39.4 15-21 days ................ 96 43.2 84 40.0 12 47.9 22-28 days ................ 54 58.5 40 59.0 14 57.7 29-35 days ................ 31 67.3 24 70.5 7 62.7 36-42 days ................ 16 71.9 13 76.7 3 64.8 43-49 days ................ 13 75.6 9 81.0 4 67.6 50-56 days ................ 15 79.8 9 85.2 6 71.8 57-63 days ................ 6 81.5 3 86.7 3 73.9 64-70 days ................ 5 83.0 1 87.1 4 76.8 71-77 days ................ 9 85.5 4 89.0 5 80.3 78-84 days ................ 3 86.4 1 89.5 2 81.7 85-91 days ................ 1 86.6 0 89.5 1 82.4 92-98 days ................ 2 87.2 0 89.5 2 83.8 99-105 days ............... 1 87.5 1 90.0 0 83.8
8 89.8 6 92.9 2 85.2 106-126 days ..............
127-147 days .............. 7 91.8 3 94.3 4 88.0 148-168 days .............. 2 92.3 1 94.8 1 88.7 Over 168 days ............. 27 11100.0 100.0 16 100.0
* Refers only to applications in which certification was granted. This table should not be confused with Table 6
which refers to all certification applications disposed of during the year regardless of the method of disposition.

Table 11 Employment Status of Employee in Bargaining Units Certified by Industry Fiscal Year 2005-06 All Emplo yees Full-time & No Exclusion Industry All Units Full-time Part-time Part-time Specified
Number Empls. Number Empls. Number Empls. Number Empls. Number Empls.
All Industries 352 14,449 5 207 1 4 1 37 345 14,201
Manufacturing 15 2,577 3 178 0 0 1 37 11 2,362
FABRICATED MET ALS 1 45 1 45 0 0 0 0 0 0 FOOD, BEVERAGES 8 966 1 92 0 0 0 0 7 874
WO OD 1 41 1 41 0 0 0 0 0 0
ING 1 37 0 0 0 0 1 37 0 0
ERY 1 64 0 0 0 0 0 0 1 64
PRINTING, PUBLISH
MACHIN
TETXTILES 1 1,182 0 0 0 0 0 0 1 1,182
OTHER MANUFACTURING 2 242 0 0 0 0 0 0 2 242
Non-Manufacturing 337 11,872 2 29 1 4 0 0 334 11,839
ACCOMODATION, FOOD SERVICES 3 209 0 0 0 0 0 0 3 209
CONSTRUCTION 136 1,032 0 0 0 0 0 0 136 1,032
ELECTRIC, GAS, WATER 1 9 0 0 0 0 0 0 1 9
FINANCE, INSURANCE CARRIERS 1 4 0 0 1 4 0 0 0 0
HEALTH, WELFARE SERVICES 16 660 0 0 0 0 0 0 16 660
HOSPITAL 1 30 0 0 0 0 0 0 1 30ENT 2 15 1 4 0 0 0 0 1 11
PAL 2 68 0 0 0 0 0 0 2 68
CES 2 61 0 0 0 0 0 0 2 61
CES 1 10 0 0 0 0 0 0 1 10
ADE 2 31 1 25 0 0 0 0 1 6
LOCAL GOVERNM
MUNICI
PERSONAL SERVI
RECREATIONAL SERVI
RETAIL TR
SCHOOL BOARD 1 10 0 0 0 0 0 0 1 10
TRANSPORTATION 9 1,032 0 0 0 0 0 0 9 1,032
OTHER SERVICES 123 6,733 0 0 0 0 0 0 123 6,733
OTHER NON-MANUFACTURING 37 1,968 0 0 0 0 0 0 37 1,968
II Executive Sum
mary –
Operational Perform
ance 25

Table 12 Employment Status of Employees in Bargaining Units Certified by Union Fiscal Year 2005-06 All Emplo yees Full-time & No Exclusion All Units Full-time Part-time Part-time Specified Number Empls. Number Empls. Number Empls. Number Empls. Number Empls.
All Unions 352 14,449 5 207 1 4 1 37 345 14,201
AUTO WORKERS 3 620 0 0 0 0 0 0 3 620BOILERMAK ERS 3 25 0 0 0 0 0 0 3 25
AL 2 4 0 0 0 0 0 0 2 4
ERS 7 55 0 0 0 0 0 0 7 55EES 1 2 0 0 0 0 0 0 1 2
BREWERY AND SOFT DRINK WORKERS 10 159 0 0 0 0 0 0 10 159BRICKLAYERS INTERNATION CANADIAN AUTO WORKERS 26 2,729 2 70 0 0 0 0 24 2,659CANADIAN UNION OF PUBLIC EMPLOYEES (CUPE) 19 999 1 4 0 0 0 0 18 995
CARPENTERS 26 186 0 0 0 0 0 0 26 186
CHRISTIAN LABOUR ASSOCIATION 7 254 0 0 0 0 0 0 7 254
CLOTHING AND TEXTILE WORKERS 7 650 0 0 0 0 0 0 7 650
COMMUNICATIONS, ENERGY AND PAPERWORKERS UNION OF CANADA
7 443 0 0 0 0 1 37 6 406
ELECTRICAL WORKERS (IBEW) 14 162 0 0 0 0 0 0 14 162FOOD AND COMMERCIAL WORKERS 21 1,055 0 0 0 0 0 0 21 1,055FOOD AND SERVICE WORKERS 7 157 0 0 0 0 0 0 7 157INDEPENDENT LOCAL UNION 1 128 0 0 0 0 0 0 1 128INTERNATIONAL OPERATING ENGINEERS 7 36 0 0 0 0 0 0 7 36LABOURERS 80 903 0 0 0 0 0 0 80 903MACHINISTS 3 53 1 41 0 0 0 0 2 12OFFICE AND PROFESSIONAL EMPLOYEES 1 4 0 0 1 4 0 0 0 0ONTARIO NURSES ASSOCIATION 5 57 0 0 0 0 0 0 5 57
ONTARIO PUBLIC SERVICE EMPLOYEES 8 387 0 0 0 0 0 0 8 387PAINTERS 17 299 0 0 0 0 0 0 17 299
PLUMB RETAIL WHOLESALE EMPLOY
SERVICE EMPLOYEES INTERNATIONAL 17 1,558 0 0 0 0 0 0 17 1,558SHEET METAL WORKERS 4 31 0 0 0 0 0 0 4 31STRUCTURAL IRON WORKERS 7 34 0 0 0 0 0 0 7 34TEACHERS FEDERATION 3 170 0 0 0 0 0 0 3 170TEAMSTERS 18 1,233 1 92 0 0 0 0 17 1,141THEATRICAL STAGE EMPLOYEES 5 54 0 0 0 0 0 0 5 54UNITED STEELWORKERS 13 1,308 0 0 0 0 0 0 13 1,308
OTHER UNIONS, INCLUDING EMPLOYEE ASSOCIATIONS 3 694 0 0 0 0 0 0 3 694
II Executive Sum
mary –
Operational Perform
ance 26
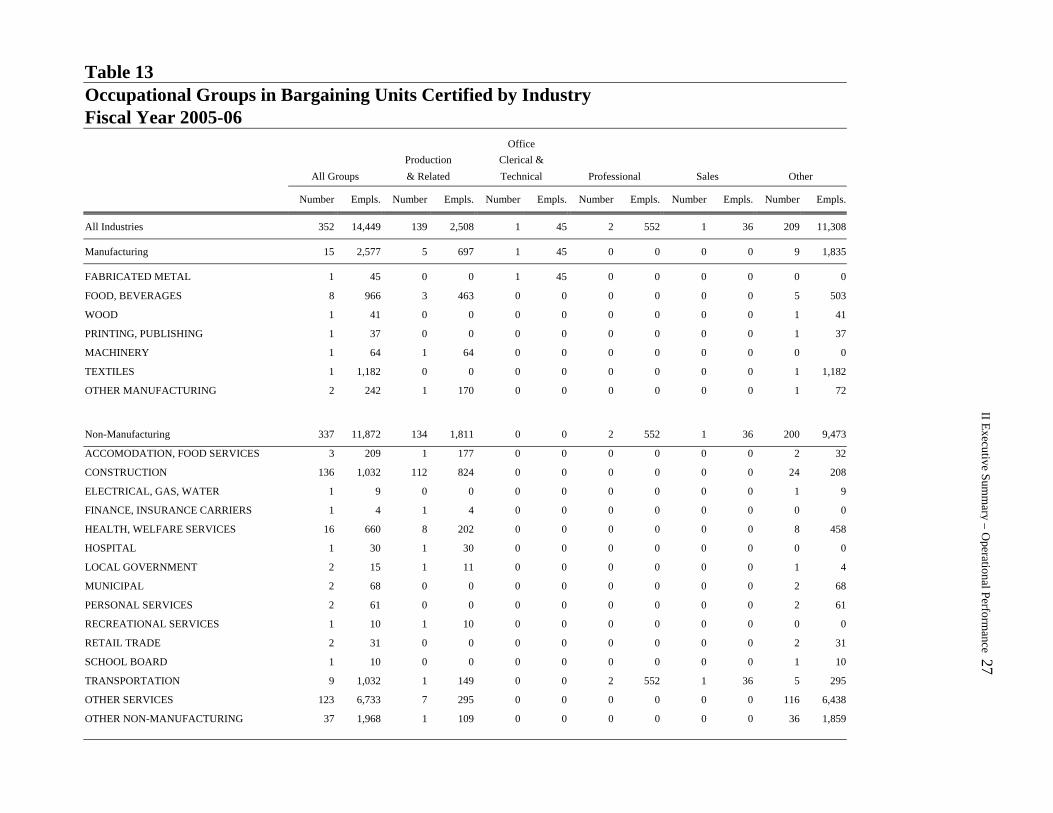
Table 13 Occupational Groups in Bargaining Units Certified by Industry Fiscal Year 2005-06 Off ice Production Clerical & All Groups & Related Technical Professional Sales Other
Number Empls. Number Empls. Number Empls. Number Empls. Number Empls. Number Empls.
All Industries 352 14,449 139 2,508 1 45 2 552 1 36 209 11,308
Manufacturing 15 2,577 5 697 1 45 0 0 0 0 9 1,835
FABRICATED MET AL 1 45 0 0 1 45 0 0 0 0 0 0
FOOD, BEVERAGES 8 966 3 463 0 0 0 0 0 0 5 503
WO OD 1 41 0 0 0 0 0 0 0 0 1 41
NG 1 37 0 0 0 0 0 0 0 0 1 37
RY 1 64 1 64 0 0 0 0 0 0 0 0
PRINTING, PUBLISHI
MACHINE
TEXTILES 1 1,182 0 0 0 0 0 0 0 0 1 1,182
OTHER MANUFACTURING 2 242 1 170 0 0 0 0 0 0 1 72
Non-Manufacturing 337 11,872 134 1,811 0 0 2 552 1 36 200 9,473
ACCOMODATION, FOOD SERVICES 3 209 1 177 0 0 0 0 0 0 2 32
CONSTRUCTION 136 1,032 112 824 0 0 0 0 0 0 24 208
ELECTRICAL, GAS, WATER 1 9 0 0 0 0 0 0 0 0 1 9
FINANCE, INSURANCE CARRIERS 1 4 1 4 0 0 0 0 0 0 0 0
HEALTH, WELFARE SERVICES 16 660 8 202 0 0 0 0 0 0 8 458
HOSPIT AL 1 30 1 30 0 0 0 0 0 0 0 0
NT 2 15 1 11 0 0 0 0 0 0 1 4
AL 2 68 0 0 0 0 0 0 0 0 2 68
ES 2 61 0 0 0 0 0 0 0 0 2 61
ES 1 10 1 10 0 0 0 0 0 0 0 0
DE 2 31 0 0 0 0 0 0 0 0 2 31
LOCAL GOVERNME
MUNICIP
PERSONAL SERVIC
RECREATIONAL SERVIC
RETAIL TRA
SCHOOL BOARD 1 10 0 0 0 0 0 0 0 0 1 10
TRANSPORTATION 9 1,032 1 149 0 0 2 552 1 36 5 295
OTHER SERVICES 123 6,733 7 295 0 0 0 0 0 0 116 6,438
OTHER NON-MANUFACTURING 37 1,968 1 109 0 0 0 0 0 0 36 1,859
II Executive Sum
mary –
Operational Perform
ance 27

Table 14 Occupational Groups in Bargaining Units Certified by Union Fiscal Year 2005-06 Of fice Production Clerical & All Groups & Related Technical Professional Sales Other
Number Empls. Number Empls. Number Empls. Number Empls. Number Empls. Number Empls.
All Unions 352 14,449 139 2,508 1 45 2 552 1 36 209 11,308
AUTO WORKE RS 3 620 1 64 0 0 0 0 0 0 2 556
BREWERY AND SOFT DRINK WORKE RS
RS 10 159 1 11 0 0 0 0 0 0 93 25 3 25 0 0 0 0 0 0 0 0
AL 2 4 2 4 0 0 0 0 0 0 0 05 0 0 1 36 20
0 0 0 0 0 0 170 0 0 0 0 0 1 11
RS 7 650 0 0 0 0 0 0 0 0 70 0 0 0 0 0 40 0 0 0 0 0 6
0 0 0 0 0 0 5 33
0 0 0 0 0 0 18
0 0 0 0 0 0 7
ON 1 128 0 0 0 0 0 0 0 0 1
RS 7 36 2 5 0 0 0 0 0 0 5 31
0 0 0 0 0 0 33
3 53 0 0 0 0 0 0 0 0 3 53
ES 1 4 1 4 0 0 0 0 0 0 0 0
ON 5 57 2 20 0 0 0 0 0 0 3 37
ES 8 387 1 43 0 0 0 0 0 0 7
0 0 0 0 0 0 5 15
7 55 6 48 0 0 0 0 0 0 1 7
ES 1 2 0 0 0 0 0 0 0 0 1 2
0 0 0 0 0 0 11
RS 4 31 1 4 0 0 0 0 0 0 3 27
RS 7 34 5 24 0 0 0 0 0 0 2 10
ON 3 170 0 0 0 0 0 0 0 0 3
RS 18 233 1 92 0 0 0 0 0 0 17
ES 5 54 1 10 0 0 0 0 0 0 4 44
NS 3 694 0 0 0 0 0 0 0 0 3
148 BOILERMAKE BRICKLAYERS INTERNATION CANADIAN AUTO WORKERS 26 2,729 4 315 1 4 2,333 CANADIAN UNION OF PUBLIC EMPLOYEES (CUPE) 19 999 2 45 954 CARPENTERS 26 186 25 175 CLOTHING AND TEXTILE WORKE 650 CHRISTIAN LABOUR ASSOCIATION 7 254 3 101 153 COMMUNICATIONS, ENERGY AND PAPERWORKERS UNION OF CANADA 7 443 1 109 334
ELECTRICAL WORKERS (IBEW) 14 162 9 129
FOOD AND COMMERCIAL WORKERS 21 1,055 3 548 507
FOOD AND SERVICE WORKERS 7 157 0 0 157
INDEPENDENT LOCAL UNI 128
INTERNATIONAL OPERATING ENGINEE
LABOURERS 80 903 47 200 703
MACHINISTS
OFFICE AND PROFESSIONAL EMPLOYE
ONTARIO NURSES ASSOCIATI
ONTARIO PUBLIC SERVICE EMPLOYE 344
PAINTERS 17 299 12 284
PLUMBERS
RETAIL WHOLESALE EMPLOYE
SERVICE EMPLOYEES INTERNATIONAL 17 1,558 6 248 1,310
SHEET METAL WORKE
STRUCTURAL IRON WORKE
TEACHERS FEDERATI 170
TEAMSTE 1, 1,141
THEATRICAL STAGE EMPLOYE
UNITED STEELWORKERS 13 1,308 0 0 0 0 2 552 0 0 11 756
OTHER UNIONS, INCLUDING EMPLOYEE ASSOCIATIO 694
II Executive Sum
mary –
Operational Perform
ance 28

II Executive Summ
ary – Operational Perform
ance 29
Table 15 CERTIFICATION CASES TO VOTE, WITH APPLICATION DATES BETWEEN
APRIL 1, 2005 AND MARCH 31, 2006
Number of Cases Number of Days between application date and date vote held
Under Over 5 5 6 7 8 9 10 11-15 16-20 20 TotalFiscal 05/06
Industrial 2 240 6 6 4 1 0 1 0 00 19 23 7 0 1 0 1 1 0
260Construction 52
Total 2 259 29 13 4 2 0 2 1 0 312
Percentage of Cases Number of Days between Application date and date vote held
Under Over 5 5 6 7 8 9 10 11-15 16-20 20
Industrial 0.77% 92.31% 2.31% 2.31% 1.54% 0.38% 0.00% 0.38% 0.00% 0.00% Construction 0.00% 36.54% 44.23% 13.46% 0.00% 1.92% 0.00% 1.92% 1.92% 0.00%
Summary
Percentages of votes held within 5 days or less 7 days or less 10 days or less
Industrial 93.08% 97.69% 99.62% Construction 36.54% 94.23% 96.15%

II Executive Summ
ary – Operational Perform
ance 30
New Certification Applications ReceivedBy Quarter, April 1, 1998 to March 31, 2006
0
50
100
150
200
250
300
T1 T2 T3 T4 T1 T2 T3 T4 T1 T2 T3 T4 T1 T2 T3 T4 T1 T2 T3 T4 T1 T2 T3 T4 T1 T2 T3 T4 T1 T2 T3 T4 T1 T2 T3 T4
97/98 98/99 99/00 00/01 01/02 02/03 03/04 04/05 05/06
Quarter
# A
pplic
atio
ns16A

II Executive Summary – Operational Performance 31
NEW CERTIFICATION APPLICATIONS RECEIVED
By Quarter, April 1, 1998 to March 31, 2006
Fiscal Year 1st 2nd 3rd 4th TOTAL 97/98 180 178 197 178 733 98/99 192 167 170 163 692 99/00 155 152 127 266 700 00/01 186 190 202 272 850 01/02 215 155 128 127 625 02/03 168 163 166 161 658 03/04 158 151 141 281 731 04/05 237 185 160 157 739 05/06 134 192 153 152 631
TOTAL 1625 1533 1444 1757 6359

Table 17 II Executive Sum
mary –
Operational Perform
ance 32
TERMINATION CASES TO VOTE, WITH APPLICATION DATES BETWEEN APRIL 1, 2005 AND MARCH 31, 2006
Number of Cases
Number of Days between application date and date vote held Under Over 5 5 6 7 8 9 10 11-15 16-20 20 TotalFiscal 04/05 0 42 9 5 1 0 0 1 2 0 60
Percentage of Cases Number of Days between Application date and date vote held
Under Over 5 5 6 7 8 9 10 11-15 16-20 20 0.00% 70.00% 15.00% 8.33% 1.67% 0.00% 0.00% 1.67% 3.33% 0.00%
Summary Percentages of votes held within
5 days or less 7 days or less 10 days or less 70% 93% 95%

New Termination Applications ReceivedBy Quarter, April 1, 1998 to March 31, 2006
0
10
20
30
40
50
60
70
80
T1 T2 T3 T4 T1 T2 T3 T4 T1 T2 T3 T4 T1 T2 T3 T4 T1 T2 T3 T4 T1 T2 T3 T4 T1 T2 T3 T4 T1 T2 T3 T4 T1 T2 T3 T4
97/98 98/99 99/00 00/01 01/02 02/03 03/04 04/05 05/06
Quarter
No.
of A
pplic
atio
ns18A
II Executive Summ
ary – Operational Perform
ance 33
II Executive Summary – Operational Performance 34
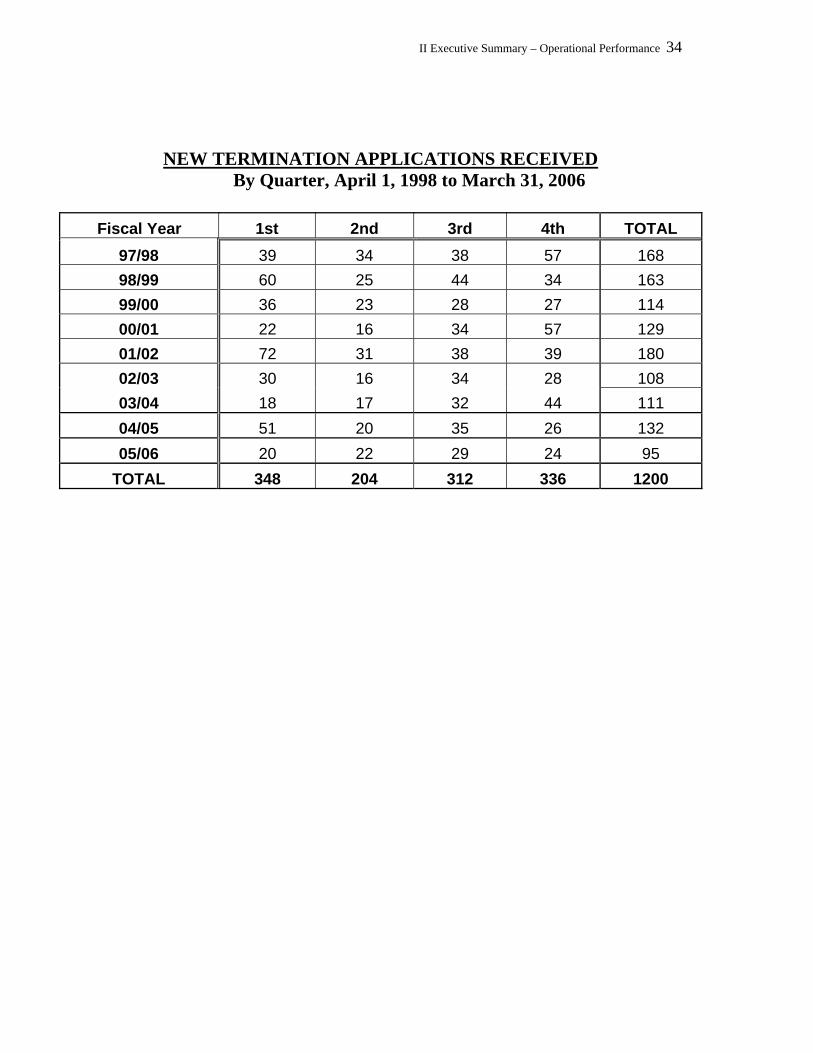
NEW TERMINATION APPLICATIONS RECEIVED
By Quarter, April 1, 1998 to March 31, 2006
Fiscal Year 1st 2nd 3rd 4th TOTAL 97/98 39 34 38 57 168 98/99 60 25 44 34 163 99/00 36 23 28 27 114 00/01 22 16 34 57 129 01/02 72 31 38 39 180 02/03 30 16 34 28 108 03/04 18 17 32 44 111 04/05 51 20 35 26 132
20 22 29 24 95 05/06 TOTAL 348 204 312 336 1200

II Executive Sum
mary – O
perational Performance 35
New Unfair Labour Practice Applications ReceivedBy Quarter, April 1, 1998 to March 31, 2006
0
50
100
150
200
250
300
350
400
450
T1 T2 T3 T4 T1 T2 T3 T4 T1 T2 T3 T4 T1 T2 T3 T4 T1 T2 T3 T4 T1 T2 T3 T4 T1 T2 T3 T4 T1 T2 T3 T4 T1 T2 T3 T4
97/98 98/99 99/00 00/01 01/02 02/03 03/04 04/05 05/06
Quarter
No.
of A
pplic
atio
ns
19A
II Executive Summary – Operational Performance 36
NEW UNFAIR LABOUR PRACTICE APPLICATIONS RECEIVED By Quarter, April 1, 1998 to March 31, 2006
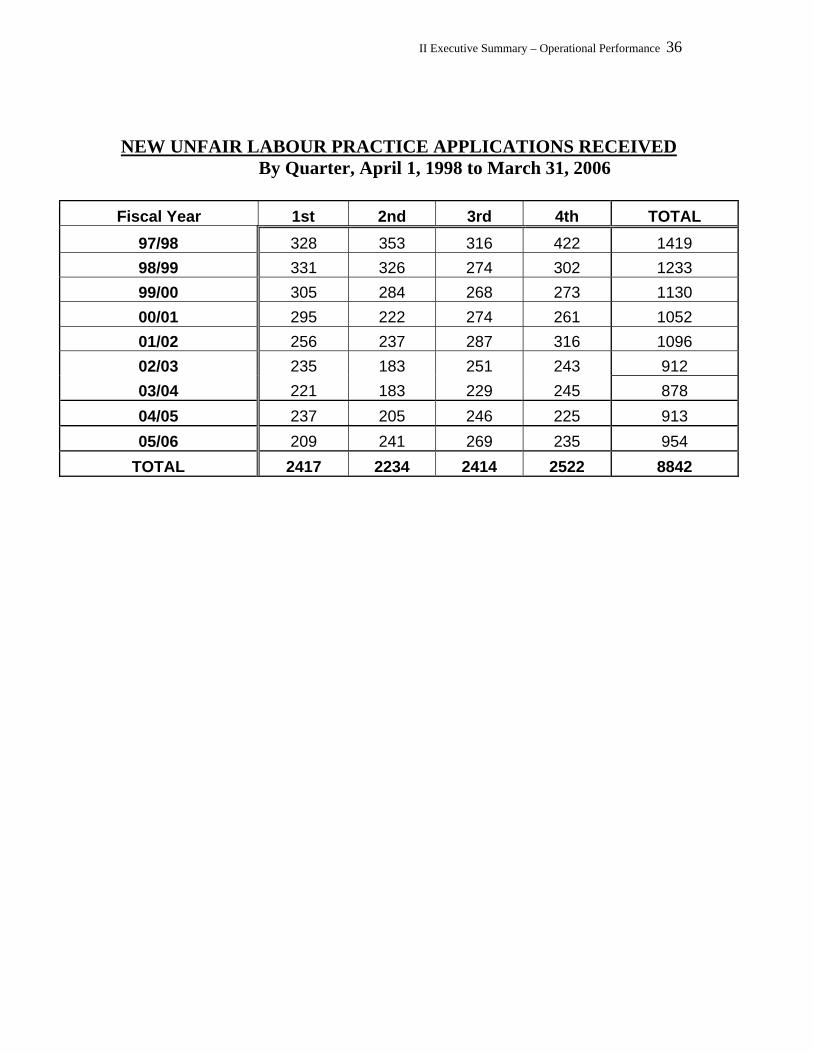
Fiscal Year 1st 2nd 3rd 4th TOTAL
97/98 328 353 316 422 1419 98/99 331 326 274 302 1233 99/00 305 284 268 273 1130 00/01 295 222 274 261 1052 01/02 256 237 287 316 1096 02/03 235 183 251 243 912 03/04 221 183 229 245 878 04/05 237 205 246 225 913 05/06 209 241 269 235 954
TOTAL 2417 2234 2414 2522 8842

New Construction Industry Grievances Applications Received
By Quarter, April 1, 1998 to March 31, 2006
0
50
100
150
200
250
300
350
T1 T2 T3 T4 T1 T2 T3 T4 T1 T2 T3 T4 T1 T2 T3 T4 T1 T2 T3 T4 T1 T2 T3 T4 T1 T2 T3 T4 T1 T2 T3 T4 T1 T2 T3 T4
97/98 98/99 99/00 00/01 01/02 02/03 03/04 04/05 05/06
No. of Applications
Qua
rter
20A II Executive Sum
mary – O
perational Performance 37
II Executive Summary – Operational Performance 38
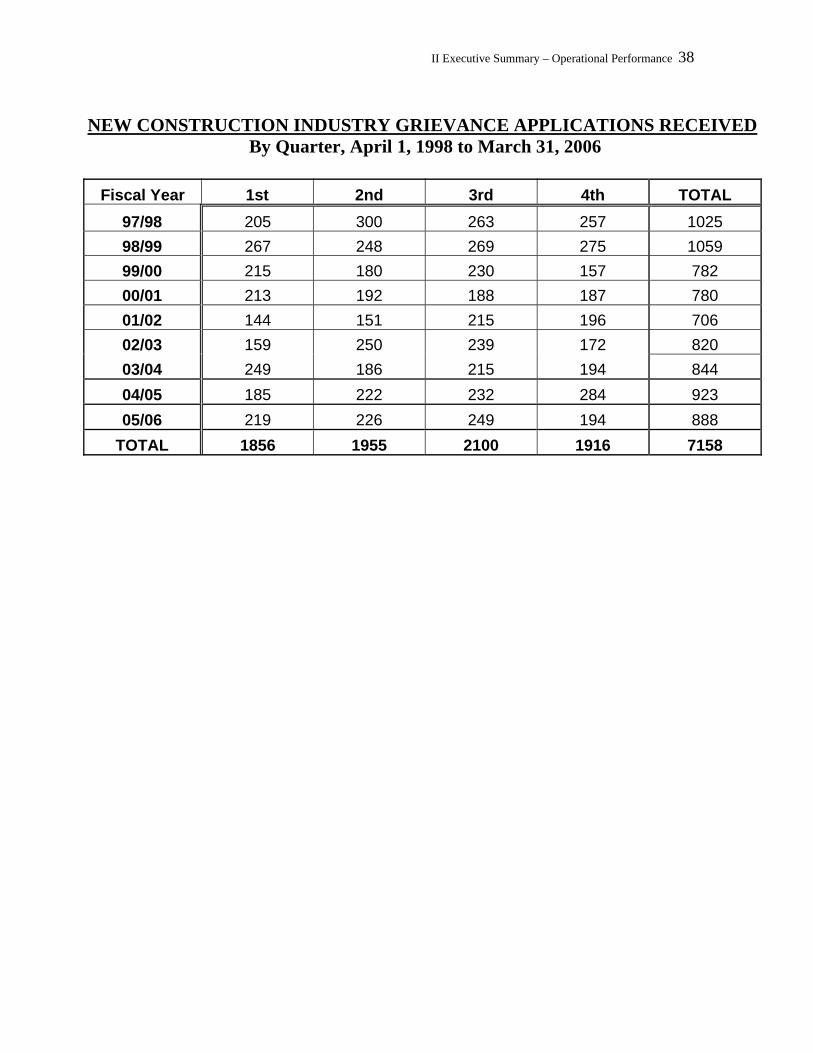
NEW CONSTRUCTION INDUSTRY GRIEVANCE APPLICATIONS RECEIVED By Quarter, April 1, 1998 to March 31, 2006
Fiscal Year 1st 2nd 3rd 4th TOTAL
97/98 205 300 263 257 1025 98/99 267 248 269 275 1059 99/00 215 180 230 157 782 00/01 213 192 188 187 780 01/02 144 151 215 196 706 02/03 159 250 239 172 820 03/04 249 186 215 194 844 04/05 185 222 232 284 923
219 226 249 194 888 05/06 TOTAL 1856 1955 2100 1916 7158

III OLRB – Measuring Performance – Achieving Goals | 39
OLRB Case Management Efficiencies 1996-2006 Each year the Board undertakes an analysis of its case management efficiencies and reports back on its annual disposition costs. The analysis reviews the number of cases disposed of per FTE (full time employee) and the average annual cost per case calculations and compares the results against the previous fiscal years.
Average Annual Disposed Cases per FTE
34.6 35.3
38.9
35.9
40.9
37.939.4
34.536.0
41.6
10.0
15.0
20.0
25.0
30.0
35.0
40.0
1996-97
1997-98
1998-99
1999-00
2000-01
2001-02
2002-03
2003-04
2004-05
2005-06
Fiscal Year
Num
ber o
f Cas
es
Average Annual Disposition Cost per Case
$2,002$2,193
$2,496$2,343
$2,056
$2,682$2,528
$2,277 $2,365 $2,425
$1,000
$2,000
$3,000
$4,000
1996-97 1997-98 1998-99 1999-00 2000-01 2001-02 2002-03 2003-04 2004-05 2005-06
Fiscal Year
Ave
rage
Ann
ual C
ost
OLRB Annual Report 2005 – 2006 2005-2006 OLRB Performance Measures

III OLRB – Measuring Performance – Achieving Goals | 40
III OLRB – Measuring Performance – Achieving Goals Each year the OLRB provides a broad accountability of progress achieved on our core performance measures. We take each of our goals and track progress on a series of performance measures designed to assess whether the Board is measuring up to corporate standards and program targets/commitments.
Measure Standard / Target
2005-2006 Commitments
2005-2006 Achievements
Fiscal Measures: % variance between year end allocation expenditure
Less than 2% variance between year end allocation and expenditure
Less than 2% variance between year end allocation and expenditure
Actual: Exceeded commitment + 2.2% variance Approved budget = 11,968.9 Actual expenditure = 11, 689.7
Program Effectiveness Measures: Meeting legislated time lines
90% Industrial cert. votes held within 5-7 days. 95% held within 7-10 days 5% or less held within more than 10 days
90% cert. votes held within 5-7 days. 95% held within 7-10 days 5% or less held within more than 10 days
Actual: Exceeded commitment 93.1% of votes held within 5-7 days or less 97.7% of votes held within 7-10 days or less 2.2 % of votes held in more than 10 days
% of LRA cases settled by mediation % of ES and HS appeal cases settled by mediation
80% of LRA cases settled through mediation ES cases = 70% HS cases = 70%
80% of LRA cases settled through mediation ES cases = 70% HS cases = 70%
Actual: *Exceeded commitment –avg. 85.3% *Based on completed case activity in certification/ unfair labour practices/grievances. Certs. - 567 of 661 ULPs – 772 of 910 Grievance Refs. – 809 of 905 Actual: Exceeded commitment ES – 73.0% (766 of 1046) HS – 91% (192 of 211) Actual: 100% - met commitment % of judicial
reviews upheld
100% of judicial reviews upheld Board decision
100% of judicial reviews upheld Board decision *Based on 21 disposed cases:
0 granted 16 dismissed, 3 abandoned * 2 stated cases for contempt allowed
OLRB Annual Report 2005 – 2006 2005-2006 OLRB Performance Measures
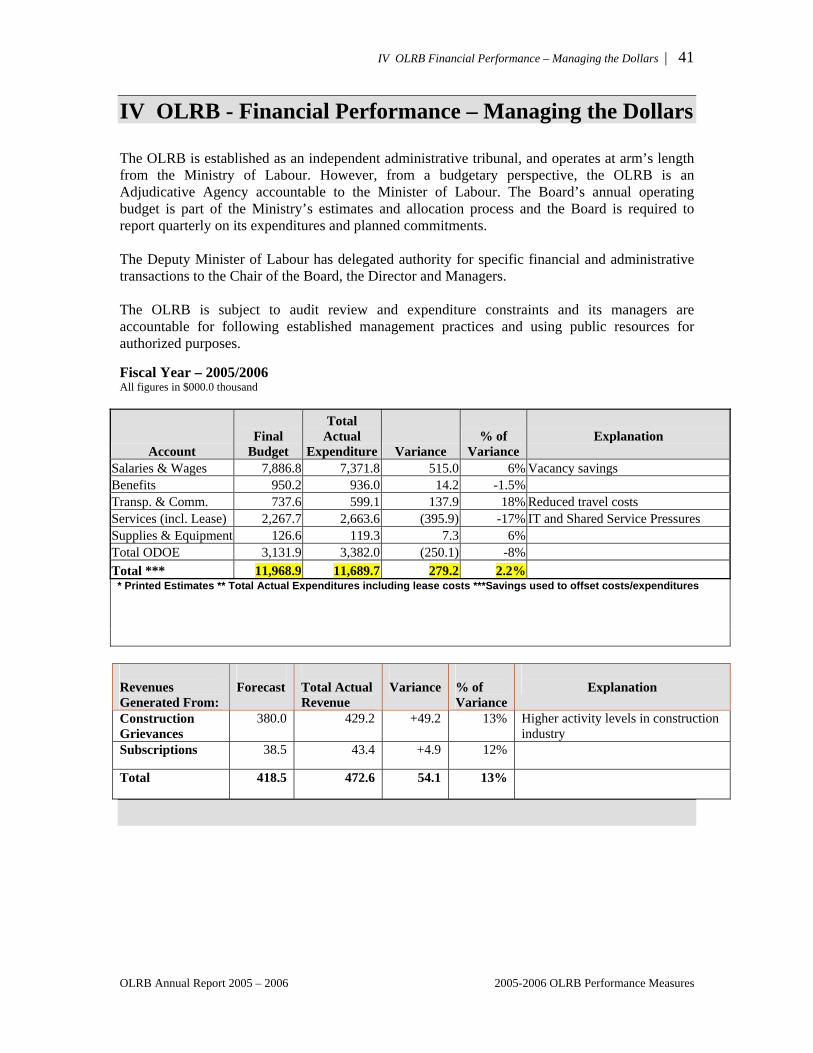
IV OLRB Financial Performance – Managing the Dollars | 41
IV OLRB - Financial Performance – Managing the Dollars The OLRB is established as an independent administrative tribunal, and operates at arm’s length from the Ministry of Labour. However, from a budgetary perspective, the OLRB is an Adjudicative Agency accountable to the Minister of Labour. The Board’s annual operating budget is part of the Ministry’s estimates and allocation process and the Board is required to report quarterly on its expenditures and planned commitments. The Deputy Minister of Labour has delegated authority for specific financial and administrative transactions to the Chair of the Board, the Director and Managers. The OLRB is subject to audit review and expenditure constraints and its managers are accountable for following established management practices and using public resources for authorized purposes. Fiscal Year – 2005/2006 All figures in $000.0 thousand
Account Final
Budget
Total Actual
Expenditure Variance % of
Variance Explanation
Salaries & Wages 7,886.8 7,371.8 515.0 6% Vacancy savings Benefits 950.2 936.0 14.2 -1.5% Transp. & Comm. 737.6 599.1 137.9 18% Reduced travel costs Services (incl. Lease) 2,267.7 2,663.6 (395.9) -17% IT and Shared Service Pressures Supplies & Equipment 126.6 119.3 7.3 6% Total ODOE 3,131.9 3,382.0 (250.1) -8% Total *** 11,968.9 11,689.7 279.2 2.2% * Printed Estimates ** Total Actual Expenditures including lease costs ***Savings used to offset costs/expenditures
Revenues Generated From:
Forecast
Total Actual Revenue
Variance
% of Variance
Explanation
Construction Grievances
380.0 429.2 +49.2 13% Higher activity levels in construction industry
Subscriptions 38.5 43.4 +4.9 12%
Total 418.5 472.6 54.1 13%
OLRB Annual Report 2005 – 2006 2005-2006 OLRB Performance Measures