oocyte donation; factors influencing the outcome
TRANSCRIPT
Oocyte Donation; Factors Oocyte Donation; Factors Influencing The OutcomeInfluencing The Outcome
Mustafa BAHÇECİ,M.DMustafa BAHÇECİ,M.DUlun ULUĞ, M.D.Ulun ULUĞ, M.D.
German Hospital and Bahceci Women Health German Hospital and Bahceci Women Health Care CenterCare Center
Istanbul, TurkeyIstanbul, Turkey
First pregnancy with donated oocyte (Lutjen et First pregnancy with donated oocyte (Lutjen et al, 1984)al, 1984)
Oocyte donation was performed in almost 10% Oocyte donation was performed in almost 10% of all ART cycles carried out in US (CDC report, of all ART cycles carried out in US (CDC report, 1999)1999)
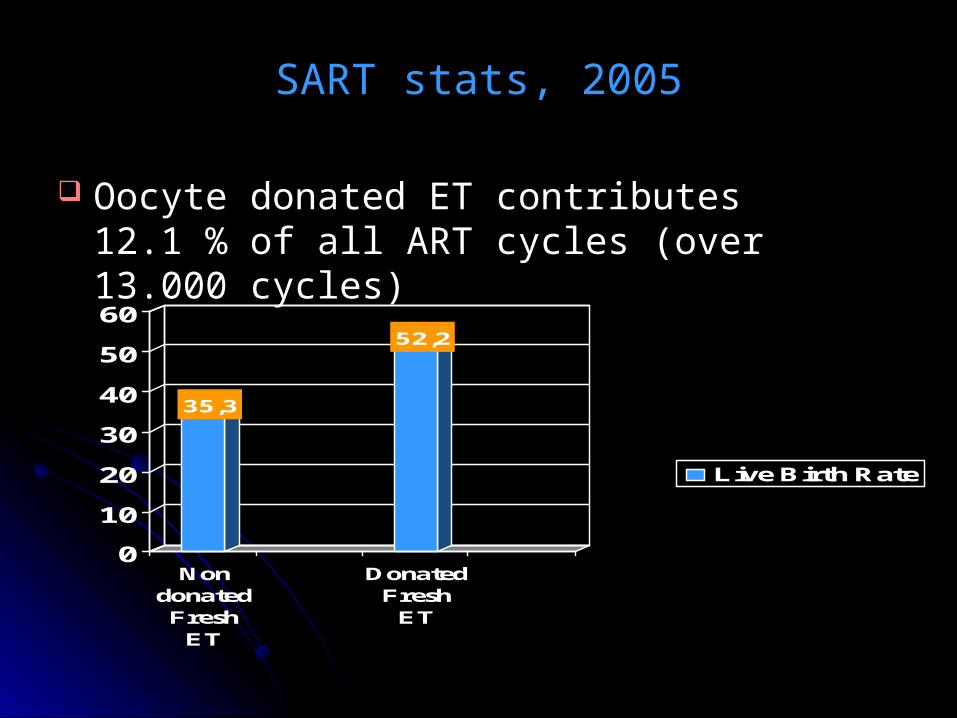
SART stats, 2005SART stats, 2005
Oocyte donated ET contributes 12.1 % of Oocyte donated ET contributes 12.1 % of all ART cycles (over 13.000 cycles)all ART cycles (over 13.000 cycles)
35,3
52,2
0
10
20
30
40
50
60
NondonatedFresh
ET
DonatedFresh
ET
Live Birth Rate
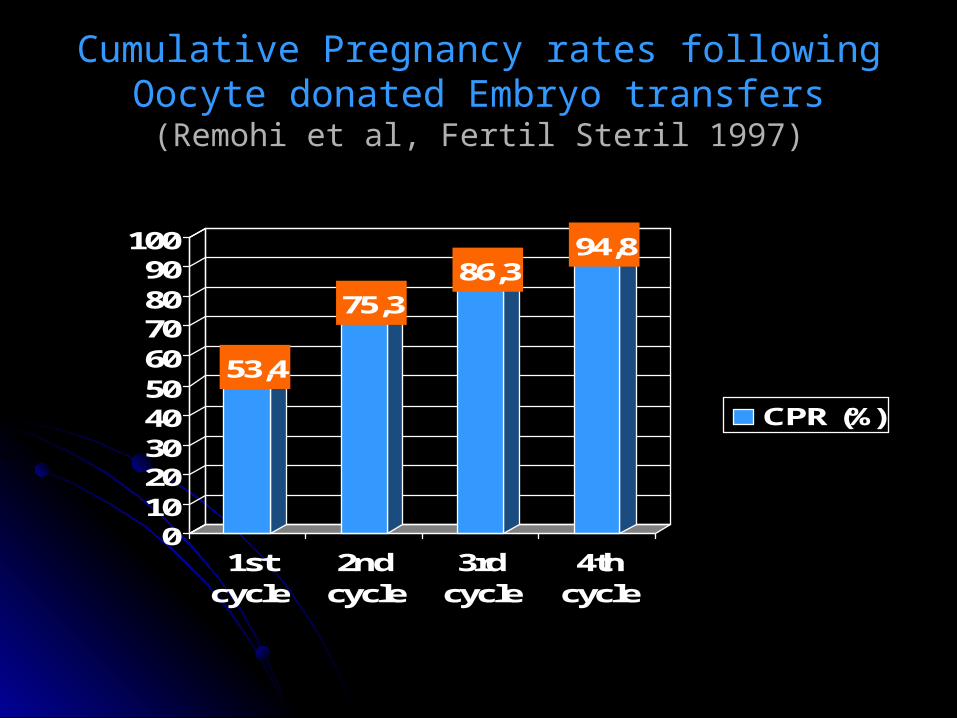
Cumulative Pregnancy rates following Oocyte Cumulative Pregnancy rates following Oocyte donated Embryo transfersdonated Embryo transfers
(Remohi et al, Fertil Steril 1997)(Remohi et al, Fertil Steril 1997)
53,4
75,386,3
94,8
0102030405060708090
100
1stcycle
2ndcycle
3rdcycle
4thcycle
CPR (%)
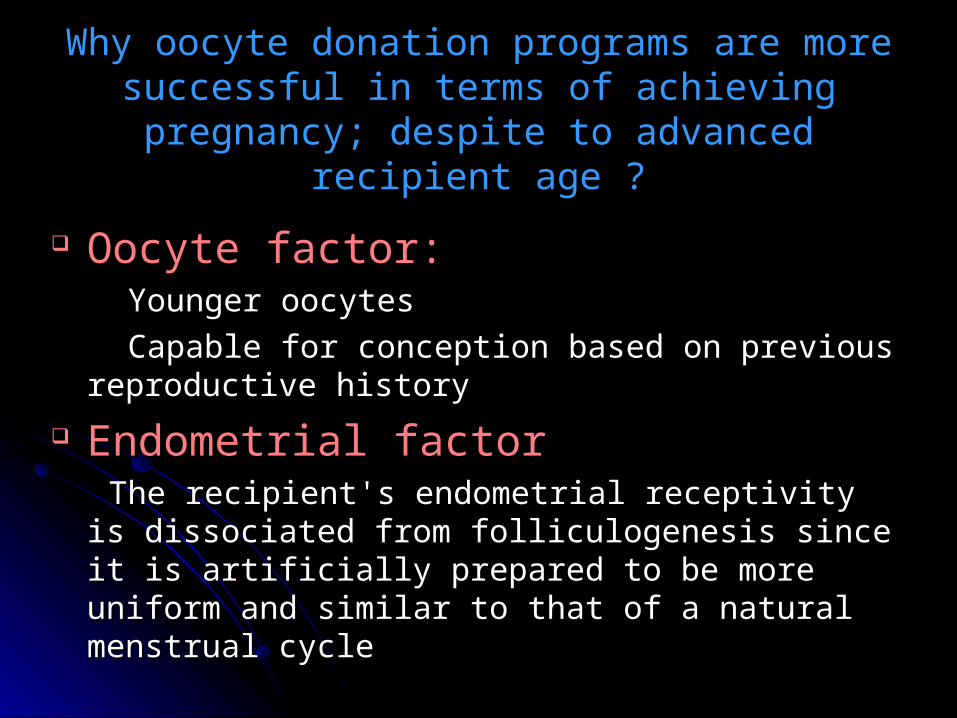
Why oocyte donation programs are more Why oocyte donation programs are more successful in terms of achieving pregnancy; successful in terms of achieving pregnancy;
despite to advanced recipient age ?despite to advanced recipient age ?
Oocyte factor:Oocyte factor: Younger oocytesYounger oocytes
Capable for conception based on previous reproductive Capable for conception based on previous reproductive historyhistory
Endometrial factorEndometrial factor The recipient's endometrial receptivity is dissociated from The recipient's endometrial receptivity is dissociated from
folliculogenesis since it is artificially prepared to be more folliculogenesis since it is artificially prepared to be more uniform and similar to that of a natural menstrual cycleuniform and similar to that of a natural menstrual cycle
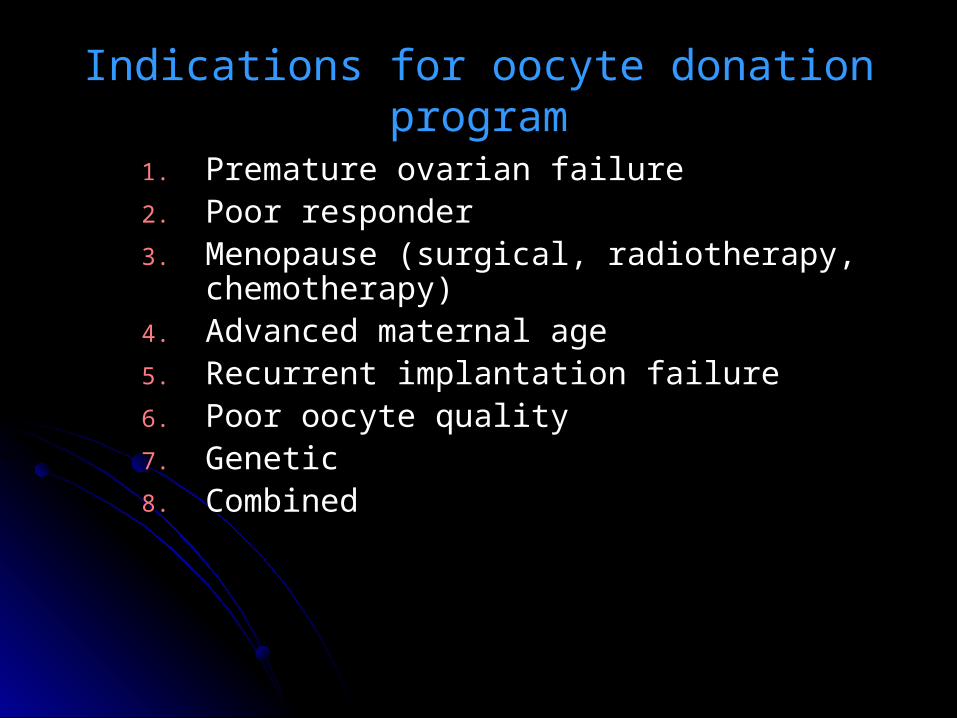
Indications for oocyte donation programIndications for oocyte donation program
1.1. Premature ovarian failurePremature ovarian failure2.2. Poor responderPoor responder3.3. Menopause (surgical, radiotherapy, chemotherapy)Menopause (surgical, radiotherapy, chemotherapy)4.4. Advanced maternal ageAdvanced maternal age5.5. Recurrent implantation failureRecurrent implantation failure6.6. Poor oocyte qualityPoor oocyte quality7.7. GeneticGenetic8.8. CombinedCombined
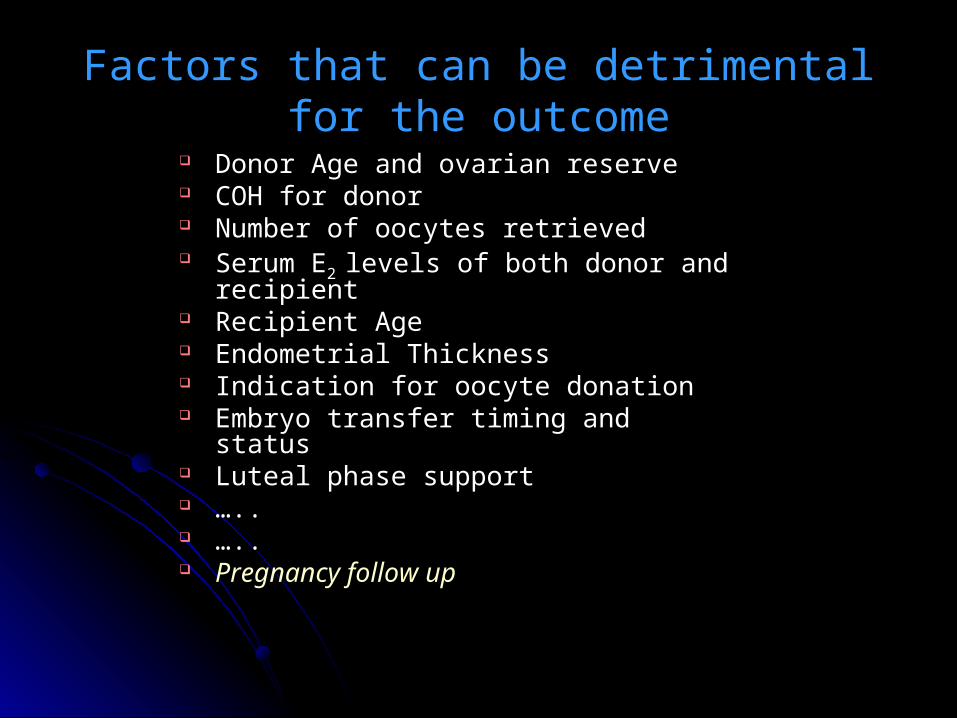
Factors that can be detrimental for the Factors that can be detrimental for the outcomeoutcome
Donor Age and ovarian reserveDonor Age and ovarian reserve COH for donorCOH for donor Number of oocytes retrievedNumber of oocytes retrieved Serum ESerum E2 2 levels of both donor and recipientlevels of both donor and recipient Recipient AgeRecipient Age Endometrial ThicknessEndometrial Thickness Indication for oocyte donationIndication for oocyte donation Embryo transfer timing and statusEmbryo transfer timing and status Luteal phase supportLuteal phase support …….... …….... Pregnancy follow upPregnancy follow up
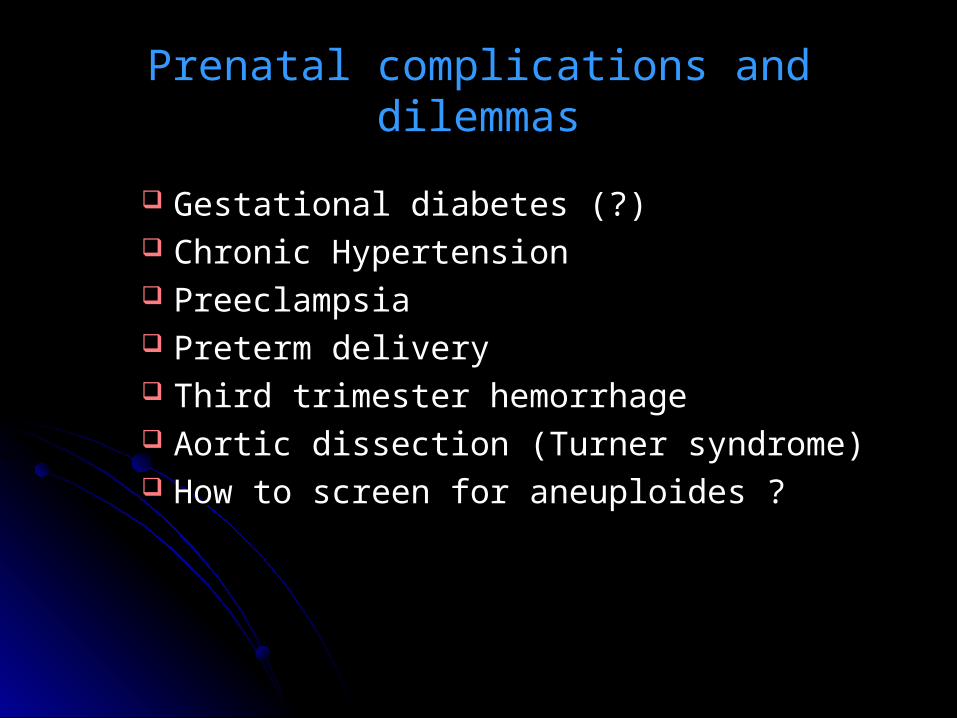
Prenatal complications and dilemmasPrenatal complications and dilemmas
Gestational diabetes (?)Gestational diabetes (?) Chronic HypertensionChronic Hypertension PreeclampsiaPreeclampsia Preterm deliveryPreterm delivery Third trimester hemorrhageThird trimester hemorrhage Aortic dissection (Turner syndrome)Aortic dissection (Turner syndrome) How to screen for aneuploides ?How to screen for aneuploides ?
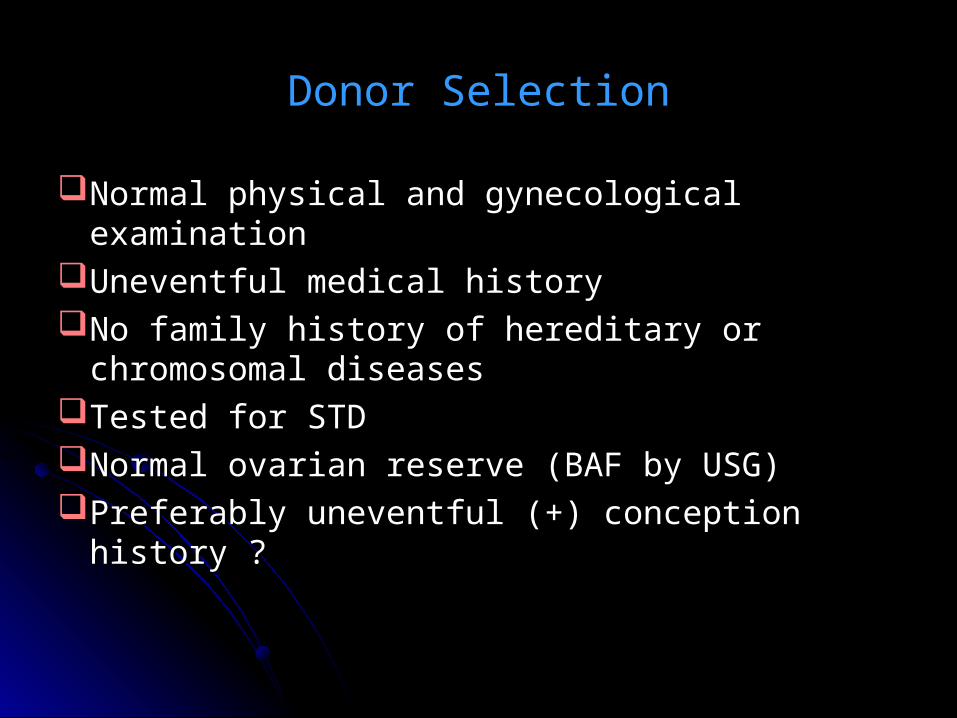
Donor SelectionDonor Selection
Normal physical and gynecological examinationNormal physical and gynecological examinationUneventful medical historyUneventful medical historyNo family history of hereditary or chromosomal No family history of hereditary or chromosomal
diseasesdiseasesTested for STDTested for STDNormal ovarian reserve (BAF by USG)Normal ovarian reserve (BAF by USG)Preferably uneventful (+) conception history ?Preferably uneventful (+) conception history ?
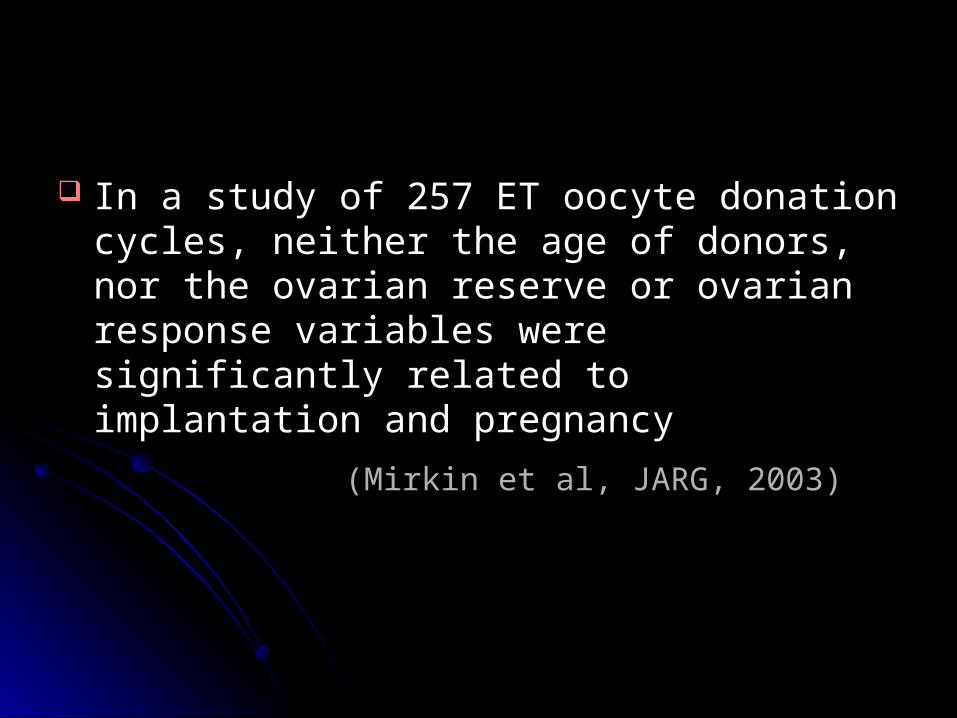
In a study of 257 ET oocyte donation cycles, In a study of 257 ET oocyte donation cycles, neither the age of donors, nor the ovarian neither the age of donors, nor the ovarian reserve or ovarian response variables were reserve or ovarian response variables were significantly related to implantation and significantly related to implantation and pregnancypregnancy
(Mirkin et al, JARG, 2003)(Mirkin et al, JARG, 2003)
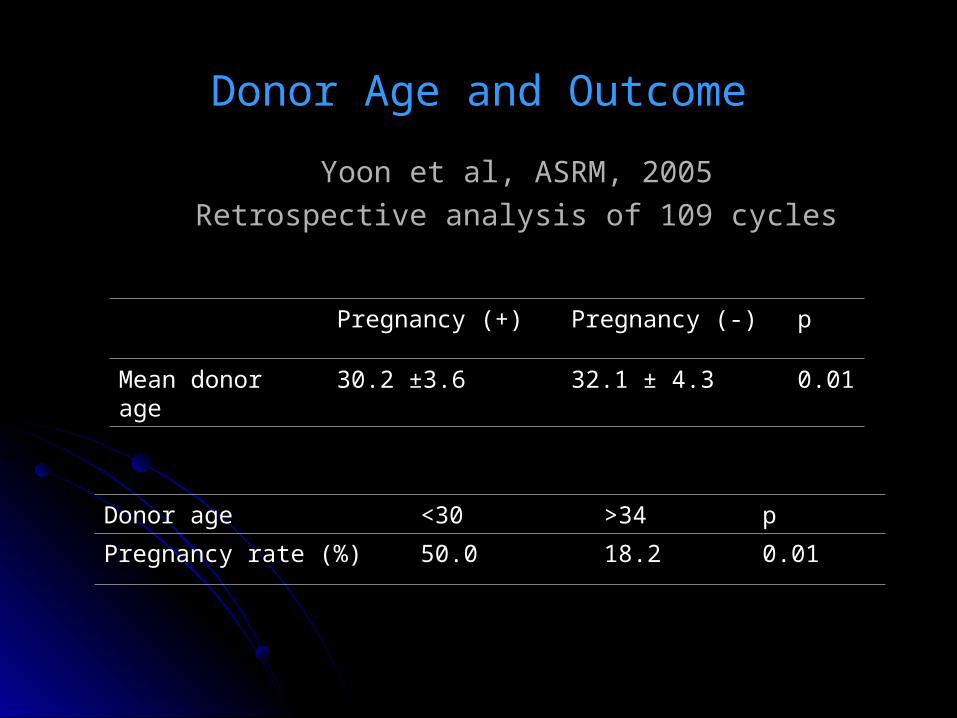
Donor Age and OutcomeDonor Age and Outcome
Yoon et al, ASRM, 2005Yoon et al, ASRM, 2005
Retrospective analysis of 109 cyclesRetrospective analysis of 109 cycles
Pregnancy (+)Pregnancy (+) Pregnancy (-)Pregnancy (-) pp
Mean donor ageMean donor age 30.2 30.2 ±±3.63.6 32.1 32.1 ±± 4.3 4.3 0.010.01
Donor ageDonor age <30<30 >34>34 pp
Pregnancy rate (%)Pregnancy rate (%) 50.050.0 18.2 18.2 0.010.01
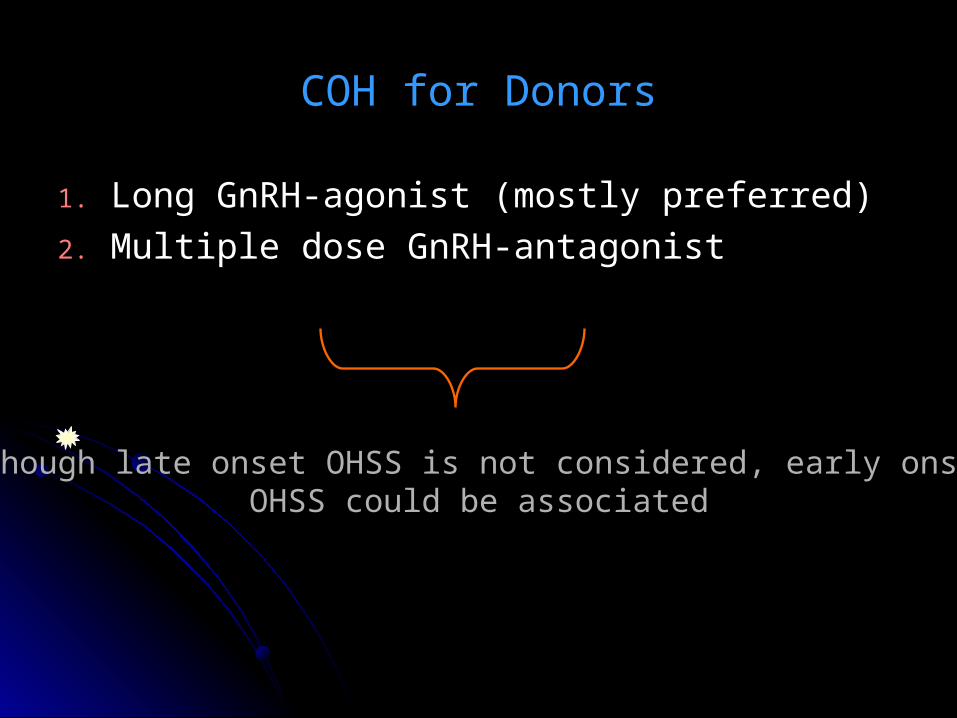
COH for DonorsCOH for Donors
1.1. Long GnRH-agonist (mostly preferred)Long GnRH-agonist (mostly preferred)
2.2. Multiple dose GnRH-antagonistMultiple dose GnRH-antagonist
Although late onset OHSS is not considered, early onset OHSS could be associated
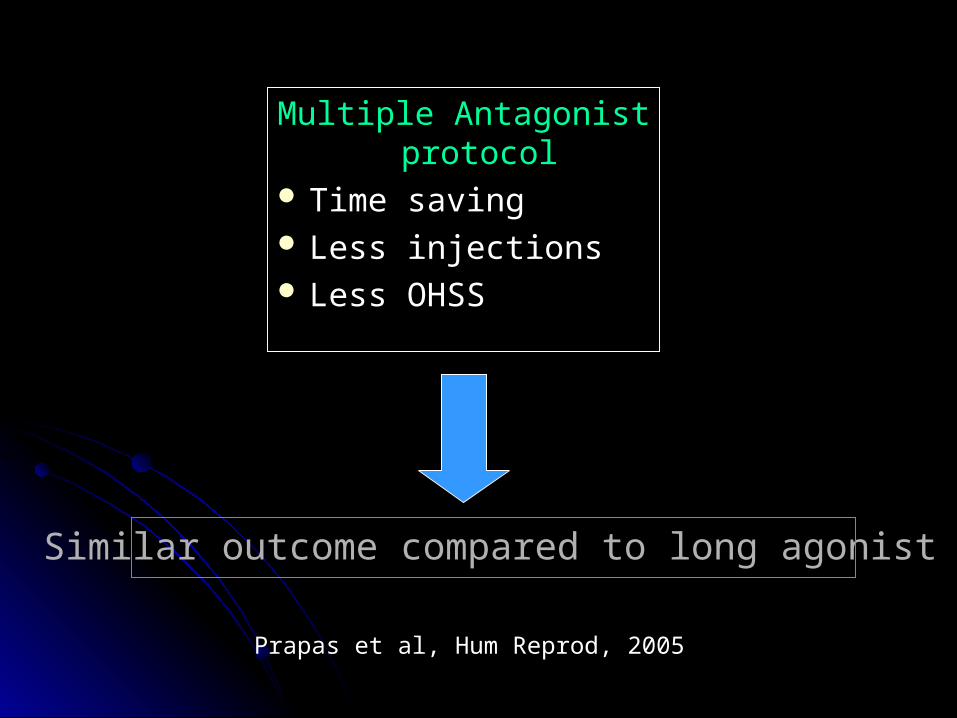
Multiple Antagonist Multiple Antagonist protocolprotocol
Time savingTime saving Less injectionsLess injections Less OHSSLess OHSS
Similar outcome compared to long agonist
Prapas et al, Hum Reprod, 2005
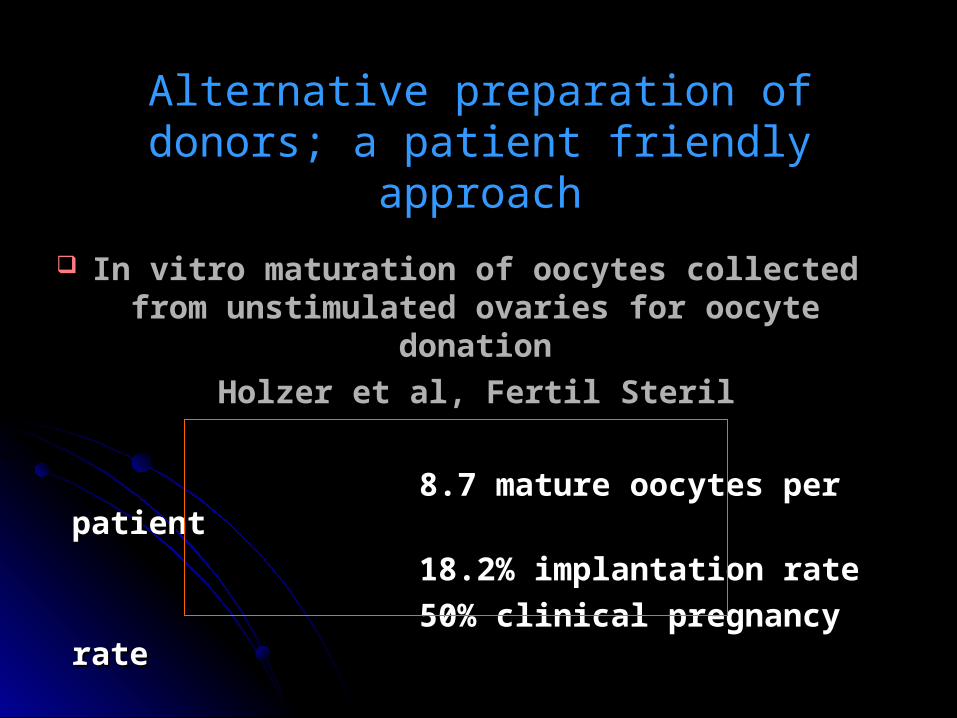
Alternative preparation of donors; a patient Alternative preparation of donors; a patient friendly approachfriendly approach
In vitro maturation of oocytes collected from In vitro maturation of oocytes collected from unstimulated ovaries for oocyte donationunstimulated ovaries for oocyte donation
Holzer et al, Fertil Steril Holzer et al, Fertil Steril
8.7 mature oocytes per patient8.7 mature oocytes per patient
18.2% implantation rate18.2% implantation rate
50% clinical pregnancy rate50% clinical pregnancy rate

Number of Oocytes Retrieved and pregnancyNumber of Oocytes Retrieved and pregnancy(Letterie et al, JARG 2005)(Letterie et al, JARG 2005)
Number of oocytesNumber of oocytes <5<5 6-106-10 11-1511-15 16-2016-20 21-2521-25 >25>25
PR (%)*PR (%)* 6767 5050 4444 5656 4949 6161
Cryopreservation (%)Cryopreservation (%) 00 5151 5555 5050 4242 6060
* Not significant (ANOVA)
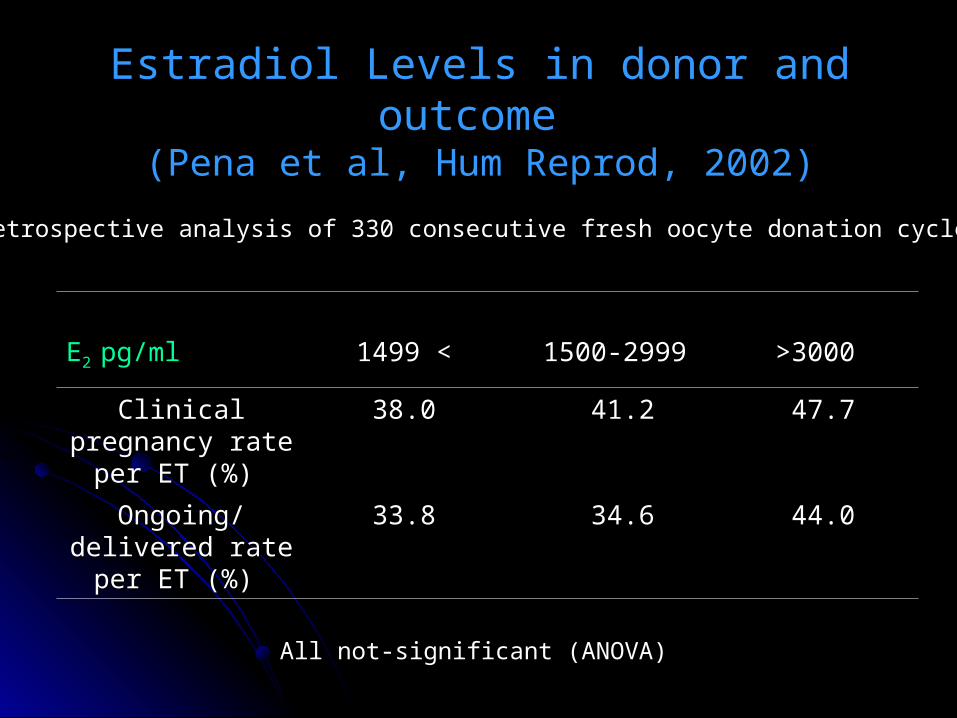
Estradiol Levels in donor and outcome Estradiol Levels in donor and outcome (Pena et al, Hum Reprod, 2002)(Pena et al, Hum Reprod, 2002)
EE2 2 pg/mlpg/ml 1499 < 1499 < 1500-2999 1500-2999 >3000 >3000
Clinical pregnancy Clinical pregnancy rate per ET (%) rate per ET (%)
38.0 38.0 41.2 41.2 47.7 47.7
Ongoing/delivered Ongoing/delivered rate per ET (%) rate per ET (%)
33.8 33.8 34.6 34.6 44.0 44.0
• Retrospective analysis of 330 consecutive fresh oocyte donation cycles
All not-significant (ANOVA)
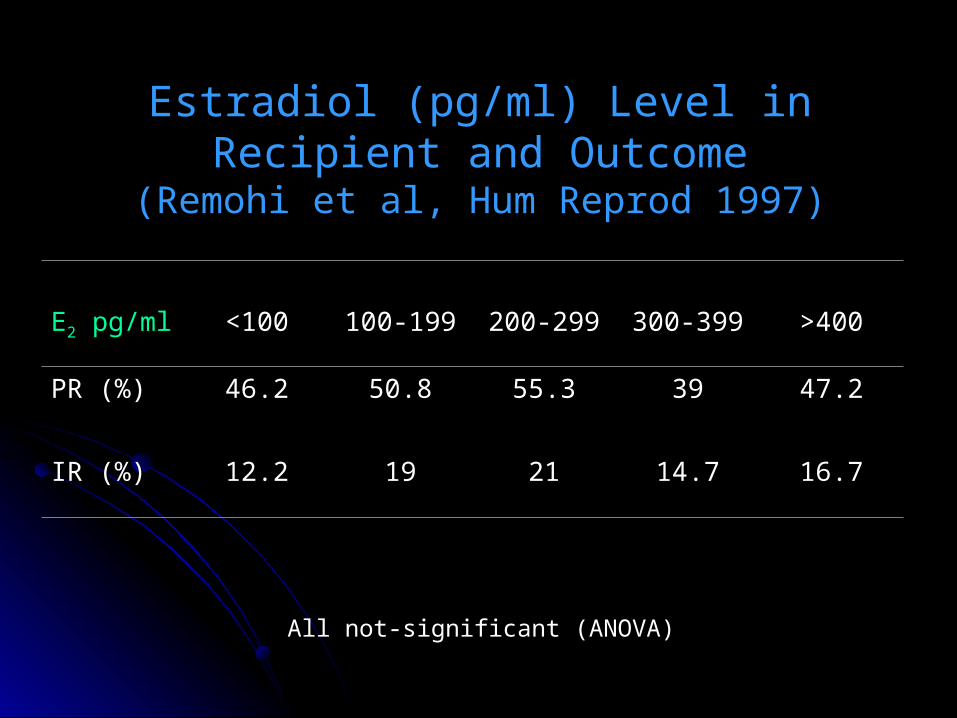
Estradiol (pg/ml) Level in Recipient and Estradiol (pg/ml) Level in Recipient and OutcomeOutcome
(Remohi et al, Hum Reprod 1997)(Remohi et al, Hum Reprod 1997)
EE22 pg/ml pg/ml <100<100 100-199100-199 200-299200-299 300-399300-399 >400>400
PR (%)PR (%) 46.246.2 50.850.8 55.355.3 3939 47.247.2
IR (%)IR (%) 12.212.2 1919 2121 14.714.7 16.716.7
All not-significant (ANOVA)
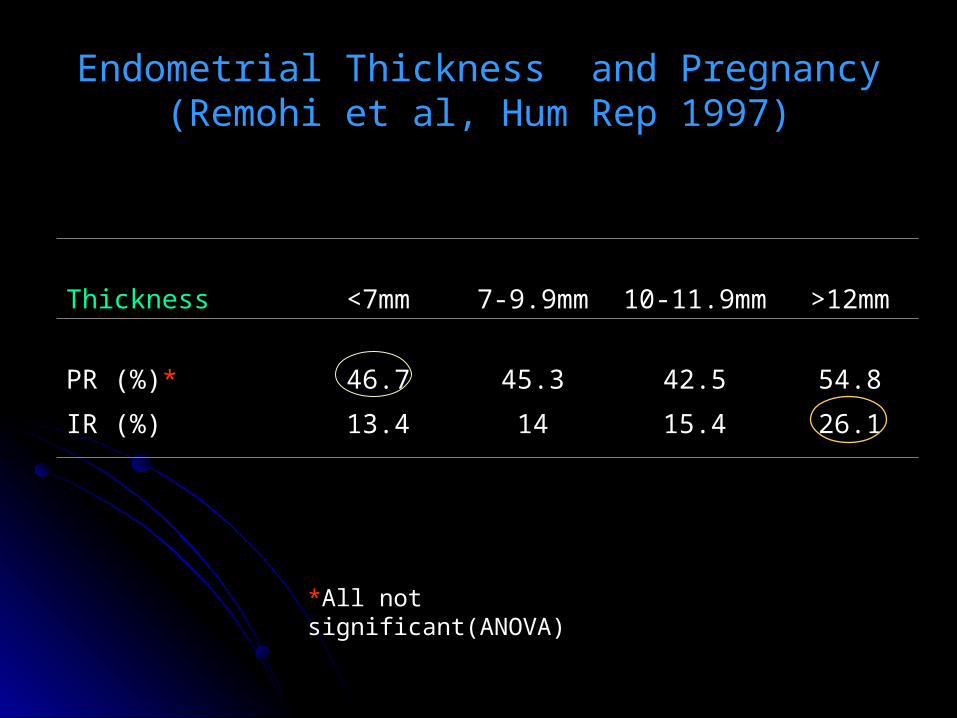
Endometrial Thickness and PregnancyEndometrial Thickness and Pregnancy(Remohi et al, Hum Rep 1997)(Remohi et al, Hum Rep 1997)
ThicknessThickness <7mm<7mm 7-9.9mm7-9.9mm 10-11.9mm10-11.9mm >12mm>12mm
PR (%)PR (%)** 46.746.7 45.345.3 42.542.5 54.854.8
IR (%)IR (%) 13.413.4 1414 15.415.4 26.126.1
**All not significant(ANOVA)

Endometrial Thickness and Implantation (2)Endometrial Thickness and Implantation (2)Remohi et alRemohi et al
There was a weak but significant correlation between endometrial thickness
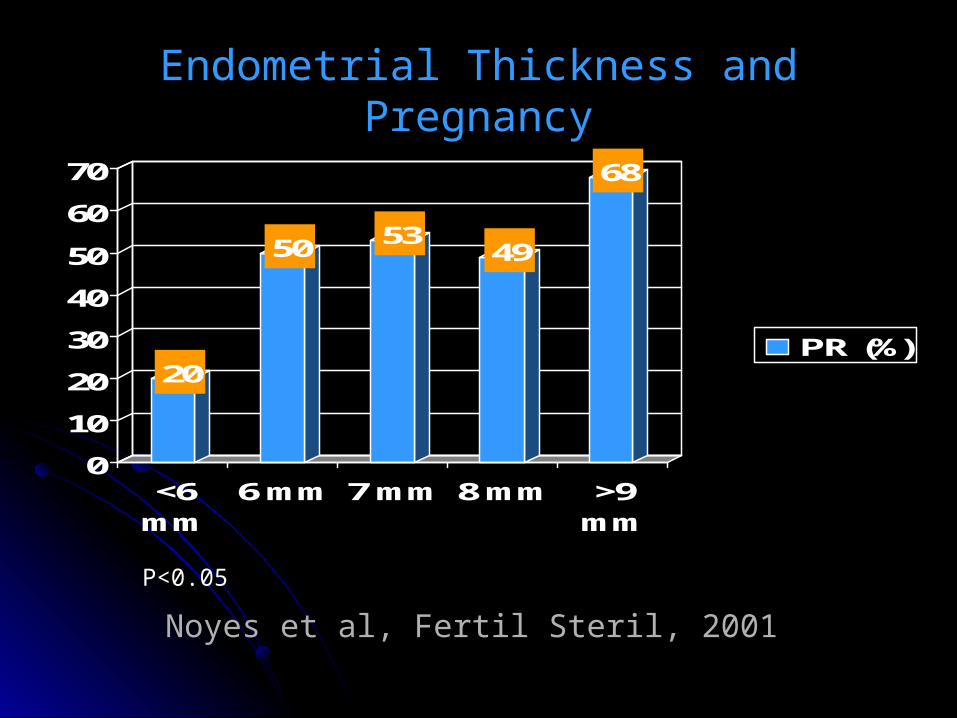
Endometrial Thickness and PregnancyEndometrial Thickness and Pregnancy
20
50 5349
68
0
10
20
30
40
50
60
70
<6mm
6 mm 7 mm 8 mm >9mm
PR (%)
Noyes et al, Fertil Steril, 2001
P<0.05
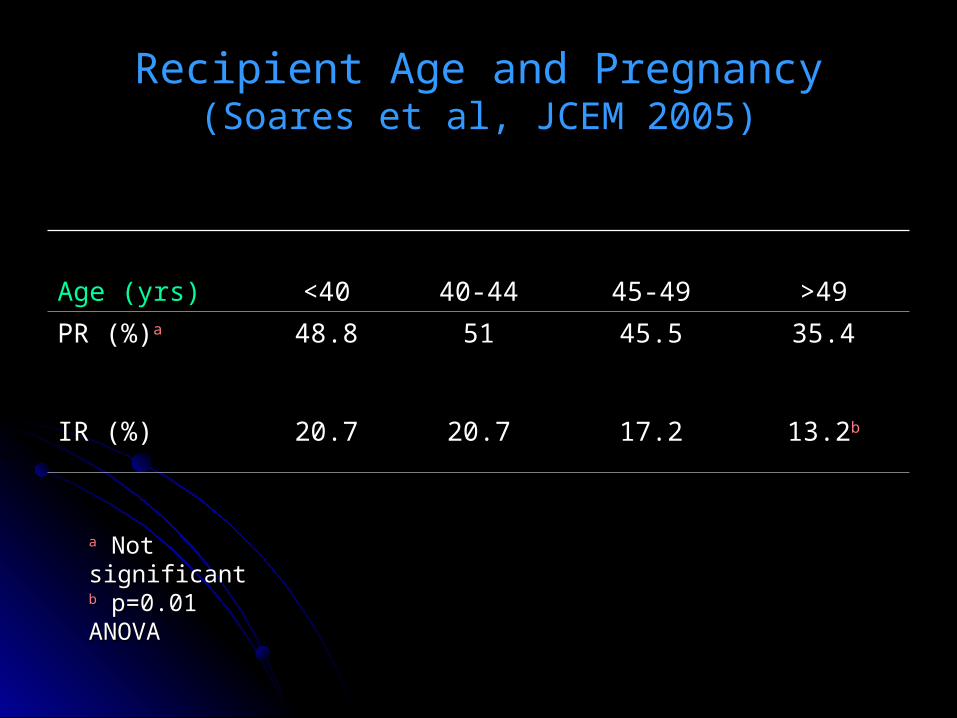
Recipient Age and PregnancyRecipient Age and Pregnancy(Soares et al, JCEM 2005)(Soares et al, JCEM 2005)
Age (yrs)Age (yrs) <40<40 40-4440-44 45-4945-49 >49>49
PR (%)PR (%)aa 48.848.8 5151 45.545.5 35.435.4
IR (%)IR (%) 20.720.7 20.720.7 17.217.2 13.213.2bb
aa Not significantNot significantbb p=0.01 p=0.01ANOVAANOVA

Recipient Age and Outcome (2)Recipient Age and Outcome (2)(Soares et al)(Soares et al)
Age Groups (yrs)Age Groups (yrs)
<45<45 ≥≥4545 pp
Implantation Rate Implantation Rate (%)(%)
20.720.7 16.816.8 0.020.02
Pregnancy Rate Pregnancy Rate (%)(%)
49.849.8 44.444.4 0.040.04
Miscarriage Rate Miscarriage Rate (%)(%)
16.816.8 23.323.3 0.030.03
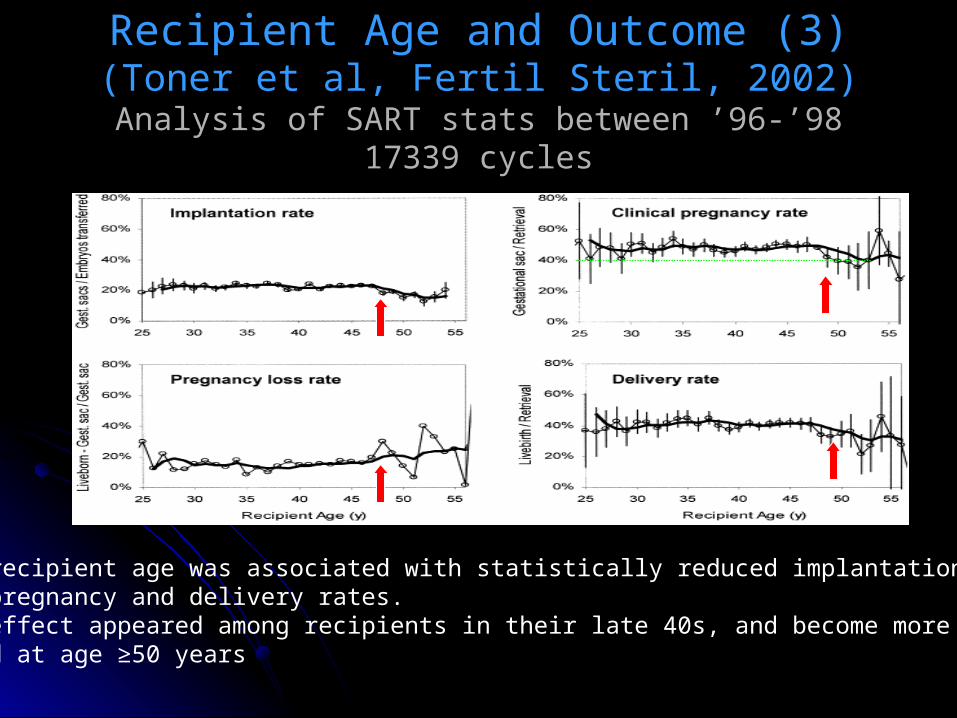
Recipient Age and Outcome (3)Recipient Age and Outcome (3)(Toner et al, Fertil Steril, 2002)(Toner et al, Fertil Steril, 2002)
Analysis of SART stats between ’96-’98Analysis of SART stats between ’96-’9817339 cycles17339 cycles
1. Older recipient age was associated with statistically reduced implantation, clinical pregnancy and delivery rates. 2. This effect appeared among recipients in their late 40s, and become more pronounced at age ≥50 years
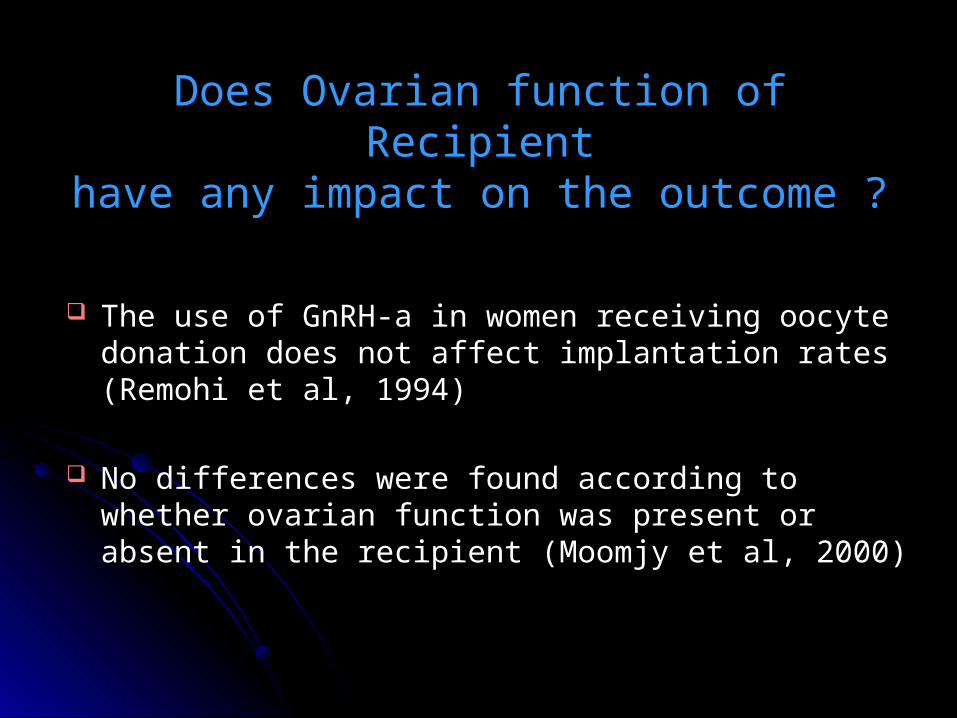
Does Ovarian function of RecipientDoes Ovarian function of Recipienthave any impact on the outcome ?have any impact on the outcome ?
The use of GnRH-a in women receiving oocyte donation The use of GnRH-a in women receiving oocyte donation does not affect implantation rates (Remohi et al, 1994)does not affect implantation rates (Remohi et al, 1994)
No differences were found according to whether ovarian No differences were found according to whether ovarian function was present or absent in the recipient (Moomjy function was present or absent in the recipient (Moomjy et al, 2000)et al, 2000)
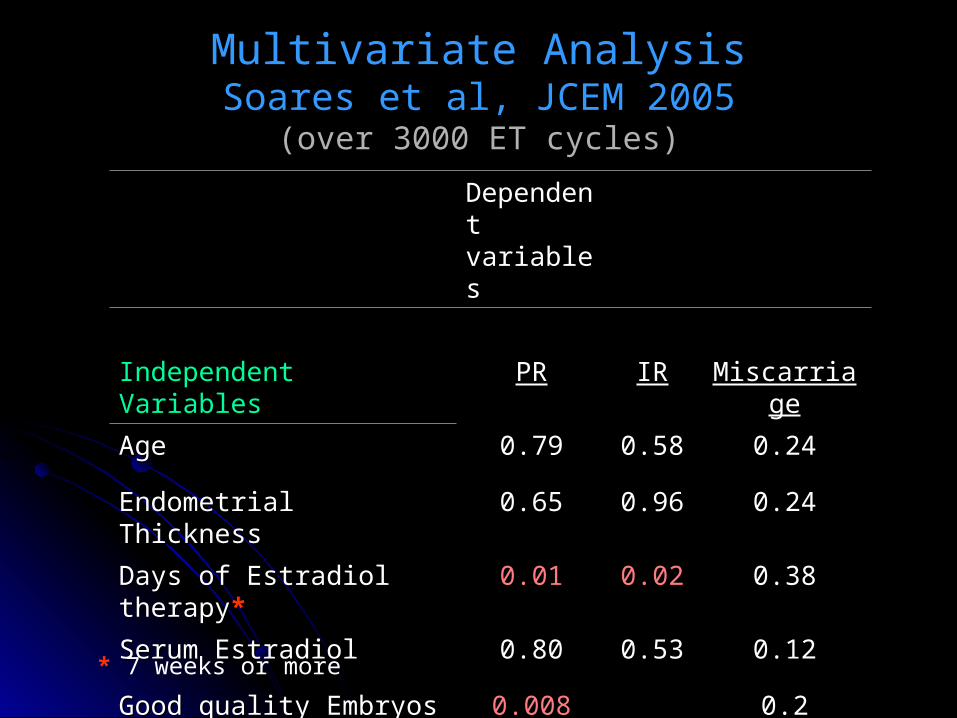
Multivariate AnalysisMultivariate AnalysisSoares et al, JCEM 2005Soares et al, JCEM 2005
(over 3000 ET cycles)(over 3000 ET cycles)
Dependent Dependent variablesvariables
Independent VariablesIndependent Variables PRPR IRIR MiscarriageMiscarriage
AgeAge 0.790.79 0.580.58 0.240.24
Endometrial ThicknessEndometrial Thickness 0.650.65 0.960.96 0.240.24
Days of Estradiol therapyDays of Estradiol therapy** 0.010.01 0.020.02 0.380.38
Serum EstradiolSerum Estradiol 0.800.80 0.530.53 0.120.12
Good quality EmbryosGood quality Embryos 0.0080.008 0.20.2
* 7 weeks or more
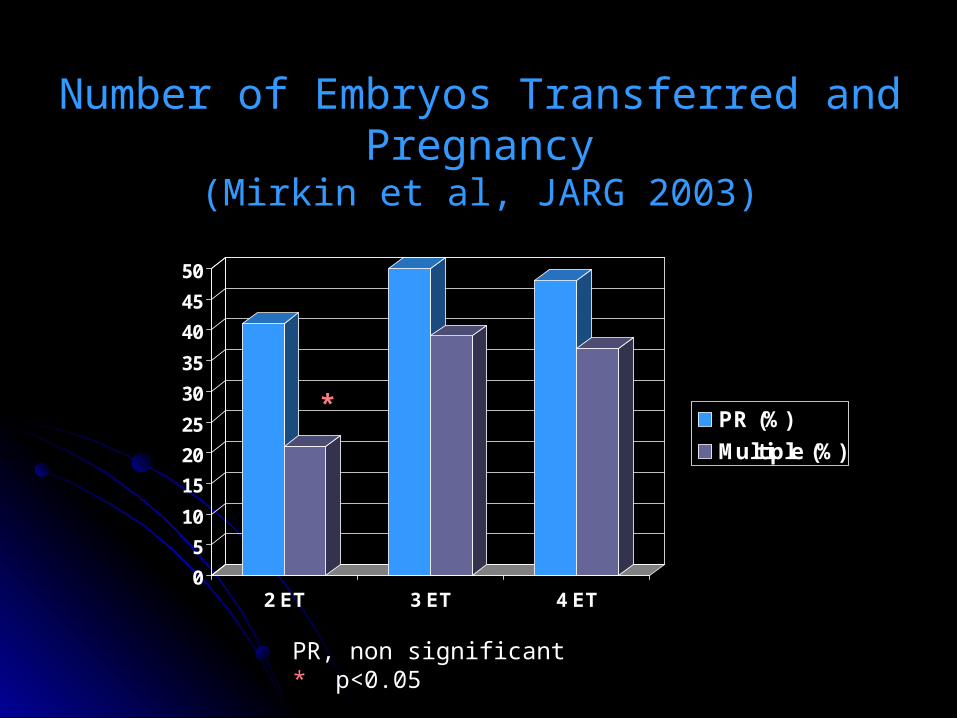
Number of Embryos Transferred and Number of Embryos Transferred and PregnancyPregnancy
(Mirkin et al, JARG 2003)(Mirkin et al, JARG 2003)
0
5
10
15
20
25
30
35
40
45
50
2 ET 3 ET 4 ET
PR (%)
Multiple (%)
*
PR, non significant* p<0.05

Single Embryo transfer in RecipientsSingle Embryo transfer in Recipients(Soderstrom-Antilla et al, Hum Reprod, 2003)(Soderstrom-Antilla et al, Hum Reprod, 2003)
Retrospective analysis of 127 oocyte donation cyclesRetrospective analysis of 127 oocyte donation cycles
No. of ETs No. of ETs Age of recipient Age of recipient woman woman
Clinical pregnancy Clinical pregnancy rate (%)rate (%)
Delivery Delivery rate (%) rate (%)
eSET eSET 49 49 33.4 ± 5.3 33.4 ± 5.3 40.8 40.8 32.6 32.6
DET DET 78 78 35.5 ± 4.4 35.5 ± 4.4 41.0 41.0 32.1 32.1
Almost 40% of all conceptions from oocyte donation were twin or high order pregnancies (ASRM/SART, Fertil Steril, 2004)
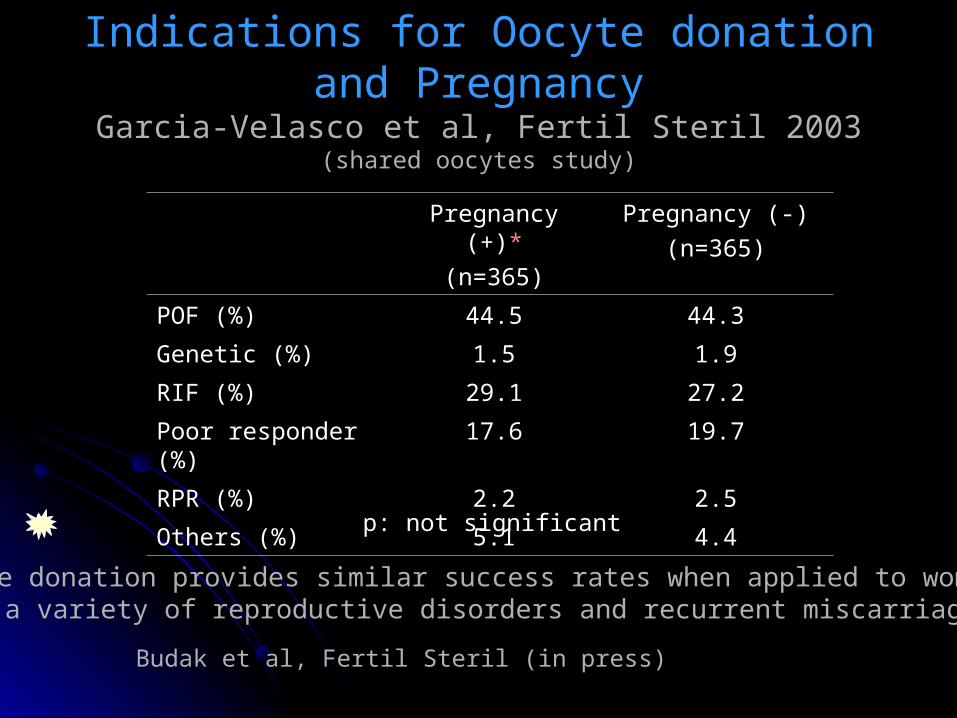
Indications for Oocyte donation and Indications for Oocyte donation and PregnancyPregnancy
Garcia-Velasco et al, Fertil Steril 2003Garcia-Velasco et al, Fertil Steril 2003(shared oocytes study)(shared oocytes study)
Pregnancy (+)Pregnancy (+)**
(n=365)(n=365)
Pregnancy (-)Pregnancy (-)
(n=365)(n=365)
POF (%)POF (%) 44.544.5 44.344.3
Genetic (%)Genetic (%) 1.51.5 1.91.9
RIF (%)RIF (%) 29.129.1 27.227.2
Poor responder (%)Poor responder (%) 17.617.6 19.719.7
RPR (%)RPR (%) 2.22.2 2.52.5
Others (%)Others (%) 5.15.1 4.44.4
p: not significant
Oocyte donation provides similar success rates when applied to women witha variety of reproductive disorders and recurrent miscarriages
Budak et al, Fertil Steril (in press)
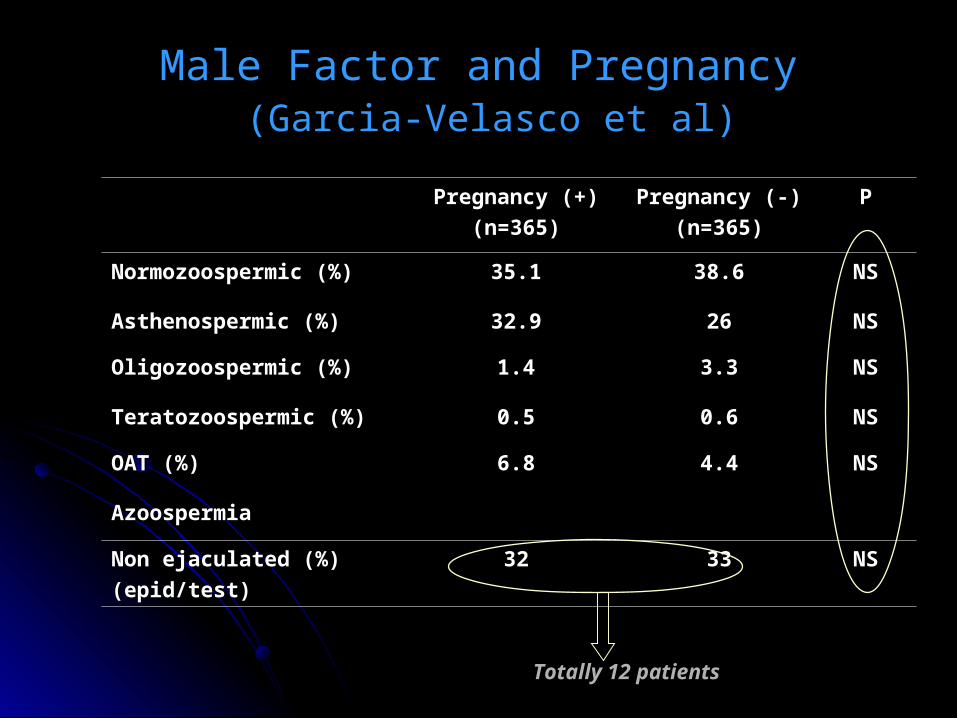
Male Factor and PregnancyMale Factor and Pregnancy (Garcia-Velasco et al)(Garcia-Velasco et al)
Pregnancy (+)Pregnancy (+)
(n=365)(n=365)
Pregnancy (-)Pregnancy (-)
(n=365)(n=365)
PP
Normozoospermic (%)Normozoospermic (%) 35.135.1 38.638.6 NSNS
Asthenospermic (%)Asthenospermic (%) 32.932.9 2626 NSNS
Oligozoospermic (%)Oligozoospermic (%) 1.41.4 3.33.3 NSNS
Teratozoospermic (%)Teratozoospermic (%) 0.50.5 0.60.6 NSNS
OAT (%)OAT (%) 6.86.8 4.44.4 NSNS
AzoospermiaAzoospermia
Non ejaculated (%)Non ejaculated (%)
(epid/test)(epid/test)
3232 3333 NSNS
Totally 12 patients
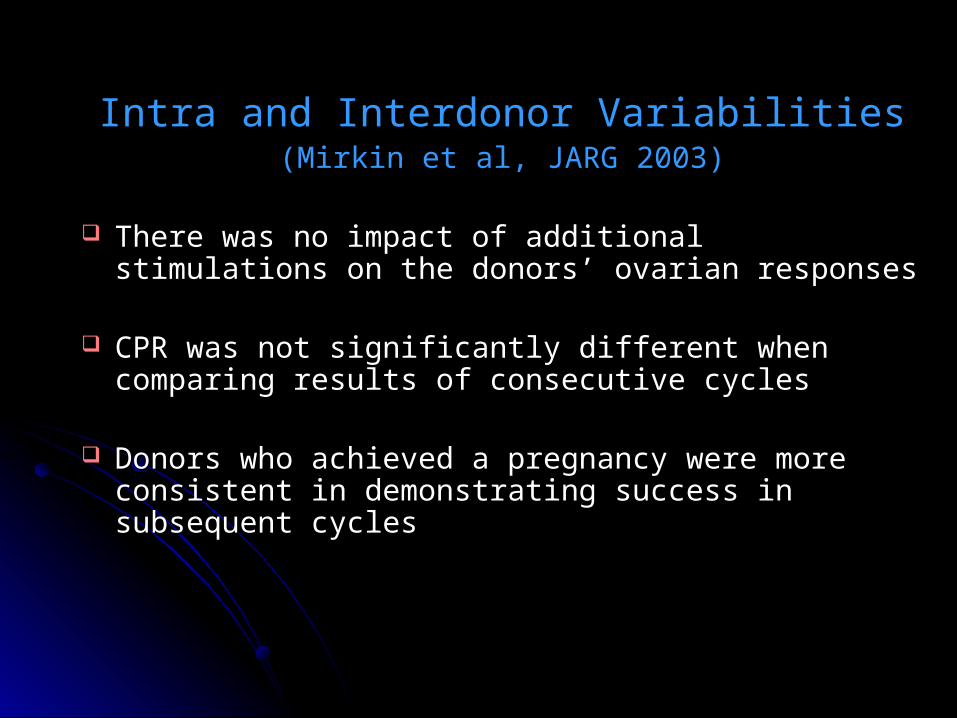
Intra and Interdonor VariabilitiesIntra and Interdonor Variabilities(Mirkin et al, JARG 2003)(Mirkin et al, JARG 2003)
There was no impact of additional stimulations on the There was no impact of additional stimulations on the donors’ ovarian responsesdonors’ ovarian responses
CPR was not significantly different when comparing CPR was not significantly different when comparing results of consecutive cyclesresults of consecutive cycles
Donors who achieved a pregnancy were more consistent Donors who achieved a pregnancy were more consistent in demonstrating success in subsequent cyclesin demonstrating success in subsequent cycles

Cleavage state vs blastocyst ETCleavage state vs blastocyst ETBudak et al, Fertil Steril 2007Budak et al, Fertil Steril 2007
(over 7000 ET cycles)(over 7000 ET cycles)
IR (%)IR (%) PR (%)PR (%) Ongoing PR (%)Ongoing PR (%)
Day 2-3Day 2-3 34.834.8 50.550.5 45.945.9
Day 5-6Day 5-6 49.949.9 63.463.4 58.758.7
*Statistical comparisons were not performed
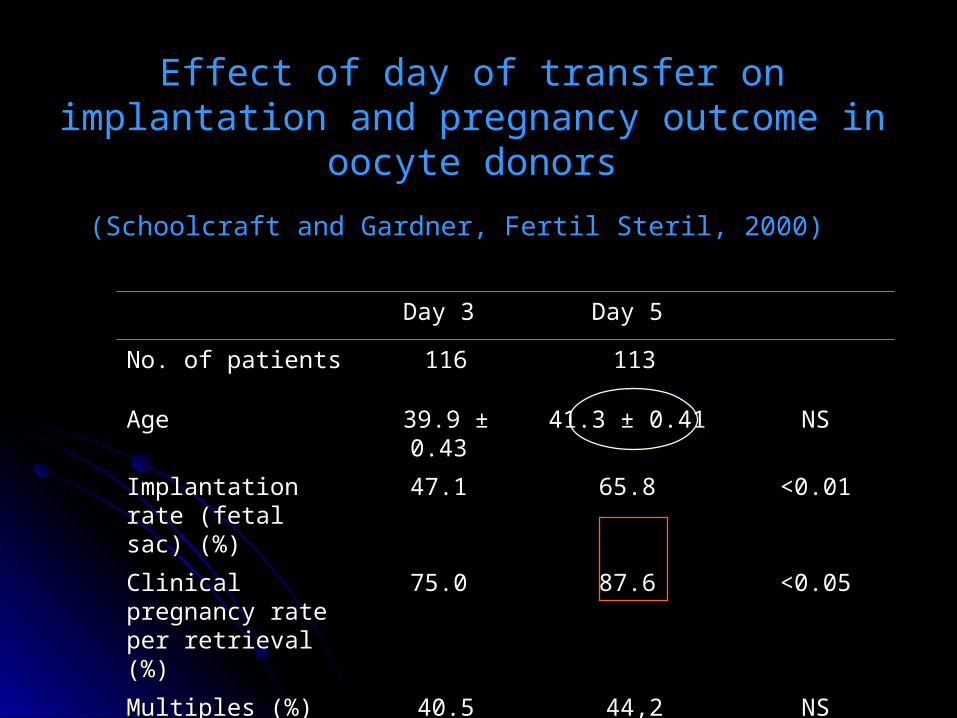
Effect of day of transfer on implantation and Effect of day of transfer on implantation and pregnancy outcome in oocyte donorspregnancy outcome in oocyte donors
(Schoolcraft and Gardner, Fertil Steril, 2000)(Schoolcraft and Gardner, Fertil Steril, 2000)
Day 3 Day 3 Day 5 Day 5
No. of patients No. of patients 116116 113113
Age Age 39.9 ± 0.43 39.9 ± 0.43 41.3 ± 0.41 41.3 ± 0.41 NSNS
Implantation rate Implantation rate (fetal sac) (%) (fetal sac) (%)
47.1 47.1 65.8 65.8 <0.01<0.01
Clinical pregnancy Clinical pregnancy rate per retrieval (%) rate per retrieval (%)
75.0 75.0 87.6 87.6 <0.05<0.05
Multiples (%) Multiples (%) 40.540.5 44,244,2 NSNS
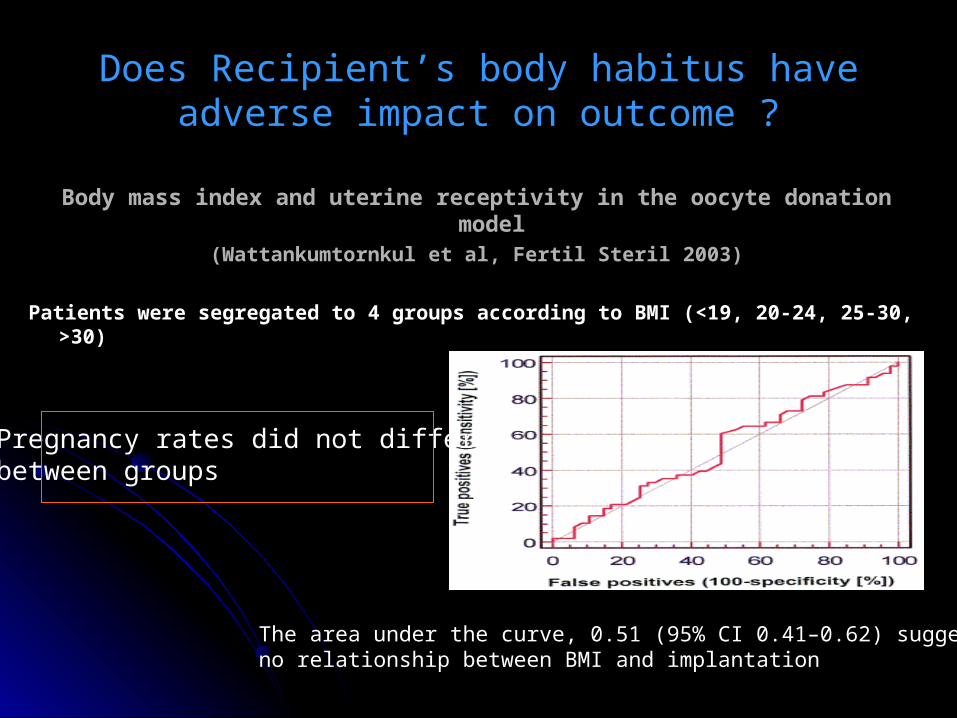
Does Recipient’s body habitus have adverse Does Recipient’s body habitus have adverse impact on outcome ?impact on outcome ?
Body mass index and uterine receptivity in the oocyte donation modelBody mass index and uterine receptivity in the oocyte donation model(Wattankumtornkul et al, Fertil Steril 2003)(Wattankumtornkul et al, Fertil Steril 2003)
Patients were segregated to 4 groups according to BMI (<19, 20-24, 25-30, >30)Patients were segregated to 4 groups according to BMI (<19, 20-24, 25-30, >30)
The area under the curve, 0.51 (95% CI 0.41–0.62) suggests no relationship between BMI and implantation
Pregnancy rates did not differ between groups
ConclusionConclusion
Prognostic factors can differ in oocyte Prognostic factors can differ in oocyte donation programs than homologues IVF donation programs than homologues IVF programsprograms
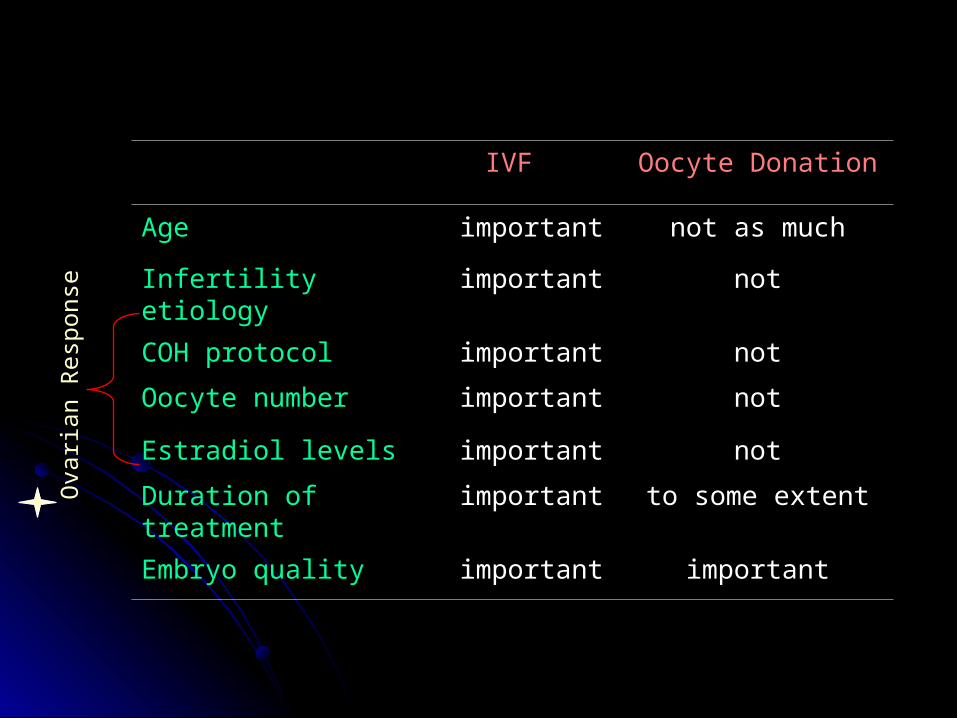
IVFIVF Oocyte DonationOocyte Donation
AgeAge importantimportant not as muchnot as much
Infertility etiologyInfertility etiology importantimportant notnot
COH protocolCOH protocol importantimportant notnot
Oocyte numberOocyte number importantimportant notnot
Estradiol levelsEstradiol levels importantimportant notnot
Duration of treatmentDuration of treatment importantimportant to some extentto some extent
Embryo qualityEmbryo quality importantimportant importantimportant
Ova
rian
Res
pons
e